

Abstract
Multifunctionality refers to the capacity of an area to supply multiple ecosystem functions or services. While many conceptual and methodological advances have focused on defining and quantifying multifunctionality, the challenge of dealing with cross-scale dynamics of multifunctionality remains open. This study proposes a new way of measuring multifunctionality across spatial scales, illustrated with a European-wide dataset of 18 ecosystem services. Our assessment captures not only the diversity of ecosystem services supplied within each municipality (alpha-multifunctionality), but also the unique contribution of each municipality to the regional ecosystem service diversity (beta-multifunctionality). This cross-scale analysis helps better understanding the spatial distribution of ecosystem services, which is required to design management and policies at the right scale. Our analysis shows that alpha-multifunctionality follows a latitudinal gradient across Europe and strongly decreases towards the city centers of metropolitan areas. By relating alpha- and beta-multifunctionality to land use intensity, we show that low-intensity management systems support higher ecosystem multifunctionality across Europe. Municipalities of low alpha-multifunctionality often contribute significantly to regional multifunctionality, by providing ecosystem services of a specific value to the region. Our method to measure both alpha- and beta-multifunctionality thus provides a new way to inform reconciliation of competing land uses when maximizing alpha-multifunctionality is not reasonable.
Export citation and abstract BibTeX RIS

Original content from this work may be used under the terms of the Creative Commons Attribution 3.0 licence. Any further distribution of this work must maintain attribution to the author(s) and the title of the work, journal citation and DOI.
Introduction
The concept of ecosystem multifunctionality emerged from the necessity to manage and use land for various purposes in order to satisfy different human needs and preferences (Wiggering et al 2003, Mander et al 2007). It has recently been embraced by global (IPBES, FAO, OECD, TEEB), European Union (DG AGRI) and national (UK NEA) agricultural and environmental institutions and initiatives, especially to foster rural development (Sumelius and Bäckman 2008, see S1 for a Glossary is available online at stacks.iop.org/ERL/14/124083/mmedia). Central to this concept is the idea that multifunctional landscapes avoid a spatial and temporal segregation of ecosystem functions and processes, in ways that help sustain ecosystems, their biodiversity and functioning in the long term (Brandt and Vejre 2004, de Groot 2006, Bennett et al 2009). Thus, multifunctional landscapes supply multiple ecosystem services, including provisioning (e.g. food production, water extraction), regulating (e.g. air purification, carbon sequestration, pollination) and cultural services (e.g. aesthetics, recreation potential) (Bennett et al 2015, Díaz et al 2015). Assessing multifunctionality as the supply of multiple ecosystem services provided in a given area is hence regarded as a novel and integrated way to study land use in human-dominated landscapes and to reflect on the multiple human benefits derived from nature (Queiroz et al 2015, Rodríguez-Loinaz et al 2015, Stürck and Verburg 2017).
Some of the challenges to assess multifunctionality, such as data limitations and a common understanding of transdisciplinary research approaches, are slowly being addressed (Stürck and Verburg 2017, Manning et al 2018). However, researchers continue to use various methods and indicators that are based on different assumptions (box 1, reviewed in Hölting et al 2019) and the debate about how multifunctionality should be measured is often the main focus of such studies (Mastrangelo et al 2014, Manning et al 2018). Major gaps thus still remain to operationalize multifunctionality in land management (O'Farrell and Anderson 2010, Hansen and Pauleit 2014, Galler et al 2016). Especially the linking of multifunctionality hotspots (i.e. areas with the highest number of ecosystem services supplied) to driving factors in landscape management is a major challenge (Meacham et al 2016), and focus is needed on understanding the effects of management practices on the final bundle of ecosystem services (Nilsson et al 2017).
Box 1. Multifunctionality indicators.
| Ecosystem multifunctionality can be estimated with indicators similar to those of biodiversity (i.e. richness, abundance and diversity). Below, we summarize the main characteristics of these indicators and their application potential. |
| Ecosystem service richness (similar to species richness) uses the number of ecosystem services supplied in a certain area as an indicator for multifunctionality (Willemen et al 2010). Although it is a straightforward and simple way to indicate multifunctionality ('the more the better'), it is entirely dependent on the number of categories reported, regardless of the amount of ecosystem services used. Comparison between areas or time periods would require a standardized inventory method. |
| Ecosystem service abundance (similar to species abundance) is based on the number of ecosystem services supplying a certain quantity. As units strongly differ among ecosystem services, these supplies are typically normalized as proportion of the highest reported supply per ecosystem service. Most studies report averaged (e.g. Mouillot et al 2011) or summed ecosystem service supply values (e.g. Rodríguez-Loinaz et al 2015), as well as the number of ecosystem services exceeding one or more thresholds (Allan et al 2015). While averaging is insensitive to the number of ecosystem services, the sum is very sensitive to it. Also, the balance in supply is not well captured and these indicators can be inflated by increasing supply of a few ecosystem services. Thresholds to define minimum supply values can potentially cope with this, but require a normative and often difficult to justify decision on where these thresholds should be. |
| Ecosystem service diversity (similar to species diversity), combines richness and abundance components. Diversity indicators are calculated using the sum of individual ecosystem service supplies (∼species abundances) proportionally to the total ecosystem supply (∼total abundance), to allow comparison between regions with different categories reported. These indicators furthermore take into account evenness, or the balance between ecosystem service supplies, but differ as they either increase (Simpson Diversity Index, e.g. Raudsepp-Hearne et al 2010) or decrease (Shannon diversity, e.g. Plieninger et al 2013) the weight of the dominant ecosystem services. |
A mix of environmental and socio-economic factors determines the provision and spatial patterns of ecosystem services. A better understanding of those factors could help predicting where and how the supply of ecosystem services could change with certain management decisions (e.g. intensification, de-intensification) or land use changes in time (e.g. urbanization, rewilding). Small-scale case studies have shown the importance of certain driving factors, such as land management intensity (Allan et al 2015, Balzan et al 2018, Le Clec'h et al 2019) or population density (Queiroz et al 2015, Rodríguez-Loinaz et al 2015). However, larger scale assessments of drivers are mostly missing (but see Dittrich et al 2017, Mouchet et al 2017, Stürck and Verburg 2017).
Conclusively, understanding cross-scale spatial variation in multifunctionality is crucial to apply management and decision-making to the most appropriate scale (Felipe-Lucia et al 2014, Le Clec'h et al 2019, Raudsepp-Hearne and Peterson 2016). It might, for example, be important to promote only a few ecosystem services in a particular area, if these ecosystem services are demanded and not supplied across a larger region. Thus, less multifunctional patches might be reasonable, provided that management strategies promote a high level of multifunctionality at the landscape scale (Felipe-Lucia et al 2018). While assessments at multiple spatial scales have been the focus of a few recent multifunctionality studies (e.g. Dick et al 2014, Felipe-Lucia et al 2014, Holt et al 2015, Stürck and Verburg 2017), a discussion of the importance of cross-scale interactions (sensu Scholes et al 2013) is largely missing.
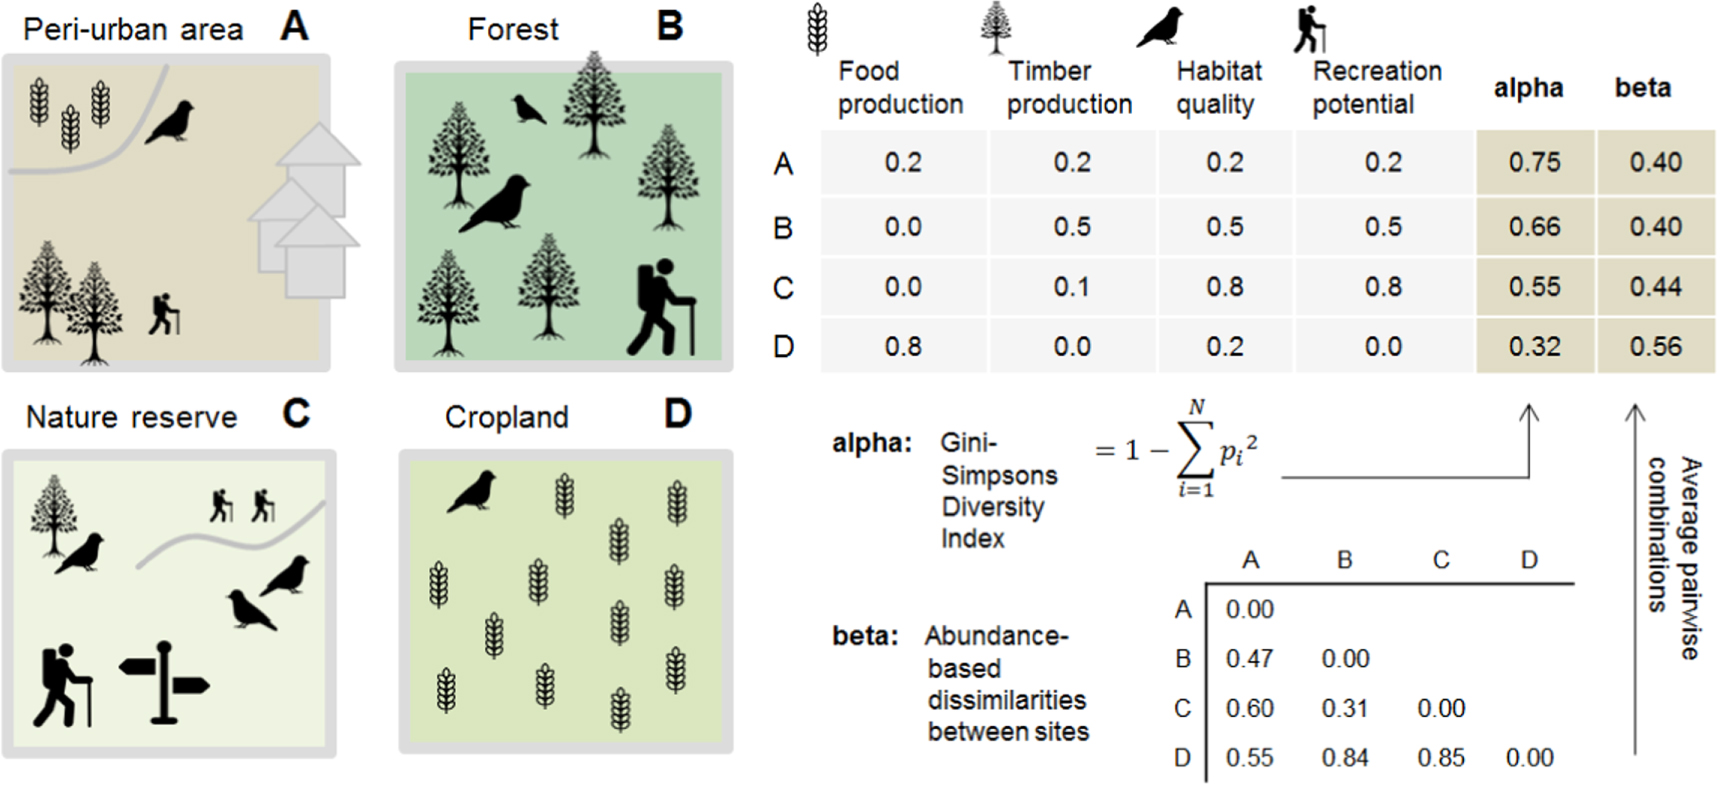
To help address these gaps, we here present a novel methodological approach for assessing ecosystem multifunctionality that goes beyond the assessment of ecosystem service hotspots at defined spatial scales. We assess multifunctionality across scales and account for the unique ecosystem service contributions of municipalities within their regional context. Figure 1 exemplifies our methodological approach: four hypothetical sites are shown, which each supply different amounts of four ecosystem services (food production, timber production, habitat quality and recreation potential). They all belong to the same region. While Site A is the most multifunctional site in terms of ecosystem service diversity (alpha-multifunctionality), Site D contributes most to the regional multifunctionality. This contribution is measured as the unique ecosystem service supply among all four sites (beta-multifunctionality), both in terms of service identity and abundance.

Figure 1. Alpha- and beta-multifunctionality as assessed in this study. The figure shows four sites (A)–(D) within one region that supply different ecosystem services (food and timber production, habitat quality and recreation potential). Site A offers all four ecosystem services and has the highest alpha-multifunctionality, as quantified by the Gini-Simpson Diversity Index (N = total number of ecosystem services considered; pi = the supply of each ecosystem service (i) proportionally to the supply of all ecosystem services in that site; i.e. municipality in our study). Site B and C both supply three services, but site B has a higher alpha-multifunctionality as the Gini-Simpson Diversity Index favors a balanced supply of services. Site D has the lowest alpha-multifunctionality. However, its contribution to the regional service supply is essential, because it is the only site that produces food at high levels. Beta-multifunctionality, calculated as the average dissimilarities between sites (see methods for more details), taking into account service identity and abundance, is therefore highest in site D.
Download figure:
Standard image High-resolution imageOur approach was inspired by van der Plas et al (2016) who assessed how landscape multifunctionality in forest plots across Europe is promoted by plot-scale species richness (alpha-diversity) and turnover between plots (beta-diversity). To demonstrate the usefulness of our approach, we apply it to a large-scale ecosystem service assessment of the European Union and relate ecosystem service diversity at the municipality level to population density and previously defined Land System Archetypes (Levers et al 2018) as potential driving factors. Based on our findings, we discuss the reasons for cross-scale variations of multifunctionality and the implications of this spatial variability for management and decision-making.
Methods
Ecosystem service indicators
We used 18 ecosystem service indicators of the European MAES dataset (Maes et al 2015) to define ecosystem multifunctionality. The indicators build on various reported and modelled ecosystem services, and present either the actual use or the potential supply of ecosystem services across all 28 EU Member States between 2008 and 2011 (table 1, see S2 for a full description of the ecosystem service indicators). Each indicator was mapped to the lower Local Administrative Units (LAU level 2), representing municipalities or equivalent units (Maes et al 2015). The regional level is represented by NUTS3 regions (Nomenclature of Territorial Units for Statistics), which is a standardized and hierarchical geographical system used across EU Member States. For further analyzes, ecosystem service indicators were corrected for the surface area of the municipalities and standardized between 0 and 1 (see S2 for a correlation analysis between the standardized ecosystem service indicators).
Table 1. Ecosystem services quantified in this study, indicators used [units], classification of the indicators (i.e. supply or use) and data source (includes models) (adopted from Maes et al 2015).
| Ecosystem service groups | Ecosystem service indicators [units] | Indicator typea | Data source or Modelsb |
|---|---|---|---|
| Food and feed | 1. Harvested production of food [tonne km−2] | Use | Eurostat |
| 2. Harvested production of fodder [tonne km–2] | Use | Eurostat | |
| 3. Grazing livestock [heads km–2] | Supply | Eurostat | |
| Water | 4. Total water abstraction [m3 km−2] | Use | Eurostat, FAO Aquastat |
| Materials, timber and energy | 5. Harvested production of textile crops [tonne/km2] | Use | Eurostat |
| 6. Total timber removal [m3 km−2] | Use | Eurostat | |
| 7. Timber growing stock [m3 km−2] | Supply | Eurostat | |
| 8. Harvested production of energy crops [tonne km–2] | Use | Eurostat | |
| Erosion control and water regulation | 9. Capacity of ecosystems to avoid soil erosion [0–1] | Supply | ESTIMAP |
| 10. Average soil retention [tonne/yeara ha] | Use | ESTIMAP | |
| 11. Surface area of forest with a protective function [ha km−2] | Supply | Eurostat | |
| 12. Water retention index [0–1] | Supply | ESTIMAP | |
| Pollination | 13. Pollination potential [0–1] | Supply | ESTIMAP |
| 14. Harvested production of pollination dependent crops [tonne km–2] | Use | Eurostat | |
| Maintenance of habitat | 15. Habitat quality [0–1] | Supply | ESTIMAP |
| Soil fertility | 16. Gross nutrient balance [0–1] | Use | Eurostat |
| Climate regulation | 17. Net ecosystem productivity [tonne/yeara km2] | Use | Spot Vegetation, NDVI data |
| Recreation | 18. Recreation potential [0–1] | Supply | ESTIMAP |
aSupply: the potential capacity of a particular ecosystem to provide ecosystem services within a given time period. Use: the actual use of an ecosystem due to ecosystem service demand. (Definitions adapted from Spake et al 2017). bEurostat is the statistical office of the European Union. ESTIMAP is a suite of models that assess ecosystem services at the European scale.
Cross-scale assessment of ecosystem multifunctionality
We assessed multifunctionality using two metrics: (i) alpha-multifunctionality, defined as the diversity of ecosystem service supply at the municipality level; and (ii) beta-multifunctionality, defined as the unique ecosystem service contribution of each municipality to the regional ecosystem service supply. To assess alpha-multifunctionality, we calculated the Gini-Simpson diversity index (formula in figure 1) using the function 'diversity' of the vegan package in R (Oksanen et al 2013). This metric accounts for the number of ecosystem services, their supplies, as well as the balance between them and therefore remediates issues with richness or abundance indicators (box 1; Simpson 1949; see S3 for a comparison of multifunctionality indices). As a result, alpha-multifunctionality indicator does not inflate if a municipality supplies only few, but very high levels of ecosystem services (S3).
Beta-multifunctionality was assessed by evaluating the total abundance-based dissimilarities of ecosystem service supply among all municipalities of one NUTS3 region using the 'beta.pair.abund' function of the betapart package in R (Baselga and Orme 2012). This metric again takes into account both service identity and abundance. The dissimilarity matrices were measured by using the Bray Curtis index:  where i and j are the two municipalities; Si is the summed supply of ecosystem services provided on site i; Sj is the summed supply of ecosystem services provided on site j; Cij is the sum of only the lesser ecosystem service supplies for each ecosystem service found in both sites (Bray and Curtis 1957). The dissimilarity between sites A and B in figure 1 is:

Beta-multifunctionality for each municipality was then calculated as the average dissimilarity between that municipality and all other municipalities within that region. To facilitate comparability, the beta-multifunctionality values within each region were rescaled between 0 and 1, with high values indicating those municipalities with unique services within the region, both in terms of service identity and abundance. Due to this ranking, there are no distinct patterns of beta-multifunctionality beyond the regional borders (figure S3.2). 123 municipalities are LAU2 and NUTS3 units at the same time (e.g. NUTS3 Code 'FR101' = LAU2 Code 'FR75056'), and therefore have no beta-multifunctionality values. In contrast to the original alpha and beta-diversity metrics developed by Whittaker in 1960, alpha and beta as presented in this paper are independent from one another (Whittaker 1960, Jost 2007, Baselga and Orme 2012).
Drivers of multifunctionality
In order to explain the spatial patterns of alpha- and beta-multifunctionality across Europe, we investigated whether alpha- or beta-multifunctionality were correlated to population densities (data source: EEA 2009) using Pearson correlations (see S4 for the results). We also examined the spatial co-occurrence of alpha- and beta-multifunctionality with Europe-wide Land System Archetypes, which are defined as characteristic patterns of land use extent and intensity. Fifteen categories of Land System Archetypes had been mapped at 3*3 km2 resolution by Levers et al (2018) using Self-Organizing Maps (Levers et al 2018, data description in S5). We reclassified alpha- and beta-multifunctionality into nine composite classes by quantiles (see figure 3) and calculated the proportion of each class per Land System Archetype. As these had been mapped only for the EU-27 for the year 2006, this analysis could only be performed for the current European Member States, excluding Croatia.
Land System Archetypes and our multifunctionality metrics are partly based on the same input information (in particular CORINE land cover data), which might lead to problems with circular reasoning, also known as data endogeneity (Kümmerle et al 2013). We therefore conducted a sensitivity analysis by recalculating alpha-multifunctionality using only those ecosystem service indicators that are not based on the same information (see S5) and calculating the proportion of each alpha-multifunctionality class per Land System Archetype. The results revealed almost the same ranking of Land System Archetypes as when using the full dataset, with only minor dissimilarities in the proportions of alpha-multifunctionality classes, suggesting that the results based on the complete set of indicators are robust and non-endogenous (see figure S5.1). In the same way as described above, we also assessed the relation between multifunctionality and Archetypical Change Trajectories (land system change between 1990 and 2006; Levers et al 2018) (see figure S5.2).
Correlations between alpha- and beta-multifunctionality
Pearson correlations between alpha- and beta-multifunctionality within each NUTS3 region were calculated to further explore ecosystem service distributions at the regional scale. Municipalities with unique ecosystem service contributions were identified as outliers of high beta-multifunctionality using correlation plots. The direction of the correlations is positive, if the unique municipalities have a high alpha-multifunctionality, and negative, in case of low alpha-multifuncitonality. Ten case examples were thus selected, representing the NUTS3 regions with the five strongest positive and the five strongest negative correlations between alpha- and beta-multifunctionality (figure 5). NUTS3 regions with four or less municipalities were excluded from this analysis (in total 147 NUTS3 regions, figure S3.2).
All spatial and statistical analyzes were performed using R version 3.4.2 (R Core Team 2013).
Results
Spatial patterns of alpha- and beta-multifunctionality
The diversity of ecosystem services supplied within municipalities, here defined as alpha-multifunctionality, varied throughout Europe following a latitudinal gradient (figure 2). Larger regions of high alpha-multifunctionality were found in the southern parts of Europe, e.g. Portugal, Spain, Southern France (incl. Corse), Italy (incl. Sardinia), Croatia and Greece. Larger regions of low alpha-multifunctionality were observed in the western and eastern parts of Europe (e.g. Ireland, England, Denmark, Poland, Romania or Bulgaria). In addition, notable patterns of alpha-multifunctionality were observed in areas with strong urban-rural gradients across Europe. Alpha-multifunctionality strongly decreased towards the city centers of metropolitan areas, as exemplified for the cities of London and Paris (figure 2). While this was evident for densely populated areas, a general correlation between population density and alpha-multifunctionality across the whole study region was not apparent (S4).

Figure 2. Alpha-multifunctionality, measured as the diversity of ecosystem services based on the Gini-Simpson Diversity Index (LAU2 level). The different colors depict the variation in alpha-multifunctionality, which is divided into ten quantiles. The right side of the figure shows a zoom in on the map for the metropolitan areas of London and Paris.
Download figure:
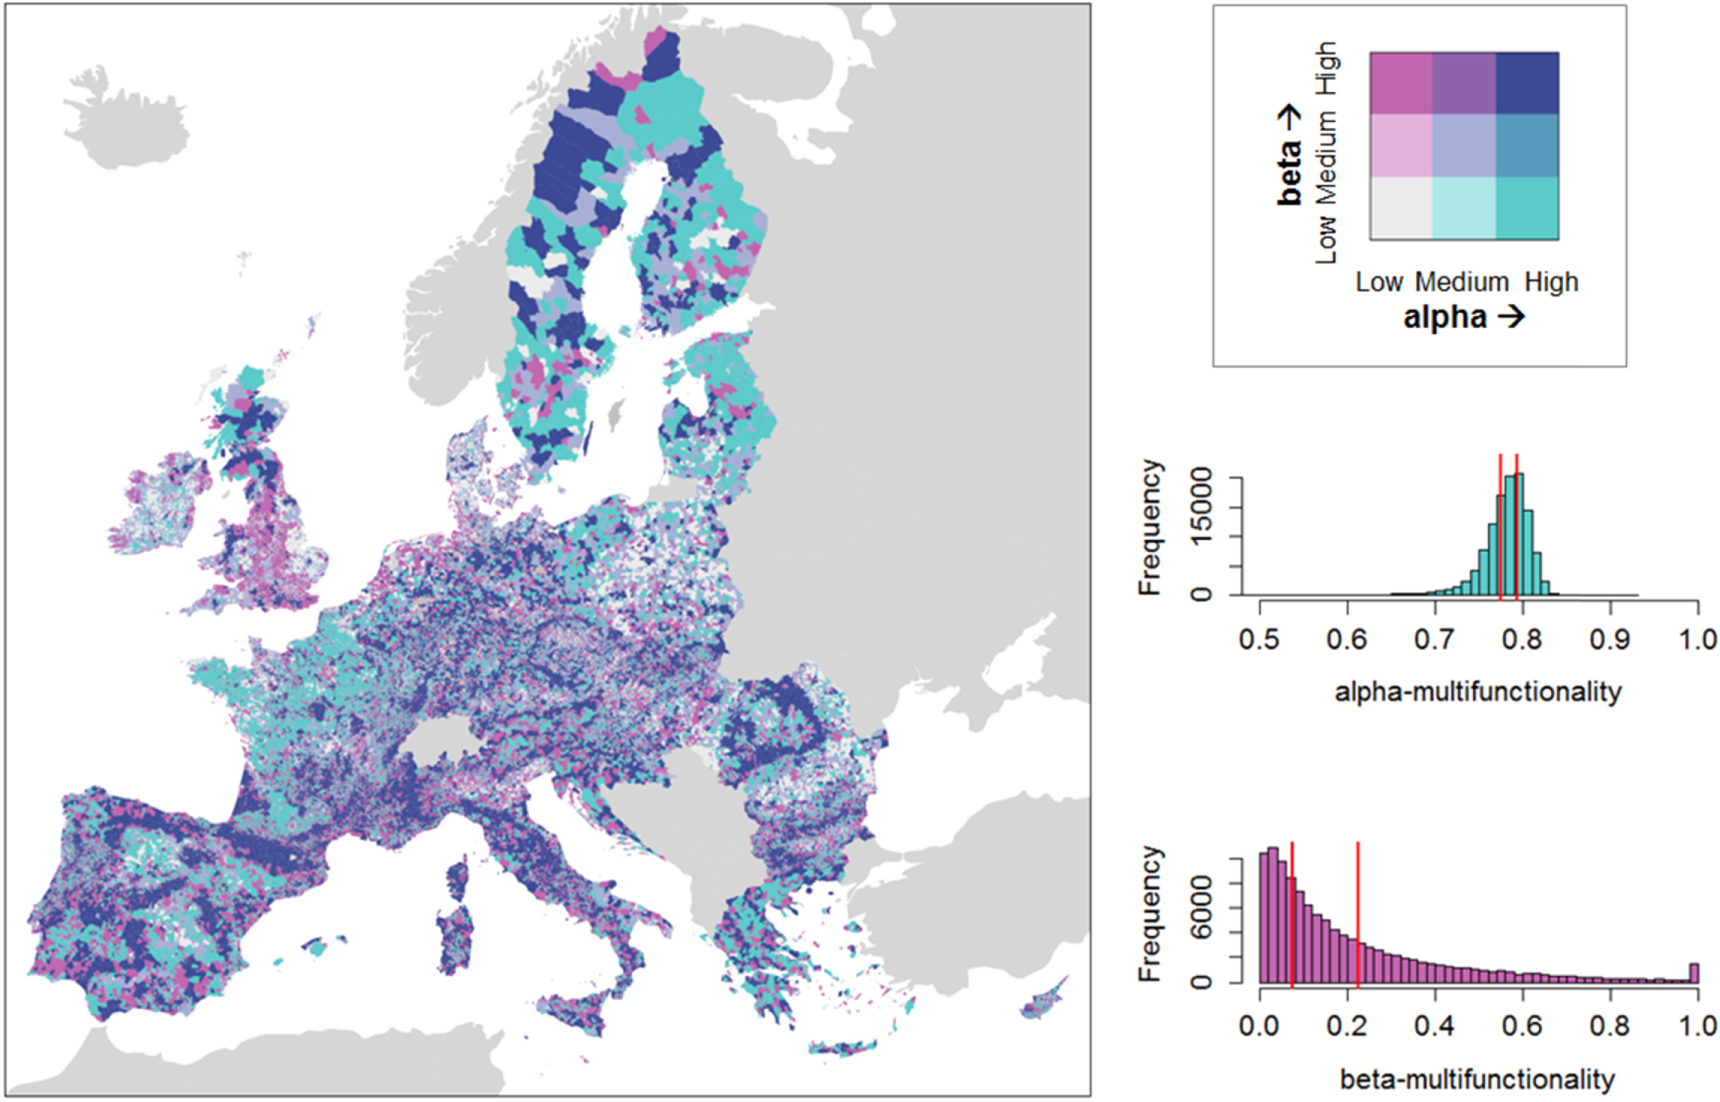
Standard image High-resolution imageAs beta-multifunctionality is defined and calculated with reference to each specific NUTS3 region, no clear continuous pattern can be observed across Europe, except for some mountainous regions (e.g. Pyrenees, Carpathians; figure S3.2). Moreover, we found no correlation between population densities and beta-multifunctionality (figure S4.1). The bivariate map (figure 3) provides a composite mapping of both alpha- and beta-multifunctionality, which allows for identification of particular patterns of the diversity and uniqueness of ecosystem service supplies at the municipality level. Some regions which had been identified as highly multifunctional in the alpha-multifunctional map (e.g. Greece), displayed low beta-multifunctionality. Other regions of low alpha-multifunctionality, displayed a high level of beta-multifunctionality (e.g. England). Distinctive combinations of alpha- and beta-multifunctionality and example regions are shown in table 2.

Figure 3. Bivariate map of alpha- and beta-multifunctionality based on quantiles (class intervals of alpha: [0–0.774], [0.775–0.793], [0.794–0.923]; class intervals of beta: [0–0.076], [0.077–0.226], [0.227–1]). On the right side of the figure, the frequency distributions of alpha- and beta-multifunctionality are shown with red lines indicating the class intervals.
Download figure:
Standard image High-resolution imageTable 2. Distinctive combinations of alpha- and beta-multifunctionality, values, description and example regions.
| Alpha, Beta | Values | Description | Example regions |
|---|---|---|---|
| High alpha, high beta | a > 0.793, b > 0.226 | Highly diverse and unique | Pyrenees, Carpathians |
| High alpha, low beta | a > 0.793, b < 0.076 | Highly diverse but not unique | Northern Finland, Bretagne |
| Low alpha, high beta | a < 0.774, b > 0.226 | Less diverse but unique | England, Northern Italy |
| Low alpha, low beta | a < 0.774, b < 0.076 | Less diverse and not unique | Poland, Romania, Spanish Plateau, East of England, Denmark |
Links between ecosystem multifunctionality and Land System Archetypes
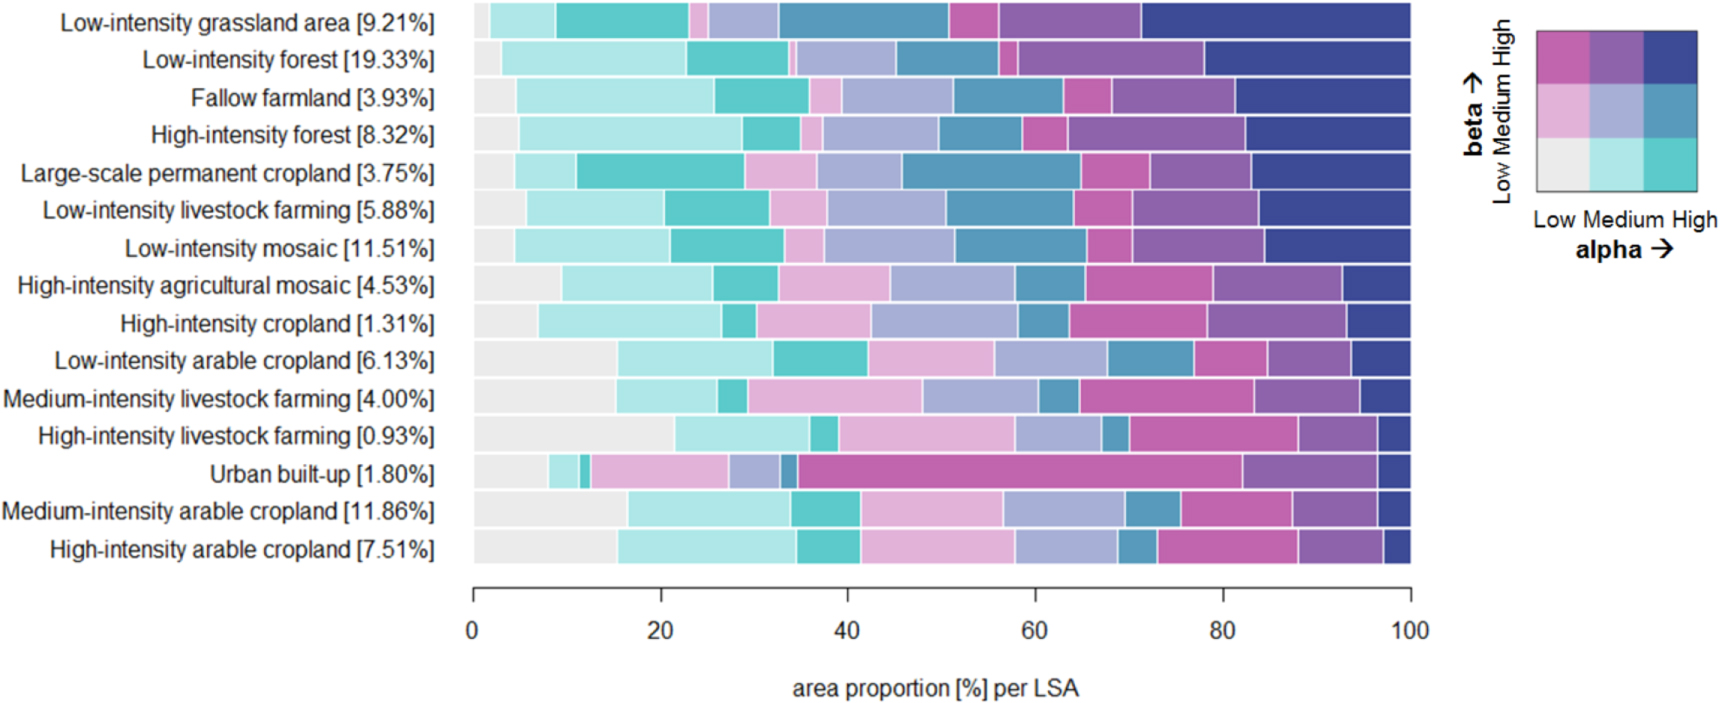
The overlap analysis with Land System Archetypes showed that areas with high alpha- and beta-multifunctionality generally coincided with low-intensity management systems, including fallow farmland and permanent cropland, with the exception of high-intensity forest (figure 4). Coldspots of both alpha- and beta-multifunctionality, on the other hand, coincided with medium- to high-intensity management systems. Urban built-up areas generally had a low degree of alpha-multifunctionality, while a large proportion of this land use category was characterized by high beta-multifunctionality.

Figure 4. Proportion of the composite alpha- and beta-multifunctionality classes (based on quantiles as in figure 3) within each of the 15 land system archetypes. Each bar represents one land system archetype category with the area share across the entire EU-27 (without Croatia) in brackets. Dark blue bars depict combined hotspots of alpha- and beta-multifunctionality. The same color scheme was used as in figure 3.
Download figure:
Standard image High-resolution imageBy comparing alpha- and beta-multifunctionality to the Archetypical Change Trajectories we found hotspots of alpha- and beta-multifunctionality primarily within the trajectories representing major land use conversions (e.g. forest expansion on grassland, loss of permanent cropland, deforestation resulting from agricultural expansion) rather than within trajectories representing changes along intensity gradients (e.g. intensification or extensification of the same land use systems) (figure S5.2). In addition, we identified the largest proportion of coldspots of alpha-multifunctionality in regions characterized by 'Intensification to high-intensity cropland', 'Urban expansion', and 'De-intensification of high-intensity livestock farming' (figure S.5.2).
Identifying and characterizing unique municipalities
The correlations between alpha- and beta-multifunctionality within each NUTS3 region were negative for 801 NUTS3 regions (with 297 significant correlations: p < 0.005) and positive for 377 NUTS3 regions (with 75 significant correlations: p < 0.005). Figure 5 shows the ten case examples with the five strongest negative (upper part of figure 5) and the five strongest positive correlations (lower part of figure 5), each presenting one NUTS3 region. Within the example regions, there were up to three municipalities identified as unique municipalities driving the correlation between alpha- and beta-multifunctionality.

Figure 5. Identification of unique municipalities: correlations between alpha- and beta-multifunctionality within the ten NUTS3 regions that showed the strongest negative (upper row) or positive (lower row) correlations. Example regions were located in Germany, Finland, Belgium, Sweden, England and Greece. The number of municipalities per case example ranged from 5 to 19 (each represented by a data point). R-values represent the Pearson's correlation coefficient. P-values represent the probability values that indicate whether the correlation coefficients are significantly different from zero.
Download figure:
Standard image High-resolution image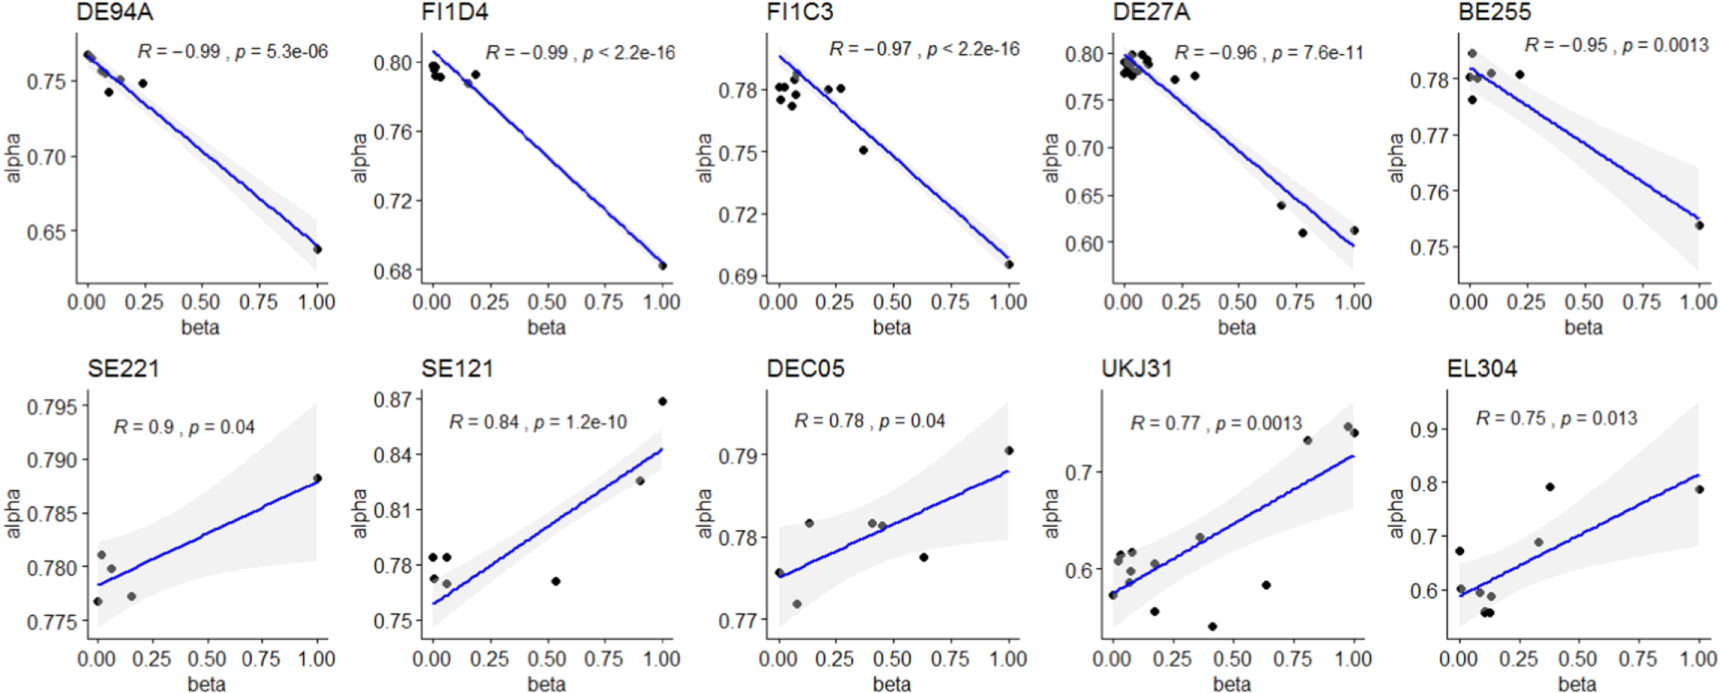
In regions with a negative correlation (figure 5, upper row), unique municipalities are characterized by a low alpha-multifunctionality. They have a more specialized, narrow ecosystem service supply than other municipalities within the same region: the unique municipalities within the two Finish (FI1C3, FI1D4) and one of the German (DE27A) regions supply high levels of provisioning services in otherwise mostly rural and recreational areas; the municipality of Oostende in the Belgian case region (BE255) provides high levels of water abstraction; the unique municipality in the German case region of Wangerooge (DE94A) has the highest recreation potential and represents the part of the region with the highest share of Natura 2000 protected area.
In regions with a positive correlation (figure 5, lower row), unique municipalities are characterized by a high alpha-multifunctionality. They do not have a particularly specialized, but a generalized ecosystem service supply: Most municipalities in the Swedish and the German case regions (SE221, SE121, DEC05) lack a sufficient supply of provisioning services. Those municipalities that do supply timber and other provisioning services were here identified as unique. In the densely populated regions of Southern Athens (EL304) and Portsmouth (UKJ31), there is a lack of many ecosystem services in all municipalities (e.g. food and fodder, timber growing stock, pollination, soil retention) except for those municipalities that are less populated, here characterized by a high beta-multifunctionality.
Discussion
This is the first study to derive continuous maps of alpha- and beta-multifunctionality across Europe, connecting these to land use intensity as a key driver of ecosystem multifunctionality and thereby deriving unique insights on how ecosystem services are distributed across landscapes. While first efforts to assess alpha- and beta-multifunctionality have applied a threshold-based approach (i.e. number of ecosystem services passing a certain threshold; van der Plas et al 2016) our approach takes into account the identity of ecosystem services. Instead of aggregating all ecosystem services within one metric only, we can now not only identify areas of particularly high multifunctionality (alpha-multifunctionality) but also areas of unique ecosystem services (beta-multifunctionality). In the following, we provide recommendations on how to broaden our current perspective of landscape multifunctionality and outline directions for future research.
Patterns and drivers of alpha- and beta-multifunctionality
In line with previous studies (Mouchet et al 2017, Stürck and Verburg 2017), our results demonstrate that the diversity of ecosystem service supplies varies largely across Europe, following climatic and topographic gradients (see figure 2: south–north gradient, mountainous areas versus lowlands). Many ecosystem services (e.g. food and fodder productions, carbon sequestration, net ecosystem productivity) follow a latitudinal gradient as they are largely influenced by the number of growing degree days (Haberman and Bennett 2019) and primary production (Mouchet et al 2017). Increased levels of alpha-multifunctionality are further apparent in mountainous areas due to increased levels of biodiversity and landscape heterogeneity (Grêt-Regamey et al 2012, Crouzat et al 2015), formerly identified as important drivers (Soliveres et al 2016, Birkhofer et al 2018). While such non-anthropogenic factors drive the potential capacity of an area to supply ecosystem services, their actual supply is directly influenced by human land use and management. In this study, we therefore focused on two anthropogenic driving factors: population density (as a proxy that reflects the overall human influence on land and its natural capital) and land use intensity.
While population density could not explain patterns of alpha- or beta-multifunctionality across Europe, it still was a relevant driving factor in highly populated metropolitan areas (see the case of London or Paris). In these examples, the capacity to supply multiple ecosystem services decreased with increasing population densities. A recent study by Haberman and Bennett (2019) yielded very similar findings for metropolitan areas worldwide, confirming that population densities are crucially influencing the supply of ecosystem services. In most cases, only the hinterlands of densely populated areas are capable of producing a high diversity of ecosystem services (see the case of Southern Athens and Portsmouth; Haberman and Bennett 2019). Our results on the spatial co-occurrence of multifunctionality and Land System Archetypes characterized urban areas as coldspots of alpha-multifunctionality across Europe. Nevertheless, most urban areas contributed importantly to the regional multifunctionality by supplying ecosystem services that are unique in these regions (e.g. water abstraction, see BE255). Our results further clearly confirmed the findings of local-scale studies (Allan et al 2015, Queiroz et al 2015, Rodríguez-Loinaz et al 2015, Balzan et al 2018, Le Clec'h et al 2019) that low-intensity management systems support higher ecosystem multifunctionality, also on the continental scale. Regions of high land use intensity are often managed to maximize a specific set of ecosystem services only. However, such areas often contribute importantly to regional multifunctionality, by providing unique services (e.g. food and fodder in a rural area; see FI1C3, FI1D4, DE27A).
Key insights when assessing multifunctionality across scales
We propose a new approach to assess multifunctionality across spatial scales that goes beyond the scope of standard multifunctionality assessments on a single scale. The approach allows identifying areas that provide ecosystem services, which are unique on a larger scale. Until now, multifunctionality assessments often have implied that more diverse or abundant supplies of ecosystem services are 'good per se' and a generally desired management aim. However, there are inherent limits to ecosystem multifunctionality and not all ecosystem services can be maximized at all scales (Turkelboom et al 2018). Consequently, we have to better understand where and at which scale multifunctionality is actually needed (Fischer et al 2017, Turkelboom et al 2018, Plieninger et al 2019). While some ecosystem services are important at all scales (e.g. air quality), other services are primarily demanded and valued at a specific scale where the demand is particularly high (e.g. food production in a densely populated area, flood regulation in a city nearby a river) (Fisher et al 2009, Raudsepp-Hearne and Peterson 2016).
Ecosystem services that are unique within a larger area might therefore have a higher value to society than abundant ecosystem services. In this way less diverse, but specialized municipalities might be undervalued if they are not viewed within a larger spatial context. Our new indicator of beta-multifunctionality evaluates the 'uniqueness' of services supplied by municipalities on a regional scale. We argue that, in order to actually increase the benefits that people derive from nature, the promotion of ecosystem multifunctionality (i.e. the diversity or richness of ecosystem services) should be complemented by the reflection of the actual values of the particular area to society. In this context, uniqueness is an important indicator when analyzing the demand for ecosystem services (Quintas-Soriano et al 2019).
Choosing the scales
Our proposed approach can be applied at any spatial scale. We have chosen the municipality versus regional scale, because landscapes have traditionally been shaped by human land use at the municipality level (Vos and Meekes 1999, Reyers et al 2013). Municipalities are therefore expected to supply a distinct set of ecosystem services and are often regarded as the relevant spatial units to assess the amounts and interactions of ecosystem services (Raudsepp-Hearne et al 2010, Queiroz et al 2015, Rodríguez-Loinaz et al 2015). Many policies target—or are implemented by—municipal decision structures (e.g. responsibilities for regulating land use, management of drinking water, maintenance of restoration infrastructures, regulation of tourism operations; Raudsepp-Hearne and Peterson 2016). Moreover, municipalities within one region are not isolated, but important ecosystem service flows (defined as spatial movements of ecosystem-derived material, energy and information; Schröter et al 2018) exist between municipalities on the regional scale (Spake et al 2017). Finally, fostering socio-ecological resilience requires increasing multifunctionality for a diverse set of stakeholders (e.g. recreationists, rural population, farmers and other land managers, environmental organizations, municipal administration), which come together at regional scale (Howe et al 2014, Holt et al 2015, Turkelboom et al 2018).
Choosing spatial scales always creates strong boundaries. Future research on multifunctionality should therefore apply this method at other spatial scales (e.g. focus on unique regions at national scale), depending on the ecosystem services considered and the research questions at stake. In a similar reasoning, alpha- and beta-multifunctionality might be applied to assess regional versus national multifunctionality, or even parcel versus municipality multifunctionality. This choice will ultimately be guided by the policy application of interest, or the specific management goal (Holt et al 2016, Raudsepp-Hearne and Peterson 2016). If an analysis would for instance be performed to inform national fiscal redistribution over municipalities, a municipality versus nation scale is the relevant scale. Likewise, if an analysis would be performed to demonstrate how multifunctional mountainous areas contribute to downstream or lowland areas (Grêt-Regamey et al 2012), non-administrative scales, such as transboundary watersheds, could be chosen.
Implications for management and decision-making
Land management options to increase ecosystem multifunctionality are evident: we need to adapt to low-intensity management systems that are capable of supplying a more diverse set of ecosystem services. Our findings clearly point in this direction and confirm the results of numerous local studies (e.g. Allan et al 2015, Queiroz et al 2015, Rodríguez-Loinaz et al 2015, Balzan et al 2018, Le Clec'h et al 2019). However, in order to avoid scale mismatches (defined as problems that occur when the scale of environmental variation and the scale of use or management of ecosystem services are not aligned; Raudsepp-Hearne and Peterson 2016) and to design policies at the right scale, we need to better understand (i) the varying capacities of landscapes to supply certain services (as well as inherent limits to multifunctionality) and (ii) the varying importance of ecosystem services for different areas and scales (as explained above).
While sustainable management aims at promoting as many ecosystem services as possible and in large amounts, this might not always be possible at the local scale. Ecosystems have varying capacities to supply ecosystem services, and trade-offs exist that are inherent to the system (Felipe-Lucia et al 2018), such as those between organic matter turnover and soil carbon stocks (Lavorel et al 2017), or timber production and habitat quality (Felipe-Lucia et al 2014). If the supply of multiple services within one area cannot be maximized at a single time (Holt et al 2016, Cord et al 2017, Turkelboom et al 2018), achieving multifunctionality at the landscape scale (i.e. high beta-multifunctionality) would be the goal. However, the fact that multifunctionality can be purposefully maximized at the landscape scale should not justify reducing multifunctionality at the local scale. Some ecosystem services cannot be replaced by a supply of this service elsewhere, especially regulating ecosystem services (e.g. flood regulation, air quality) (Fisher et al 2009, Raudsepp-Hearne and Peterson 2016). Beta-multifunctionality can hence be seen as a way to accommodate competing land uses when maximum alpha-multifunctionality is not possible.
Concluding remarks
Our findings highlight that we need to adapt our land management systems in accordance with the capacity of the land to supply ecosystem services, if aiming for increased ecosystem multifunctionality. Especially, low-intensity land use systems are of key importance for maintaining multiple ecosystem services at regional scales and deserve special consideration in planning and decision-making. Instead of aggregating all ecosystem services in one metric at one scale, the uniqueness of ecosystem contributions by small areas to larger regions needs to be considered. Ecosystem service studies up until now have largely missed to evaluate multifunctionality as a diverse yet balanced ecosystem service supply across scales. Our approach advances the field of multifunctionality indicators and ecosystem services in this regard.
Acknowledgments
We acknowledge funding from the Helmholtz Association (Research School ESCALATE, VH-KO-613, LH). The discussions at the PECS (Program on Ecosystem Change and Society, http://pecs-science.org/) workshop 'Ecosystem service trade-offs and synergies', hosted by the Stockholm Resilience Centre in October 2016, were essential to initiate the ideas leading to this paper. We would like to thank Ralf Seppelt whose comments on an earlier version have helped further shaping the manuscript. We would very much like to thank Christian Levers for providing the data on land use system archetypes, as well as helpful comments on the manuscript. Finally, we would like to thank the two anonymous reviewers for their valuable comments.
Data availability
The data that support the findings of this study are currently available at DOI (10.25412/iop.10500872.v1). A spatial data infrastructure (SDI) of the UFZ is in preparation, where the data will be made openly available within 12 months from the date of publication.