

Abstract
The ability to perform dose recalculation on the anatomy of the day is important in the context of adaptive proton therapy. The objective of this study was to investigate the use of deformable image registration (DIR) and cone beam CT (CBCT) imaging to generate the daily stopping power distribution of the patient. We investigated the deformation of the planning CT scan (pCT) onto daily CBCT images to generate a virtual CT (vCT) using a deformable phantom designed for the head and neck (H & N) region.
The phantom was imaged at a planning CT scanner in planning configuration, yielding a pCT and in deformed, treatment day configuration, yielding a reference CT (refCT). The treatment day configuration was additionally scanned at a CBCT scanner. A Morphons DIR algorithm was used to generate a vCT. The accuracy of the vCT was evaluated by comparison to the refCT in terms of corresponding features as identified by an adaptive scale invariant feature transform (aSIFT) algorithm. Additionally, the vCT CT numbers were compared to those of the refCT using both profiles and regions of interest and the volumes and overlap (DICE coefficients) of various phantom structures were compared. The water equivalent thickness (WET) of the vCT, refCT and pCT were also compared to evaluate proton range differences. Proton dose distributions from the same initial fluence were calculated on the refCT, vCT and pCT and compared in terms of proton range. The method was tested on a clinical dataset using a replanning CT scan acquired close in time to a CBCT scan as reference using the WET evaluation.
Results from the aSIFT investigation suggest a deformation accuracy of 2–3 mm. The use of the Morphon algorithm did not distort CT number intensity in uniform regions and WET differences between vCT and refCT were of the order of 2% of the proton range. This result was confirmed by proton dose calculations. The patient results were consistent with phantom observations. In conclusion, our phantom study suggests the vCT approach is adequate for proton dose recalculation on the basis of CBCT imaging.
Export citation and abstract BibTeX RIS
1. Introduction
The treatment of head and neck (H & N) cancer has been shown to benefit from increased dose conformity and healthy tissue sparing from intensity modulated photon therapy (IMRT) in terms of reduction of radiation therapy toxicity (Kam et al 2007). This suggests that proton therapy, with its superior dose conformity, may be of benefit to patients undergoing radiation therapy for H & N lesions. This is supported by intensity modulated proton therapy (IMPT) planning studies reporting improved sparing of organs at risk compared to IMRT (Simone et al 2011, van de Water et al 2011).
However, the increased conformity of IMPT may come at the cost of higher sensitivity to treatment uncertainties, as accurately positioning the Bragg peak is dependent on the accuracy of the computed tomography (CT) derived 3D stopping power map of the patient. The significant volumetric changes observed during fractionated radiation therapy of H & N cancer (Barker et al 2004) alongside positioning uncertainties have led investigators to recommend repeated CT scanning for dose recalculation during IMRT (Wang et al 2010) and more recently for IMPT (Kraan et al 2013). This entails a heavier workload at the CT scanner, additional appointments for the patient and may not capture patient positioning differences between the CT and treatment couches. The use of a CT-on-rail, investigated in the context of passively scattered proton therapy of the prostate (Trofimov et al 2011), would offer the optimal data for dose recalculation, although such installations are not common and increase the complexity of the delivery procedure.
The use of cone beam CT (CBCT) imaging at the treatment couch, which is considered for proton therapy setup corrections (Park et al 2009) and currently being introduced by vendors in their products, provides a simpler image acquisition alternative. However CBCT images are of lower quality than those from CT (Stock et al 2009); one major issue is that the relation between CT and CBCT image intensities varies across the field of view (FOV). For example CBCT soft tissue intensities in the upper thorax area are lower than in the neck area. While for photon therapy it may be possible to perform CT number to electron density calibration and achieve acceptable dose calculation accuracy for uncorrected CBCT images (Yang et al 2007), this has not been demonstrated for protons where CBCT intensity correction to match CT image intensities is most likely required. Preliminary studies have investigated CT number correction for CBCT images (Bentefour et al 2010). It may be possible to obtain accurate stopping power estimates by performing deformable image registration (DIR) between the planning CT and CBCT. This has been explored by several groups in the context of adaptive photon therapy for photon dose recalculation and automatic contour propagation (Zhang et al 2007, Wu et al 2009, Peroni et al 2012, Zhen et al 2012, van Kranen et al 2013, Veiga et al 2014). To the best of our knowledge, CT to CBCT DIR has not been thoroughly evaluated in the context of H & N proton therapy.
The objective of this work was to perform a phantom study to evaluate CT to CBCT DIR to yield accurate stopping power maps corresponding to the anatomy at treatment time. The use of DIR in this context may be used for two purposes. The first and more straightforward approach consists of providing a tool for clinical decision making by evaluation of the dose distribution of the day. The second approach, which is more complex and demanding of the DIR, consists of accumulating the dose of the day onto the planning CT anatomy. This work targets the first approach, as the evaluation of dose accumulation based on the vector fields obtained from DIR was deemed outside the scope of this study. We investigated DIR in terms of geometrical and CT number accuracy as well as dosimetric accuracy using a deformable phantom designed specifically for H & N anatomical changes. This phantom study has the advantage of providing ground truth against which to compare deformation results. We focused specifically on anatomical changes and for this reason, in this study, translational positioning errors were minimized by rigid registration. In addition to the thorough phantom study, we also present a first application of our method to a real H & N clinical case exhibiting anatomical changes.
2. Materials and methods
2.1. Phantom
A phantom specific to H & N deformations was built for this study. The phantom was designed to simulate the main deformations observed in H & N patients: weight loss, neck tilt in the anterior–posterior direction and variation of airway diameter due either to tumor volume changes or differences in the patient's position between planning CT and CBCT. The phantom, mainly consisting of PMMA, is presented in figure 1 and its components are described in table 1. The two non-PMMA materials, muscle and vertebral column were from CIRS (CIRS Inc, Norfolk, VA). We observed that in patient CT scans, the vertebral column had a CT number distribution centered at 650 HU and the vertebral column material was chosen to approximate this. The phantom was scanned at a planning CT (Toshiba Aquilion 16 LB, Toshiba Medical Systems, the Netherlands) using the clinical protocol for H & N patients in the planning configuration (no neck tilt, 14.4 cm diameter, airway diameter of 3 cm, figure 1(a)) and in treatment day configuration (2.5 degree neck tilt, 13 cm diameter and airway diameter of 2.4 cm, figure 1(b)). Images were reconstructed with 3 mm slice thickness and 1.074 mm voxel size in the axial plane. While registration results could potentially be improved by reconstructing images with thinner slices (1 or 2 mm), we used 3 mm to be consistent with patient data on which the method is to be applied.
Table 1. Characteristics of the phantom components. The muscle and solid bone inserts are from CIRS (CIRS Inc, Norfolk, VA). The CT numbers reported here are estimated from the planning CT scan using a circular region of interest in a single slice.
| component | material | CT number (HU) |
|---|---|---|
| phantom body | PMMA | 120 ± 5 |
| fat ring | PMMA | 120 ± 5 |
| muscle insert | Muscle 062A-27 | 53 ± 5 |
| vertebral column | Solid bone (400 mg HA−1) | 590 ± 6 |
| Airway | air | −1048 ± 6 |
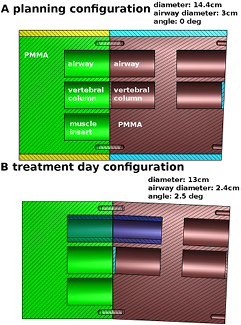
Figure 1. (a) Planning configuration: PMMA deformable phantom modeling H & N anatomical changes. All cavities are 3 cm in diameter and accommodate 5 cm long inserts. The phantom diameter as shown is 14.4 cm. The central channels contain vertebral column mimicking inserts, the top channels are kept empty to represent airways and the lower channel contains a muscle mimicking insert for soft tissue contrast. (b) Treatment day configuration: weight loss is modeled by the removal of the yellow and light blue sleeves, reducing the diameter to 13 cm. 2.5° neck tilt is modeled by reversing the red right half of the phantom. Airway diameter variation is modeled by inserting a thin sleeve (dark blue) in both airway channels, reducing the diameter from 3 to 2.4 cm. Two PMMA spacers, one for each angle configuration, are used between the two vertebral column inserts.
Download figure:
Standard image High-resolution imageThe phantom was subsequently scanned using the on-board CBCT imager of an Elekta Synergy Linac equipped with XVI R4.5 (Elekta, Sweden) in treatment day configuration and reconstructed with 1 mm isotropic voxel size. We made use of the cinical protocol for H & N patients, using 18.3 mAs at 100 kV with CTDIvol of 0.6 mGy. No beam shaping filter was used and the S20 collimation was employed.
The treatment day CT scan (refCT) served as ground truth for deformation evaluation. The phantom modification causing the largest volume change from the planning to the treatment day configuration was the removal of the outer ring to reduce the phantom diameter. To assess whether our validation was sensitive to the two other anatomy changes investigated, we included two additional configurations: airway diameter modification only and phantom angle modification only. Table 2 summarizes all the configurations. While tests were performed for each configuration, in this paper we focus on configuration 3 as it represents the combination of all effects.
Table 2. Phantom configurations studied in this study. Configuration 3 is the one presented in figure 1(b).
| configuration | anatomical change modelled |
|---|---|
| 1 | airway diameter reduction |
| 2 | neck tilt |
| 3 | Airway diameter reduction, neck tilt and weight loss |
2.2. Registration
The REGGUI DIR package was employed to perform 3D image registration between planning CT (pCT) and CBCT images (Janssens et al 2011) using an automated workflow. This tool was previously evaluated in the context of dose accumulation based on MV CBCT images (Janssens et al 2009). When performing DIR with REGGUI, images are required to be in the same coordinate system and have the same grid spacing. In this work we opted for the CBCT coordinate system and grid spacing as the CBCT has a higher information density than the pCT. A rigid registration limited to translations was employed to align the pCT to the CBCT based on the sum of the squared intensity differences. Rotations were not permitted to replicate the limited degrees of freedom of clinical alignment procedures. As a result of rigid registration in REGGUI, the pCT (1.074 × 1.074 × 3 mm) was resampled to the CBCT image grid (1 × 1 × 1 mm) using linear interpolation. DIR of the resampled pCT to the CBCT was subsequently performed using the REGGUI implementation of the Morphons algorithm (Knutsson and Andersson 2005, Wrangsjo et al 2005) using 8 scales with 10 iterations for the 6 coarsest scales and 2 iterations for the last two higher resolution scales (the highest resolution is the CT resolution). Accumulation of the deformation field at each scale was performed with a Gaussian regularization filter with a standard deviation of 1.5 voxels. The Morphons algorithm is suitable for CT to CBCT DIR as it is based on a local phase metric and is thus insensitive to intensity differences between the pCT and CBCT. The procedure yielded a deformed pCT in the coordinate system and grid spacing of the CBCT. We called this image the virtual CT, as in Peroni et al (Peroni et al 2012). As this image is in the CBCT coordinate system, we add the CBCT subscript (vCTCBCT). In general, images in the CBCT coordinate system and grid spacing have the CBCT subscript in this paper. The corresponding refCT was aligned with the CBCT and resampled to the CBCT grid spacing as well using a rigid registration, this time allowing for rotations, yielding the refCTCBCT, for direct evaluation of the vCTCBCT. Rotations were allowed to achieve an optimal reference image.
The vector field resulting from the Morphons DIR was in the coordinate system and grid spacing of the CBCT. To apply it to the original pCT we transferred the vector field to the pCT coordinate system using the inverse of the rigid translation registration and resampled it to the original pCT grid by linearly interpolating the components of the deformation vectors. Applying this vector field to the original pCT yielded a virtual CT in the coordinate system and grid spacing of the pCT (vCTpCT). In general in this paper, images in the pCT coordinate system and grid spacing have the pCT subscript. The vCTpCT can be used interchangeably with the pCTpCT to evaluate the dosimetric impact of anatomical changes by recalculating the dose distribution of a plan. To evaluate the vCTpCT the refCT was also rigidly aligned to it, allowing rotations, yielding a refCTpCT.
2.3. Scale invariant feature transform evaluation
The scale invariant feature transform (SIFT) (Lowe 1999, Lowe 2004, Cheung and Hamarneh 2009) was employed to evaluate DIR accuracy. The SIFT method is capable of automatically extracting corresponding features between pairs of images. The methods described in Paganelli et al (Paganelli et al 2013a) and implemented in plastimatch (Shackleford et al 2010) were employed to compare CT and CBCT images. However, the high homogeneity of the phantom materials led to a very low number of identified features using the conventional SIFT algorithm.
For this reason, we employed a variant of the SIFT method making use of adaptive contrast, which allows for a more efficient feature identification at the cost of a larger number of outliers and was shown to report similar feature distances as the original method (Paganelli et al 2013b). This method, aSIFT, was employed in this work, as it proved better suited for phantom evaluation due to the higher CT number uniformity of plastic materials.
We defined outliers in a similar manner as in Paganelli et al (Paganelli et al 2013b). Feature matches with distances outside a range defined by the 25th and 75th percentiles [above 75th + 0.5 (75th–25th) and below 25th–0.5 (75th–25th)] were considered outliers. It was observed that the algorithm identified matching features along the phantom or inserts surfaces for which large distances in the direction of the phantom's axis of radial symmetry were present. For this reason, we implemented a Z threshold TZ of 6 mm to further remove outliers. TZ was chosen to be larger than any deformation expected from the phantom in the Z direction and is also twice the rigid registration error of ~3 mm (or the planning CT slice thickness).
2.4. Deformation accuracy evaluation
The registration accuracy of the phantom study was evaluated by inter-comparing the pCTCBCT, vCTCBCT, refCTCBCT and CBCTCBCT using the aSIFT algorithm for a total of 6 comparisons. Furthermore, each insert (or airway) of the phantom was segmented using a region-growing algorithm applied to the pCTCBCT, vCTCBCT and refCTCBCT. Contour volumes and DICE coefficients between corresponding contours were estimated. To evaluate the accuracy of proton range estimation, the water equivalent thickness (WET) was calculated for projections at 0°, 90° and 180° starting from the phantom's surface down to a normal plane coinciding with the central axis of the phantom and to a second plane beyond the distal end of the phantom. To avoid confounding effects with the 180° direction, the table CT numbers were cropped to −1024. The 2D WET distributions from the pCTCBCT and vCTCBCT were compared to that of the refCTCBCT by means of gamma analysis with criteria 2 mm/2 mm WET. We employed a signed-gamma implementation (Persoon et al 2011). The tests mentioned above were performed for configurations 1, 2 and 3.
2.5. Dosimetric evaluation
The abovementioned tests were performed in the coordinate system and grid spacing of the CBCT. To test the final vCTpCT in the coordinate system and grid spacing of the pCT, proton dose calculations were employed. We optimized proton dose distributions using single IMPT beams at 0°, 90° and 180° delivering a uniform 2 Gy dose to the vertebral column inserts using the refCTpCT (rigidly aligned to the pCT). A comparison based on the refCTpCT was chosen as it represents the anatomy of the day which we aim at estimating using the vCTpCT. To avoid confounding effects with the 180° beam the table CT numbers were cropped to −1024. The dose distributions were optimized using an extension of the CERR (Deasy et al 2003) software package by Schell and Wilkens (Schell and Wilkens 2010). The resulting proton fluences were re-projected on the pCTpCT and vCTpCT using a Geant4 (Agostinelli et al 2003) Monte Carlo (MC) dose calculation engine. The dose volume histograms (DVH) from dose distributions obtained using the refCTpCT, vCTpCT and pCTpCT were compared in terms of DVH statistics, D90, as well as the proton range as defined as the distance between the phantom surface and the distal 80% isodose. 2D proton range maps in beam-eye-view (BEV) from the pCTpCT, refCTpCT and vCTpCT were compared using gamma evaluation with criteria of 2 mm/2 mm Range. The dosimetric evaluation was only performed on configuration 3.
2.6. Patient data
To verify that the DIR workflow developed for the phantom is valid for clinical applications, the imaging data of a H & N cancer patient undergoing photon IMRT was used in this work. The dataset contained a pCT, a CBCT scan acquired 50 days after the pCT and a replanning CT (rpCT) acquired a day after the CBCT scan. The same procedure that was used for the phantom was employed here to generate a patient vCTCBCT as well as a rigidly registered rpCTCBCT. The already described WET evaluation was applied to the patient data using the 0° direction and integrating to the patient mid-plane. Comparison of the pCTCBCT versus rpCTCBCT and vCTCBCT versus rpCTCBCT was performed as described for the phantom. We made use of the gamma evaluation as the patient is heterogeneous in the superior inferior direction, as opposed to the phantom. Slight errors in the rigid registration of the pCT/rpCT to the CBCT can thus have a large impact on the WET difference distributions. For this reason we relaxed the distance to agreement criterion to 3 mm, which is the pCT slice thickness, and kept the WET to agreement at 2 mm.
3. Results
Unless stated otherwise the results presented here are for configuration 3.
3.1. Registration
Figure 2 presents the pCTCBCT in planning configuration, the refCTCBCT and CBCTCBCT in treatment day configuration as well as the vCTCBCT resulting from DIR of the pCT to the CBCT. Figure 2 shows the difference in phantom diameter, angle and airway diameter between the treatment day configuration and the planning configuration. We observe that the vCTCBCT diameter has been reduced; however the air gap between the phantom body and fat ring caused by an imperfect fit has not been eliminated by the DIR. The reverse situation was observed in the airway where the refCTCBCT exhibits an air gap due to the imperfect fit of the airway sleeve which is not visible in the vCTCBCT. The agreement between the vCTCBCT and the refCTCBCT as well as the difference between the pCTCBCT and refCTCBCT are better visualized in the checkerboard representation of figure 3. There is good agreement between vCTCBCT and refCTCBCT for the phantom outer contour, airways and vertebral column. However the muscle insert in the vCTCBCT has been distorted, most likely due to the low CT number contrast between this insert and PMMA. It is questionable whether this situation would arise in a patient geometry given the higher number of gradients found in those images. The distortion of the muscle insert raises questions as to the use of the deformation fields to accumulate dose in a reference time point such as the pCT. However an investigation of dose accumulation was beyond the scope of this paper. We observed a misalignment in the Z direction resulting from the rigid deformation of the pCT to the CBCT. This misalignment is of the order of the slice thickness and could be due to the different geometries being aligned. While manual correction of this misalignment is straightforward this was not done as we aimed at evaluating the complete automatic workflow. Furthermore, the DIR performed following rigid registration corrects for residual shifts.
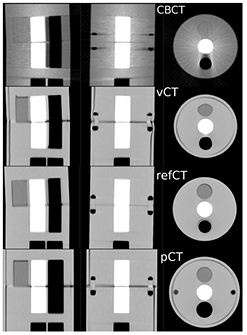
Figure 2. CT scans of the phantom in treatment day configuration (CBCTCBCT, refCTCBCT) and in planning configuration (pCTCBCT). The vCTCBCT is the result of DIR of the pCT to the CBCT.
Download figure:
Standard image High-resolution image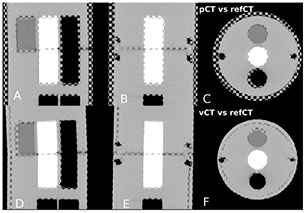
Figure 3. (a)–(c) Checkerboard comparison of the pCTCBCT and refCTCBCT. (d)–(f) Comparison of the vCTCBCT and refCTCBCT.
Download figure:
Standard image High-resolution image3.2. Deformation accuracy evaluation
Figure 4 presents the results of the aSIFT evaluation for the 6 possible image inter-comparisons using Tz = 6 mm. We observed that the median distance between corresponding features was lowered when comparing the vCTCBCT, refCTCBCT and CBCTCBCT together, indicating that our registration algorithm yielded a vCTCBCT which agreed better with the CBCTCBCT/refCTCBCT than the pCTCBCT. The median distances are of the order of 2–3 mm, which is comparable to the planning CT resolution of 1.074 mm in the axial plane and 3 mm in the scan direction. Interpolating the CT to the CBCT coordinate system does not improve its resolution, however the fact that the phantom is homogenous in the Z direction means that for homogeneous parts of the phantom this interpolation should yield similar values as a higher resolution reconstruction. This is however not true at edges, where most features are detected. It is thus likely that our results are limited by a combination of the precision of the aSIFT algorithm and the slice thickness used. The median feature distances for the vCTCBCT versus refCTCBCT and pCTCBCT versus refCTCBCT comparisons are reported in table 3 before and after outlier removal. A Wilcoxon rank sum test between the feature distances of the vCTCBCT versus refCTCBCT and pCTCBCT versus refCTCBCT after outlier removal yielded p < 0.01. The aSIFT algorithm yielded matching features between the vCTCBCT and refCTCBCT/CBCTCBCT which exhibited large differences in their Z positions, hence the need for a Tz rejection. This is illustrated in figure 5 where accepted and rejected features are shown.
Table 3. Median and interquartile range of distances of corresponding features before and after outlier removal for the pCTCBCT versus refCTCBCT and vCTCBCT versus refCTCBCT comparisons. The number of corresponding features is also reported as well as their anatomical location based on CT number thresholds.
| pCT versus refCT | vCT versus refCT | |
|---|---|---|
| median distance between corresponding features (mm) | ||
| all features | 21 ± 35 | 15 ± 25 |
| after outlier removal | 5.1 ± 2.9 | 2.4 ± 1.9 |
| number of features | ||
| all features | 446 | 796 |
| after outlier removal | 94 | 154 |
| number of features by location | ||
| CT number >200 | 23 | 26 |
| −200 < CT number <200 | 58 | 77 |
| CT number < − 200 | 13 | 52 |
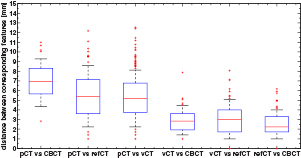
Figure 4. Boxplot of the distance between corresponding features for the 6 comparisons investigated after applying TZ = 6 mm. The horizontal line represents the median distance; the blue box represents the 25th and 75th percentiles and the whiskers extend to the most extreme data point not considered an outlier (plotted as red crosses). The median calculated here includes outliers, as opposed to table 3. Images were in the CBCT coordinate system.
Download figure:
Standard image High-resolution image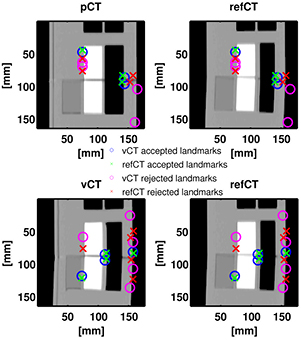
Figure 5. (Top) Corresponding features plotted simultaneously on the pCTCBCT and refCTCBCT with outliers indicated in red/purple while accepted features are in green/blue. (Bottom) Corresponding features plotted simultaneously on the vCTCBCT and refCTCBCT.
Download figure:
Standard image High-resolution imageFigure 6 presents the results of the aSIFT evaluation between the pCTCBCT versus refCTCBCT and vCTCBCT versus refCTCBCT for all configurations. As expected configuration 3 shows the largest difference between pCTCBCT and vCTCBCT, however the vCTCBCT shows lower median feature distances than the pCTCBCT for configurations 1 and 2 as well.
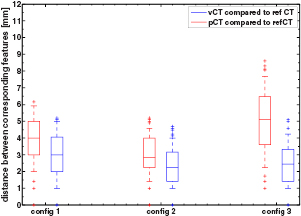
Figure 6. Boxplot of the distance between corresponding features for the 3 configurations. The horizontal line represents the median distance; the blue box represents the 25th and 75th percentiles and the whiskers extend to the most extreme data point not considered an outlier (plotted as red crosses).
Download figure:
Standard image High-resolution imageFigure 7 presents profiles across the phantom comparing the vCTCBCT, refCTCBCT and pCTCBCT. We observed good geometrical agreement between vCTCBCT and refCTCBCT and no noticeable degradation of CT number accuracy was observed in uniform regions. A discrepancy between the vCTCBCT and the refCTCBCT can be observed in the range of 40–50 mm due to the deformation of the muscle insert in the vCTCBCT. A second discrepancy is observed between 110–120 mm due to the imperfect fit of the airway sleeve in the refCTCBCT which caused a narrow air gap. Table 4 presents the volumes of the automatically segmented inserts and their DICE coefficients between vCTCBCT/refCTCBCT and pCTCBCT/refCTCBCT. Good agreement was observed between the vCTCBCT and refCTCBCT, with DICE coefficients between 0.83 to 0.99, an improvement from pCTCBCT versus refCTCBCT. The worst performance in term of DICE coefficients was the muscle insert which was distorted by the deformation. The DICE coefficients for the vertebral column inserts from the pCTCBCT versus refCTCBCT comparison, which had constant volume, were below 0.9 due to the misalignment from the rigid registration between pCTCBCT and refCTCBCT which can be observed in figure 3. However the volumes of the vertebral column inserts were consistent across all scans. Insert volumes were lower than the nominal 35.3 cm3 due to imperfect insert segmentation. The errors on the volumes are consistent with an underestimation of the insert radius by 1 mm which is of the order of the CBCT voxel size. When considering configurations 1 and 2 similar results were obtained, however in those cases the volume of the muscle insert was preserved in the vCTCBCT.
Table 4. Volumes of phantom components estimated from the pCTCBCT, vCTCBCT and refCTCBCT as well as the DICE coefficient comparing the components from the pCTCBCT versus refCTCBCT and vCTCBCT versus refCTCBCT.
| Component | volume (cm3) | DICE coefficient | |||
|---|---|---|---|---|---|
| pCT | vCT | refCT | pCT versus refCT | vCT versus refCT | |
| vertebral column 1 | 30.6 | 30.6 | 31.6 | 0.83 | 0.95 |
| vertebral column 2 | 30.4 | 30.8 | 31.0 | 0.87 | 0.95 |
| airway | 73.2 | 47.0 | 46.2 | 0.75 | 0.94 |
| muscle | 30.4 | 25.4 | 32.0 | 0.89 | 0.83 |
| body | 2755 | 2230 | 2240 | 0.89 | 0.99 |

Figure 7. CT number profiles along the white dashed line indicated on the right for the pCTCBCT, vCTCBCT and refCTCBCT.
Download figure:
Standard image High-resolution imageFigure 8 presents the WET evaluation at 0°, 90° and 180° and mid-depth when the vCTCBCT and refCTCBCT are compared. The results of the WET evaluation are summarized in table 5. For the ΔWET evaluation of table 5 the rows of pixels where the beam was tangential to the phantom surface (2 pixel rows on either side of the phantom) were excluded from the analysis as the very low WET values gave relative WET differences larger than 100%. Additionally, pixels with WET differences larger than 40 mm were considered outliers. For the gamma evaluation all pixels were considered. We observed that few pixels pass the gamma evaluation and that the average WET difference was large when comparing the pCTCBCT and the refCTCBCT, as can be expected from the removal of the outer ring, which is 7 mm thick. Comparing the vCTCBCT and refCTCBCT yielded a high level of passing pixels (> 98%) and mean WET differences of the order of −1 mm at the center of the phantom and −2 mm when traversing the whole phantom. These differences correspond to about −2 to −2.5% of the WET. Most of the WET differences were observed at the border of the phantom as seen in figure 8. This is caused by an imperfect correction of the phantom diameter following the removal of the outer ring. Such an effect is visible in in the vCT versus refCT comparison of figure 3(f) at the right and bottom edges of the phantom. The slight mismatch is sufficient to cause large WET differences at edges; however these WET errors would not appear in dose distributions for beams covering the central part of the phantom. In that case the error would be limited to the mismatch of phantom diameter, which is of the order of 1 mm.
Table 5. WET comparison between pCTCBCT/refCTCBCT and vCTCBCT/refCTCBCT at 0°, 90° and 180° at two phantom depths. Mean WET difference (WETvCT or pCT–WETrefCT) as well as standard deviation and % pixels passing a 2 mm/2 mm WET gamma evaluation are presented.
| angle (degree) | phantom depth | % passing 2 mm/2 mm | ΔWET (mm) | ΔWET (%WET) |
|---|---|---|---|---|
| pCT versus refCT | ||||
| 0 | half | 38 | 9 ± 4 | 15 ± 8 |
| full | 16 | 17 ± 8 | 15 ± 10 | |
| 90 | half | 14 | 7 ± 5 | 12 ± 9 |
| full | 8 | 17 ± 8 | 15 ± 10 | |
| 180 | half | 13 | 9 ± 7 | 13 ± 13 |
| full | 16 | 17 ± 8 | 15 ± 10 | |
| vCT versus refCT | ||||
| 0 | half | 100 | −0.5 ± 0.8 | −1.0 ± 1.8 |
| full | 98 | −1.8 ± 2.0 | −2.0 ± 3.1 | |
| 90 | half | 99 | −1.0 ± 1.6 | −1.9 ± 3.3 |
| full | 98 | −1.8 ± 2.6 | −2.3 ± 4.0 | |
| 180 | half | 98 | −1.3 ± 2.0 | −2.6 ± 4.8 |
| full | 98 | −1.8 ± 2.0 | −2.0 ± 3.1 | |
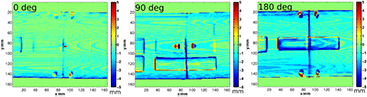
Figure 8. WET difference maps in mm between the vCTCBCT and refCTCBCT (WETvCT–WETrefCT) at 0°, 90° and 180° and mid phantom depth.
Download figure:
Standard image High-resolution imageWe observed that the WET evaluation was not particularly sensitive to the smaller changes of configurations 1 and 2 as opposed to configuration 3. The vCTCBCT results were consistent across configurations.
3.3. Dosimetric evaluation
We observed that the distal fall off of the dose distributions agreed well between vCTpCT and refCTpCT. As expected from the anatomical changes, this was not the case for the pCTpCT where an under-dosage of the target was observed.
Figure 9 presents the range difference maps corresponding to the 0°, 90° and 180° beams. We observe that range differences are reduced when using the vCTpCT instead of the pCTpCT. Since range is calculated from the phantom surface, the 7 mm difference caused by the weight loss ring removal does not show in the pCTpCT versus refCTpCT comparison. Larger deviations are observed for the pCTpCT versus refCTpCT at 180° due to the different airway diameter. Generally the range differenced between the vCTpCT and refCTpCT are of the order of 2 mm or less.

Figure 9. BEV range differences between (left) the vCTpCT and refCTpCT (rangevCT–rangerefCT) and (right) the pCTpCT and refCTpCT (rangepCT–rangerefCT) at 0°, 90° and 180°. Range was calculated from the phantom surface to the 80% distal falloff.
Download figure:
Standard image High-resolution imageTable 6 summarizes the results of the range comparison as well as the D90 values for the target. The results are supporting the proposition that the vCTpCT is a surrogate for a replanning CT as 97% of pixels or more passed the distal range gamma evaluation. Values of D90 between the vCTpCT and refCTpCT agreed well. The average range differences between vCTpCT and refCTpCT are found to be sub mm or below 1% of the range with a standard deviation or root mean square error of less than 2.1%. When comparing the pCTpCT to the refCTpCT we observed lower number of pixels passing the gamma evaluation as well as larger average range differences. While the radius of the phantom was reduced by 7 mm, we did not observe this value in the mean range difference of table 6 at 0° and 90° as range was calculated from the phantom boundary. While these beams did miss the target in the pCTpCT, as evidenced by the low D90, their range was not necessarily modified by weight loss or neck tilt, as there were only slight inhomogeneities in the beam. The scenario was different for the 180° beam which crossed an air cavity of different diameter in the pCTpCT and refCTpCT. In that case we observed a larger range shift.
Table 6. Results of the dosimetric evaluation comparing the vCTpCT to the refCTpCT and the pCTpCT to the refCTpCT. 2D range maps are compared in terms of percent pixels passing the gamma test of 2 mm/2 mm Range as well as the mean and standard deviation of range differences ΔR (rangevCT or pCT–rangerefCT). The D90 metric is compared as well.
| Angle (°) | components traversed in addition to fat ring | vCT versus refCT | pCT versus refCT | ||||||
|---|---|---|---|---|---|---|---|---|---|
| % passing | ΔR (mm) | ΔR (%) | D90vCT/D90refCT | % passing | ΔR (mm) | ΔR (%) | D90pCT/D90refCT | ||
| 0 | muscle insert | 99 | 0.0 ± 1.2 | 0.0 ± 1.7 | 1.02 | 80 | 1.4 ± 1.5 | 1.8 ± 2.0 | 0.10 |
| 90 | − | 97 | 0.2 ± 1.6 | 0.3 ± 2.1 | 1.00 | 82 | 1.3 ± 2.0 | 1.6 ± 2.6 | 0.65 |
| 180 | airways | 97 | 0.7 ± 1.4 | 0.8 ± 1.9 | 0.99 | 29 | 6.7 ± 4.4 | 7.7 ± 5.0 | 0.95 |
The better results of the range evaluation (~1% ± 2%) compared to the WET evaluation (~ − 2% ± 3.5%) can be attributed to focus of the range evaluation on the central part of the phantom as opposed to the WET evaluation which covered the whole phantom with exception of the two outermost pixel rows. Additionally, the range is defined from the start of the phantom's surface down to the 80% isodose, which makes it less sensitive to misalignments of the phantom surface between two scans, as opposed to the WET.
3.4. Applicability of the method to a clinical dataset
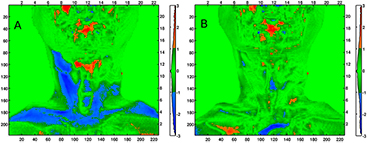
Qualitative assessment of the pCT to CBCT DIR for the patient case revealed no major discrepancy between the vCTCBCT and the CBCT. In particular, figure 10 presents results of the WET comparison using the gamma evaluation using criterion of 3 mm / 2 mm WET. We observed that the percentage of pixels passing the gamma comparison to the rpCTCBCT is increased when using the vCTCBCT (94%) instead of the pCTCBCT (77%). The mean WET differences were −0.6 mm ± 3.2 mm and 1.1 mm ± 3.6 mm respectively. The large neck portion failing the gamma evaluation for the pCTCBCT versus rpCTCBCT suggests that a beam coming from the left in figure 10 would suffer from range uncertainty, which could be reduced by employing the vCTCBCT. A detailed analysis of DIR accuracy for clinical datasets is beyond the scope of this paper and will be investigated in a follow up study using rpCT scans as reference.
Figure 10. (a) Result of the gamma comparison of WET using criteria 3 mm / 2 mm WET of the pCTCBCT versus the rpCTCBCT (WETpCT–WETrpCT). (b) Comparison of the vCTCBCT to the rpCTCBCT (WETvCT–WETrpCT). The left and bottom axis are in pixels while the top and right axis are in cm. The colorbar serves as a histogram of the gamma index distribution.
Download figure:
Standard image High-resolution image
4. Discussion
In all investigated phantom configurations, automatically identified image features from the aSIFT algorithm suggest a geometrical deformation accuracy of the order of 2–3 mm. We have confirmed that when using the Morphons algorithm CT numbers are preserved in homogeneous regions by the deformation, which is essential for accurate proton dose calculation. Our results indicate that for H & N-like cases the WET from the vCT agrees with a refCT to within 2 mm, or about 2%–2.5% of the proton range. This was further supported by estimating the range from single beam IMPT dose distributions where maximum range differences of about 1 mm were observed corresponding to about 1% of the proton range. Additionally the D90 obtained using the vCT was found to agree with the D90 obtained using the refCT. This level of accuracy is acceptable when placed in the context of the range uncertainty from x-ray CT conversion, quoted as 3.5% (Paganetti 2012). In fact, the final goal of our method is to provide a stopping power distribution allowing to flag clinical situations where the proton range has changed significantly. We do not aim to generate a stopping power distribution for direct IMPT re-planning; the latter should be performed based on images from the diagnostic CT scanner used for initial planning. In this envisioned application scenario the uncertainties we derived from our phantom study are acceptable.
This study has been focused on a phantom based evaluation of CT to CBCT DIR in the context of proton therapy. The use of a phantom allows the acquisition of a reliable reference image in treatment-day configuration, which is important for validation. While the validity of our approach for phantom data is a necessary condition for applicability to patient cases, it is not necessarily sufficient. Ideal patient-data based evaluation would rely on the acquisition of a CBCT and reference CT scan without patient re-positioning between scans. This is, however, difficult to achieve as in-room CT scanners are generally not installed along CBCT scanner. Furthermore it is unethical to scan patients twice as it violates the ALARA principle. The most likely patient datasets for evaluation would consist of daily or weekly CBCT images taken in parallel a few re-planning CT scans during treatment. Such a dataset would suffer from uncertainties from patient positioning at each scanner. Hence, these considerations support the use of a phantom for initial testing of the method; would it fail at this level there would be no need for further investigation.
Following the encouraging phantom results, in this work we have also applied our algorithm on a single patient case containing the data described above. We observed that the algorithm we tested on phantom data performed well on patient data. This supports further, thorough investigation of the method using several clinical datasets containing replanning CT and CBCT images, which is currently underway.
A limitation of our study is that our phantom fails to fully reproduce the range of patient size observed in H & N CT images. In H & N cancer cases adjuvant PTVs covering lymph nodes can extend into the upper thorax. In that region two issues are observed in CBCT images: i) a decrease of soft tissue CT number intensity due to increased beam hardening, scattering and attenuation from the shoulders and ii) truncation of the shoulders in the CBCT images due to the smaller FOV. Our initial patient results suggest that CT numbers on the vCT were not degraded by issue i). The use of an anterior beam to cover the region suffering from lateral truncation would also limit the impact of issue ii).
In-room CT would obviate the need for CBCT imaging as it directly provides diagnostic quality images comparable to those obtain from a planning CT scan. However in-room CT increases the complexity of both treatment rooms and workflows, as it entails couch movements between imaging and beam delivery. CBCT scanners can be integrated in a rotating gantry and require no couch shifts. An ideal alternative is to rely directly on the treatment beam to generate 3D stopping power maps from proton CT. While proton CT should provide more accurate stopping power distributions by avoiding the conversion of photon linear attenuation coefficients, it is not necessarily the ideal solution since it requires expensive beam time to generate images and no clinical device is yet available. In terms of dose calculation accuracy, the already mentioned range uncertainty from x-ray CT conversion is 3.5% and proton CT would most certainty reduce this. However, this level of uncertainty is most likely lower than uncertainties stemming from weight loss in H & N cancer patients where range differences of several mm can easily be reached.
5. Conclusion
We have performed a thorough phantom evaluation of the possibility of deforming a pCT to a daily CBCT, thus creating a vCT, for proton dose recalculation. Applying the DIR workflow developed for the phantom to clinical data supported the validity of the method. In conclusion the vCT approach appears to be suitable for daily dose recalculation. In future work the validity of the vCT approach will be evaluated using more clinical H & N patient data based on the tests employed in this study and by substituting the refCT by a re-planning CT scan.
Acknowledgments
This work was supported by the Federal Ministry of Education and Research of Germany (BMBF), grant number 01IB13001 (SPARTA) and by the German Research Foundation (DFG) Cluster of Excellence Munich-Centre for Advanced Photonics (MAP). Dr-Ing Johannes Wulz is acknowledged for designing the phantom. The authors would like to acknowledge Mark Podesta of MAASTRO clinic for sharing gamma evaluation code and Professor Dr Frank Verhaegen, Dr Brigitte Reniers and Dr Wouter van Elmpt for constructive discussions.