

Abstract
Treatment plans for ten patients, initially treated with a conventional approach to low dose-rate brachytherapy (LDR, 145 Gy to entire prostate), were compared with plans for the same patients created with an inverse-optimisation planning process utilising a biologically-based objective. The 'biological optimisation' considered a non-uniform distribution of tumour cell density through the prostate based on known and expected locations of the tumour. Using dose planning-objectives derived from our previous biological-model validation study, the volume of the urethra receiving 125% of the conventional prescription (145 Gy) was reduced from a median value of 64% to less than 8% whilst maintaining high values of TCP. On average, the number of planned seeds was reduced from 85 to less than 75. The robustness of plans to random seed displacements needs to be carefully considered when using contemporary seed placement techniques. We conclude that an inverse planning approach to LDR treatments, based on a biological objective, has the potential to maintain high rates of tumour control whilst minimising dose to healthy tissue. In future, the radiobiological model will be informed using multi-parametric MRI to provide a personalised medicine approach.
Export citation and abstract BibTeX RIS
1. Introduction
The standard approach to radiotherapy treatment of prostate cancer is to deliver a uniform, high dose of radiation to the entire gland. Multiple studies have shown, however, that tumour cells are not uniformly distributed through the gland. Focal therapy has been proposed as an alternative treatment approach, where specific regions of the prostate are targeted for high doses of radiation with the intention to reduce treatment-related toxicity (Valerio et al 2014). 'Focused Therapy' has been proposed as a form of focal therapy whereby, in addition to delivering high doses to specific regions of the prostate, the remaining gland receives smaller doses sufficient for sterilization of low-volume disease (Langley et al 2012). This approach takes into consideration the multi-focal nature of prostate cancer and is expected to reduce treatment-related toxicity, in particular urinary toxicity, whilst maintaining high rates of tumour control.
We have previously demonstrated that a biological model may be applied to predict biochemical failure rates in patients treated with a conventional approach to I-125 brachytherapy (Haworth et al 2013). The model was built on the hypothesis that high doses only need to be delivered to regions of the prostate at high risk of containing tumour foci. To validate the model, over 400 post-implant dosimetry studies were analysed and from these data it was found that a predicted tumour control probability (TCP) value of less than 0.62 was associated with a statistically-significant risk of biochemical failure at 5 years.
Inverse-planning algorithms for treatment planning in I-125 brachytherapy have been previously described (Pouliot et al 1996, D'Souza et al 2001, Yoo et al 2003, Yoo et al 2007, Cunha et al 2010, Guthier et al 2015a, McGeachy et al 2015). Each of these studies are based on the conventional approach to whole gland treatment, and optimisation is based on physical dose. Recently Guthier et al described the use of an inverse treatment planning approach for whole gland treatment using biological models including tumour control probability (TCP) and normal tissue complication probabilities (NTCP) (Guthier et al 2015b). In this study we demonstrate the function of an algorithm that attempts to optimise a combination of physical dose and biological optimisation-objectives. This algorithm represents a novel approach to focal prostate brachytherapy planning resulting in a reduced dose to the urethra whilst allowing dose escalation within the tumour compared with conventional planning techniques.
2. Methods and materials
2.1. Patient selection and conventional planning
Ultrasound volume studies and treatment plans for ten consecutive patients treated by a conventional approach (Davis et al 2012) to I-125 implant at the Peter MacCallum Cancer Centre were included in this retrospective, institutional HREC approved project. All patients were diagnosed with low risk prostate cancer and treatment plans were created with radical intent, 145 Gy to the entire prostate plus a margin of 3–5 mm (0 mm posteriorly) to create a planning target volume (PTV). A modified peripheral approach to planning (Butler et al 2000) was applied, using VariSeed V7.2 software (Varian Medical Systems, Inc., Palo Alto, CA), Oncura Model 6711 seeds (GE Healthcare, IL) and with dose calculated using the TG-43 formalism (Nath et al 1995, Rivard et al 2004). The source strength for each plan was selected according to the in-house protocol: 0.432U is standard, but 0.427U or 0.463U may be used to optimise dose conformity i.e. to shrink or expand the 100% isodose to produce the optimal target volume coverage and to produce a clinically-acceptable plan. All treatment plans were approved by the attending clinician and were considered clinically acceptable if:
- PTV V100 (the volume receiving the prescribed dose) was no less than 100% of PTV
- PTV V150 (the volume receiving 150% of the prescribed dose) was less than or equal to 60% of PTV
- PTV V200 (the volume receiving 200% of the prescribed dose) was less than or equal to 25% of PTV
- D90 (dose delivered to 90% of the PTV) was greater than or equal to 120% of prescription dose
In the event that all parameters could not be fulfilled exactly, a priority was placed on achieving a D90 value greater than or equal to 120% of prescription dose. In addition, the maximal urethral dose was constrained to 150% of the prescribed dose and the dose to the rectum was minimized by ensuring the 100% isodose conformed to the posterior PTV in line with the American Brachytherapy Society (ABS) recommendations (Davis et al 2012). All treatment plans were manually optimised to minimize the number of needle tracks.
A geometric structure representing the anterior rectal wall, defined by the region bounded by the posterior prostate within the lateral extent of the prostate and extending 5 mm posteriorly was created, for the purpose of dose comparison across all plans created for this study.
2.2. Inverse treatment planning with biological and physical dose optimisation
2.2.1. The radiobiological model.
The radiobiological model of Haworth et al (Haworth et al 2004a, 2004b) was used to calculate TCP values for the clinical and focal plans. This model, an extension of that developed by Ebert and Zavgorodni (Ebert and Zavgorodni 2000), incorporates spatial variations in dose-rate and tumour cell burden and is described in more detail in appendix A of reference (Haworth et al 2013). The model facilitates the use of voxel-level dose and tissue characteristics. The model was applied by mathematically dividing the prostate contour (with the PTV margin as defined previously), into 48 segments (figure 1), equating to 16 regions each for the apex, centre and base regions of the prostate. To demonstrate the function of this model, voxels within each segment were assigned a tumour cell-density based on the probability of finding tumour cells in that segment using the data of Zeng et al (Zeng et al 2000) as summarized in table 1. The tumour cell densities used to compute the TCP in each voxel were calculated using the initial clonogen number divided by the volume of each voxel. All calculations presented here were undertaken on a voxel resolution of 2 × 2 ×5 mm3. As in our previous study, upper and lower initial clonogen numbers of 1.6 × 10³ and 8.8 × 10⁴ were applied, corresponding to probabilities of finding tumour cells from 15.0–25.1% and 55.4–65.5% respectively. Published values for the remaining parameters used in the model are summarized in table 2. The TCP value for each voxel in the PTV, for each patient, was calculated along with a combined TCP value representing the entire prostate with the heterogeneous distribution of tumour cell densities using the methods of Haworth et al (Haworth et al 2004a). With this approach the TCP model predicts a higher probability of treatment failure in high risk regions compared with equally underdosed low risk regions.
Table 1. Voxels in each prostate segment were assigned an initial clonogen number based on the probability of finding tumour cells in that segment (Haworth et al 2013).
| Category | Probability of finding cancer foci (%) | Initial clonogen number |
|---|---|---|
| Very low | 15–25.1 | 1.60E + 03 |
| Low | 25.1–35.2 | 4.36E + 03 |
| Intermediate | 35.2–45.3 | 1.19E + 04 |
| High | 45.3–55.4 | 3.23E + 04 |
| Very high | 55.4–65.5 | 8.80E + 04 |
Table 2. Parameters used in the TCP calculations. Values are based on the work of Wang et al (Wang et al 2003).
| Parameter | Value | Units |
|---|---|---|
| α/β | 3.1 | Gy |
| α (radiosensitivity) | 0.15 | Gy−1 |
| σα (population standard deviation for α) | 0.04 | Gy−1 |
| Tpot (potential cell proliferation time) | 42 | Days |
| μ (exponential rate of repair of sub-lethal damage) | 62 | Day−1 |
| I-125 half life | 59.4 | Days |

Figure 1. Software for this project was developed to mathematically divide the prostate into 48 segments. Voxels in each segment were allocated a percentage probability of finding prostate cancer (the numbers shown in each region) based on the work of Zeng et al (Zeng et al 2000).
Download figure:
Standard image High-resolution image2.2.2. Inverse treatment planning.
The planning algorithm uses an iterative local-search of the space of allowable needle and seed arrangements to increase the TCP to a target value whilst constraining the dose to the urethra below user-defined dose/volume constraints. Standard constraints on needle/seed placement were applied i.e. needle tracks were aligned with the 5 mm template grid with a minimum inter-seed distance within the needle of 10 mm centre-to-centre, and minimum axial separation such that all seeds were at least √2 × 5mm apart. To summarise, starting with a zero number of seeds, at each step, the algorithm involved several processes:
- 1.A fixed number of moves were sampled from the full set of possible moves.
- 2.For each sampled move, the dose distribution for that seed arrangement was calculated throughout the PTV and OARs, allowing calculation of TCP and assessment of the user defined constraints.
- 3.The permitted move that improved the TCP by greatest amount was determined.
- 4.That move was applied.
- 5.If there was no improving move, the search restarted.
The set of possible moves was composed of:
- Adding a new needle (with seeds) at one of the defined template hole positions in the PTV
- Rearranging the seeds within a needle
- Removing an existing needle and adding a new needle
The algorithm operates on whole needles at a time, rather than individual seeds, in order to maintain the constraint that each needle must contain at least two seeds. Since there are many possible modifying moves, the search uses a specified number of random moves (as indicated at step 1) and examines only those. To determine the number of moves that consistently returns the optimal result in the shortest time, 10 focal plans for each patient were generated using 15, 150, 1500, 15 000 random moves. For each examined move, the state that would result from executing that move was computed, calculating the dose at all sample points and the TCP. If the new state had two seeds that were too close together, or would violate the given dose limits, it was discarded. If the same move had already been executed in the last 15 moves, it was discarded. Otherwise, if it had a better TCP score than the current state, it replaced the current state and the search continued.
If none of the considered needle or seed arrangements improved the current rate, the search restarted. The algorithm selects a random number between 0.1 and 0.9, and this proportion of needles is discarded to give a new starting point. The search then restarts from this point and the process continued until a plan with the desired TCP (and within the defined OAR dose constraints) was found. An option for the user to manually halt the search is available. This was invoked when the user observed the TCP value was reaching a plateau and it was clear that to improve the TCP by a small amount would require significant increases in dose to the OARs. A screen shot of the user interface is shown in figure 2 where it will be noted that the software reports a 'TCP' value and 'sampled TCP' value. The TCP value uses a single value of α as an efficiency measure during the search for a best solution. The final, reported value 'sampled TCP' represents the TCP with the log normal distribution of alpha values as discussed in appendix A of reference (Haworth et al 2013).

Figure 2. Screen shot of the optimiser software user interface. In this example, the target TCP value was 0.95 and source strength 0.432U. The urethral dose constraints were: volume of urethra receiving 125% of the conventionally prescribed dose (UV125) to be below 10%, and 150% of the conventionally prescribed dose (UV150) to be below 5%, where the conventionally prescribed dose is 145 Gy. In addition to defining the target TCP and OAR dose constraints, the algorithm limited the placement of the needles to within 5 mm of the PTV, with no needles extending beyond the posterior prostate boundary. Additionally, placing needles in the central column of template holes (column 'D') was forbidden to ensure needles would not perforate the urethra.
Download figure:
Standard image High-resolution image2.2.3. Plan optimisation and adaptation Three focal plans were created for each patient case study.
The software allows the user to define source strength, however, for this study, a single source strength of 0.432 U was used for all plans. The first plan ('Focal 1') was created by allowing the optimisation algorithm to increase the TCP for the PTV to a value of 0.9–0.95, whilst maintaining the volume of urethra receiving 125% of the conventionally prescribed dose (UV125) below 10%. To achieve this, the optimiser was allocated a target TCP value of 0.95 but the user halted the process if the TCP value was >0.9 and appeared to have reached a plateau as discussed in section 2.2.2. For the purpose of this study, the 'conventional' prescribed dose is 145 Gy. Additionally the volume of urethra receiving 150% of the conventionally prescribed dose (UV150), was constrained to no more than 5%.
The second focal plan ('Focal 2') was created by manually editing the seed positions in the Focal 1 plan. This step was included to incorporate clinical opinion and experience in treatment planning. Examples include: needles that the optimisation algorithm placed in the region thought to include the neurovascular bundle were moved either anteriorly and/or medially to minimize direct placement of seeds into this region; needles in column D (the central column) between the posterior urethra and posterior prostate were added if needed to increase the TCP without significantly increasing the urethral dose; needles that were placed outside the PTV that could be brought to within the prostate were moved medially if the urethral dose was not significantly increased.
A third focal plan was created by setting a TCP target value of 0.8–0.85 ('Focal 3'). This value was based on our previous work which identified that, in the post-implant dosimetry study, a TCP greater than 0.62 corresponded with a 5-year biochemical failure rate less than 93.7%(Haworth et al 2013). A planning target TCP value greater than 0.62 is required to account for random and systematic seed displacement errors that typically arise during and after implant (Dawson et al 1994). A value of 0.85 was arbitrarily selected but tested for robustness as described below.
For all focal plans, rectal dose constraints were not specified. For the purpose of plan comparison, the volume of the geometrical structure defined in section 2.1 (representing the anterior rectal wall) receiving more than 145 Gy was reported for all plans considered in this study.
A paired sample Wilcoxon signed-rank test was used to test for a reduction in median urethral and rectal doses resulting from the focal plans over that given by the clinical plans.
2.3. Plan robustness
The plans created using the optimisation methods described above were tested for robustness in the presence of random seed displacements. In all plans considered in this study, random seed displacements were modelled using methods similar to that of Bues et al (Bues et al 2006). For each plan (clinical and focal plans), all seeds were randomly displaced in the X, Y and Z directions. The distance of the perturbation was chosen from a Gaussian distribution having a mean of zero and a specified standard deviation (SD) which was varied from 0 to 5mm in 1mm increments(Betts et al 2015). One hundred trials were run at each defined seed displacement and the average TCP reported for each plan.
3. Results
We present the results of all focal plans generated with 150 random moves. Compared with the other options considered (15, 1500, 15 000 moves), the optimisation algorithm was able to produce a plan with the Focal 1 target TCP value in less than 60 s for 9 out of the 10 patient data sets (data shown in supplementary file Supp1.pdf) (stacks.iop.org/PMB/61/430/mmedia). Patient #5 had a particularly wide prostate (PTV width mid-gland being 5 cm), and it took longer to reach the target TCP value for all move options for this case.
Clinical plans required on average 85 seeds compared with 74, 72 or 64 seeds for the three focal planning approaches respectively. Similarly, the average number of needles was reduced from 28 for the clinical plans to 23, 23 or 19 needles for the three focal planning approaches respectively (table 3).
Table 3. Comparison of the number of seeds and needles for each of the planning approaches.
| Clinical | Focal | Clinical | Focal 1 | Focal 2 | Focal 3 | Clinical | Focal 1 | Focal 2 | Focal 3 | ||
|---|---|---|---|---|---|---|---|---|---|---|---|
| Patient ID | Prostate volume (cc) | Source strength (U) | No. seeds | No. Needles | |||||||
| 1 | 15.5 | 0.463 | 0.432 | 52 | 50 | 51 | 47 | 19 | 19 | 20 | 16 |
| 2 | 46.0 | 0.427 | 0.432 | 106 | 88 | 86 | 78 | 35 | 24 | 24 | 21 |
| 3 | 21.0 | 0.427 | 0.432 | 76 | 58 | 57 | 51 | 27 | 19 | 19 | 16 |
| 4 | 28.3 | 0.432 | 0.432 | 86 | 68 | 70 | 57 | 27 | 22 | 23 | 18 |
| 5 | 41.5 | 0.432 | 0.432 | 95 | 90 | 90 | 77 | 30 | 27 | 28 | 21 |
| 6 | 23.9 | 0.432 | 0.432 | 74 | 61 | 57 | 56 | 28 | 20 | 20 | 18 |
| 7 | 35.6 | 0.432 | 0.432 | 93 | 79 | 79 | 74 | 29 | 24 | 25 | 22 |
| 8 | 35.2 | 0.432 | 0.432 | 89 | 87 | 78 | 67 | 28 | 25 | 23 | 18 |
| 9 | 30.7 | 0.427 | 0.432 | 82 | 71 | 70 | 65 | 25 | 21 | 21 | 20 |
| 10 | 37.0 | 0.432 | 0.432 | 96 | 85 | 85 | 70 | 32 | 27 | 27 | 22 |
| Average | 84.9 | 73.7 | 72.3 | 64.2 | 28.0 | 22.8 | 23.0 | 19.2 | |||
| SD | 15.1 | 14.2 | 13.6 | 11.0 | 4.2 | 3.0 | 3.1 | 2.3 | |||
All focal treatment plans were able to meet the target TCP value with a source strength of 0.432U (table 4) whilst maintaining the UV125 ⩽ 10% for all Focal 1 and Focal 3 plans. The volume of urethra receiving 181.3 Gy (UV125) was significantly reduced from a median value of 63.8% (SD 15.6%) for the 10 clinical plans to 5.3%, 7.6% and 6.7% (SD 4.2%, 14.9%, 3.7%) (respectively for the 3 focal plans (p < 0.001 for all 3 cases) (figure 3(a)). The volume of urethra receiving 217.5 Gy (UV150) ranged from 0.0% to 7.1% for the clinical plans. All focal plans had a UV150 value of 0.0%. The average volume of the rectum receiving more than 145 Gy (RV100) for the clinical plans was 0.38 cc, and for the focal plans this was reduced to 0.10, 0.11 and 0.03 cc respectively (p < 0.01 in all 3 cases) (figure 3(b)).
Table 4. Comparison of TCP values for each of the treatment planning approaches. (TCP-tumour control probability).
| Patient ID | TCP | |||
|---|---|---|---|---|
| Clinical | Focal 1 | Focal 2 | Focal 3 | |
| 1 | 0.998 | 0.953 | 0.951 | 0.868 |
| 2 | 0.995 | 0.954 | 0.938 | 0.851 |
| 3 | 0.998 | 0.965 | 0.961 | 0.866 |
| 4 | 0.996 | 0.954 | 0.957 | 0.863 |
| 5 | 0.983 | 0.938 | 0.940 | 0.859 |
| 6 | 0.997 | 0.957 | 0.957 | 0.897 |
| 7 | 0.998 | 0.951 | 0.957 | 0.867 |
| 8 | 0.998 | 0.952 | 0.933 | 0.856 |
| 9 | 0.994 | 0.956 | 0.948 | 0.869 |
| 10 | 0.991 | 0.949 | 0.957 | 0.854 |
| Average | 0.995 | 0.953 | 0.950 | 0.865 |
| SD | 0.005 | 0.007 | 0.010 | 0.013 |

Figure 3. (a) Comparison of UV125 (volume of urethra receiving more than 125% of the conventional dose prescription of 145 Gy). The bottom and top of the boxes are the first and third quartiles, and the band inside the box is the median. The ends of the whiskers represent the minimum and maximum values. The small circles represent outliers. (b) Comparison of RV100 (volume of rectum receiving more than 145 Gy). The bottom and top of the boxes are the first and third quartiles, and the band inside the box is the median. The ends of the whiskers represent the minimum and maximum values. The small circles represent outliers.
Download figure:
Standard image High-resolution imageFocal plans, by definition, will include regions of the prostate receiving considerably less dose compared with conventional whole gland treatments, and hence plans cannot be evaluated using standard dose metrics such as D90 and V100 unless a focal target volume is defined (for example as described by (Langley et al 2012)). However, to demonstrate the differences in dose distribution, in figure 4 we present the dose volume histogram data (DVH) for the clinical and focal plans. The dose distributions for a sample patient are shown in supplementary file Supp2.pdf. (stacks.iop.org/PMB/61/430/mmedia).
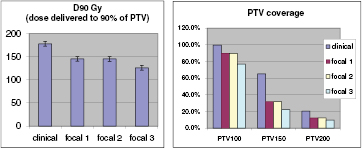
Figure 4. Comparison of conventional treatment plan evaluation metrics including the D90 (dose delivered to 90% of the prostate volume) and PTV100, PTV150 and PTV200 (percentage volume of the prostate covered by the 100%, 150% and 200% isodoses respectively).
Download figure:
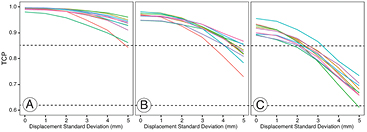
Standard image High-resolution imageTo test the robustness of the plans we applied a random uncertainty in the seed positions as described in Methods section 2.3. Focal plans 2 and 3 are compared with the clinical plans in figure 5. The mean of the TCP values for all clinical plans were greater than 0.85 for all modelled displacements with standard deviations up to 5 mm. The TCP for the focal plans were greater than 0.62 for displacements with standard deviation up to 3 mm. In the supplementary (Supp3.pdf) (stacks.iop.org/PMB/61/430/mmedia) material we present TCP as a function of treatment plan and simulated post implant seed displacement for all 100 trials that were run at each level for each patient, all plans. The central region of each boxplot indicates the 25th, 50th and 75th percentiles and the whiskers show the minimum and maximum values except where these are outliers, and shown by asterisks. Whilst there were a small number of outliers, it can be seen that in general the TCP remained greater than 0.62 for all plans with a standard deviation in displacement up to 3 mm.
Figure 5. Impact of random displacement of seeds on tumour control probability (TCP), showing the mean TCP across all 100 trials as a function of displacement standard deviation: (a) clinical plans (b) focal plan 2 (c) focal plan 3. Each colour represents plans for individual patients.
Download figure:
Standard image High-resolution image
4. Discussion
Mathematical programming approaches have previously been applied to brachytherapy planning problems (Pouliot et al 1996, D'Souza et al 2001, Yoo et al 2003, Yoo et al 2007, Cunha et al 2010, Guthier et al 2015a), however these consider only the dosimetric criteria as the objective. Pouliot et al (Pouliot et al 1996) used simulated annealing to find seed plans where the quality of a plan is measured by how well it meets certain clinical criteria on the dose; e.g. uniformity of dose distribution and limited dose to the urethra and rectum. D'Souza et al (D'Souza et al 2001) formulated the problem as a mixed-integer linear optimisation problem, where the objective was to achieve a target dose distribution. Yoo et al (Yoo et al 2003) use a greedy algorithm to construct brachytherapy seed plans, combined with a heuristic using adjoint functions, for selecting the best seed to add to the plan. Similar to other work, the criteria for plan quality is only the coverage of the planning volume with the prescribed dose. The TCP model used in this paper is much less amenable to being solved by exact mathematical programming methods; in particular, the non-linearity of the TCP calculation makes mixed-integer programming solvers unsuitable. Recently Guthier et al reported the use of a compressed sensing-based inverse planning algorithm incorporating TCP and NTCP biological models (Guthier et al 2015b). This novel approach considered the whole prostate as the target volume and the TCP parameters were applied uniformly through this volume. This is in contrast to the approach described within our study where our goal is to deliver only high radiation doses to regions of the prostate at high risk of containing tumour cells, with lower doses delivered to low risk regions. To achieve this we applied a non-uniform distribution of tumour cell density which was related to the probability of finding tumour deposits based on previously reported histological studies (Zeng et al 2000). In addition, Guthier et al used NTCP to control the dose to the organs at risk (Guthier et al 2015b). This is in contrast to our approach where we have used physical dose objectives for organs at risk. We suggest that although both approaches are appropriate, they will yield different results, and will require validation through clinical studies. Whilst optimisation based on biological objectives has previously been reported for planning external beam radiotherapy treatments (Kim and Tome 2006, Hoffmann et al 2008), to the best of our knowledge we are the first group to report the function of an inverse planning algorithm using a biological optimisation approach for the purpose of focal brachytherapy.
In testing the algorithm with a variable number of moves, we found that, in using the Focal 1 approach (target TCP value 0.9–0.95) 15 random moves was insufficient to achieve the target value. Whilst the target TCP value could be achieved by selecting 15 000 moves, it took longer than the intermediate values of 150 and 1500 because each needle is moved many more times before moving onto the next needle. The results of this study are shown in the supplementary file (Supp1.pdf) (stacks.iop.org/PMB/61/430/mmedia). In some cases it may be noted that the TCP value occasionally decreases as time progresses, followed by an increase. This is a result of a further efficiency measure incorporated into the algorithm. As the optimisation algorithm is searching for the best solution, it uses a single value of alpha (α) in the TCP equation, however the final, reported value (the values shown in the graph) represents the TCP with a log-normal distribution as discussed in appendix A of reference (Haworth et al 2013). As a result of this difference, there are some occasions where the TCP with a fixed alpha value is greater than the previously calculated value, but the result is reversed with the TCP calculated with the distribution of alphas.
The clinical plans used for comparison with the developed algorithm are based on a modified peripheral-planning method which uses low strength seeds (0.427U–0.464U) and allows seeds to be placed outside the PTV. There is no consensus on the optimal source strength for plan robustness and may be a function of planning approach (Sloboda et al 2003, Beaulieu et al 2004). Determining the optimal source strength and needle placement criteria will be the subject of future studies, however, we have demonstrated that using seeds of a lower source strength provides a sufficient number of seeds to provide the flexibility to produce a highly heterogeneous dose distribution to achieve our TCP/urethral dose planning objectives.
The urethral and rectal dose constraints for the clinical plans were based on ABS guidelines (Davis et al 2012). The ABS recommends the UV150 should be below 5% and the UV125 below 30%. Our clinical protocol includes the former recommendation, the latter is observed in practice where possible, but as noted by the ABS, this is not always possible when using the conventional whole gland, forward planning approach. Depending on the location of the tumour, this latter constraint should be achievable using a focal approach, and practical when using a fast optimisation algorithm. We therefore included both UV150 and UV125 constraints in our demonstration focal plans.
Whilst early results of focal therapy trials suggest favourable outcomes, the optimal approach to treatment planning using I-125 seeds remains unclear (Langley et al 2012, Valerio et al 2014). Cosset et al reported the early results of a pilot study using I-125 seeds implanted in only that part of the prostate found to contain tumour through biopsy and MRI, along with a large safety margin which resulted, on average 34% of the prostate being irradiated to 145 Gy (Cosset et al 2013). Similarly Barret et al, reported the clinical results of a focal therapy study using a variety of techniques including brachytherapy. In the latter study seeds were implanted in 'the cancer area' (Barret et al 2014). In both studies, for patients treated with brachytherapy the early results suggest acceptable toxicity, however, compared with the conventional, whole-gland approach there did not appear to be a significant benefit in treating only a prostate sub-volume. Until clinical studies mature we cannot be sure our approach to customizing the dose distribution to the biological tumour characteristics will achieve superior results compared with the conventional whole gland approach, however, various studies have reported a variety of parameters that predict for urinary and rectal toxicity (Nath et al 2009). From these studies we conclude that every effort to reduce the total radiation dose to the prostate, and the urethra in particular, should translate to reduced urinary toxicity without compromising tumour control.
The number of seeds within the focal plans was reduced compared with the clinical plans, and was most likely due to the lower integral dose (this is demonstrated in the isodose distributions for a sample patient shown in the supplementary file Supp2.pdf) (stacks.iop.org/PMB/61/430/mmedia). As a result of the reduced number, particularly for the Focal 3 approach, we investigated the robustness of the plans in the presence of a range of random seed displacements. Various studies have reported different approaches to modelling seed displacements following implant, which affect the final plan quality (Sloboda et al 2003, Beaulieu et al 2004, Bues et al 2006, Gao et al 2007). We chose to use the approach of Bues et al to test the robustness of the focal plans(Bues et al 2006). Bues et al determined that, based on visual inspection of a series of pre-implant plans and post-implant dosimetry studies, seeds displaced randomly in all three Cartesian directions with standard deviation of 4 mm. To confirm our approach to modelling was realistic for our patient data set, we compared the pre- and post-implant seed positions by first aligning the centroids of the seeds and applying a least squares fit to identify the best match of all seed positions. Based on this study we found the mean and standard deviation for all 10 cases was 0 mm and 3.6 mm respectively (data not shown). We suggest that this would be a worst case scenario and that in practice, we would expect focal brachytherapy would be carried out using real-time dosimetry, so that the intended placement of seeds could be updated as each needle is inserted into the prostate. Use of a fast optimisation algorithm makes real-time planning feasible; our software generally took less than a minute to produce plans that easily met the urethral dose planning constraints.
Similar dosimetry modelling studies for focal brachytherapy have been reported in the literature. The team in Leeds, UK, for example, have published two studies looking at the potential dosimetric advantages of using LDR or HDR brachytherapy using the hemi-gland or ultra-focal approaches (Mason et al 2014, Al-Qaisieh et al 2015). This is in contrast to our work where we have applied the 'focused' approach (as defined by Langley(Langley et al 2012)), not favoured by the Leeds group due to the uncertainty in the dose to prescribe to the lower-dose region. We concur that there is indeed no clinical evidence supporting the dose that should be delivered in these regions and forms the basis of our argument for using a biological approach to treatment planning. In simple terms, we hypothesise that the dose delivered to regions of the prostate that are negative on biopsy and imaging, but at risk of containing small tumour deposits should receive a radiation dose that is sufficient to sterilise low volume (i.e. below the resolution of the imaging studies) disease.
A limitation of our study was the lack of imaging data for the cases included in our study. Both studies reported by the Leeds group (Mason et al 2014, Al-Qaisieh et al 2015) used clinical and imaging data (MRI) for their case studies including 7 patients with peripheral gland tumours and 2 with central gland tumours. Imaging data was not available for our study and we generated a non-uniform distribution of tumour cell densities through the prostates based on published data, with biological parameters based on those reported in the literature and in our previous validation study (Haworth et al 2013). The absolute values we report in table 4 and figure 3 would change if these parameters values were adjusted as we have described previously (Haworth et al 2004b) and the sensitivity to the uncertainty in these parameters in the current application to focal therapy will be the subject of future studies. The purpose of this current work was to demonstrate the performance of our biological optimisation method in comparison to the standard whole gland approach. Our long term goal is to extract tumour characteristics from multiparametric imaging data that will inform the radiobiological model (in addition to biopsy data) to customise the dose distribution to the specific location, size and predicted aggressiveness of the tumour. Our results are consistent with the partial gland planning approaches of the Leeds group which similarly reported reduced doses to organs at risk.
The focal plans were generated to demonstrate the performance of the biological optimisation model and used target TCP values of 0.9–0.95 (Focal 1) or 0.8–0.85 (Focal 3). In the case of the Focal 1 plans, the target value was selected to represent the range of TCP values that were retrospectively determined from the clinical plans. This was to demonstrate that with equal TCP values, our focal plans could achieve lower doses to organs at risk compared with the clinical plans created using a whole gland, forward planned approach. We could have aimed for a higher TCP value, however our philosophy is to deliver sufficient radiation dose to treat the tumour and keep doses to organs at risk well below commonly used constraint values to potentially reduce acute and late toxicity. Potentially the algorithm could be further developed to search for a solution that pushes the OAR values even lower than those achieved in this study; however as this approach has not been clinically tested, the benefits of further OAR dose reduction are unclear. Although Gaudet et al (Gaudet et al 2010) demonstrated that the dose to intraprostatic lesions could be escalated without increasing toxicity, we believe the value of dose escalation is unclear given that excellent tumour control results are reported in low risk patients (Grimm et al 2012). In the case of the Focal 3 plans, the target TCP value was arbitrarily selected. Based on our previous retrospective study of post-implant dosimetry, we determined a TCP value of 0.62 would translate to high rates of biochemical control. This is based on the conventional approach to whole gland therapy where we determined the standard deviation of seed displacements was 3.6 mm. Regardless of implant technique, there will always be some degree of seed displacement, hence to achieve a post-implant TCP value >0.62, it will be necessary to aim for a higher value at the planning stage. Whilst all focal plans achieved a TCP > 0.62 in the presence of seed displacement (up to 5 mm), further studies are required to determine the optimal planning (target) TCP value for focal brachytherapy, which may depend on the technique used. For example, using the methods of Petasecca et al (Petasecca et al 2013), seed placement accuracy may be greatly improved compared with conventional seed placement techniques.
5. Conclusion
A novel approach to treatment planning for focal brachytherapy has been presented. The algorithm attempts to optimise a radiobiological objective, in the context of physical dose constraints, to achieve a highly heterogeneous dose distribution intended to maximize tumour control probability whilst minimizing dose to the urethra.
Acknowledgments
This work was supported by PdCCRS grant 628592 with funding partners: Prostate Cancer Foundation of Australia, Radiation Oncology Section of the Australian Government Department of Health and Cancer Australia. This work was also sponsored by the Australian Research Council grant DP110102258. Dr Reynolds is funded by a Movember Young Investigator Grant awarded through Prostate Cancer Foundation of Australia's Research Program. NICTA is funded by the Australian Government through the Department of Broadband, Communications and the Digital Economy and the Australian Research Council through the ICT Centre of Excellence program.