

Abstract
Automatic tube current modulation (ATCM) on CT scanners can yield significant reductions in patient doses. Modulation is based on x-ray beam attenuation in body tissues obtained from scan projection radiographs (SPRs) and aims to maintain the same level of image quality throughout a scan. Noise level is important in judging image quality, but tissues in larger patients exhibit higher contrast resulting from the presence of fat. CT scanner manufacturers use different metrics to assess image quality. Some employ a simple measure of image noise, while others adopt a measure related to a reference image that accepts higher noise levels in more attenuating parts with higher contrast. At the present time there is no standard method for testing ATCM. This paper reviews the operation of different ATCM systems, considers options for testing, and sets out a framework that could be used for optimizing clinical protocols. If dose and image quality can be established for a reference phantom, the modulation performed by ATCM systems can be characterised using anatomical phantoms or geometrical elliptical phantoms which may be conical or include sections of varying dimension. For scanners using a reference image or mAs, selection of the image quality reference determines other factors. However, for scanners using a noise reference, a higher noise level should be selected for larger patients to avoid high doses, and the operator should ensure that appropriate limits are set for mA modulation. Other factors that need to be considered include the SPRs used to plan the ATCM and image thickness. Users should be aware of the mode of operation of the ATCM system on their CT scanner, and be familiar with the effects of changing different protocol parameters. The behaviour of ATCM systems should be established through testing of each CT scanner with suitable phantoms during commissioning.
Export citation and abstract BibTeX RIS
1. Introduction
The importance of computed tomography (CT) scanning has increased steadily as the sophistication and flexibility of scanners has evolved over the last 30 years. When the last UK review of doses to patients was undertaken, CT scans made up 60% of the collective dose to patients from medical diagnostic exposures (Hart et al 2010). The key role that optimization of radiation protection plays in keeping CT doses to an acceptable level has been highlighted by the International Commission on Radiological Protection (ICRP) (2007). The UK Committee on Medical Aspects of Radiation in the Environment (COMARE) recommends that a full range of dose reduction features are included on CT scanners (COMARE 2014). A major technological development to aid in optimization in the last decade has been the inclusion of facilities to modulate the tube current to compensate for variations in the attenuation of patients' body tissues (Kalra et al 2004, McCollough et al 2006). These facilities perform adjustments which allow both for differences in patient size and for variation in tissue attenuation during scans of individual patients. Automatic tube current modulation (ATCM) was highlighted by the ICRP as one of the improvements that could reduce the doses from CT examinations (ICRP 2007), and when used effectively ATCM can reduce doses to individual patients by 40%–60% (Mulkens et al 2005, Rizzo et al 2006, Lee et al 2008, Söderberg and Gunnarsson 2010).
Thus ATCM systems offer considerable potential for the reduction of doses to patients. This coupled with the availability of iterative reconstruction of CT images and optimizing of tube potential should allow much lower dose CT scanning in the future. The modulation of tube current (mA) is based on assessment of the attenuation of the x-ray beam and is designed to maintain a similar level of image quality throughout a scan. Adjustments are made as the x-ray tube rotates around the patient with the smaller diameter antero-posterior (AP) direction receiving a lower exposure than the lateral. Adjustments are also made as the scan progresses along the patient with a higher mA used for the thicker lateral shoulder and hip regions, and a reduced current used where the soft tissue attenuation is lower in the thorax and abdomen. The ATCM systems also change exposure levels according to patient size to give a more uniform level of image quality for every patient, in a similar manner to the automatic exposure control on radiographic systems.
There have been a variety of studies showing the variation in patient dose with patient size under ATCM operation (Schindera et al 2008, Israel et al 2010, Meeson et al 2010, Zarb et al 2010, Sookpeng et al 2014) and on the optimization of image noise and dose as a function of patient size (Siegel et al 2004, Verdun et al 2004, Li et al 2012). These studies show that potential reductions are dependent on the appropriate selection of the scanning parameters and image quality reference. The operator can adjust some scan acquisition parameters in order to obtain the desired image quality, but increases in the exposure factors that result in higher quality images will go undetected, unless dose levels are monitored closely, so there is considerable scope for the operator to perform CT examinations at higher dose levels than necessary. Wide variations are observed in large dose surveys even among facilities using the same CT scanners (Mettler et al 2008, Martin and Huda 2013, Shrimpton et al 2014). There are many factors that affect ATCM performance and the manner in which they interact varies between CT manufacturers (Gutierrez et al 2007, Söderberg and Gunnarsson 2010, Sookpeng et al 2013), so ensuring that systems are set up correctly is not straight forward. Moreover, there are as yet no standard methods for testing ATCM systems, as this requires assessment of performance under a range of conditions. This paper reviews methods of ATCM operation on different scanners, considers the options for carrying out tests of ATCM systems, and goes through the factors that influence ATCM performance with which operators should be familiar. Results presented in the figures are derived from analyses of experimental data from an earlier study (Sookpeng et al 2013) and patient doses data from surveys in the West of Scotland.
2. Operation of ATCM systems
The first requirement for the operation of ATCM is the determination of patient attenuation. This is done primarily from scan projection radiographs (SPRs), called variously scout, topogram, surview or scanogram by different manufacturers, which include information on both patient tissue sizes and attenuations. The adjustments may be based on a single SPR using predictive calculations of the difference in AP/lateral dimensions or two SPRs. Siemens can use either two SPRs or a single SPR and adjust the angular mA based on online feedback measurements during each tube rotation. The attenuation profile measurements made from the previous 180° view are used to calculate the angular modulation of the mA. For all CT scanners, the average attenuation values for each rotation from the SPR are converted into water equivalent thicknesses (WETs), and the mA is set automatically at each Z-position to achieve a selected image quality reference based on the WET using proprietary algorithms. The variation may be in the form of step changes in mA for every AP and lateral quadrant, or a sinusoidal interpolation between AP and lateral values. Thus the exposure, which is determined by the product of tube current (mA) and exposure time (s) or mAs, is varied along and around the body to match the tissue attenuation for each patient, and the current modulation will follow different patterns, depending on body shape.
The parameter that is used as the image quality reference has an important bearing on the operation of ATCM, but different approaches are used by CT scanner manufacturers. Noise is the obvious parameter when making adjustments as different regions of the body are imaged, but the situation is more complicated when dealing with patients of different size. The ability to detect structures in an image depends on the signal to noise ratio, and more particularly for x-ray imaging, the contrast to noise ratio. A factor that needs to be taken into account is that organs in larger patients are separated by a layer of fat and the images have a higher contrast resulting from the presence of fat (Wilting et al 2001). This allows anatomical structures in larger patients to be visualized with a higher noise level, whereas a lower noise level is required for smaller patients and children in whom the contrast is poorer and the anatomical detail to be visualized may be finer. There are important differences between manufacturers in the image quality references used, the way in which acceptable image quality is defined, and the algorithms that govern the modulation, and all these affect the way that ATCM is implemented (Söderberg and Gunnarsson 2010, Sookpeng et al 2014).
Siemens and Philips use measures that increase the acceptable noise level as attenuation increases to allow for the higher contrast in larger patients. For the Siemens CARE Dose 4D system the operator chooses an image quality reference mAs relating to a standard patient (Stratis et al 2013, Söderberg 2016). An algorithm determines how the dimensions measured from the SPRs compare with those for the standard patient and the operator chooses the strength of the mA modulations (very weak, weak, average, strong or very strong). Choice of a strong modulation will give a larger increase in mAs for larger patients and a greater reduction for smaller ones. For the Philips system, DoseRight, automatic current selection (ACS) determines the operation of the ATCM, and can vary the current either along the scan direction (Z-DOM) or with angle around the patient (D-DOM) (Wood et al 2015). The system uses a reference image concept and the mA is adjusted to achieve a similar level of image quality for the patient being imaged. An automatic patient size averaging facility learns from the scanning of patients based on intervention by the operator, so that the patient reference can evolve during clinical use, and adjusting the mAs per slice when planning a scan may result in a drift in settings over time. There is an alternative manual mode which uses a reference image from a selected patient, and use of this option avoids the changes once optimized settings have been established. In both the Siemens and Philips systems, the noise level increases with attenuation of the patient section being imaged and the limits on mA are derived from the SPR, the upper limit being based on the most attenuating section of the patient.
In contrast, General Electric (GE) and Toshiba use a measure of noise based on the standard deviation (SD) in a standard phantom directly as the image quality reference. GE AutomA 3D has z-axis (AutomA) and angular modulation (SmartmA), with the mA being changed for each quadrant during every rotation (Moro et al 2013). The image quality reference is a noise index selected by the operator that is approximately the SD in a 200 mm water phantom. The Toshiba SureExposure 3D system uses a similar approach with a target noise level relating to the SD in the first axial image reconstruction set by the user and varying through high quality, quality, standard, low dose and very low dose (Sookpeng et al 2015). The ATCM for both GE and Toshiba aims to maintain the same noise level throughout a scan. Since this does not take account of differences in contrast between patients, systems require the operator to select a higher noise reference level for larger patients, and if this is neglected it can lead to high doses for large patients (Sookpeng et al 2014). Adaptive software is included in current models to adjust the reference image quality with patient attenuation, decreasing the target SD for small patients and increasing it for larger ones. Standard settings are recommended for all models, but the user can choose alternatives to achieve the required image quality for particular clinical tasks. It would be difficult to achieve a constant noise level throughout every patient because of the wide range in size and the technical requirements. Minimum and maximum limits are set for the mA modulation, which can be selected by the operator.
Most companies now also offer the facility to use information from the SPR to optimize both tube potential (kV) and mAs to achieve the chosen contrast-to-noise ratio. Image contrast increases as the kV is reduced, and this is especially useful for iodine contrast studies. Patient-specific mAs curves are calculated for different kV levels based on the scan range, patient anatomy, and the contrast required. An optimized kV is then selected for the patient protocol and only the mA is modulated during the scan. Clinical studies have demonstrated that scanning at a lower kV using a higher noise reference can provide images with improved contrast at reduced patient doses and with systems having automated kV selection, 100 kV is the setting adopted most frequently (Rampado et al 2009, Lee et al 2012, Vardhanabhuti et al 2013, Mayer et al 2014). In principle kV can be selected manually depending on size for each patient, in a similar manner to radiography examinations, with 100 kV for an average 70 kg–80 kg patient, 120 kV or even 140 kV for larger patients, and 80 kV for smaller ones. Another facility incorporated into new CT scanners is a reduction in mA to the anterior aspect of the body by up to 60% in order to minimize doses to radiosensitive organs such as the breasts and eye lenses. These facilities coupled with iterative reconstruction techniques can pave the way to substantially lower dose CT. However, the availability of more sophisticated techniques for reducing doses, has made the process of optimization more complex, and an understanding of the interplay of the many different factors involved is necessary if their potential is to be realized.
3. Assessment and optimization of ATCM systems
3.1. Assessment of CT dose and image quality
The dose performance of CT scanners is tested through measurement of the CT dose index (CTDI) with a 100 mm ionization chamber in standard cylindrical phantoms made from polymethyl methacrylate (PMMA) 320 mm and 160 mm in diameter representing the body and head respectively (IEC 2003). Measurements are made with a CTDI chamber at the centre (CTDIc) and four peripheral (CTDIp) positions, for which results are averaged, in a phantom, and the weighted CTDI (CTDIw) derived using the equation:

The volume averaged CTDI (CTDIvol), is derived by dividing the CTDIw by the pitch of the tube rotation (table movement/ beam width). It is displayed on CT scanner consoles and used in evaluation of patient doses. For dosimetry purposes, the CTDIvol values for the two phantoms are very different, so in any study of ATCM performance it is important to ensure that it is clear which CTDIvol is being used. The CTDIvol was designed to provide a measure related to the average dose within a CT slice, but the actual dose will be dependent on the patient or phantom dimensions. In order to take account of changes with patient size, an adjustment can be made to the CTDIvol to give a size specific dose estimate that approximates to the average tissue doses for patients of different size (AAPM 2014). In this study although phantoms with elliptical cross sections of different sizes are used, it will be the CTDIvol for the standard 320 mm PMMA phantom that is displayed on the CT console which will be employed for the analyses of ATCM performance.
Image quality is assessed using other cylindrical phantoms containing contrast detail tests. It is difficult to incorporate ATCM system performance into these tests, since the phantoms have fixed dimensions. An option that provides a good test of ATCM is to scan an anatomical phantom representing a standard adult, but a set of phantoms of different sizes would be required to fully evaluate ATCM performance and data from phantoms of this type cannot be quantified readily. A geometrical phantom with sections having a range of dimensions can be used to assess the modulation for patients of different sizes, but performance quantities that might be measured will vary along the phantom. Dose levels at different positions inside a phantom will be determined by the incident air kerma and the phantom dimensions which affect the attenuation and scattering, and will vary with position both within the phantom and in the scan field. Therefore the measure of mA provided by the CT scanner is an easier quantity through which to assess the relative variation in exposure. The relationship between dose in terms of the CTDIvol measured in a phantom and the mA will vary with the CT scanner, as it depends on the attenuation and shape of the bow-tie filter, but the mA provides a useful indicator of relative changes in dose for individual CT scanners. There are ranges of attenuations along the lengths of anatomical phantoms and these data can be used to provide an indication of the variation in mA with attenuation. Quantification of attenuation data along the lengths of such phantoms might also allow changes in mA with attenuation to be quantified. Image quality can most readily be assessed through changes in noise along the phantom. Data acquired as part of the study described in Sookpeng et al (2013) are included in the first two figures, and additional analyses of data from this study are included in later figures.
3.2. Designs of geometrical phantom design
A phantom for testing ATCM systems needs to be elliptical to take account of changes in current as the x-ray tube rotates around the body. An axis ratio of 3:2 provides a realistic cross section for much of the trunk, but a wider section (e.g. ratio 2:1) would be required to mimic the shoulder region. ATCM phantoms should cover a substantial portion of the useful range of patient attenuation encountered routinely in clinical practice, with a steady progression from the smallest to the largest diameter. The majority of phantoms go from diameters less than that of the neck up to diameters larger than an average patient, typically over 400 mm in order to allow trends in dose level for larger patients to be assessed. However, the implications of size on manual handling must be considered if a phantom is to be transported between different hospitals for routine testing. There must also be a facility to suspend the phantom horizontally in the x-ray beam, without the interference of support material.
A number of phantoms have been based on cones with diameters varying continuously along the length. An elliptical conical phantom made from PMMA with axis ratio 3:2 and a largest diameter of 424 mm has been used by ImPACT (Keat et al 2005, Sookpeng et al 2013) and others have used related designs (Gutierrez et al 2007, Muramatsu et al 2007, Field 2010, McKenney et al 2014). The differences in performance between different modes of scanner operation can be seen clearly in results from scans of this design of phantom for Philips and GE CT scanners (figure 1). The mA increases with phantom diameter for both scanners over the range of cross-sectional areas from about 250 cm2 to 700 cm2, but starts to level off towards the upper end, with that for the GE scanner reaching the maximum mA value (figure 1(a)). The noise level in the GE scanner remains fairly constant over most of the phantom, in line with the use of the noise reference comparator, but begins to increase at the point where the mA reaches the maximum value (figure 1(b)). Whereas the noise in images from the Philips scanner, for which the comparator is a reference image, starts at a lower level in the narrower end of the phantom, but rises steadily as the diameter increases (figures 1(c) and (d)). The mA does not reach a maximum at a particular value, and the relative increases in current with size are similar for the different mAs settings. The mA for the GE scanner rises more steeply under ATCM control as the phantom diameter increases than that for the Philips one in order to maintain a constant noise level and this translates into a proportionately more rapid increase in patient dose with body size. Thus conical phantoms provide a good indication of performance in terms of the variation in mA modulation and image noise with phantom diameter. They do not provide positions where factors are constant or ones that can readily be identified for measurement of dose.
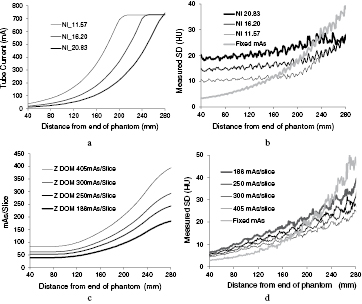
Figure 1. Plots of mA (a) and (c) and image noise (b) and (d) recorded from scans along the length of a PMMA conical ImPACT phantom from dimensions of 110 mm × 55 mm at 40 mm, to 411 mm × 206 mm at 280 mm (Sookpeng et al 2013). The results are for a GE scanner with smart mA and different noise index settings (a) and (b) and a Philips scanner with ACS Z-DOM ATCM and a range of setting for the mAs per slice (c) and (d). Plots of the variation in noise resulting from use of fixed mAs values are also given in (b) and (d).
Download figure:
Standard image High-resolution imageAn alternative design is a stepped phantom made up of a series of polyethylene or PMMA sections of different diameter (Sookpeng et al 2013, McKenney et al 2014). However, the sharp steps in attenuation between sections do not mimic the smooth variations encountered in the body, and there may be small air gaps between sections that can give large discrepancies in x-ray penetration. These sharp variations in attenuation affect the way in which the ATCM operates on some CT scanners, particularly those using image quality references based on noise level, as the algorithms are designed to be more responsive to small changes in attenuation, and over-compensate for step changes that do not normally occur in the human body. Figure 2 shows an example of the sharp changes in mA that may occur every quadrant with GE and Toshiba scanners. Large increases and decreases in mA occur on the next rotation following respective increases and decreases in phantom attenuation as the phantom moves through the CT gantry. Thus although this design of phantom is easier to construct it is not suitable for testing all CT scanners in use at the present time and this is discussed in more depth by Sookpeng et al (2013). The problems relating to the scanning of stepped phantoms are being addressed by manufacturers in more recent scanners. For example whereas the Toshiba SureExposure 3D version 6 based the changes in mA on the actual SPR of the phantom and gave sharp variations in mA when step changes were encountered, that in version 7 uses an internal SPR with substantially improved mA calculation at such step changes (figure 3). Phantoms with limited numbers of elliptical sections can potentially be used for dosimetry and noise measurement, but in order for them to perform satisfactorily with some CT scanners currently in service, sharp discontinuities in attenuation may need to be limited to less than 6% and air gaps between sections excluded to minimize the effects described above (Sookpeng et al 2013). The flexibility of such phantoms may be improved by incorporating annular wedges between adjacent sections to eliminate sharp discontinuities. In order to accurately characterise dose performance within sections of fixed diameter, lengths of individual sections should ideally be three times the beam width used for testing. Another option is to use a series of shorter elliptical sections with small changes in diameter between sections to create a conical phantom. This approach has been adopted in the production of the Leeds CT AEC phantom, which comprises eleven PMMA ellipses, each 25 mm thick, for which the steps in attenuation between adjacent sections are smaller (www.leedstestobjects.com/index.php/phantom/ct-aec-phantom/) (Wood et al 2015).
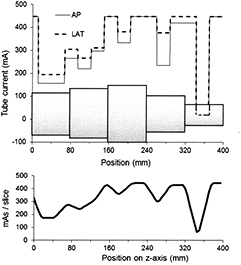
Figure 2. Plots showing the variation in mA along a phantom from a GE Lightspeed CT scanner using a 32 mm wide beam showing the variations triggered by the sharp discontinuities in attenuation for each tube rotation. The phantom is made from elliptical polyethylene sections representing the dimensions of the human torso (Sookpeng et al 2013) is sketched in diagrammatic form below the plot (not to scale). The mA is varied in quadrants corresponding to the AP/PA and lateral tube orientations around the phantom and the two values are shown for each rotation. The resulting mAs per image along the phantom is plotted beneath.
Download figure:
Standard image High-resolution image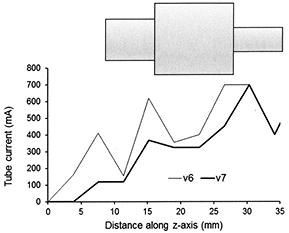
Figure 3. Plots of the mAs per slice recorded from scans of a sectional PMMA phantom shown in diagrammatic form (not to scale) with a Toshiba Aquilion scanner using SureExposure 3D. The plots show the variations triggered by the sharp discontinuities in attenuation by version 6 of the Toshiba software and the reduced oscillation achieved in version 7.
Download figure:
Standard image High-resolution imageThe phantoms described so far have been made from PMMA or polyethylene, but other materials such as nylon, which has an effective atomic number and attenuation coefficient similar to water, could be used, and properties are compared in table 1. When scanning any of these phantoms it is recommended that the SPR used to plan the scan is set within the boundaries of the phantom, as the large changes in attenuation at the start and end of the phantom can lead to unrealistic tube currents that affect the performance of some ATCM systems. In addition, it is better to carry out the tests using smaller beam widths, so that the response is averaged over a smaller range of diameters in conical phantoms and the response in the centre of a section can be quantified more reliably for sectional ones. Some phantoms also have facilities for measurement of dose in the centre with an ionization chamber either a 100 mm CTDI pencil chamber or a smaller one to give the dose at a central position. If a dedicated ATCM phantom is not available, some information on ATCM performance could be obtained using a nested PMMA CTDI phantom, that is one in which the 160 mm diameter standard head phantom fits within a larger annulus to form the 320 mm body one (Tsalafoutas et al 2013). Offsetting the head and body sections will allow three regions of differing attenuation to be created, although such a phantom will have a circular rather than an elliptical cross-section and contains sharp discontinuities.
Table 1. Properties of phantom materials and water.
| Materials | Energy (keV) | Effective atomic number | Density (g cm−3) | Mass attenuation coefficient (cm2 g−1) | Mass energy absorption coefficients |
|---|---|---|---|---|---|
| Water | 60 | 7.42 | 1.00 | 0.2059 | 0.031 90 |
| 80 | 0.1837 | 0.025 97 | |||
| 100 | 0.1707 | 0.025 46 | |||
| 120 | 0.1615 | 0.026 25 | |||
| PMMA | 60 | 6.48 | 1.17 | 0.1924 | 0.025 30 |
| 80 | 0.1751 | 0.023 02 | |||
| 100 | 0.1641 | 0.023 68 | |||
| 120 | 0.1558 | 0.024 83 | |||
| Polyethylene | 60 | 5.44 | 0.92 | 0.1974 | 0.022 36 |
| 80 | 0.1826 | 0.022 65 | |||
| 100 | 0.1722 | 0.024 23 | |||
| 120 | 0.1638 | 0.026 28 | |||
| Cast nylon 6 | 60 | 6.85 | 1.14 | 0.2058 | 0.032 87 |
| 80 | 0.1831 | 0.026 32 | |||
| 100 | 0.1701 | 0.025 58 | |||
| 120 | 0.1617 | 0.025 73 | |||
Note. Coefficients taken from Hubbell and Seltzer (1995), with values for 120 keV derived from fits of data which did not include values between 100 and 150 keV.
3.3. Patient dose audit
Having a phantom with a range of diameters allows the performance of a scanner ATCM system to be assessed qualitatively, but gives little information about dose performance in clinical practice. The dose performance of CT scanners is described in terms of two measurable quantities, the CTDIvol (IEC 2003), which relates to the dose per unit length of a patient taking account of the pitch of the x-ray tube rotation, and the dose length product (DLP), which gives a measure related to the total dose received by a patient from an examination. The dose performance of CT scanners in clinical practice is assessed through audit of dose quantities for patient examinations (IPSM 1992, Martin 2011). It is now possible to download large amounts of DLP and CTDIvol data from Radiology Information Systems on all patients scanned within particular periods (Wood et al 2012, Martin 2016). In the past when data were only available for a limited number of patients, it was necessary to restrict the range of patient weights for each examination studied, but with larger numbers of results this is unnecessary. The median value of the distribution of dose quantities for all patients is recommended for these assessments of larger numbers of patients (Martin 2016). Comparison of median patient doses for examinations performed on CT scanners with diagnostic reference levels (DRLs) enables their performance to be assessed. If the median dose exceeds or is close to the DRL, then the scanner protocol should be reviewed and factors optimized. Valuable information on optimizing scanning protocols can be obtained by comparing results for different scanners. But judgements on the optimal dose levels must take account of the image quality and users must be assured that it is adequate for the types of examination to be performed. Figure 4 shows patient doses for chest abdomen pelvis CT examinations listed in order of increasing DLP for five Toshiba Aquilion CT scanners in which the target noise values were selected by the operators. The DLPs rise more steeply towards the end of the distribution for scanners A, B and C linked to higher dose levels for larger patients, whereas the rise is lower for scanners D and E. The median DLPs for all scanners are within 40%, but those with ATCMs using the same reference noise level for all patients gave higher doses to heavier patients. Differences between CT scanners in patient dose distributions can be identified by comparing the 3rd quartile values of the DLPs as well as the medians (figure 4) (Martin 2016). If the image quality given by scanners using a lower dose protocol is judged to be acceptable, then this can be used as a guide in setting up protocols on other scanners. The distribution of doses for groups of patients on different scanners will depend on the relative weight distributions. However, as a rough guide to whether protocols are optimized for larger patients, the user could take scanners where the third quartile is more than about 50% higher than the median of the dose distribution as the starting point for carrying out an investigation. Changes made to protocols may involve setting a higher noise reference for larger patients. In current models of CT scanner, such large increases in dose for Toshiba and GE scanners should be avoided by the automatic setting of higher reference noise levels for larger patients, but in many models in use currently, this will not be the case.
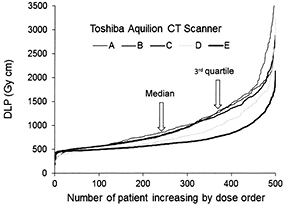
Figure 4. Data for groups of 500 patients undergoing chest-abdomen-pelvis examinations ordered in terms of increasing DLP on each of five Toshiba Aquilion 64 CT scanners for. All the scanners use sure exposure 3D ATCM in which the image quality is selected in terms of a noise reference, and in all the target noise was set by the operators. Each curve represents values for CAP examinations performed on a different scanner (A)–(E). The median values for unit A are 40% higher than those for unit E and the 3rd quartile values are 70% higher.
Download figure:
Standard image High-resolution image3.4. Investigating ATCM performance
If the dose performances of different CT scanners for a standard sized patient are adjusted so that they are similar, then the mA modulations produced by their ATCM systems along a conical or sectional phantom can be compared. The relative values for the mA for different parts of the phantom can be obtained from mA versus phantom position curves, such as those shown in figures 1(a) and (c). Results of this type are plotted as a function of the larger axis diameter for the elliptical conical phantom for CT scanners from the four manufacturers in figure 5. Tube current data have been normalized with respect to the requirement for a PMMA phantom of diameter 300 mm, which equates to an attenuation similar to that for 320 mm of water. A curve equating to the mA required to maintain the same level of transmitted air kerma is also included for comparison. The forms of the normalized curve for different image quality reference values on each individual scanner were generally similar. The scanners that apply a reference image or mAs (Philips and Siemens) use a higher mA for smaller patients, whereas those based on a noise reference (GE and Toshiba) increase the mA more for larger patients. The form of the latter group is similar to the curve representing the reciprocal of the transmitted air kerma (figure 5). There is some levelling off in mA at larger diameters for these scanners, when the mA reaches the maximum value. Two curves are included for the Toshiba scanner showing that with the 'low dose' option that starts at a lower mA, a wider mA range can be achieved, whereas with the 'standard' range the modulation is curtailed when the mA reaches its maximum value. In practice the actual mA selected for the standard option would be substantially greater than that for the low dose one, but when normalized the programmes follow similar trajectories at low and medium phantom diameters, while at large diameters the actual mA values for the two options both approach the maximum value.
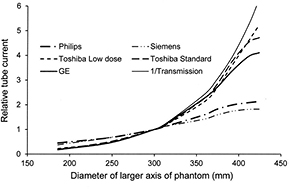
Figure 5. Plots of the relative x-ray tube current against diameter of the lateral axis of the conical elliptical PMMA phantom as selected by the ATCM systems on the CT scanners of four CT scanner manufacturers operating at 120 kV. A curve is also shown relating to the reciprocal of the air kerma transmission for 120 kV with 8 mm of aluminium filtration excluding scatter. The results are normalized with respect to the performance for an ellipse with lateral diameter 300 mm. Two curves are shown for Toshiba, representing the modulation of the 'low dose' and 'standard' image quality reference options.
Download figure:
Standard image High-resolution imagePlots comparing the variation in noise in terms of the measured SD in the image along the conical phantom for different CT scanners are shown in figure 6 for the settings regarded as the standard options. The GE and Toshiba scanners maintained a fairly constant noise level through the middle part of the phantom, whereas the noise level in the Philips scanner rose steadily, although much less than the noise when a fixed mA was used with no ATCM. The noise level for all options tended to rise towards the thicker end of the phantom as the mA approached the limiting value. Each CT scanner offered a range in the choice of image quality level from low dose and to high image quality and plots of the measured noise for the upper and lower levels along the length of the phantom for three of the scanners are shown in figure 7. The SDs of the lowest dose (LD) options were 2–3 times those for the highest image quality (HQ) in each case. There is considerable overlap between the ranges for the different scanners, with the main difference being that the noise varied less with phantom diameter for the GE and Toshiba scanners that used a noise based reference, compared to the Philips scanner. If the main factor contributing to improved contrast in larger patients is the presence of fat, then it might be argued that maintaining the same level of noise throughout the scan of an individual patient is a better approach, provided the appropriate noise reference is selected. However, if ATCM operation is based on a reference image or mAs, as practised by Philips and Siemens, it can be adapted more readily to scanning patients of differing size, as a similar image quality reference can be chosen for all patients. Thus there are arguments in favour of both approaches to the choice of image quality reference, but the important thing for the operator is to understand how the ATCM system on each CT scanner performs and adapt the settings to suit all groups of patients.
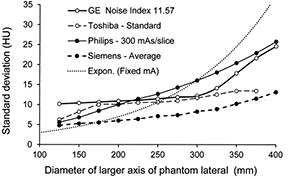
Figure 6. Plots of image noise in terms of SD in Hounsfield number against diameter of the lateral axis of the conical elliptical PMMA phantom as selected by the ATCM systems using the standard option at 120 kV for CT scanners of four CT scanner manufacturers. A curve is also shown representing the variation in image noise with a fixed tube current. The settings used are given in the key after the manufacturer. The dotted line represents values for a fixed tube current with no ATCM.
Download figure:
Standard image High-resolution image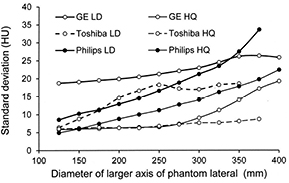
Figure 7. Plots of image noise in terms of SD against diameter of the lateral axis of the conical elliptical PMMA phantom as selected by the ATCM systems using the LD and HQ image references for three CT scanners operating at 120 kV. The image quality options are: for GE noise indices 20.83 (LD) and 6.94 (HQ); Toshiba low dose++(LD) and High quality (HQ); Philips 124 mAs/slice (LD) and 405 mAs/slice (HQ).
Download figure:
Standard image High-resolution image3.5. Strategies for optimizing ATCM performance (section revised)
Wood et al (2015) describe how, following a dose audit on Philips CT scanners, they were able to optimize examinations based on what was considered to be the optimum protocol. They chose the third and fourth sections of a Leeds CT AEC phantom, made from short sections of PMMA with a diameter close to the standard for Philips scanners of 320 mm WET to compare performance, but another elliptical phantom with a similar diameter could be used as an alternative. They scanned the phantom using the clinical protocol with ATCM to check performance, and using the clinical protocol from the LD scanner as a guide, having checked the image quality was acceptable, they matched settings on other scanners to the protocol chosen. Finally Wood et al confirmed the performance of each scanner by rescanning the conical phantom and measuring CT number and noise along the phantom.
A similar methodology could be used for comparing performances of CT scanners from the same manufacturer, for which the image quality references are similar. For models from Philips and Siemens, scan parameters such as the maximum and minimum limits on tube currents are adjusted automatically for each patient based on the SPR and the modulations in tube current with patient size are similar in form (figure 5). For GE and Toshiba scanners that use an image quality reference based on the noise level, a similar approach based on a phantom of standard dimensions could be used for setting up the clinical protocol, but additional factors would need to be checked to ensure that the adjustments made for patient size were optimized. The various peripheral factors that influence ATCM performance are discussed in more detail in section 4, but the framework for optimization will be set out first. Establishing the CTDIvol and noise levels required for scanning a phantom of standard size and then checking how they change with ATCM for a geometrical phantom with a range of diameters (section 3.2) provides a method for comparing performance of scan protocols. Relative values of the CTDIvol for different diameters can then be inferred directly from the changes in tube current relative to the value for the standard phantom as depicted in figure 5. The translation of protocols between scanners from different manufacturers, particularly between ones using ATCM based on a reference image or mAs and those using a noise reference is a more difficult task, because the forms of the variations in tube current and image noise with attenuation are substantially different (figures 5–7). Nevertheless this can be tackled in a similar manner by determining values for CTDIvol relative to those for a standard phantom from the variation in tube current with phantom diameter (figure 5). Once values of CTDIvol for different sizes of phantom required for an optimized protocol have been determined, then values for the image quality references that will give similar CTDIvol values for different sizes of phantom with the scanner to be optimized need to be determined. If the forms of the relationship between CTDIvol or mA and phantom diameter are substantially different on the two CT scanners (figure 5), then scans of the geometrical phantom using different values of the image quality reference will be required to provide information on the possible settings that might be appropriate. The steps that can be followed in the optimization of clinical protocols are set out in table 2.
Table 2. Framework setting out steps for translating ATCM settings in clinical protocols between CT scanners
| (1) | Review results of patient dose audits of CT scanners (e.g. figure 4). |
| (2) | Select CT scanners with protocols which are acceptable in terms of dose and noise level for patients of varying size, as a reference for performance comparisons. |
| (3) | Choose a standard phantom within the mid-range (e.g. PMMA phantom with diameters of 300 mm × 200 mm) and scan on CT scanners for which protocols are considered acceptable. |
| (4) | Establish acceptable CTDIvol (and noise) values from the scan of the standard phantom. |
| (5) | Follow either (a) or (b) depending on availability of phantoms:
|
| (6) | Repeat the scans (a) or (b) above on the CT scanner for which performance is to be optimized using the standard image quality reference value. |
| (7) | Compare variation in CT scanner CTDIvol values with phantom size for CT scanner to be optimized with those for the reference CT scanner (figure 5). Determine whether different image quality reference values should be used for phantom/patients of different sizes to give the required values of CTDIvol. |
| (8) | If the pattern of CTDIvol or mA increase with phantom diameter is substantially different from that required, repeat the scans (a) or (b) above on the CT scanner for which performance is to be optimized for a range of image quality reference values to determine new values that are required. Such changes are more likely when comparing CT scanners with mAs and noise based references (section 3.3). |
| N.B. This may be a simple comparison of approximate values, or a detailed analysis as described in section 3.6 in which the relationships between CTDIvol and the image quality reference are analysed for phantoms of varying size, and functions determined to describe the link between image quality references values giving similar CTDIvol values for each scanner (McKenney et al 2014). | |
| (9) | For CT scanners using an image quality reference based on noise, |
| (10) | Rescan phantom with revised settings to confirm performance. |
| (11) | Adjustments to kVs for patients of different size might be made to protocols. When optimum kV values have been established, similar changes could be applied to all CT scanners protocols (section 2). |
3.6. Detailed comparison of ATCM performance in clinical protocols
McKenney et al (2014) describe protocol translation between CT scanners of different type based on more detailed comparisons of displayed CTDIvol. They employ a phantom comprising five PMMA cylinders of varying diameter each 150 mm long and determine the dependence of CTDIvol on the image quality reference from scans of each cylinder over the full range of image quality reference settings. From these results values of the image quality references for different scanners that give similar values for the CTDIvol can be plotted against each other and relationships between them determined. McKenney et al found that the relationships between noise index values for two GE CT scanners could be described by a linear function of the form (y = ax + b) and differences in relationships between the GE scanners were relatively small. They found the equivalent relationship between noise index for a GE scanner and the quality reference mAs for a Siemens scanner was more complex, but could be described by a power function of the form (y = axb + c). Such equations could then be used in translation of image quality reference values that should be selected for different protocols between CT scanners. A similar approach could be used based on achieving similar levels of image noise instead of CTDIvol. This method of translation requires substantial numbers of experimental measurements and analysis. The simpler comparison of the principal image quality settings described in the previous section may be sufficient in many cases, but whatever approach is taken, phantoms with dimensions to represent the range of body sizes and attenuations encountered in clinical practice are required. In addition there are a number of factors that influence the performance of ATCM systems that complicate comparisons and these will be discussed individually in the following section.
4. Factors and settings that influence ATCM performance
4.1. SPRs used to plan scans
Higher tube currents give proportionately lower noise levels in the images and the CT scanner operator must judge the appropriate balance. These choices are affected by factors that influence the mA selection by the ATCM. CT scanner manufacturers use the SPR to plan the ATCM to be employed in a scan. There have been a number of reports about the effect of SPR on the dose and noise levels. For example, when a single postero-anterior (PA) SPR is used instead of an AP one, dose levels 30%–60% higher have been reported for GE scanners (McNitt-Gray 2011) and 13% higher for Siemens (Söderberg 2016). These differences may be due predominantly to geometrical factors. For example the projected sizes of the vertebrae and ribs are greater in the PA projection as the spine is closer to the x-ray tube. Since the ATCM uses information about the density, size and shape of the patient tissues, the ATCM will tend to select a higher mA, because the higher density structures appear to be larger in SPRs acquired with the PA projection. Moro et al (2013) observed that for the GE scanner the overall body dimensions were also larger in PA SPRs than in AP ones, and this may be the reason for the proportionately larger increases in mA planned on PA SPRs reported for some GE scanners.
When one SPR is used for planning the ATCM, effective mAs values about 15% higher have been reported for lateral SPRs as opposed to AP ones with Philips scanners (Sookpeng et al 2015) and GE ones (McNitt-Gray 2011). However Papadakis (2007) reported the reverse, so factors may vary for individual patients and scanners and assessments should be carried out for each CT scanner. Söderberg (2016) reported a 20% decrease in CTDIvol with a Siemens Sensation 16 scanner when performing two SPRs, the lateral and either AP or PA. For GE scanners the SPR performed last is the one used in planning the ATCM (Moro et al 2013) and performing the AP view last is recommended. For Toshiba CT scanners, mA modulation along the body is planned on the first SPR and the second one is used to derive the AP lateral current ratio. If the second SPR is not performed, a standard ratio will be used. But if a second scan is performed it must use the same exposure settings to allow a direct AP/Lateral comparison and failure to do this will change the operation of the ATCM. Using two SPRs is probably better in general for most CT scanners, if the scanner is designed to utilize both. The changes in ATCM performance have been referred to in terms of the change in dose level, but decreasing dose will lead to an increase in noise and so poorer image quality and all factors must be borne in mind when selecting the optimal settings. As iterative reconstruction and new techniques offer the potential for sub-mSv CT imaging, the SPR will become a more significant proportion of the dose for a scan, so use of a single SPR may become more appropriate.
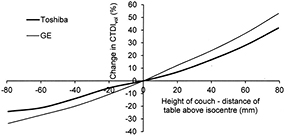
Another factor related to the SPR that influences ATCM performance is the height of the patient couch, as this will also change the apparent patient dimension recorded on the SPR, which will be larger if the patient is closer to the x-ray tube (figure 8) (Matsubara et al 2009, Supanich 2013). Scanning with the couch off-centre will also result in misalignment with respect to the bow-tie filter and this will affect the dose distribution (Habibzadeh et al 2012, Kataria et al 2016). Therefore ensuring that the patient is centred within the scan field is important for optimizing performance. This issue has been appreciated by the manufacturers and the latest versions of Philips DoseRight and Toshiba SureExposure 3D will compensate for incorrect vertical positioning of the patient (Zhang and Ayala 2014).
Figure 8. Plots showing the effect of adjustments in table height on CTDIvol values recorded for scans based on AP SPRs on an anatomical phantom for two CT scanner manufacturers.
Download figure:
Standard image High-resolution image
Generally scans will be performed within the bounds of the planning SPR, but if a region beyond the boundary is scanned, the behaviour of CT scanners varies. For the Philips 64 system the mA goes to the maximum, for Siemens it goes to that for the last known location used, for GE scanners the mA goes to the minimum for the protocol, and for Toshiba it goes to a default manual setting (Supanich 2013).
4.2. Limits set on tube currents
ATCM systems modulate mA according to the attenuation of the patient. Those using a reference image or mAs set the upper limit to that required for the most attenuating part of the patient based on the SPR, and scanners modulate the current within the chosen range, so there is no requirement to set mA limits. For scanners that employ an image noise reference, the maximum and minimum currents can be set by the operator, although values are recommended. Inappropriate choice of current limits can curtail modulation, for example setting of a minimum current of 100 mA was found to prevent any modulation for small patients on a GE Lightspeed scanner (Sookpeng et al 2014). Since contrast in images of small patients tends to be poorer, the minimum mA should be set to ensure that the image quality will always be adequate. The maximum mA limit can restrict current modulation for some patients, but the doses for larger patients have sometimes been found to be higher than necessary to achieve adequate image quality on scanners using a noise reference (Sookpeng et al 2014), so an appropriate choice of the maximum mA can provide a way in which higher dose levels can be avoided. The maximum mA limit can also be set to allow scans to be performed with a fine rather than a broad focus to achieve better resolution. The maximum achievable mA available on a CT scanner will be determined by tube performance characteristics, but if a larger mAs is required for a particular patient, then it may be necessary to increase the tube rotation time.
4.3. Image thickness and pitch
The image slice thickness changes the number of photons contributing to an image. The ATCM systems based on a reference mAs or reference image (Siemens and Philips) use the same mAs and will give a different noise level when the image thickness is changed (Sookpeng et al 2015). For scanners using an image noise reference (GE and Toshiba), a reduction in the image thickness used for acquisition by a factor of n will be accompanied by an increase in mAs by a factor of the order of √n in order to maintain the same noise level (Gutierrez et al 2007, Sookpeng et al 2015). Note that this is the slice thickness that is used for the first axial reconstruction, not values chosen subsequently for the volume reconstruction images viewed by the radiologist. Use of a standard thickness recommended by the manufacturer is generally appropriate, but if the slice thickness is reduced, the reference noise would need to be increased by about √n times if it was desired to maintain the same mAs. Modified values for the noise index have been recommended by GE for different slice thicknesses (Kanal et al 2007, McNitt-Gray 2011). The factors involved in changing the slice thickness for acquisition of scan data are large, and it is important to understand how adjustments will change the behaviour of the ATCM on each scanner. Another factor that could potentially alter mA selection by the ATCM is the pitch. Generally when pitch is lowered the mA is reduced to achieve the specified image quality reference, and the relationship between dose and image quality remains the same (Papadakis et al 2007). However, Rampado et al (2009) reported that the CTDIvol increased as the pitch was reduced on a GE Lightspeed scanner with ATCM.
4.4. Image reconstruction filter
Numerical filters are applied to each pixel within digital images either to smooth the images to reduce the noisy appearance or to sharpen them to accentuate tissue boundaries. The filters are based on weighted averaging of signals from pixels surrounding each pixel in the image. The filters utilize kernels containing the weighting factors for surrounding pixels, which depend on their relative position. Smoothing filters give a positive weighting to nearby pixels to give an averaging effect, whereas sharpening filters give a high weighting to the value of the pixel itself and a negative weighting to surrounding pixels, which preserves higher spatial frequencies in order to enhance edges. This type of filter sharpens boundaries, but creates a noisier image. The type of filter selected will in most cased not affect the mAs selected by the ATCM, but alter the appearance of the image. However, in Toshiba scanners that use a target noise reference, changes in the mAs for the scan occur when different filters are selected for the first axial reconstruction (Sookpeng et al 2015).
4.5. Important things to check
For setting up ATCM systems, the first thing to establish is that dose and image quality performance on a standard phantom are satisfactory and decide the appropriate image quality references to be used. This should be carried out preferably using a phantom with an elliptical cross section similar to that of the standard reference phantom that might be used for the scanner, or an appropriate position in a conical or sectional phantom designed for assessment of ATCM systems. A framework for the whole process is set out in table 2, but it is important to ensure that other factors are considered. Appropriate SPRs should be used to plan scans and to check whether the order in which they are performed affects current modulation. Ensure that radiographers understand the importance of centring the patient within the CT gantry for the SPR. For scanners using an image noise reference as the basis for ATCM adjustment, first assess the optimum maximum and minimum mA settings to ensure that mA is modulated over the desired ranges, and consider whether the maximum should be set to limit the dose level for larger patients. Secondly check that the recommended settings for the slice thickness used for acquisition are selected and if these are changed then appropriate settings of the noise reference are used. Another factor for some scanners is the direction in which the scan is performed and the influence this has on the starting mA and overall dose performance should be considered (Gutierrez et al 2007, Sookpeng et al 2013). A likely outcome of optimization for scanners using a noise level reference is that a higher reference noise level is used for larger patients, if this is not selected automatically.
The measurements described in this paper are ones that should ideally be performed in the first six months after installation. The aim is to understand how different factors influence the performance of the ATCM, and feed information into setting up clinical protocols for a range of examinations. This should ideally be a collaborative project involving medical physicists, radiologists and radiographers, as recommended in COMARE (2014). Once protocols have been established, then simpler tests, which might be scanning a geometrical or anthropomorphic phantom with standard settings, should be performed periodically and results compared with those established following the early testing phase.
5. Influence of ATCM on accuracy of recorded patient doses
Making comparisons between the dose performance of different CT scanners for patients can readily be achieved in terms of the CTDIvol and DLP. Surveys of these quantities based on downloads from Radiology Information Systems are recommended. Since ATCM systems change the mA throughout the scans, the CTDIvol varies for each tube rotation. Most manufacturers compute an average mAs, which they call the effective mAs, and use this to calculate values for the CTDIvol and DLP for a whole examination. Software available on the internet can be used to calculate organ and effective doses from the CTDIvol and examination settings for different scanners by various groups including ImPACT (2011) and CT-Expo (Stamm and Nagel 2002, Brix et al 2004). In addition estimates of patient doses can be obtained from conversion coefficients between DLP and effective dose (Shrimpton et al 2016). These methods use coefficients that have been derived from Monte Carlo simulations of CT examinations with fixed tube currents, and so do not take account of ATCM. Studies have shown that doses to some individual organs under ATCM can differ by 20%–40% from the values calculated using a fixed current, so if a detailed dose assessment was required, account would need to be taken of the ATCM (Khatonabadi et al 2013, Kawaguchi et al 2015, Sookpeng et al 2016). However, differences in values calculated for effective dose are only of the order of ±10%, as doses to some organs are increased and others reduced, so this is sufficient for the majority of assessments and allows surveys of DLP values still to be used for evaluation of scanner dose performance.
6. Conclusions
ATCM systems adjust mA automatically relative to patient attenuation in both the longitudinal and rotational planes. They select exposure factors to fit patient habitus, and adjust mA to account for variations in patient size and attenuation throughout a scan. Thus they have the potential to achieve significant reductions in patient dose, particularly for smaller patients, helping to optimize CT scanner performance. Their use is appropriate for most types of examination, except where there is no significant change in attenuation or there is little table movement.
ATCM systems allow adjustments to be made to maintain a chosen level of image quality linked to either image noise or factors based on a standard image. This paper sets out a framework to assist in optimization of ATCM systems. Once dose and image quality have been established for a phantom representing an average patient, the modulation performed by an ATCM system can be characterised using an elliptical phantom or phantoms with a range of dimensions, which may be conical or include a series of sections of varying size. There are many factors that need to be considered when optimizing patient protocols. For scanners using mAs or another image as a reference, selection of the appropriate reference will determine most of the other factors. However, for scanners operating on a reference system based on image noise, a higher noise level should be selected for larger patients to avoid high doses, and the operator should ensure that appropriate limits are set to allow mA modulation. ATCM performance is planned using SPRs and the order in which these are performed and the settings used are important. Generally these should be carried out as recommended by the manufacturer with the patient centred correctly within the CT gantry. It is essential that users of each scanner are aware of how the ATCM system on their specific scanner operates, and are familiar with the effects from changing different protocol parameters. Only through individual testing of each scanner with suitable phantoms coupled with audits of patient doses can the true behaviour of ATCM systems be fully established.