
Abstract
The kINPen® plasma jet was developed from laboratory prototype to commercially available non-equilibrium cold plasma jet for various applications in materials research, surface treatment and medicine. It has proven to be a valuable plasma source for industry as well as research and commercial use in plasma medicine, leading to very successful therapeutic results and its certification as a medical device. This topical review presents the different kINPen plasma sources available. Diagnostic techniques applied to the kINPen are introduced. The review summarizes the extensive studies of the physics and plasma chemistry of the kINPen performed by research groups across the world, and closes with a brief overview of the main application fields.
Export citation and abstract BibTeX RIS

Original content from this work may be used under the terms of the Creative Commons Attribution 3.0 licence. Any further distribution of this work must maintain attribution to the author(s) and the title of the work, journal citation and DOI.
Introduction
Cold atmospheric pressure plasma jets are in the focus of plasma research today. They can generate high reactivity at low gas temperatures. Several reviews on plasma jets in general [1–9], and on the application field of plasma medicine [10–18], have been published in the past few years. The atmospheric pressure plasma jet kINPen4,5 was developed from a laboratory system to a commercial plasma source for technical and medical applications. It is pen-sized and can be held like a scalpel or pencil. It can be operated with noble gases with molecular admixtures or with pressurized air. Its low gas temperature of less than 40 °C, and highly reactive non-equilibrium chemistry, make it suitable for treatment of sensitive inorganic surfaces as well as biological systems. Operation with argon as feed gas in a turbulent gas flow regime makes the kINPen a unique plasma source to study.
The plasma exits the nozzle as a visible plume about 1 cm long. With about 1 MHz, the kINPen's operation frequency lies between the kHz regime typically used for dielectric barrier plasma jets and radio frequencies of 13.56 MHz or higher. The plasma-dissipated power is approximately 1 W, with a device input power of approximately 20 W. The discharge pathway follows the air impurity distribution in the argon jet effluent. Time-resolved imaging reveals that even at 1 MHz, the plasma jet is a guided streamer discharge. Fast-moving streamer fronts mainly dissipate energy into the excitation of noble gas species. Low-intensity argon excimer radiation is quickly absorbed by ambient species below the detection limit. Electron densities can be expected to be up to the order of 1014 cm−3 in the streamer head at electron temperatures of up to 4 eV.
Diffusion of ambient species leads to the generation of primary chemical species (see figure 1). When molecular gases are admixed to the feed gas and the effluent, metastable species of argon, oxygen and nitrogen play dominant roles in energy dissipation. Due to the streamer head propagation in the effluent, the charged species distribution results in a modulating electric field. In particular, the electronegativity of the oxygen species in the surrounding influences the electric field distribution. At ambient conditions, humidity can influence the resulting stable species chemistry: chemical pathways involving water primarily originate from water molecule dissociation, forming hydroxyl radicals (OH). The OH radicals interact with air species generating further reactive species. The resulting long-living species include hydrogen peroxide, HNO3 and HNO2.
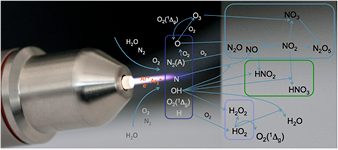
Figure 1. The atmospheric pressure plasma jet kINPen initiates strongly non-equilibrium chemical processes.
Download figure:
Standard image High-resolution imageWhen treating biologically relevant liquids, these species, together with the short- living atomic (O, N, H) and molecular species (OH, NO, HO2, NO2), form the basis for a dynamic liquid chemistry resulting in acidification of non-buffered solutions. This acidification involves the formation of peroxynitrite. Reactive species are either transported into the liquid for the case of a high Henry's constant species, are generated within the liquid by plasma components such as VUV radiation, or are the result of a reaction chain within the liquid. Species detected in the liquid phase include OH radicals, hydrogen peroxide, superoxide anion radicals, singlet oxygen, nitrite and nitrate.
The kINPen has been used to study plasma surface interaction and processes in plasma medicine. Fundamental research has shown that the kINPen can be adjusted to inactivate pathogens and stimulate human cells.
This topical review of the atmospheric pressure plasma jet kINPen is structured as follows: in section 1, the plasma source kINPen and its various models are introduced, operating parameters are described, and the distribution of kINPens around the world is presented. Section 2 gives an overview of different diagnostic approaches applied and developed for studies of the kINPen. The emphasis is put on methods and techniques. A résumé of results from investigations on the physics and chemistry of the kINPen is given in section 3. The final section 4 of the review summarizes the present state of applied research in select fields of application. The paper is divided into the chapters detailed in the above table of contents.
1. The plasma source kINPen
The kINPen was developed and investigated at the Leibniz-Institute for Plasma Science and Technology, INP Greifswald, Germany [20], and different devices for industry, human medicine and veterinary medicine have been commercialized by neoplas GmbH, Greifswald, Germany, as well as by neoplas tools GmbH, Greifswald, Germany. A description of the various available devices is given below.
The kINPen is a plasma jet consisting of a pin-type powered electrode in a dielectric ceramic tube with a grounded outer electrode (see figure 2). The 'k' in the name originates from Dr E Kindel, who devised the first jet at INP, and the 'pen' comes from the pen-like usability of the plasma jet. The centred driven electrode has a diameter of 1 mm and is sharpened to a tip. The distance from the tip to the nozzle exit is about 3.5 mm [21], the inner diameter of the dielectric capillary is 1.6 mm and the outer diameter is 2 mm. The capillary protrudes from the metallic head by nearly 2 mm. The plasma jet has interchangeable heads consisting of an outer cone-shaped grounded electrode, a gas diffusor system, a dielectric tube and an inner driven electrode. The head can be screwed onto the hand-piece in the size of a large felt pen. This geometry is well suited for the flexible treatment of complex surface structures. The hand-piece is connected to the power and gas supply unit via a flexible tube about 1 m in length. The kINPen can be operated with noble gas and molecular admixtures of up to 2% using the noble gas head, or with molecular gases such as oxygen, nitrogen or pressurised air using the molecular gas head, which does not have a dielectric tube. The gas flow typically lies between 3 and 5 standard litres per minute (slm). Operated with pure argon, the jet emits a 9 to 13 mm long visible plasma plume (termed 'effluent' throughout this review). With feed gas admixtures of oxygen, the visible plasma effluent length varies between 13 and 3 mm for oxygen fractions of 0%–1%, respectively [22]. The sinusoidal operating frequency is typically about 1 MHz, depending on the type of kINPen used. Power dissipation inside the plasma of 0.3–3.5 W has been reported at a high voltage of 2–6 kV at the driven electrode. The system power lies at about 20 W. The kINPen is CE certified.
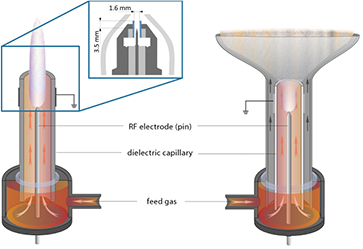
Figure 2. The kINPen schematics. Left: pen-like principle, right: large-area treatment principle. Inset: the kINPen head geometry with a gas curtain device (light grey), electrodes (dark grey) and a dielectric capillary (blue) [19].
Download figure:
Standard image High-resolution imageTable 1. The parameters of the different kINPen models.
| Type | P/W | F (MHz), U(V) | Gas | Flow (slm) | TG (°C) | Remarks | Example ref. |
|---|---|---|---|---|---|---|---|
| kINPen01 | PTotal: up to 120 W | 27.12 MHz and others | He, Ar, air | 3–5 | <80 | Matching unit in hand piece | |
| kINPen02 | PTotal: 90 W | 27,12 MHz | He, Ar, air | 3–5 | <80 | Resonance adjustment in electronics unit | |
| kINPen03/04–07 | PTotal: 65 W | 2 MHz | Ar, He + 2% mol. admixture, air | 3–5 | <80 | Matching technique changed | [23] |
| kINPen08 | PTotal: 65 W | 1.7–2 MHz | Ar + 2% mol. admixture | 3–5 | <80 | Foot pedal, matching optimized | [24, 25] |
| kINPen09 | PDissipated: 1.9–3.2 W | 0.8–1.1 MHz | Ar, He + 2% mol. admixture, air | 3–5 | <50 | Manual matching, CE-certification, miniaturization of electronics | [19] |
| kINPen09/10/11 | PDissipated: 1.9–3.2 W | 1.1 MHz | Ar, He + 2% mol. admixture, air | 3–5 | <50 | Automatic matching through PLL tuner, TTL signal | [26] |
| kINPen Sci | PDissipated: 1.9–3.2 W | 940 kHz | Ar, He + 2% mol. admixture, air | 0.5–5.5 | <50 | External pulsing, TTL signal, current and voltage measurement ports, external gas cooling | [27] |
| kINPen MED | PDissipated: <3,5 W | 1 MHz | Ar | 3–5 | 35–38 | Medical certification (including all required technical changes) | [28] |
| kINPen IND | PDissipated: <3,5 W | 1 MHz | Ar, He + 2% mol. admixture, air | 3–5 | 35–50 | Gas unit extensions, XYZ-moving stage, optimization for industrial applications | [29] |
| kINPen VET | PDissipated: <3,5 W | 1 MHz | Ar | 3–5 | 35–38 | Reduced energy dissipation | [30] |
1.1. kINPen development
The kINPen was first developed and investigated as a plasma jet for biological [34, 35], technical [23, 36] and sensitive surface treatment applications. The most used operation frequencies for kINPen01 to kINPen07 are 1.5 MHz, 13.56 MHz, 27.12 MHz and 40.68 MHz [23, 37]. A line-up of the different kINPen models is shown in figure 3 and the respective development steps are listed in table 1. A further development led to the kINPen08 [24, 25], which has an operation frequency of around 2 MHz and has a higher dissipated power than following kINPens [38]. It is preferably used in surface, material [24, 39] and biofilm removal applications [25, 40]. The kINPen09 has an operating frequency of around 1 MHz with lower power dissipation into the discharge [20]. Many biological in vitro studies have been performed with the kINPen09, for example, in the research cluster Campus PlasmaMed [41] and in the Centre for Innovation Competence ZIK plasmatis at INP Greifswald. Here, the physical investigations and chemical studies described in the present work were performed on the kINPen09 in its original version, as well as in a follow up version, which included automatic frequency matching (see e.g. [22]). In 2013, the kINPen MED [28] (neoplas tools GmbH, Greifswald, Germany) was developed. It was the first plasma jet to receive certification as a medical device (class IIa). A fully sterilizable distance piece [42] guarantees safe working distances. A review of the technical, biological and pre-clinical characterization of the kINPen MED and its clinical relevance is presented in [17]. The kINPen MED is a 'single-button' machine optimized for clinical applications. It is pulsed with a frequency of 2.5 kHz and a duty cycle of 50%. In order to gain better access and control over the physical parameters, the kINPen Sci [26] was developed for studies within the Centre for Innovation Competence plasmatis [27]. This device allows external control of the pulsing, as well as access to the voltage and current signal. The power is adjustable and different gases can be used. The kINPen MED is operated with the same voltage on the driven electrode as kINPen09–11 and the kINPen Sci, and it has automatic matching like kINPen10/11 and the kINPen Sci. Excitation of argon species is dominantly determined by the electrode voltage, and therefore the peak argon metastable densities that drive the reaction kinetics of the kINPen (see sections 2.6.1 and 3.7) can be expected to be the same for kINPens with similar geometries and electrode voltages. Pulsing of the kINPen MED does not affect the generation kinetics of primary species, so that the reactive species composition is expected to be the same. Further commercial developments of the kINPen include the kINPen IND [29] for industrial applications and the kINPen VET [30] for applications in veterinary medicine (neoplas GmbH, Greifswald, Germany). Figure 4 shows that the kINPen (kINPen08, 09, 10 and 11, MED, VET, IND) is used throughout the world in universities, companies, clinics and research institutes.
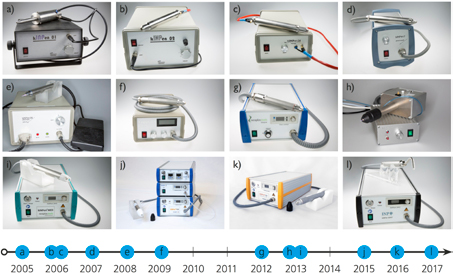
Figure 3. (a) kINPen01, (b) kINPen02, (c) kINPen04 [23], (d) kINPen07, (e) kINPen08 [25], (f) kINPen09 [20], (g) kINPen 10/11 [26], (h) kINPenSci [27], (i) kINPen MED [28] with distance piece, (j) kINPen IND [29], (k) kINPen VET [30], (l) kINPen Dent prototype (a)–(h), (l) Reproduced with permission from [31]. © 2017 INP Greifswald. (i) Reproduced with permission from [32]. © neoplas tools GmbH. (j), (k) Reproduced with permission from [33]. © neoplas GmbH.
Download figure:
Standard image High-resolution image
Figure 4. The distribution of the kINPen plasma source (source: INP Greifswald, neoplas GmbH; neoplas control GmbH, neoplas tools GmbH).
Download figure:
Standard image High-resolution image1.2. Gas curtain for control of ambient conditions
Reactive species generated by plasmas in ambient conditions are strongly influenced by ambient species. In particular, dielectric barrier discharges are dominated by air composition, but plasma jets working with noble gases, such as the kINPen, are also influenced by air species diffusing into the active effluent. For a study of reactive species generation pathways and for a control of the reactive species generation by the kINPen, a gas curtain was developed, which shrouds the active effluent with a shielding gas [43, 44].
The gas curtain allows control of the ambient particle composition [27] (see figures 5(a) and (b)) and thus the physical effects (see e.g. [47]), chemical effects (see e.g. [48]) and biological effects (see e.g. [49]) can be studied. The gas curtain also allows the kINPen to be operated in confined volumes or beakers with pure argon as the feed gas, as it generates a guiding gas curtain around the active effluent, which in a noble gas environment inhibits the formation of flash-overs to the grounded electrode as they are described in [50]. Operation of the kINPen above a liquid-filled Petri-dish will deplete the air above the liquid, as shown by fluid dynamics calculations [45]. Using a gas curtain allows us to control the conditions in the immediate vicinity of the active effluent (see figure 5(c)). For in vitro studies in plasma medicine, this means that controlled conditions of humidity and gas composition for the treatment of cell culture media, for example, (see figure 5(d)) can be achieved.

Figure 5. (a) Operation of the kINPen09 with an air gas curtain, and (b) an oxygen gas curtain. (c) A computational fluid dynamics (CFD)-simulation of the gas flow of a kINPen equipped with a gas curtain in a Petri dish. (d) A photograph of a kINPen09 treating a liquid in a Petri dish [46]. (a)–(c) © 2012 IEEE. Reprinted, with permission, from [45]. (d) Reproduced with permission from [46]. CC BY 4.0.
Download figure:
Standard image High-resolution imageRecently, several studies of other plasma jets based on a gas curtain or on differently imposed control of the atmosphere that surrounds the active plasma have been performed (see e.g. [51–54]).
1.3. Future kINPen developments
The kINPen plasma source concept is continuously undergoing further investigations and development. Two main directions are being pursued at present: the treatment of small and complex geometries and the treatment of larger areas. The kINPen concept has been adapted to enable endoscopic applications in medicine, e.g. for the treatment of pulmonary tuberculosis [28]. Endoscopic applications have been envisaged by several groups and promise medical treatment inside the human body (see e.g. [55–57]). Similar issues relating to the use of plasma in small and difficult-to-reach cavities arise in dentistry. Plasma has proven to inactivate bacteria [58] and fight biofilms [25, 59–61]. The kINPen has been proven to be effective in biofilm removal [25, 39, 60–63], and a tool that resembles a dental drill in shape and handling is sought.
Furthermore, approaches to the treatment of larger areas are being researched. Large-area micro-plasma arrays are used in lamp technology, for example [64]. The approach can be transferred to jet-like plasmas using multiple jet nozzles simultaneously for larger surface treatment [28]. Figure 6 shows different concepts enabling larger or more complex surface treatment with plasma jet arrangements that are suitable for further kINPen development.
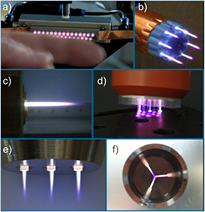
Figure 6. (a) A large linear array of 28 plasma jet nozzles (digitally enhanced) (INP Greifswald—2010); (b) a rotationally oriented plasma array (INP Greifswald—2008); (c) an enlarged plasma jet (INP Greifswald—2012); (d) a multi-jet array operated in helium (INP Greifswald—2011); (e) a kINPen plasma array with three concentric nozzles (INP Greifswald—2012); (f) a concentric rotating jet arrangement for the treatment of implants (INP Greifswald—2015). Reproduced with permission from [31]. © 2017 INP Greifswald.
Download figure:
Standard image High-resolution image1.4. Distinction from other plasma sources
The cold plasma source kINPen has gained much attention, not least due to its application in medicine. Hotter plasmas have been in use in medicine since as early as the 1970s, when ERBE developed the plasma coagulator replacing the electrode typically used for coagulation (the stopping of blood flow) by a conducting argon plasma channel [65] (see figure 7(c)). Several surgical plasma sources are commercially available today and used in clinics. A distinct difference to novel cold plasma sources is that surgical plasma treatment alters the tissue on a macroscopic level, ranging from tissue removal and the stopping of blood flow, to superficial delamination or structural modification. Figure 7 presents a collection of medical plasma sources including hotter (figures 7(a)–(d)) and cold plasmas (figures 7(e)–(h)), with the respective working principle for the cold plasma sources (figures 8(a)–(c)).
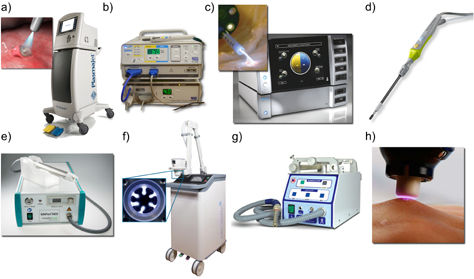
Figure 7. Top row: selected hotter plasma sources currently in use in surgery. (a) PlasmaJet [66]; (b) the electrosurgical system SS-200E/Argon 2, with a connected electrosurgical Canady Vieira hybrid plasma scalpel by US Medical Innovations [67], LLC Canady Hybrid Plasma™ [68]; (c) the argon plasma coagulator VIO 3/APC 3 [69, 70]; (d) the PlasmaBlade [71, 72]; lower row: medical cold plasma sources in clinical use; (e) the kINPen MED [32, 73]; (f) the SteriPlas [74–76]; (g) the Plason [77–79]; and (h) the PlasmaDerm [80, 81]. (a) Reproduced with permission from [66]. © Plasma Surgical Roswell, USA. (b) Reproduced from [68]. CC BY 4.0. (c) Reproduced with permission from [69]. © Erbe Elektromedizin GmbH. (d) Reproduced with permission from [71]. © Medtronic, Minneapolis, USA. (e) Reproduced with permission from [32]. © 2017 neoplas tools GmbH. (f) Reproduced with permission from [74]. Adtec Healthcare LTD, Hounslow, UK. (g) Reproduced with permission from [79]. © Onkocet LTD, Bratislava, Slovakia. (h) Reproduced with permission from [80]. © CINOGY GmbH Duderstadt, Germany.
Download figure:
Standard image High-resolution image
Figure 8. The working principle of (a) cold non-equilibrium plasma jets, (b) hot non-equilibrium plasma generation (microwave and spark) with downstream cooling, and (c) floating electrode dielectric barrier discharge.
Download figure:
Standard image High-resolution imageFigure 7(a) shows the PlasmaJet device made by Plasma Surgical, Roswell, USA, which can be used for dissection, vaporization or sealing. Figure 7(b) shows the Canady Hybrid Plasma™ Scalpel (US Medical Innovations, Takoma Park, USA) used in cancer surgery [68]. Figure 7(d) shows the PlasmaBlade, which is an rf-excited plasma surgical device that operates at temperatures between 50 °C and 100 °C [82, 83]. The plasma sources in figures 7(a)–(d) are used to remove, cut or seal tissue in surgical procedures. The approach of using cold non-thermal plasmas (figures 7(e)–(h)) for therapy is new and different, and their influence on biologic systems is subtler. Apart from the antibacterial action, the physics of cold plasmas acts on a cellular level triggering biological responses that promote healing. To date, to our knowledge, three plasma source concepts have been certified for the treatment of skin diseases, including the treatment of chronic wounds (see figure 8). Certified devices on the market apart from the kINPen MED (figure 7(d)) are the SteriPlas (Adtec Healthcare Ltd, Hounslow, United Kingdom) [84] (see figure 7(f)) and the Plason NO generator distributed by Onkocet LTD, Bratislava, Slovakia [85], shown in figure 7(d), both of which generate a hotter plasma than the kINPen and subsequently cool the active gas down to its operating temperature (see figure 8(b)). A further cold device is a floating electrode DBD: the PlasmaDerm (CINOGY GmbH, Duderstadt, Germany) (figure 7(h)) [86], which generates the plasma in air with skin or a liquid as the counter electrode (see figure 8(c)). Further plasma devices are being developed by various companies. A review on commercial plasma sources can be found in [87], for example.
Plasma jets used for technological applications are, in most cases, operated with a much higher dissipated power [88, 89]. Examples are the Plasma Brush PB3 by Relyon Plasma GmbH, Regensburg, Germany, the Plasma MEF jet by Tigres GmbH, Marschacht, Germany, the microwave plasma jet by Heuermann HF-Technik GmbH, Aachen, and the Openair® Plasma System by Plasmatreat USA, Inc., Elgin, IL, USA.
Several laboratory-designed plasma sources are also operated with the noble gas argon (see e.g. [90–94]), and a few are even similar in geometry to the kINPen [95–97]. These are, however, typically operated at higher frequencies, and the tip of the needle electrode is, in some cases, inside the ring electrode or there is no grounded electrode present. This results in a different energy dissipation distribution, typically a hotter effluent, and higher reactive species densities. Furthermore, at higher excitation frequencies, argon excitation will not exhibit concentration modulation, as can be seen in the dynamic argon metastable measurements on the kINPen, shown in section 2.6 in figure 23. This will render streamer formation in these high-rf-excitation frequency plasma jets unlikely.
2. Plasma diagnostic and modelling techniques used on the kINPen
Due to their typically small dimensions and high density gradients in time and space, atmospheric pressure plasmas are difficult to diagnose qualitatively as well as quantitatively. A variety of diagnostic techniques have successfully been applied to the kINPen in the past. In the following section, an overview is given on the different techniques, which can be divided into direct, indirect, time- and/or space-resolved, and time- and/or space-averaged methods.
Direct diagnostics of the plasma jet effluent have been performed in averaged approaches by optical emission spectroscopy (OES), absorption spectroscopy (AS), Schlieren measurements, phase-resolved OES, as well as scattering and fluorescence laser spectroscopy (see figure 9). Indirect measurements were performed by AS of the reactive species collected in a multi-pass cell, as well as by the diagnostics of the treatment results in gas, liquid or solid phases, and especially in biological systems. The following overview of the diagnostics that have been applied to the kINPen presents the respective methods, highlighting their advantages and disadvantages. Only for broadband spectroscopic techniques exemplary overview spectra are shown as a basic characterization of the kINPen. Detailed results from all other diagnostics are presented in section 3 within the context of kINPen physics and chemistry. While the publications referred to in section 2 are dominantly on kINPen experiments, the methods described are generally relevant for most atmospheric pressure plasma jets. Where available, the experimental setups used specifically on the kINPen are shown. Diagnostic techniques used on other jets are presented, where the works help to highlight the specific technique's relevance. The section does not claim to give a comprehensive overview of the diagnostics of atmospheric pressure plasma jets. For more information on techniques and available diagnostics, the reader is referred to the following reviews [7, 87, 98–109], for example.
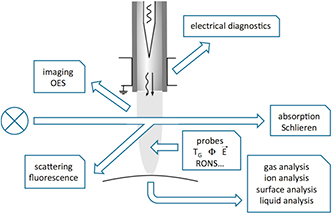
Figure 9. Diagnostic methods applied to the kINPen.
Download figure:
Standard image High-resolution image2.1. From spectral, time- and space-integrated to highly resolved imaging
OES is a standard diagnostic technique for plasmas [98]. It probes the spontaneous and induced emission emitted by excited species in a plasma. Through the spectral identification of emission lines, the presence of species can be determined and dynamic behaviour as well as energy dissipation processes can be studied. A quantitative or even qualitative analysis of reactive species densities—especially for non-equilibrium plasmas—is hard to achieve. Relevant excitation and quenching processes need to be considered in order to gain reliable information. The total time-integrated emission intensity does hold information on the discharge length and energy-related processes (see e.g. figure 40). Through image analysis, for example, structures in the flow field induced by pulsing of the plasma jet have been visualized [110]. With sufficient care in non-equilibrium conditions, molecular optical emission spectra can yield rotational and sometimes gas temperature values [111, 112]. Temperature information can also be gained from line broadening mechanisms [113].
For the kINPen, several works have reported on OES measurements. An overview spectrum of the kINPen09 operated in argon can be seen in figure 10(a) [20]. A close-up of the UV spectrum is seen in figure 10(b). This spectrum was acquired at a lower gas flux and resultantly a higher gas temperature; NO features can clearly be seen. Spatial and time-resolved OES yields insights into the relevance of gas admixtures or impurities [115]. OES can be used to observe the running-in time of the kINPen [116]. The kINPen also emits low levels of VUV radiation [38, 117]. In [118], OES was used to gain information about the electron energies. The kINPen Sci operated in helium (figure 11) exhibits different excitation features compared to the argon operation mode [47]. Clearly visible is the hydrogen Balmer Hα-line. Furthermore, OH emission in the UV appears to be much more pronounced in helium than in argon. One reason for this is the energy dissipation through highly energetic helium metastable species.

Figure 10. (a) An overview spectrum of the kINPen09 with argon as the feed gas operated in air [20] as a function of the distance x to the nozzle taken perpendicular to the gas flow. The inset shows the UV emission exhibiting OH and nitrogen emission bands. (b) A close-up of the UV-emission spectrum of a kINPen09 operated at an argon flux of 3 slm [114]. (a) [20] John Wiley & Sons. © 2009 WILEY-VCH Verlag GmbH & Co. KGaA, Weinheim. (b) Reproduced from [114]. © IOP Publishing Ltd. All rights reserved.
Download figure:
Standard image High-resolution image
Figure 11. An overview spectrum of the kINPen Sci operated in helium with nitrogen shielding gas (data from [47]).
Download figure:
Standard image High-resolution imageInformation about discharge dynamics and electron excitation processes can be gained by phase-resolved OES (PROES) [119]. As an averaging technique, PROES requires repetitive stable discharges with stable time-resolved features. Filamentary discharges with stochastic distribution, as is the case for the kINPen, are harder to study; however, information from PROES measurements can still be gained. PROES uses a spectrally filtered iCCD camera, which records a gated image from each excitation period of the operating frequency at a fixed phase position on the image chip. These acquisitions are accumulated, i.e. averaged, until the signal-to-noise ratio is low enough for data evaluation. In the next step, the phase is shifted and the process is repeated; the principle is shown in figure 12.

Figure 12. The principle of phase-resolved OES on the kINPen [47], showing the wavelength-filtered iCCD camera and the triggering scheme changing the trigger position of the camera gate with respect to the excitation frequency of the plasma source. iCCD: intensified CCD camera, TTL: trigger pulse signal. Reproduced with permission from [47]. © IOP Publishing Ltd. All rights reserved.
Download figure:
Standard image High-resolution imageWith PROES, so-called plasma bullets have been diagnosed in plasma jets [4, 120], and for the first time in radio-frequency (rf) jets, these plasma bullets have been detected in the kINPen. These measurements can also be used to validate simulations [47] (see section 3.4). A detailed description of results and insights from PROES experiments is presented in sections 3.2–3.4.
2.2. Absorption spectroscopy
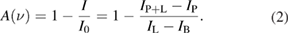
Absorption spectroscopy (AS) is one of the few intrinsically quantitative methods for the diagnostics of reactive species in plasma jets. A detailed description of AS on atmospheric pressure plasma jets, of which the following is an extract, can be found in [107]. The absorption of light by the plasma-generated species is a measure of their density. The intensity attenuation of a probing light beam as a function of the absorber species density N is described by the Beer–Lambert law [121]:

where I(λ) is the transmitted light intensity, I0(λ) is the intensity of the probing light, σ(λ) is the wavelength-dependent absorption cross-section and L is the absorption path-length. Nσ is defined as k(λ), which is the wavelength-dependent absorption coefficient [107]. As several processes lead to a broadening of the spectral absorption line profile, a reliable measurement of the absorbance can only be gained by the integrated absorption coefficient over an absorption line σint. For a measurement of the absorption, four separate spectral measurements—namely, plasma emission (IP), background light (IB), probing light intensity (IL), and probe light and plasma light combined (IP+l)—need to be measured. From the fractional absorption A(ν) (see equation (2)), the absorber densities can be calculated [122]
A major disadvantage of AS as a diagnostic method is that it is, in principle, a line of sight technique. Nevertheless, if a spatial absorption profile can be recorded, the so-called Abel inversion can reconstruct the spatially resolved absorber densities [123]. Using analytical functions for the density profile, more complex density distributions can also be determined [26]. To evaluate the measurements, the Einstein coefficients or absorption cross sections of a species need to be known, for which a variety of databases are available [107]. AS usually has a lower sensitivity than LIF-spectroscopy, for example. Due to the typically small absorption lengths available in atmospheric pressure plasmas, measures have to be taken to enhance the absorption signal.
Several reactive species produced by the kINPen have been diagnosed by AS either directly in the effluent (see figures 13(b) and (d)–(h)) or remotely in a multipass absorption cell (see figures 13(a) and (c)). Due to the strong absorption cross-sections in the ultra violet wavelength regime, UV AS can be used to investigate the plasma effluent for ozone (see figure 13(g)) or OH (see figure 13(h)) (e.g. [22, 122, 129]), for example. UV AS on OH has been compared to absolutely calibrated OH-laser-induced fluorescence (LIF) spectroscopy [129]. For the case of ozone measurements, UV absorption measurements have been validated against infrared quantum cascade laser (QCL) AS in a multipass cell (see figure 13(c)) [22, 130]. QCLAS of ozone has been compared to Fourier transform infrared absorption (FTIR) spectroscopy (see figure 13(a)) [131]. In [128], the influence of nitrogen species on the ozone absorption signal of the kINPen has been excluded. Direct measurements of species densities in the kINPen effluent were performed by tunable diode laser AS (TDLAS) (see figure 13(f)) on helium metastable species probing the He (23S1) state [21], as well as on argon metastables using the Ar(1s5 − 2p9) transition at 811.53 nm [124], which was also studied time-resolved in a previous paper on a kINPen like plasma jet geometry at operating frequencies of 40 KHz [132]. The argon metastable measurements in [124] were performed with a novel type of acousto-optic modulated (AOM) laser [133], which has a broad tuning range allowing complete absorption profiles to be measured, even at atmospheric pressure. To increase the sensitivity of the absorption measurements, a new type of optical multipass cell was developed (see figure 13(a)), where a laser beam is guided back and forth and led through a single focal point in the centre of the multipass cell [125], which had been constructed from standard optical equipment. A novel AS technique was applied in [127], where the absorption of plasma-generated argon excimer radiation at 124.6 nm by ambient molecular oxygen was studied (see figure 13(e)). It was thus possible to determine the diffusion of ambient species into the effluent. Recently, highly sensitive measurements of HO2 have been performed on the kINPen Sci with optical feedback cavity-enhanced AS in the infrared (see figure 13(d)). It has to be highlighted that this diagnostic technique is extremely sensitive: the multiple beam-passes through the measurement cavity result in an effective absorption length within the plasma jet effluent of 95 m, yielding a detection limit of 5.5 · 10−12 cm−3 [126]. The use of multipass cells that collect reactive species allows the sensitive measurement of longer living species such as ozone, NO2 or H2O2. Several studies of infrared active species have been performed by QCL AS for the first time at atmospheric pressure [22, 114, 131]. The earliest use of FTIR technology on a kINPen predecessor plasma jet was performed in [134]. Since then, several studies have been performed, characterizing the kINPen for various reactive oxygen and reactive nitrogen species [19, 22, 50, 115, 128, 131] (see figure 14). Both QCL-AS and FTIR-AS measurements have proven to be useful as input to model calculations [19, 44, 124, 135]. Results of the described absorption spectroscopic techniques are shown in section 3.7.
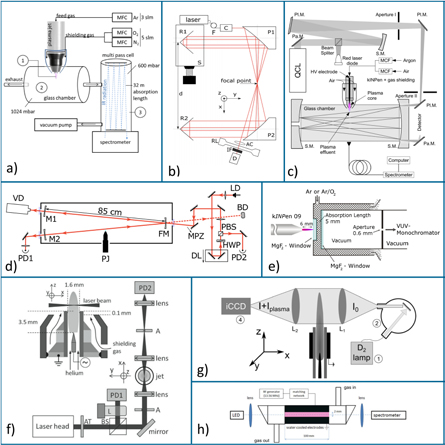
Figure 13. Absorption spectroscopic setups used on the kINPen: (a) multipass Fourier transform infrared AS. Reproduced from [124]. © IOP Publishing Ltd. CC BY 3.0. (b) Focal-point multipass cell. Reprinted with permission from [125]. Copyright 2016, AIP Publishing LLC. (c) Quantum cascade laser multipass cell AS. Reproduced from [114]. © IOP Publishing Ltd. All rights reserved. (d) V-shaped optical cavity-enhanced AS. Reproduced from [126]. © IOP Publishing Ltd and Deutsche Physikalische Gesellschaft. CC BY 3.0. (e) VUV-self AS. Reproduced from [127]. © IOP Publishing Ltd. All rights reserved. (f) Tunable diode laser AS. Reproduced from [21]. © IOP Publishing Ltd. All rights reserved. (g) Imaging UV AS. Reproduced from [128]. © IOP Publishing Ltd. All rights reserved. (h) UV-diode laser AS. Reproduced from [122]. © IOP Publishing Ltd. All rights reserved. The most relevant abbreviations are: PD: photo detector, BS: beam splitter, A: aperture, M: mirror, FM: focal mirror, LD: laser diode, HWP: half wave plate, D: detector, IF: interference filter, F: optical fibre, iCCD: intensified CCD camera, QCL: quantum cascade laser, PJ: plasma jet, R: reflector.
Download figure:
Standard image High-resolution image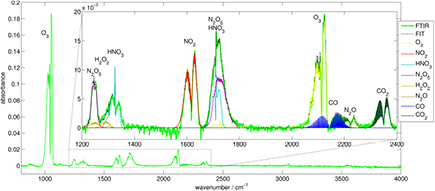
Figure 14. An overview FTIR spectrum of the kINPen Sci effluent collected in a multipass cell at 600 mbar. Reproduced from [124]. © IOP Publishing Ltd. CC BY 3.0.
Download figure:
Standard image High-resolution image2.3. Laser spectroscopy techniques
Laser-induced fluorescence (LIF) spectroscopy has been widely used for diagnostics of atmospheric pressure plasma jets [100]. LIF spectroscopy has the sensitivity and spatial resolution required for small-scale atmospheric pressure plasmas. However, the experimental effort is high, and typically complex procedures have to be performed in order to gain quantitative data [136].
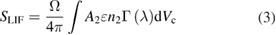
For LIF spectroscopy, an atom or molecule is transferred from a lower electronic energy level to a higher energy level, by typically pulsed laser radiation. The subsequently emitted fluorescent photon is then detected, yielding information on the density of the excited level and the lower energy level dependent on the laser energy. A schematic of a suitable experimental setup is shown in figure 15, showing the volume of observation VC formed by the cross section of the solid angle of observation and the excitation volume of the laser beam, yielding a spatial resolution of a fraction of a cubic millimetre. Beam shaping elements and time selection modules in excitation and detection by an intensified detection system allow for highly space-, time-, and spectrally resolved LIF data. The excitation of the probed atom or molecule can occur through one or two photons, distinguishing one-photon LIF from two-photon absorption (TA)LIF spectroscopy. Under certain conditions, which lead to the validity of several simplifying assumptions, a two-level energy system for the LIF energy scheme can be assumed [137]. In this case, the lower energy state density can be gained from the LIF signal, SLIF, by inserting the solution of the rate equation for the population density of the excited energy state as a function of the laser intensity into:
where Ω is the solid angle of detection, ε is the wavelength-dependent efficiency of the detection system and Γ is the line profile of the transition. A2 is the spontaneous emission coefficient summed over all transitions from the excited to the lower level. The only unknown parameters are the wavelength-dependent optical parameters of the system and the collisional quenching of the excited state leading to the loss of fluorescence. Both need to be determined from calibration measurements in order to gain absolute densities from the LIF measurements. A more detailed description of LIF spectroscopy approaches can be found in [2, 7, 98, 100], for example. Briefly, calibration needs to account for the wavelength-dependent properties of the calibration system. For LIF measurements, calibration can be performed by Raman or Rayleigh scattering [136]. If only selected levels are probed, the ground state density needs to involve consideration of the Boltzmann population distribution [96]. For LIF spectroscopy on molecules, complexity is added through rotational and vibrational energy dissipation of the excited states. Here, either measure has to be taken to exclude an influence of these energy dissipation processes on the LIF signal—or their influence needs to be taken into account [95, 100, 136]. Calibrated LIF measurements have been used to determine OH concentrations in the kINPen [129], and relative OH-LIF measurements have been performed to gain an insight into H2O2 kinetics [115]. Both measurements show a linear correlation of feed gas humidity and OH concentration up to a 2000 ppm water admixture. LIF spectroscopy has been used to determine NO concentrations in the kINPen, in comparison with molecular beam mass spectrometric measurements of NO [138]. In [139], LIF spectroscopy for the first time was applied to detect nitrogen metastable N2(A3 ) in cold plasma jets. Apart from species detection, LIF spectroscopy has also been used to measure ambient species diffusion by the quenching-related reduction of the fluorescence decay time for other plasma jets [140, 141], as well as for the kINPen Sci [138]. Furthermore, also in [138], the LIF spectrum of NO(A-X)(0–0) excitation was collected from the plasma effluent. Using planar LIF spectroscopy, a single shot map of the OH-fluorescence in the kINPen effluent was measured [142, 143]. A stereoscopic measurement, which simultaneously determined the discharge pathway, illuminated the effect of ambient species on the plasma stream [143]. A detailed description of LIF spectroscopic results is given in sections 3.1, 3.5 and 3.7.
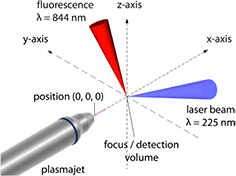
Figure 15. A typical setup for two-photon LIF measurements. Reproduced from [127]. © IOP Publishing Ltd. All rights reserved.
Download figure:
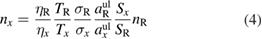
Standard image High-resolution imageFor optical transitions from the ground state of light atoms, single photon LIF requires high-energy VUV photons due to the electronic transition's energy of greater than 6 eV. Vacuum ultraviolet laser radiation requires great experimental effort to exclude the absorbing atmosphere. An easier solution to measuring ground state densities of hydrogen, oxygen or nitrogen, for example, is TALIF-spectroscopy. As TALIF spectroscopy is a two-photon process, the fluorescence signal has a quadratic dependence on the laser energy. This makes highly space-resolved measurements possible, since the two-photon processes only occur in the laser focus points. A simple calibration of the wavelength-dependent properties of the experimental system, by Rayleigh scattering, for example, which is linear to the laser energy, is not possible. The most commonly used method to perform calibration of TALIF measurements is by comparing the TALIF signal S of the species of unknown density (X) to a TALIF signal of a reference species R of known density:
where aul is the branching ratio of the fluorescence transition, T and η describe the wavelength-dependent properties of the experimental setup, and σ is the two-photon absorption cross section. If the wavelengths of the two-photon excitation and the fluorescence are close enough, the wavelength-dependent properties cancel each other out.
As reference species, typically, noble gas species are used [144]. This has been successfully applied for the first time to a cold plasma jet for the measurement of atomic oxygen in a closed environment [145]. In [146], an in situ calibration was developed, using a microwave plasma jet with xenon feed gas admixture.
Several two-photon LIF measurements have been performed on the kINPen. With separate xenon calibration measurements, atomic oxygen was determined by TALIF spectroscopy [127, 147]. Detailed results are shown in section 3.7 as well as in section 4.1, where the atomic oxygen concentration profile determined by TALIF spectroscopy is correlated to polymer etching by the kINPen [147].
2.4. Non-spectroscopic methods
The kINPen has not only been studied by spectroscopic methods, but also by various non-spectroscopic methods, as described in the following.
2.4.1. Molecular beam mass spectrometry.
Molecular beam mass spectrometry (MBMS) was used to study the diffusion of ambient species, the spectrum of charged species, and selected oxygen and nitrogen species [27, 138, 148].
For MBMS, it is important to sample the plasma at ambient conditions and quickly reduce the pressure to gain a molecular beam that can be studied with a mass spectrometer. Typical for molecular beam mass spectrometers are the differential pumping stages, which reduce the pressure stepwise down to a pressure of about 10−6 Pa (see figure 16). The first pumping stage, which has a small orifice of a few 10–100 µm, is crucial. Behind the orifice, the collected gas accelerates and forms a Mach cone. As close as possible to this orifice on the lower pressure side, a skimmer collects the sampled gas inside the so-called 'zone of silence', leading the sampled volume to the second pumping stage. Here, a molecular beam forms where no collisions of the particles take place, freezing the chemical composition of the beam. A second skimmer collects this beam to the third pumping stage containing the mass spectrometer. Two approaches to perform mass spectrometry on atmospheric pressure plasmas have been published. One MBMS approach uses a stationary orifice and skimmer system and strong vacuum pumps, which pump the respective stages to reach the desired low pressure (used in [27] for measurements on the kINPen, for example). A second MBMS approach described in [102] uses a rotating disc with a skimmer which passes the stationary sampling orifice at each turn. If the skimmer is not at the sampling orifice, the rotating disc covers the orifice, allowing a lower background pressure to be reached. Molecular beam mass spectra show the mass to charge ratio of a species. Due to various effects, such as species-dependent diffusion inside the MBMS, absolute concentrations can only be determined by calibration procedures in some cases [102].
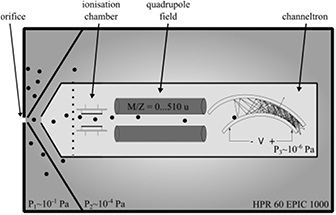
Figure 16. The mass spectrometric setup for the kINPen from [49] after [27]. Reprinted with permission from [49]. Copyright 2015, AIP Publishing LLC.
Download figure:
Standard image High-resolution imageFor the detection of neutral species like NO, molecules entering the MBMS system need to be ionized. Thus, for calibration, the ionization dissociation fraction also needs to be determined [138], adding to the complexity of spectra evaluation. If these obstacles can be overcome, MBMS is a powerful technique that can determine neutral, charged and metastable species [149, 150]. Results of MBMS measurements are presented in section 3.5, where an overview spectrum of negative ions in humid feed gas conditions and a positive ion spectrum in dry feed gas conditions is shown.
2.4.2. Schlieren.
Schlieren imaging can be used to detect flow conditions, temperature fields and density. The kINPen has been studied by quantitative Schlieren spectroscopy for the determination of ambient species density, gas temperature and calorimetric power in [26]. The setup is shown in figure 17. Parallel light from a point light source (a green 530 nm LED with optics and aperture) is collimated after passing the plasma jet. A knife edge is situated at the focal point of the collimating lens reducing the intensity by ~58% [26]. A green filter suppresses the background light as well as the plasma-emitted light disturbing the measurements.
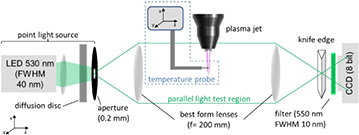
Figure 17. Schlieren setup for diagnostics of flow and thermal properties of jet flows. Reproduced from [26]. © IOP Publishing Ltd. All rights reserved.
Download figure:
Standard image High-resolution imageFrom a measurement of the intensity with (I) and without Schlieren (IK), the contrast can be determined from equation (5) [26]:

It was shown that by measuring the contrast, cfl, of the gas flow without plasma ignition, and cpl, the contrast with flow and ignited plasma, the temperature can be determined via:
with
where T0 is the ambient gas temperature, S is the Schlieren setup sensitivity, n denotes the refractive indices and xAr is the molar fraction of argon, while 1 + εr,i denotes the reference index of refraction for species i. The Schlieren measurements yield the air mole fraction in argon as well as the gas temperature. Results of Schlieren measurements contributed to validating computational models (see section 2.6.2) and also contributed to an understanding of the diffusion of ambient species into the kINPen effluent, as used for the reaction kinetics studies presented in 3.6.
2.4.3. Electrical diagnostics.
Power measurements on rf atmospheric pressure plasma jets are intricate, because the capacity of electric probes is typically in the same order of magnitude as the capacity of the plasma source. Several research groups are therefore investigating ways to determine the dissipated electrical power in atmospheric pressure plasma jets [90, 151–153]. In [154], an electric probe system is included in the source design. The power and electrical properties of the kINPen have been determined in various works [21, 47, 135, 155]. In [135], the power was determined in the same way as in [153]: current and voltage probes are placed before the matching coil. Power loss inside the coil and electric wiring are accounted for. One must make sure that the power loss in the coil remains constant with or without plasma and with or without gas flow. This can be performed by monitoring the temperature of the coil. The dissipated power can then be measured by determining the difference between the power as a function of the discharge current with the plasma switched on and off, respectively.
The power of the kINPen Sci was determined to range from 1.4 to 1.8 W, depending on the molecular admixture of up to 1%. The power values are in good agreement with the power measurements on a similar device [156]. In [155], a plasma jet of kINPen geometry was studied at different frequencies with the setup shown in figure 18. The determined values are shown in table 2. Detailed results of the power measurements are shown in figure 37 in section 3.5.
Table 2. The electric parameters used in study [155]. Reproduced from [155]. CC BY 4.0.
| Frequency/kHz | 80 | 243 | 393 | 595 | 850 | 1500 |
| Inductance/mH | 151 | 32 | 12.6 | 5.78 | 2.9 | 0.96 |
| Voltage U1/V | 61 | 63 | 42 | 44 | 57 | 47 |
| Current I1/mA | 12 | 21 | 40 | 53 | 66 | 109 |
| Voltage U2/kV | 3.8 | 3.4 | 3.2 | 3.1 | 3 | 3 |
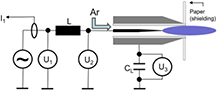
Figure 18. Setup to determine the power and electric properties in a laboratory setup using the kINPen geometry. Reproduced from [155]. CC BY 4.0.
Download figure:
Standard image High-resolution image2.4.4. Probe measurements.
Using probes for a measurement of plasma plume properties influences (a) the electric field, through immersion of the probe as a further conductor or dielectric, (b) the flow field of the feed gas exiting the plasma jet nozzle, and (c) the reactive species composition, by providing a further surface where reactions can occur. Nevertheless, probe measurements can be used successfully where simple-to-perform measurements are required. This may be the case, for example, when a standard test procedure is to be established for a comparison of plasma sources for a specific application [157]. Probe diagnostics are also applicable where a lack of suitable measurement techniques leaves few other options [158]. The kINPen has been diagnosed with probes regarding the electric field [158], the flow field, temperature [5, 26, 27], and reactive species, either by gas monitors using AS-based techniques (e.g. [157]), or by probes indicating species concentration by a colorimetric change of a test substance in a measurement tube [5]. The kINPen has not been studied with Langmuir probes since these measurements still present challenges for the diagnostics of small-scale atmospheric pressure plasmas. Langmuir probe measurements have, however, been performed on a plasma jet of similar geometry at 13.56 MHz [159]. In a rather unusual study [110], the generation of sound waves by the kINPen was investigated with an acoustic probe.
An important parameter for reliable measurements and reproducible reactive species composition is feed gas humidity. In various publications, the feed gas humidity was determined by a chilled mirror dew point hygrometer (see e.g. [130]).
In early studies of an APPJ plasma source, temperature measurements were performed with a thermocouple [160]. The APPJ's electric field is perpendicular to the gas flow, with little effect outside the core plasma so that charged species quickly recombine and no strong influence on the plasma effluent is expected. For the kINPen, the situation is very different, as there is a strong electric field effect in the effluent, and charged species are produced outside the core plasma. Therefore, temperature probe measurements on the kINPen are usually performed with electrically non-conducting fibre optic thermal probes. The probe determines the temperature by spectroscopically measuring the band gap of a GaAs crystal, which is deposited at the tip of the optical fibre [26].
For electric field measurements on the kINPen, an electric field probe was used that relies on the Pockels effect. The Pockels effect in an anisotropic electro-optical crystal, such as ZnTe, LiNbO3, or BSO, optically modulates a laser beam [161, 162]. The E-field-induced modulation of the polarization state of the laser through the anisotropic change of the refractive index allows real-time measurements of the electric field in two directions. For a known electromagnetic wave crossing the crystal, an anisotropic vectorial relation  and
and  can be found [163], so that the change in refractive index can be written as [162]:
The diagnostic setup for the kINPen measurements and the setup of the electric field probe are shown in figure 19 [158]. The minimum detectable field is lower than 1 V m−1, with measurement dynamics greater than 130 dB and a bandwidth spreading from 30 Hz up to more than 10 GHz. The spatial resolution is given by the crystal and the housing and amounts to 1 mm [164]. Electric field measurement results of the kINPen are discussed in section 3.4.

Figure 19. (a) The kINPen MED in contact with the electric field probe. (b) A setup of the vectorial electric field probe. (a) © 2014 IEEE. Reprinted, with permission, from [158]. (b) © 2013 IEEE Reprinted, with permission, from [162].
Download figure:
Standard image High-resolution image2.5. Liquid diagnostics
Reactive oxygen and nitrogen species play a dominant role in plasma medicine [13] and in plasma liquid interaction [165]. The term reactive oxygen species (ROS) is generally used to describe the initial species generated by oxygen reduction (superoxide or hydrogen peroxide) as well as their secondary reactive products [166]. The term reactive nitrogen species (RNS) is used to describe (a) reactive species derived from nitric oxide, and (b) species whose reactivity originates from nitrogen [166]. Comparing ROS and RNS, it can clearly be seen that there is an overlap in the production, function and decomposition of the two groupings [167]. Selected ROS and RNS are listed in table 3. A variety of groups have performed research on reactive species generation by plasma liquid interaction in the past five years (see [168]).
Table 3. Selected ROS and RNS with respective measurement techniques.
| Nomenclature | Chemical symbol | Example measurement technique (in plasma liquid interaction where available) | Ref. | ||
|---|---|---|---|---|---|
| ROS | Radicals | Superoxide |  |
EPR spectroscopy | [169] |
| Hydroxyl | ·OH | EPR spectroscopy, UV absorption, phenol with HPLC | [169–171] | ||
| Peroxyl |  |
EPR spectroscopy | [172] | ||
| Alkoxyl | RO· | EPR spectroscopy | [173] | ||
| Hydroperoxyl |  |
EPR spectroscopy | [174] | ||
| Nonradicals | Ozone | O3 | (dye-based assay) | [175] | |
| Singlet oxygen | 1O2; O2(a1ΔG) | EPR spectroscopy, luminescence | [176] | ||
| Hydrogen peroxide | H2O2 | Colorimetry | [115] | ||
| Hypochlorite/hypochlorous acid | OCl−/HOCl | Reaction products, electrochemical detection | [177] | ||
| Peroxynitrite/peroxynitrous acid | ONOO−/ONOOH | (Colorimetry), chemical reaction analysis, ion chromatography/reaction products, reaction dynamics | [178, 179] | ||
| RNS | |||||
| Nitroxyl anion/nitroxyl | NO−, HNO | Colorimetry, ion chromatography, mass spectrometry, electrochemical detection | [180] | ||
| Nitrosyl cation | NO+ | Phenol with HPLC | [171] | ||
| Nitrite/nitrous acid |  /HNO2 /HNO2 |
Colorimetry | [49, 53, 181] | ||
| Nitrate/nitric acid |  /HNO3 /HNO3 |
Colorimetry, ion chromatography, UV absorption | [53, 181–183] | ||
| Dinitrogen trioxide | N2O3 | AS | [184] | ||
| Ammonium |  |
Ion chromatography | [52] | ||
| Radicals | Nitric oxide | NO· | Phenol with HPLC | [171] | |
| Nitrogen dioxide |  |
Phenol with HPLC | [171] | ||
Plasma liquid interaction and plasma generation of reactive species in liquids has become a hot topic in plasma research. Plasma treatment changes the pH value of treated water [185]. Standard procedure for liquid analysis is to determine the pH value as well as simple-to-measure reactive species that can be determined by colorimetric assays [157], for example. Test strips have to be used with care, and linearity for the used setup and measured species concentrations need to be validated. A variety of groups have performed AS to directly measure reactive species in plasma-treated liquids [179, 186]. The overlapping spectra of plasma-generated species, however, make a direct association of the broad absorption features difficult. To gain insight into relevant mechanisms, further liquid diagnostic techniques are necessary. In the following, selected techniques are described, which have been applied to kINPen-treated liquids.
2.5.1. Colorimetry/fluorometry.
A basic chemical analysis technique is the use of dyes that undergo changes in their absorption or fluorescence spectrum. These changes depend on the interaction of the dye molecule with the reactive species to be detected [187]. For the study of plasma liquid interaction, the following methods have become standard diagnostic techniques: the so-called Griess assay determines nitrite and nitrate, while the titanylsulfate assay [188] is used for the determination of hydrogen peroxide. A further method to determine hydrogen peroxide concentrations is the use of a resorufin-producing dye assay (e.g. Amplex® RED [130]). Amplex® RED is oxidized by hydrogen peroxide in the presence of horseradish peroxidase (HRP) and is thus converted into resorufin. Resorufin can be detected both colorimetrically at 570 nm as well as by fluorescence using excitation of 570 nm and emission of 585 nm [189].
For these colorimetric assays, it is important to note the strong dependence they have on the parameter range they can be used in. Some compounds are light sensitive and work only in a narrow pH range [190]. For Amplex® Red, concentrations of hydrogen peroxide of >100 µM can influence the measurement result.
In biology, a commonly used assay is the fluorescent dye dichlorodihydrofluorescein diacetate (H2DCFDA). H2DCFDA can pass cellular membranes, and after cleavage of the acetate group by esterases or OH, can be oxidized to form the highly fluorescent 2',7'-dichlorofluorescein (DCF) [191]. The dye is typically used to determine OH concentrations as well as peroxynitrite anions, but is also reported as a measure for general ROS concentrations. In [192], for example, H2DCFDA has been used to measure peroxynitrite in plasma-treated liquid. This assay—though useful in a variety of cases—demonstrates cross reactivity as a fundamental challenge of dye-based studies of plasma-treated liquids; figure 20 shows the response (normalized to hydroxyl radical response) of H2DCFDA to various ROS [193]. It is remarkable that all of the stated ROS play a major role in plasma treatment of liquids. Depending on their respective concentration, which can be different by orders of magnitude, similar fluorescent signals can originate from completely different species compositions.
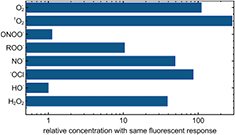
Figure 20. Cross reactivity for H2DCFDA: the relative concentration yielding the same fluorescent signal (data taken from [191]).
Download figure:
Standard image High-resolution imageA further aspect that hinders the use of most colorimetric assays in plasma-activated liquids is that most of the dyes have not been tested for strongly non-equilibrium species, such as noble gas excimers or non-noble gas atoms, which can be part of the active components of plasmas. Due to this cross reactivity, these dye-based assays are typically of little specificity.
A valid alternative to colorimetric detection is the analysis of degradation products of organic compounds such as phenol, for example, which depend on the active products by high-performance liquid chromatography (HPLC) with mass spectrometric detection, as performed for ozone in [171]. Again, cross reactivities, e.g. by OH, can occur [165]. Selected results on colorimetric studies of plasma-treated liquids are shown in section 3.8.
2.5.2. EPR spectroscopy.
A further plasma liquid interaction diagnostic method, representing an alternative to dye- based assays, is electron paramagnetic resonance (EPR) spectroscopy. EPR is only sensitive to unpaired electrons and can thus exclusively detect species with a radical character. The basic principle of EPR spectroscopy is the Zeeman effect resulting in the splitting of energy levels in a magnetic field. EPR spectroscopy probes these energy levels by absorption of microwave radiation in a varying magnetic field. Molecular fingerprinting can then be derived from the measured Landé-factor, which is specific for every particle due to the specific electron configurations and hyperfine coupling, depending on the near-by nuclear spins. EPR spectroscopy is a modulation-based technique, which is why the microwave absorption spectrum is the negative first derivative of the absorption profile (see figure 21(b)).
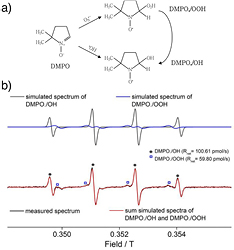
Figure 21. (a) Reaction of the spin trap 5,5-dimethyl-1-pyrroline-N-oxide (DMPO) with hydroxyl radicals and superoxide anion radicals, and (b) the EPR spectrum of DMPO/OH and DMPO/OOH. Reproduced from [169]. © IOP Publishing Ltd. All rights reserved.
Download figure:
Standard image High-resolution imageMost radicals typically have a short lifetime in liquids. EPR spectroscopy is often used by sampling the treated liquid and inserting a sample volume into the microwave resonator for analysis. This process takes one or more minutes [169]. In order to detect short-living radicals, so-called spin-traps need to be used. These chemical compounds form stable adducts with the species to be detected (see figure 21(a)). The spin-trap adducts also have a radical character and are EPR active. The advantage of using spin-trap EPR spectroscopy over dye-based assays lies in the fact that the EPR measurement of the spin-trap adduct yields a spectrum which is specific to the respective adduct. While dye-based assay signals simply show whether or not a reaction has taken place, the EPR spectroscopy signal specifically shows which reaction has occurred. In EPR spectroscopy, the measured spectrum is specific to the spin-trap adduct, allowing the identification of the molecule responsible for the adduct formation [169].
Specificity is a clear advantage of EPR spectroscopy; however, disadvantages arise resulting from the time and space averaging procedure, as well as from adding further compounds to the reaction volume. These factors need to be considered when EPR spectroscopy is performed. EPR spectroscopy has been applied to plasma liquid interaction studies by various groups [51, 169, 194]. Section 3.8.3 presents results of EPR measurements on various plasma-treated liquids.
2.6. Simulations
2.6.1. Global models.
Model calculations and plasma simulation have led to insights into many plasma processes and have progressed plasma applications considerably [195, 196]. Detailed models using particle-in-cell Monte Carlo techniques are rare (see e.g. [197]) due to their demanding requirements for calculating power. Simplification can be achieved if particle groups present in the plasma are treated as a kind of fluid, to which equations apply that can be solved numerically, yielding density, flux or temperature [198, 199]. Fluid modelling has been applied to atmospheric pressure plasmas [200, 201]. To reduce the computational requirements, global models simulate bulk plasma properties under wide assumptions on the plasma boundaries. Despite the small dimensions and typically high gradients, global models have been successfully applied to atmospheric pressure plasmas (see e.g. [202]). Reviews on modelling of atmospheric pressure plasmas can be found, for example, in [12, 203]. For the kINPen, two separate approaches to perform global reaction kinetics calculations of the chemistry have been described [44, 124, 135].
In [44, 124], a fundamental assumption is that the electric energy is dissipated in the core plasma region and in guided streamers. These follow the argon air boundary, as will be discussed in section 3.3. As a first step to initiate the reaction kinetics calculations, an electron impact reaction kinetics model was developed. This model describes the generation of primary-electron-impact-generated species in a stationary streamer head. Reaction kinetics and an electron energy balance equation are solved for 51 reactions of argon with a minority fraction of humid air. The input power is a periodic Gaussian pulse (see figure 22). As will be described in section 3.5, the electrons dominantly excite argon species; therefore, the input power of the model can be calibrated by argon metastable density measurements in the plasma jet effluent (see figure 23). The resulting initial chemistry is used for a plug flow simulation divided into three steps (see figure 22, left). The model describes reaction products that are measured in the FTIR multipass cell setup shown in figure 13(a). The reaction kinetics equations used for the model include a source term for N2 and O2 from ambient species diffusion. Step 1 of the model describes the plasma effluent with a thickness of 1 mm, step 2 describes the reaction kinetics in the collection cell and step 3 calculates the reactions occurring in the multipass cell at reduced pressure (see figure 22(a)). The model yields a maximum electron temperature during the pulse of 3.9 eV and an electron density in the order of 1012 cm−3 depending on the ambient species diffusion. Diffusion was determined by mass spectrometric measurements and computational fluid dynamics (CFD) simulations [27].

Figure 22. (a) An illustration of the plug-flow approach used in the model. (b) The electron temperature (left y-axis) and electron density (first y-axis on the right) obtained for the specified input power (second y-axis on the right) and three different mole fractions of synthetic air (xair = 10−4, 10−3, 10−2). Reproduced from [123]. © IOP Publishing Ltd. CC BY 3.0.
Download figure:
Standard image High-resolution image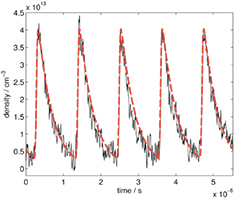
Figure 23. Measurement of argon metastable density development over time at a fixed position in the plasma jet effluent (black) and fitted argon metastable development in the model. Reproduced from [124]. © IOP Publishing Ltd. CC BY 3.0.
Download figure:
Standard image High-resolution imageThe reaction kinetics of step 1 are shown in figure 24. Argon metastable (and excimer) dynamics can be seen in the inset.
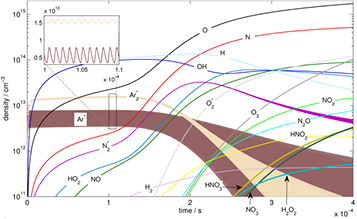
Figure 24. Reaction kinetics in the effluent of the kINPen Sci [124]. The diagram is based on a global model calculation of the reactions of plasma-excited species and ambient humid air diffusing into the feed gas flow. The x-axis represents the time of flight for the species inside the visible effluent. Reproduced from [124]. © IOP Publishing Ltd. CC BY 3.0.
Download figure:
Standard image High-resolution imageThe second model is an extensive semi-empirical model with a set of 85 species with 302 electron impact reactions and 1626 heavy particle reactions [135], which was developed in [204]. The model is based on the so-called global_Kin code described in [205]. The model also uses a plug flow approach. The co-moving volume elements' properties are changed according to the map shown in figure 25. The gas flow velocity and diffusion of ambient are taken from the CFD simulation described below. The temperature and power dissipation inside the effluent of the plasma jet were measured and taken as input parameters for the model. The power profile was taken according to earlier work of the group on a similar plasma jet. One difference to the above-described first model is that here the power input is dc. The advantage of this model is that it contains a large reaction basis and may therefore reflect reactions that are not considered in the previously described model. The model is validated through far-field species measured with QCL spectroscopy.

Figure 25. The kINPen characteristics along the axial symmetry axis of the jet used as input data for the model described in [135]. Shown are the power density with the major fraction dissipated in the core plasma region inside the jet, the gas temperature measured outside the plasma jet, the flow velocity, and the admixed shielding gas concentration in the noble feed gas. Reproduced from [135]. © 2015 IOP Publishing Ltd and Deutsche Physikalische Gesellschaft. CC BY 3.0.
Download figure:
Standard image High-resolution image2.6.2. Two-dimensional modelling.
A CFD model was developed to study gas flow conditions in the kINPen [26] with COMSOL 4.2 used as a platform. The compressible Reynolds-averaged Navier–Stokes equations are solved and a standard k − ε-model is employed to account for the turbulence. The geometry used in the CFD simulation is shown in figure 26. At boundary A, an inflow of 3 slm argon is defined corresponding to an average velocity vav = 25 m s−1 at the jet nozzle; at boundary B a normal inflow velocity of vB = 0.1 m s−1 is defined to obtain faster convergence; at C an outlet is defined. The model was used to verify the Schlieren investigations [26], determining gas temperature and ambient species densities.
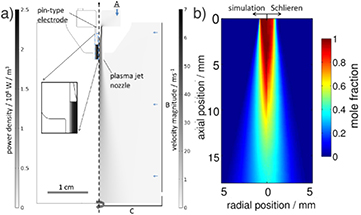
Figure 26. (a) A CFD simulation of the kINPen with a heat source term, and (b) the resulting temperature distribution in simulation and Schlieren measurements. Reproduced from [26]. © IOP Publishing Ltd. All rights reserved.
Download figure:
Standard image High-resolution imageSpecies diffusion was furthermore determined using an analytical approximate solution to the Navier–Stokes equation [206].
In [47], a 2D cylindrically symmetric, plasma hydrodynamics model, nonPDPSIM [207], of a kINPen-like plasma jet was developed. The unstructured mesh of the geometry is shown in figure 27. The aim of the model was to study the effect of curtain gas on the reactive species production. For the simulations, the plasma transport module, the radiation transport module and the fluid transport module of non-PDPSIM were used. First, the flow field was modelled using compressible Navier–Stokes equations. After 5 ms development of the flow field, the voltage was applied and Poisson's equation and species continuity equations were solved in a picosecond time step.
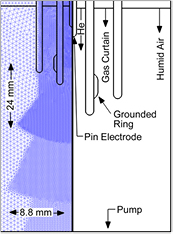
Figure 27. Mesh (left) and jet geometry (right) with gas flow conditions used for numerical simulations by nonPDPSIM. Reproduced from [47]. © IOP Publishing Ltd. All rights reserved.
Download figure:
Standard image High-resolution imageIn the numerical investigation, impure He (containing 2 ppm O2 and 3 ppm H2O) flows through the central tube at 2.5 slm. The shielding gas flows at 5 slm into humid air. In order to isolate the consequences of an electronegative shield, an N2 shield was modelled while allowing N2 to additionally attach to form a fictitious electronegative ion using the same rate of attachment and ion–ion neutralization as would occur for oxygen. This is referred to as electronegative N2 (eN2) [47]. The results and their implications are discussed in sections 3.3 and 3.4.
The numerical calculations have significantly contributed to an understanding of the physics and chemistry of the kINPen and to the results described in detail in the following section.
3. Physics and reaction chemistry of the kINPen
Plasma physics and the resulting chemical processes of the kINPen are described in the following. The main focus is set on operation with argon and helium due to the fact that most publications focus on this operation mode and that the kINPen MED is certified up to now solely for operation with argon. Many aspects of the plasma physics described are valid for most cold plasma jets [2, 4, 7, 8, 208, 209]; the kINPen, however, also exhibits unique features which will be presented.
3.1. Flow regimes
The kINPen plasma source is typically operated at high gas flows of 3–5 standard litres (slm) per minute. This is mainly due to the required cooling of the plasma jet through the gas flow. At 3 slm and a 1.6 mm nozzle diameter, the jet operates in turbulent gas flow regimes [143]. The kINPen Sci is additionally cooled externally, in order to decouple cooling and feed gas flow. This allows for lower flow conditions. Studies on the flow regimes of the kINPen and the influence of ambient species distribution on the plasma propagation have been performed in [143]; the results are shown in figure 28. First, with a fluorescent marker, gas flow without plasma ignition was determined from LIF measurements (figures 28(a)–(c)). A clear distinction between laminar flow (a) and (b) and the turbulent flow regime (c) can be seen. Second, the flow with plasma ignition was measured (figures 28(d)–(f)) by planar LIF spectroscopy on OH molecules (grey and white data). These measurements are stereoscopically overlaid by the argon emission of the discharge (red and yellow data). The OH fluorescence is determined by quenching of the fluorescent signal by ambient species impurities. OH fluorescence can only be observed for air concentrations lower than 0.1% to 1%. The transition from laminar to turbulent flow conditions is around 1 slm argon gas flow (see figure 28). It was shown that at 1 slm, the pure gas flow with the plasma jet switched off is in laminar mode (figure 28(b)), while switching the plasma jet on leads to the onset of Kelvin–Helmholtz (KH) instabilities (figure 28(e)) [143]. The measurements were performed with flow tracer planar LIF spectroscopy using acetone as the tracer for the plasma-off case and using OH as the tracer molecule for the plasma-on case. KH instabilities occur in a shear flow of two different fluids. For helium plasma jets, it has been shown that the discharge influences the flow regimes [210], which can be attributed to electro-hydrodynamic forces (EHFs). Since the momentum of argon is ten times higher than that of helium, argon flows are affected less by EHFs. While it cannot be completely excluded that EHFs have an influence [211], the dominant effect responsible for the turbulent flow transition for the kINPen operated in argon is attributed to the increase in gas temperature by the discharge energy transfer [143].
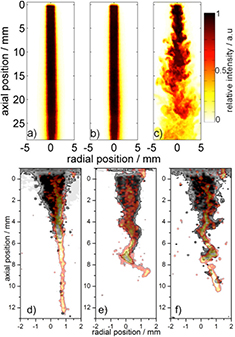
Figure 28. Argon gas flow with plasma switched off (a)–(c) and plasma switched on (d)–(f) for gas fluxes of (a) 0.5 slm, (b) 1.0 slm and (c) 3.0 slm, with Reynolds numbers of 465, 930 and 2790 respectively [143]. Grey-scale data show the feed gas with ambient impurities <1%; red and yellow indicate the argon plasma emission. The different flow conditions are: (d) 0.5 slm, (e) 1.0 slm and (f) 3.0 slm. Comparison of the plasma-off and plasma-on case shows that plasma triggers a transition to turbulent flow at a lower gas flux compared to the plasma-off case (b) versus (e). It can further be seen that the discharge strictly follows the argon channel surrounded by ambient impurities <1% ((d)–(f)). For a detailed explanation see text. Reproduced from [144]. © IOP Publishing Ltd. All rights reserved.
Download figure:
Standard image High-resolution imageIn laminar flow, thermal diffusion dominates. Here, an analytic approach called non-dispersive path mapping approximation (NDPM) yields a good approximation for the species concentration in the near field of ambient species diffusion in laminar jets [206].
It can be seen that the discharge pathway follows the transition boundary from feed gas to ambient with an ambient species concentration between 0.1% and 1%. The reason why the discharge follows this boundary is described in the following section.
3.2. Plasma dynamics and plasma breakdown
The kINPen produces a stable but transient atmospheric pressure plasma characterized by ionization wave dynamics in the filamentary effluent. Plasma stability criteria can be best described by taking a look at steady state glow discharges. To achieve stable conditions, instability mechanisms such as attachment instability or instability due to stepwise ionization have to be overcome to prevent the transition of non-thermal discharge mode to an arc discharge. A prominent example of an instability mechanism of a glow discharge is thermal instability, where a rise in gas temperature results in a decrease in particle density N (see figure 29) and thus a rising ratio of E/N at constant electric field E [212]. Consequently, the electron temperature rises, resulting in an increased electron density ne, increasing the current density times the electric field. This again leads to an increase in gas temperature, and so on and so forth.

Figure 29. A schematic of the thermal instability processes as described in [212]. The upward (downward) directed arrows symbolize an increase (decrease) in quantity. Reproduced with permission from [215].
Download figure:
Standard image High-resolution imageAt higher pressure two main processes determine plasma breakdown and stability: the breakdown to a glow discharge occurs at smaller electrode distances (Paschen's law), and the gas temperature tends to increase in a constant electric field [212].
Generation of a cold and stable plasma at atmospheric pressure starts by transferring electric energy to the discharge through accelerating charged species via the applied electric field. Energy of electrons is subsequently transferred to atoms, mainly by inelastic collisions, and to molecules mainly via vibrational excitation. Due to the different masses of electrons and heavy particles, energy transfer from electrons to neutral species and from electric field to ions is far less efficient than energy transfer from electric field to electrons. Therefore, there is a strong non-equilibrium between electron temperature and gas temperature, yielding the high reactivity of non-equilibrium plasmas at low gas temperatures.
It follows that cold atmospheric pressure plasmas require one or more of the following measures to remain in non-equilibrium plasma condition: small dimensions of the electrode configuration promote breakdown according to Paschen's law. A locally increased electric field helps to generate a sufficient amount of charged species for breakdown. Reaching a steady state with an equilibrium of gas and electron temperature needs to be prevented, for example, by supplying the electric energy only for a short time, as is the case for nanosecond pulsed discharges or for high-frequency excited plasmas. Cooling both externally or by convection will reduce the gas temperature and break the vicious circle shown in figure 29. By applying a dielectric to one or more electrodes, the electron density or the current density can be reduced to prevent transition to arcing.
For the kINPen, all of the above-mentioned measures are implemented. The plasma jet has a sharp electrode in the centre of a dielectric tubing. The high gas flow provides cooling and the 1 MHz sinusoidal frequency excitation generates current pulses of less than a nanosecond [47].
Due to the plasma source design, investigation of the discharge core region has not been performed. Breakdown inside the dielectric tubing has been shown for a 40 kHz discharge with a geometry corresponding to the kINPen and with optical access to the discharge region [132] (see figure 30). Here, breakdown is initiated at the sharp electrode tip with a corona-like appearance. The discharge propagates to the dielectric towards the grounded counter electrode and subsequently spreads ring-like between the tip of the driven electrode and the dielectric covered outer ring electrode. This charge accumulation results in a guided streamer formation, earlier described as plasma bullets for other plasma jets [120, 214]. This guided streamer formation, which is typical for kHz plasma jets, was also observed for the kINPen at an excitation frequency of 1 MHz [22]. For the kINPen, looking into the discharge region from the front, a connection between the discharge and the dielectric typically cannot be observed. Streamer formation occurs when charge separation results in an electric field in the order of the applied field at plasma breakdown (see e.g. [215]).
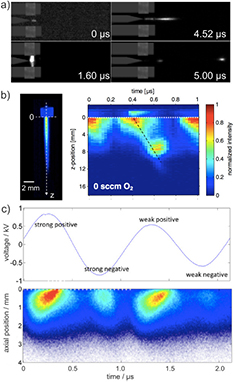
Figure 30. (a) Intensified CCD images of plasma development and streamer propagation in a 40 kHz helium plasma jet of similar geometry to the kINPen [132]. (b) Phase-resolved OES measurements of the kINPen effluent (left) shown in a phase plot (time versus propagating direction) of the guided streamer development (right) in the kINPen09 with argon as feed gas operated in air [22], and (c) with helium as feed gas operated with a nitrogen/oxygen surrounding at a fractional mixture of 80/20. The voltage signal is shown above the emission data [47]; the colour scale of (b) applies to (c) as well. (a) Reproduced from [132]. © IOP Publishing Ltd. All rights reserved. (b) Reproduced from [22]. © IOP Publishing Ltd. All rights reserved. (c) Reproduced from [47]. © IOP Publishing Ltd. All rights reserved.
Download figure:
Standard image High-resolution imageThe guided streamer phenomenon in the kINPen can be observed both when the plasma jet is operated in argon (figure 30(b)) [22], and in helium (see figure 30(c)) [47]. Three distinct phenomena were observed: the dynamics of the plasma development strongly depends on the surrounding gas composition; the negative and positive polarity of the 940 kHz excitation (see figure 30(c)) exhibit different dynamic features; and for the first time, a backwards-directed excitation feature was observed that is similar to the pin-to-plane geometries of other discharges [216]. With nitrogen as shielding gas, the excitation front propagates from the nozzle in the direction of the gas flow with a speed of 1800 m ⋅ s−1 [47]. With oxygen in the shielding gas, the excitation propagates in the opposite direction with a higher speed of about 4200 m ⋅ s−1 [47]. These studies have led to a further understanding of guided streamer formation, as described in the following.
3.3. Streamer propagation pathway
The combined measurements of OH-PLIF and plasma emission presented in figure 28(d) show that the kINPen discharge pathway follows closely the boundary of ambient species and feed gas [143]. Even in turbulent conditions, the discharge follows the space of dominant argon abundance. The OH-PLIF fluorescence is quenched by ambient species and can be measured at air concentrations of less than 0.1% to 1%, where the upper value is determined by the average ambient species density gained from Schlieren measurements [26], and the lower limit is calculated by a LIF signal simulation [143], taking into account molecular diffusion estimated by NDPM [206]. It was shown in PROES measurements and by 2D-modelling that streamer propagation is guided only in the presence of oxygen. Figure 31(a) shows in a 2D computational model that for pure nitrogen shielding, the electrons cumulate near the nozzle and dissipate in radial direction (left part). This results in a plasma formation that remains close to the nozzle, as can be seen by the 2D optical emission (right part). Figure 31(b) reveals that when oxygen is present in artificial air surroundings, this radial dissipation of the electrons is suppressed (left part). Plasma emission shows a long effluent that is guided by the surrounding gas (right part). The reason for this is the negative oxygen ion formation due to electron attachment to the electronegativity of the oxygen gas. In the computational model, the pure nitrogen surrounding (figure 31(c)) was modified, so that it also exhibits electronegative properties and negative nitrogen ions are generated, as in the case of oxygen. It is shown that the same containment of electrons occurs in the noble gas channel framed by electronegative (nitrogen) impurities. This leads to the observed streamer shapes (figure 31(d), left part) which follow the argon channels guided by turbulent diffusion of ambient air impurities, as determined by OH-planar LIF measurements (right part). Guided streamer propagation has been the topic of modelling [217–221] and experimental studies [120, 214, 216, 221–228] for many years. It was observed that the fundamental mechanisms observed in plasma jets are similar to those of streamers propagating in air. The mechanism of these streamers following a noble gas channel has been attributed mainly to the higher breakdown threshold of the ambient gas compared to the noble gas as well as to memory effects from previous streamers. Photoionization has an impact on the velocity of the streamer propagation, but is not essential to it [218]. In [47], it was found that the guiding effect arises from the electronegativity of the surrounding gas. The oxygen forms anions that appear stationary with respect to streamer propagation. The conditions are then similar to those of a streamer propagating in a dielectric tube, where the surface is charged in front of the streamer head and turns the electric field in parallel direction to the gas flow, enhancing the streamer propagation (see figure 32) [47, 229, 230]. If the electronegative gas is missing, the electrons are not confined and they will propagate in a radial direction from the nozzle (see figure 32), resulting in a less intense as well as an axially confined discharge [47], which has also been observed in noble gas surroundings (e.g. [231]). Figure 31 shows a comparison of 2D-simulation and PROES measurements for the case of nitrogen shielding gas, synthetic air (with electronegative oxygen) and a simulation with artificial 'electronegative' nitrogen, which allows the attachment of electrons [47]. It can be clearly seen in the simulations that the electrons are confined in a jet-like structure for the electronegative cases and expand near the nozzle in radial direction for the case of non-electronegative pure nitrogen. These observations are confirmed by time-resolved plasma emission measurements. The studies were performed in helium to have a reproducible volume effluent, as opposed to the filamentary stochastic discharge in argon. For argon, a similar feature was also observed, albeit not as pronounced, due to the filamentary character of the discharge [232, 233].
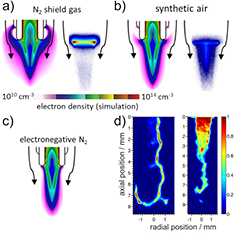
Figure 31. (a), (b) The mechanisms of electronegative gas on plasma propagation in simulation (left) and measurements (right) [47]. (c) Artificial electronegative nitrogen surrounding in simulations [47], demonstrating the guiding effect of negative ions leading to the streamer pathway formation shown in (d), with the hook-like structure of the discharge following the noble gas channel in electronegative air. (a)–(c) Reproduced from [47]. © IOP Publishing Ltd. All rights reserved. (d) 2014 IEEE. Reprinted, with permission, from [142].
Download figure:
Standard image High-resolution image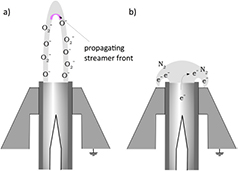
Figure 32. The effect of electronegative gas surrounding the plasma effluent resulting in a negative channel (a), and the radially directed loss of electrons in the case of missing electronegative gas (b), according to the study published in [47].
Download figure:
Standard image High-resolution imageDue to the described guiding effect, turbulent gas flow can result in arbitrary argon channels, which can lead to backwards directed, hook-like plasma filaments [142]. Furthermore, charge deposition causes negative streamers in dielectric tubes and in noble gas channels in air—opposed to negative streamers in air [234]—to propagate faster than positive streamers (see figure 30).
3.4. Electric field
The relevance of the electric field for discharge development, surface interaction as well as the biomedical effects is being studied by an increasing number of researchers, and several diagnostic methods have been applied (see e.g. [159, 225, 235–246]).
The electric field of the kINPen MED has been measured by an electric field probe (Kapteos, France) [158, 164].
Two transverse field components were determined simultaneously (see figure 33) shown in red and blue. The E-field vector is represented below the measurement and the rainbow colours of the vectors are linked to their modulus  . It can be seen that the electric field follows the 1 MHz excitation and is more pronounced in one direction. Furthermore, the electric field vector precipitates around the axis in the gas flow direction. The weak excitation followed by a strong excitation observed in the PROES measurements as well as in the voltage measurements (see figure 30(c)) can also be seen in the electric field strength. The measurement was performed at a distance of about 5 mm from the nozzle. The reconstructed E-field vector (Ex and Ey) (seen below the red and blue curve in figure 33) shows an elliptical shape of the electric field resulting from the contributions of the igniting field and the plasma itself [164]. Electric fields can play a large role in medical applications, for example. Studies on the so-called plasma gun have shown that an electric field in biologic tissue can be achieved between 0.1 and 1 kV cm−1 in chicken skin at depths between 1.5 and 3 mm [247]. These significant values can be reached at greater depths in the case of organs like liver, independent of the presence of a liquid layer at the surface of the target [247]. These values suggest an influence of electric fields in therapeutic applications comparable to those known from research in pulsed electric fields [248].

Figure 33. Electric field measurement of the kINPen MED by an electric field probe utilizing the Pockels effect. © 2014. Reprinted, with permission, from [158].
Download figure:
Standard image High-resolution image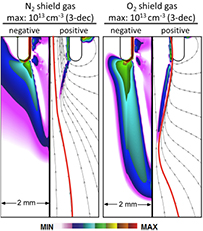
Figure 34. Numerical simulations of the charge distribution and electric field in a model of the kINPen with nitrogen (left) and oxygen shielding (right) [47]. The focussing effect of negative oxygen ions on the electric field is shown in the example of a selected electric field line marked in red. Reproduced from [47]. © IOP Publishing Ltd. All rights reserved.
Download figure:
Standard image High-resolution imageThe modelling and diagnostic investigations described in [47] show the effect of the ambient composition on the electric field and propose an electrostatic focussing mechanism induced by the electric field of the quasi-static negative ions (see figure 34). For the case of nitrogen as shielding gas, electrons drift along the electric field lines outwards in radial direction. For the case of electronegative oxygen shielding, electrons are focussed towards the axis of the jet, similar to the case of electric field distribution inside dielectric tubing. Electrons that do drift outwards become attached and can form negative ions [47]. This mechanism provides a surplus of charged species. It is assumed that these species are responsible for the backwards-directed excitation dynamics seen in figure 30 (middle and right). Operating the kINPen with helium as feed gas, the following mechanism is proposed for electron detachment and the subsequent initiation of the backwards-directed excitation wave.
Measurements of helium density by tuneable diode laser AS revealed the presence of helium metastables at the point of initiation of the backwards-directed excitation wave in the order of 5 · 1012 cm−3. The helium metastable concentration is strongly dependent on the shielding gas composition (see figure 35). At oxygen concentrations lower than 10%, a rapid decrease of helium metastables occurs. It was found that this dependency was not due to the presence of nitrogen (studied by gradually replacing nitrogen with argon), but rather due to the absence of oxygen. The reason for this is expected to lie in the higher electric field, which generates additional energy dissipation pathways leading to helium metastable generation.

Figure 35. Helium metastable density at two different distances from the plasma jet nozzle for different shielding gas compositions consisting of argon and oxygen or nitrogen and oxygen. Reproduced from [21]. © IOP Publishing Ltd. All rights reserved.
Download figure:
Standard image High-resolution imageHelium metastables are furthermore assumed to be a generation pathway for seed electrons, resulting in the observed backwards-directed excitation wave due to electron detachment via [47]

3.5. Energy transport mechanisms
The kINPen is characterized by processes spanning time scales of several orders of magnitude, as is the case for all atmospheric pressure plasmas—especially so for plasmas used in plasma medicine (see figure 36)—since biological processes can span time scales up to months or years. Energy transport mechanisms are vital for gaining understanding and control of these processes.
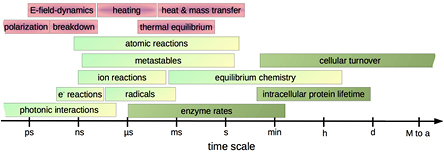
Figure 36. Time-dependent processes of atmospheric pressure plasmas and selected long-term effects in biology.
Download figure:
Standard image High-resolution imageIntermediate interactions, in particular, allow the transfer and dissipation of the energy introduced into the plasma towards an object to be treated. For a fundamental study of plasma interaction processes, it is, therefore, vital to study particle and energy fluxes, as was done in [151, 249, 250], for example. The energy that drives atmospheric pressure plasma jets is typically supplied electrically. Depending on the frequency, the power that dissipates in the plasma differs. While the kINPen is operated at frequencies around 1 MHz, in [156] several frequencies were tested. It was shown that with increasing frequency, power consumption in the effluent of the plasma increased (see figure 37). The power consumption in the core plasma region saturates at 1 W. For the maximum frequency used, the total power dissipated in the plasma was about 3.5 W. The maximal power input for each frequency was limited by parasitic discharges [156].
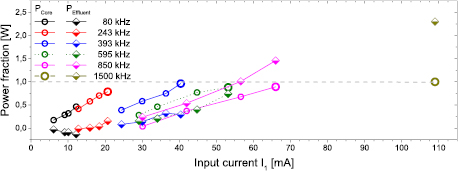
Figure 37. Electric power dissipated in the plasma core region (squares) and the effluent (diamonds) for different frequencies and input currents. Circles show the power measurements performed with Lissajous curves. Reproduced from [155]. CC BY 4.0.
Download figure:
Standard image High-resolution imageAn energy balance was evaluated in [26]. For this, a calorimetric estimate of the power was performed by evaluating the thermal energy input of the kINPen measured by Schlieren imaging and CFD simulations (see also figure 26), taking into account that the heat capacity of argon is twice that of air. No heating was assumed at a distance further than 8 mm from the nozzle, and 1.1 W of thermal input power was determined. Including molecular species as energy carrier, the concentration of ozone—the most dominant species in the far field—was taken as a value for the chemical energy. The bond energy of ozone is 497 kJ · mol−1. At a production rate of 2.5 · 1016 particles s−1, the chemical energy only amounts to 0.01 W. Not considering electromagnetic radiation, which does not result in chemical energy, and can thus contribute to power loss [251], the estimate of the dissipated power by the calorimetric measurements is about 1.1 W at 940 kHz. Electric power measurements (at 850 kHz) from [155] lie between 0.3 W and 2 W depending on the input current (see figure 37). For version kINPen08, the energy flux was determined by a calorimetric probe [252]. The total energy flux was 300 mW cm−2 at a distance of 5 to 10 mm and quickly dropped below 50 mW at greater distances.
In [118], OES was used to gain an insight into the ratio of high-energy electrons and lower energy electrons by probing argon emission. As a function of gas flow, up to 3 slm, the highest electron energy is found close to the nozzle, which agrees with simulations. At higher gas flows, electron energies have been determined even at greater distance from the nozzle. As turbulence increases [143] with higher gas flow, it can be assumed that the relevance of the energy dissipation processes involving nitrogen and oxygen species also increases. However, it has to be taken into account that the measurements are time-integrated, and average the emission from the filaments originating in the argon channel of air impurities between 0.1% and 1%. In [135], a dependence of electron properties on the admixture of nitrogen and oxygen was studied by a semi-empirical model validated against QCLAS. Admixture of nitrogen (0.1%–1%) led to a decrease in electron density from almost 1012 cm−3 to 1011 cm−3 in the plasma core region, and in the visible effluent from roughly 8 · 1011 cm−3 to 3 · 1011 cm−3. The electron temperature dropped from 3 eV to 1.2 eV inside the discharge and slightly increased (apart from the value directly at the nozzle) from 1.8 to 2.1 eV. Oxygen admixture also led to a decrease in electron density from 8 · 1012 cm−3 to 8 · 1010 cm−3 in the core region and from above 1 · 1011 cm−3 down to below 1 · 1010 cm−3 in the visible effluent of the plasma jet. In contrast with the nitrogen admixture, for the oxygen admixture the electron temperature slightly increased from 3 to 3.9 eV inside the discharge and was constant at 3.3 eV in the visible effluent. It has to be noted that the electron energies in the effluent might be underestimated, as the model assumes a constant energy input, whereas the streamer propagation suggests a temporarily higher electron energy. In [47], these considerations were taken into account and electron energies of up to 3.9 eV in the effluent were gained.
Fast energy transfer mechanisms originate from photon processes. The kINPen also emits VUV radiation, which is mostly dominated by the second argon excimer continuum. Although the total irradiance lies below any hazardous level [158, 253], VUV radiation can transport energy into the effluent. In large plasma jets, VUV-radiation can reach a distance of up to 10 cm [160]. For the kINPen, it was shown that VUV photo dissociation generates activity in treated liquids [182]. Dissociation of water molecules results in the formation of OH and subsequently hydrogen peroxide. The investigation has shown that photonic processes only make up a small fraction of the overall reactive species generation mechanisms [182]. It was shown that generation of (V)UV emission can be inhibited by changing the gas composition [38], by changing the atmosphere surrounding the plasma jet with the gas curtain [43], as well as by ambient species diffusion [127].
Charged species can be expected to play a less dominant role in transport and reaction kinetics [150], since their density can be estimated to be 2 to 3 orders of magnitude lower than the electron density of ~1020 m−3 (measured in a similar jet). In biologic processes, ions have an influence due to their high solubility, but further studies are necessary.
It is known that in ambient humid air, plasma-generated ions are the source of water cluster formation [150]. These clusters are present in the kINPen effluent. Positive ion clusters are typically formed around H3O+ (shown in figure 38 up to a cluster size of n = 4 [27]) and negative ion clusters are typically formed around OH− or  [148].
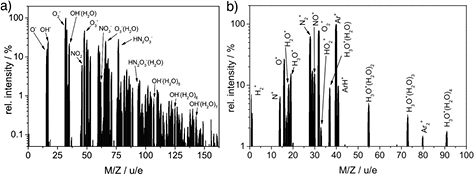
Figure 38. (a) Molecular beam mass spectrum of the kINPen operated with argon and feed gas humidity admixture [148]. Negative water cluster formation up to cluster sizes of n = 7 is shown. (b) Positive ion spectrum of the kINPen at a distance of 10.5 mm from the nozzle. Reproduced with permission from [148].
Download figure:
Standard image High-resolution imageA major role for energy dissipation can be attributed to metastable species. Several metastable species have been studied in the kINPen. Noble gas metastable species significantly add to the dissipation of electric energy and thus largely contribute to the plasma jet's reactivity [21, 124]. In [124], it was shown by model calculations that at an ambient species concentration level of less than 1% at the location of discharge propagation, primary reactive species are dominantly generated by argon metastable species and not by electron impact. Figure 39 shows model calculations for three different air impurity concentrations. Generation processes (Ar-metastable versus electron impact) for five different species groups (O and O(1D); N; N2(A3 ); H and OH; O2(a1Δg) and O2(b
 )) are compared for air concentrations of 0.01%, 0.1% and 1%. The calculations show that for all atomic species (H, N, O) as well as for metastable nitrogen and OH, argon metastables are dominantly responsible for the species production. As described in sections 3.1 and 3.3, streamer propagation occurs in the area of argon feed gas with boundary impurities of a maximum of 0.1%–1%. It can therefore be concluded that if the argon metastable species densities are known, subsequent reaction kinetics can be derived from the developed reaction kinetics model [124]. With tunable diode laser AS, concentrations of argon metastables were measured to be up to 4.5 · 1013 cm−3. Their concentration modulates with the excitation frequency by an order of magnitude [124] (see figure 23). Similar effects were observed for filamentary argon discharges in dielectric tubes [254]. Model calculations in [124] for the kINPen prove that using argon metastables as primary energy supplying species for reaction kinetic calculations is a valid approach.

Figure 39. Model results for O and O(1D), N, N2(A3 ), H or OH, O2(a1Δg) and O2(b
 ) production by argon metastables (grey bars) in comparison to electron impact (green bars) for three different air fractions in the feed gas plume (10−4, 10−3 and 10−2). Apart from O2(a1Δg) and O2(b
 ) it is shown that argon metastable generation processes dominate electron impact generation. Reproduced from [124]. © IOP Publishing Ltd. CC BY 3.0.
Download figure:
Standard image High-resolution imageSimilarly important to argon metastables are molecular metastables. Metastable oxygen molecules play an important role in plasma jet chemistry [255], as do metastable nitrogen species. In simulations of the kINPen, N2(A3 ) is more dominant when lower electron energies are assumed [135] and argon metastables dominate when higher electron energies are used [47]. In [139], N2(A3
 ) was measured by LIF spectroscopy using the approach described in [256]. By varying the curtain gas composition, quenching values for different gas compositions were determined. N2 metastables were detected up to the tip of the visible plasma effluent (see figure 40). The N2 metastable density drops by two orders of magnitude, correlating with the total emission intensity of the effluent. Varying the admixture (pure N2 versus air) and the curtain gas (pure N2 versus air) revealed the following: although O2 is an efficient quencher of N2(A3
 ), a pure nitrogen admixture and nitrogen curtain gas did not produce the highest N2(A3
 ) concentrations. The highest N2(A3
 ) concentration was achieved by an air admixture and air shielding [139]. This can be attributed to two mechanisms: first, in a plasma jet similar to the kINPen, Thomson scattering results show that air admixture leads to a higher electron density ne than is the case for N2 admixture at similar electron temperatures [211]. As can be seen in figure 39, at an air fraction of 1% (right most bar in each reactive species group), N2(A3
 ) is, for the larger part, generated by electron impact (green bar) and a higher ne will thus lead to a higher N2(A3
 ) concentration. Second, the presence of oxygen in the curtain gas leads to the described electric field focussing mechanism, which leads to a stronger discharge [47].

Figure 40. The concentration profile of N2(A3 ) metastables in the effluent of the kINPen (B) correlated to the total emission of the plasma jet (photograph (A) and (B) solid blue line). Reprinted with permission from [139]. Copyright 2016, AIP Publishing LLC.
Download figure:
Standard image High-resolution image3.6. Effects of gas flow on reaction kinetics
Diffusion of ambient species into the effluent of the kINPen has been studied by differing methods: CFD simulations (see e.g. figure 41(a) and (b)), described in section 2.6, were used to study diffusion [43, 206]. The simulations were applied as a basis for the ambient species distribution in reaction kinetics simulations [45, 124, 135], for example, or to visualize the effect of a Petri-dish—as used in fundamental biologic in vitro studies—on the flow of feed gas and ambient gas species during plasma treatment [45] (see also section 1.2). As a direct measurement of the average ambient species distribution in the plasma jet effluent, Schlieren measurements were performed [26]. A good agreement with the CFD simulations was seen (see figure 41(a)). Further methods include non-dispersive path mapping approximation (NDPM) [206], MBMS [148], VUV AS [127, 138] and LIF decay time measurements [129, 138, 139, 142, 143].
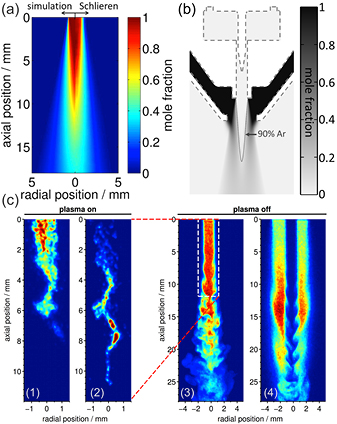
Figure 41. (a) A comparison of CFD simulations and Schlieren measurements of ambient species distribution in the feed gas flow. Reproduced from [26]. © IOP Publishing Ltd. All rights reserved. (b) CFD simulation of the gas flow conditions of the kINPen with a gas curtain shows the mole fraction of the curtain gas concentration. © 2012 IEEE. Reprinted, with permission, from [43]. (c) Single-shot PLIF images of the effluent of the kINPen fed with 1.5 slm argon and shielded with 2.5 slm air. Reproduced with permission from [257]. The nozzle tip of the kINPen is located at the absolute zero position. On the left side, the plasma is on. (1) The OH fluorescence resembling the argon/air boundaries; (2) is the argon emission of the discharge which reveals the path of the streamer. In (3) and (4), the plasma is off and a larger view of the effluent with the plasma-on is illustrated in (1) and (2). (3) The fluorescence of acetone admixed with argon to image the flow pattern; (4) depicts the influence of the gas curtain around the jet effluent by admixing acetone within the curtain gas. A comparison of the discharge-on with the discharge-off flow conditions reveals that in the transition from laminar to turbulent flow conditions, the discharge favours turbulent conditions, which is attributed to the effect of heating on the viscosity [257].
Download figure:
Standard image High-resolution imageThe differences in diffusion in turbulent flow and laminar flow are strong. However, the effect of flow conditions on reactive species generation is smaller than expected. This is due to the fact that the discharge will occur only in noble feed gas conditions with ambient species concentrations of less than 0.1% to 1% (see figure 41(c) and section 3.3). Whether this pathway is straight (laminar case) or bent (turbulent flow) has little influence. In [138], it was found that NO decay has the same rate both in turbulent and in laminar flow regimes (see figure 42). Rotational temperature measurements on the NO(A-X)(0–0) LIF excitation spectrum revealed a rotational temperature directly at the nozzle that was about 100 K higher for the laminar case (521 ± 25 K) than for the turbulent case. A higher temperature results in higher NO production, since ozone generation is reduced at higher temperatures with ozone being one of the major loss partners of NO. Turbulent and laminar case both lead to a similar air density profile in the plasma effluent, although different effects are responsible for the species transport. High temperatures are very localized and part of the discharge's heating mechanism. While the rotational temperature can reach high levels, the average gas temperature does not exceed the values measured in [20], for example.
Figure 42. A comparison of the on-axis NO-concentration measured by LIF spectroscopy in turbulent (red circles) and laminar (blue squares) flow conditions. Reproduced from [138]. © 2014 IOP Publishing Ltd and Deutsche Physikalische Gesellschaft. CC BY 3.0.
Download figure:
Standard image High-resolution image3.7. Reaction chemistry
Studies on the reaction chemistry of cold atmospheric plasmas generally focus on generation of reactive oxygen and nitrogen species, not least because these species play a dominant role in therapeutic applications of plasmas [13]. For the kINPen, reaction chemistry has been studied in two separate approaches: in [44, 124], only the surrounding atmosphere—i.e. the curtain gas composition—was changed. At the end of this section, it is described how by changing the gas curtain composition and feed gas composition, the reaction chemistry of the kINPen can be tuned from generating an oxygen-dominated species composition to generating a nitrogen-dominated species composition. Model calculations were compared to FTIR AS data as described in section 2.6.1. The influence of curtain gas composition on plasma-treated liquids is shown in section 3.8.3 (see figure 51). In [135], the surrounding atmosphere was kept constant at dry conditions through the use of the gas curtain fed with nitrogen and oxygen with an air-like composition, and the composition of the molecular feed gas admixture was changed (at 1% volume fraction) by varying its N2 and O2 fractions. Here, experimental data were provided by QCLAS measurements that are briefly presented in the following.
From [135], reaction pathways inside the discharge core region can be gained. With a molecular admixture to the feed gas, the following processes are relevant.
Oxygen admixture leads to formation of atomic oxygen, produced mainly inside the jet. At lower oxygen admixtures (below 0.2%), electron impact dissociation dominates argon metastable collisional dissociation depending on the electron temperature:

and at oxygen admixtures higher than 0.2%, atomic oxygen is formed by argon metastables and excimers (see also figure 39):

Both model studies confirm that the dominant ozone production pathway originates from three body processes of molecular and atomic oxygen and a collider M [44, 124, 135]:

It can thus be explained that in the far field of the kINPen effluent, ozone development follows the atomic oxygen dynamics with an increasing oxygen admixture (see figure 43). The plateau or saturation towards higher oxygen admixtures originates from a decreasing electron density inside the discharge, where oxygen is produced, as well as from loss of atomic oxygen through reaction (R3).
Figure 43. (a) The atomic oxygen density in the kINPen determined by TALIF spectroscopy. © 2012 IEEE. Reprinted, with permission, from [147]. (b) Ozone QCLAS measurement and calculation; blue shows a simulation based on one of the reaction kinetics models described in section 2.6.1 and red shows the quantum cascade absorption spectroscopic measurements of the ozone concentration. Reproduced from [135]. © 2015 IOP Publishing Ltd and Deutsche Physikalische Gesellschaft. CC BY 3.0.
Download figure:
Standard image High-resolution imageAdding nitrogen to the discharge leads to formation of N2(A3 ) inside the discharge either by electron impact or by collisions with excited argon species:


In [44, 124], the model assumes constant plasma parameters with changing curtain gas composition. Atomic oxygen generation in the plasma effluent occurs mainly through (R2). NO is generated through one of the reactions of the extended Zeldovich mechanism

In the model presented in [124], (R6) is favoured within the effluent region over the generation of NO through reaction

which is favoured in the model used in [135] ( are excited nitrogen molecules such as N2(A3
 )). The reason for the differing weighting of the NO generation mechanisms by the two models lies in the fact that they give different electron energies according to their respective approaches of power input.
NO2 is formed through reactions with O, O3 or HO2. N2O is formed through reactions of O2 with nitrogen metastables. Dominant reaction pathways and partners are shown in figure 44. The colour-coded arrows indicate reactions that are favourable (green) or unfavourable (red) to the generation of a NOx-dominated chemistry. The species marked with a black lined frame were detected by FTIR measurements shown in figure 46. Primary species (red box) are dominantly generated by excited argon species. The reaction kinetics leads to generation of nitrogen oxygen species (blue box), hydrogen oxygen species (light green box) and hydrogen oxygen nitrogen species (turquoise box).

Figure 44. Dominant reaction pathways resulting from FTIR analysis and model calculations presented in [19, 124]. Framed species have been detected in FTIR measurements. The species in the red box are generated through dissociation of air species and water by the plasma. Yellow, green and blue-framed species are generated through subsequent chemical reactions indicated by the arrows. Green arrows indicate pathways that are relevant for NO production. Red arrows indicate pathways that are detrimental to NO generation. [19] John Wiley & Sons. © 2016 WILEY-VCH Verlag GmbH & Co. KGaA, Weinheim.
Download figure:
Standard image High-resolution imageHumidity has a great influence on plasma composition [46], optical emission spectra [130], chemistry in plasma-treated liquids [115] and on inhibition effects of cell metabolism, as was shown for human skin cells [130]. Humidity originating from treated liquids can also affect plasma development [140, 141]. It has to be noted that the effect of water feed gas admixture on H2O2 generation is much stronger than the effect of ambient humidity [131].
High humidity in the feed gas also results in a strong increase of HO2, as was determined by cavity-enhanced AS [126]. For water concentrations in the feed gas of up to 5000 ppm, a linear increase of OH concentration is observed by absolutely calibrated LIF measurements [129] and by relative measurements [115] (see figure 45(b)).

Figure 45. (a) Ozone concentration as a function of ambient and feed gas humidity measured by FTIR AS. © 2015 IEEE. Reprinted, with permission, from [131]. (b) OH density at a distance of 1 mm from the jet nozzle for increasing feed gas humidity. Reproduced from [129]. © IOP Publishing Ltd. All rights reserved.
Download figure:
Standard image High-resolution imageFigure 45(a) shows the development of ozone upon increasing the ambient and feed gas humidity. It is vital here that the decrease of ozone is connected to the depletion of atomic oxygen by OH. This mechanism is fundamental for a possible and unique control of the plasma-initiated reaction chemistry, tuning the reactive species composition from oxygen-based chemistry to nitrogen-based chemistry, as was described in [19].
An analysis of favourable and unfavourable reactions to NOx formation, as shown in figure 44, led to the optimal approach to generate more NO than ozone in a cold plasma jet. Reducing the precursor for ozone using nitrogen shielding gas and by adding water to the feed gas to chemically quench atomic oxygen, while at the same time varying the concentration of the nitrogen to oxygen admixture, allows us to control the composition of the generated reactive species [19]. This approach enables us to generate a cold plasma that produces far more NO than ozone (see figure 46). The three columns of data are for three different gas curtain conditions: (a), (d), (g) and (j) using synthetic air as the shielding gas, (b), (e), (h) and (k) using pure nitrogen as the shielding gas, and (c), (f), (i) and (l) using nitrogen as the shielding gas with humidified feed gas. The feed gas is argon with a 1% molecular admixture. All data is shown with a variation of the molecular feed gas admixture composition in 10% steps from pure nitrogen to pure oxygen. The measurements reveal specific recipes to tailor the reactive species composition generated by the gas-shielded argon plasma jet. For ozone production, air surrounding and pure oxygen admixture is optimal (and the most commonly found condition in cold atmospheric pressure plasma jets). To dominantly generate nitric oxide, figure 44 shows that HxNyOz species have to be taken into consideration, as NO is a precursor for most of these species. Beneficial for the generation of NO are small admixtures of H2O, specifically for the case of only small O2 fractions in the gas admixture. For a high O2 admixture, the influence of humidity is not so strong and (R7) may dominate (R6).
Figure 46. FTIR measurement data in a multipass cell for three different curtain gas compositions for O3 (a)–(c), NO2, NO and N2O5 (d)–(f), N2O (g)–(i) as well as HNO2, HNO3 and H2O2 (j)–(l), each for varying fractions of O2 in N2 of the 1% molecular feed gas admixture in argon. The asterisk marks values that are below the detection limit. See text for a detailed explanation. [19] John Wiley & Sons. © 2016 WILEY-VCH Verlag GmbH & Co. KGaA, Weinheim.
Download figure:
Standard image High-resolution imageBy a careful choice of feed gas and shielding gas composition, the kINPen operation mode can be tuned between an oxygen species and a nitrogen species dominated mode [19]. First studies indicate that this will prove to be very valuable, e.g. for a tailored medical application of plasma.
3.8. Interaction with liquids
Plasma liquid interaction has gained much attention, not least due to ground-breaking research in the field of plasma medicine. Several recent reviews, as well as roadmaps on plasmas and plasma liquid interaction, provide an overview [165, 258, 259]. Plasma liquid interaction combines disciplines from physics, chemistry and biology. In the following, studies performed on the kINPen interacting with liquids are presented. Section 3.8 describes in three parts the liquid interaction processes of the kINPen that have been studied so far, namely reactive species generation by photons, mass flow processes and chemical interaction processes.
Figure 47 shows a sketch of the kINPen and four separate relevant zones in plasma jet liquid interaction. Region (A) represents the plasma core region, which is the source of all subsequent reaction pathways, and region (B) denotes the plasma gas phase. Processes occurring in regions (A) and (B) are described above in sections 3.2–3.7. (C) shows the plasma/gas/liquid interface; region (D) is the liquid phase.
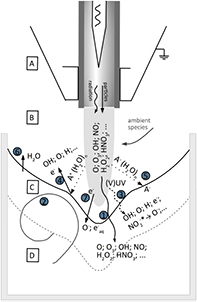
Figure 47. Interaction processes of treatment of liquids by the kINPen. Four regions are marked: (A) the core plasma region, (B) the effluent and plasma gas phase interaction zone, (C) the plasma/gas/liquid interface region, and (D) the bulk liquid region.
Download figure:
Standard image High-resolution imageRegions (B), (C) and (D) are closely connected through various processes [260]. At the interface, seven dominant processes can occur (see figure 47): mass transfer (1) [250] depending on the Henry constants of the respective species as well as on the gas and liquid flow (2), photolysis (3) [182], positive ions and clusters (4), which can lead to sputtering processes releasing water, gases, or even electrons from the liquid; negative ions, clusters and cluster transport [150] (5), evaporation (6) [140, 141] and electron impact or transport (7) [261, 262]. In the treatment of liquids by plasma jets, a distinction has to be made between touching and non-touching plasma jets [263]. In plasma liquid interaction, some parallels can be drawn with so-called advanced oxidation techniques that use, for example, photon reactions to generate oxidative compounds [264].
3.8.1. (V)UV radiation.
In the interaction of plasmas with liquids, VUV radiation is responsible for generation of reactive species from photochemistry as shown, for example, by model calculations [265]. VUV-induced liquid chemistry has to occur within the first 10 µm of the liquid layer, as here 90% of the initial VUV radiation is absorbed according to the absorption cross sections of water for VUV [266, 267]. Bond dissociation energies of the majority of simple molecules lie in the UV spectral region [268]. The absorption coefficient of water rises over six orders of magnitude from wavelengths of 200 nm down to 155 nm [269]. The quantum yield for water homolysis is unity at 124 nm and is reduced down to 0.3 at 185 nm [270]. VUV-photolysis of water dominantly yields OH and H radicals, while hydrated electrons are generated on a smaller scale [270] (see table 4). The subsequent reactions of these primary radicals yield hydroperoxyl radicals, superoxide and oxide radical anions, hydroxide and hydroperoxide anions, and protons, leading finally to molecular oxygen, hydrogen peroxide, molecular hydrogen, and water ([270] and references therein).
Table 4. Quantum yield Φ of photolytic reactions (pH value listed where known).
| Reaction | Φ | Reference |
|---|---|---|
 |
0.05 | [273] |
 |
0.045 | [273] |
 |
0.45 | [269, 273] |
 |
0.33 | [273] |
 |
0.5 | [269, 274] |
 |
0.5 | [275] |
 |
0.49pH 2.7 | [274] |
 |
0.046pH 1.4 | [271] and refs. therein |
 |
0.347pH 2.0 | [271] and refs. therein |
 |
0.17pH 11.5 | [271] and refs. therein |
 |
0.021pH 11.7 | [271] and refs. therein |
 |
0.64 | [276] |
Additional components other than water represent further precursors for photolytically generated reactive species. Photolysis of nitrite, for example, will result in the formation of nitric oxide radicals and atomic oxygen ion radicals, which in water will lead to the formation of OH [271]. In particular, at wavelengths higher than 200 nm, depending on the water composition, this pathway can dominate OH generation. Photo-dissociation can result in excited products. For nitrite photochemistry, this results in a branching of possible reaction products [271]. Also for ozone, the relatively weak O2–O bond of ~1 eV results in excess photon-energy from UV-photons, which can lead to excitation of the fragment species [272].
In [182], studies on the kINPen interacting with water and more complex biological relevant liquids showed the effect of plasma-generated VUV radiation on reactive species generation. For this, the kINPen was compared in two plasma liquid treatment modes: plasma jet in direct contact with liquid on the one hand, and on the other, plasma jet interaction with a glass-, quartz-, or MgF2-plate covered liquid to study solely the effect of (V)UV radiation. It was shown that plasma-generated VUV radiation can generate oxygen radicals (see figure 48) as well as H2O2. Oxygen radicals were measured by EPR spectroscopy using spin trap compounds (see section 2.5.2). H2O2 generation by VUV radiation was in the order of mmol, while OH and  -spin trap adduct concentrations were in the order of nmol [182]. Photolytically generated H2O2 most probably originates from OH-radicals, which means that twice as much OH than H2O2 should be observed. Why this is not reflected in the measurements, however, could be due to the missing convection in the MgF2-covered liquid for the VUV treatment, leading to depletion of the spin trap used for the detection of radicals. It can be assumed that locally many more radicals are generated than can be detected by the chosen method. The study performed in [182] revealed that in buffered medium as well as in cell culture medium (V)UV-induced photochemistry generates the same amount of spin trap radical adduct as in pure water, while direct plasma jet treatment generates increasingly more spin-trap oxygen radical adducts in the more complex media.

Figure 48. Oxygen radicals generated by all reactive components of the plasma jet (complete jet) and by VUV/UV-radiation only (5 ml ultrapure water for complete jet measurements, 80 µl ultrapure water in a micro-chamber covered with a quartz or MgF2 window for UV and VUV radiation studies). Reproduced from [182]. CC BY 3.0.
Download figure:
Standard image High-resolution imageTo summarize: VUV radiation contributes to reactive species generation dominantly through dissociation of water—even in more complex media—and has to be taken into account when plasma liquid interaction is studied.
3.8.2. Flow effects.
In [277], the plasma jet kINPen interacting with a liquid surface (see figure 49(c)) was compared to a pure argon flow on the liquid surface (see figure 49(b)). While the induced liquid recirculation was independent whether the plasma was on or off, the dimple in the water surface induced by the gas flow was about 30% less pronounced with the plasma switched on compared to the off case. This was attributed to either a net electrical field of the plasma sheath or a charge transfer leading to an upwards-directed drag on the water surface.
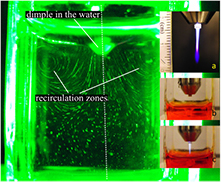
Figure 49. A flow profile of kINPen-treated liquid [277]. Main picture: the recirculation zones of the plasma-treated liquid illuminated with a green laser sheath and a dimple initiated by the plasma jet. Impact insets: (a) a photograph of the kINPen, (b) gas flow on liquid, plasma off; (c) gas flow on liquid, plasma on. © 2014 IEEE. Reprinted, with permission, from [277].
Download figure:
Standard image High-resolution imageA planar laser sheet was used to illuminate the liquid. The kINPen was operated at a lower gas flux of 1.9 slm. The highest velocity derived from the laser scattering on micro-bubbles was 12 mm s−1. A methyl orange test, which indicates acidification as the colour changes from red to orange, was performed [277], revealing that acidification occurs at diffusion time constants. This means that for a high gas flow, as used in the kINPen, transport in liquids needs to be considered. In addition to the stochastic position of the argon plasma streamer on the surface, liquid convection results in a continuously renewed liquid volume. This has a significant effect on the reaction kinetics, as high density gradients are levelled out. In [278], a model of streamer-induced liquid chemistry generated by a stationary streamer on the one hand and by a moving streamer on the other were compared, and strong differences in the end products were observed. Additionally, stirring and high gas flow result in a degasing of the liquid, as was shown in [279], where the oxygen content of cell culture medium was reduced by half following 60 s plasma treatment. Oxygen loss of 25% already occurs during pure argon flow treatment and can be attributed to flow-induced degassing. The additional 25% oxygen loss either originates from different flow conditions with the plasma switched on, or it is caused by chemical reactions. Recently, it was found that treatment of water with the kINPen leads to an enrichment with heavy isotopes, namely 2H and 18O [280]. Heavy isotope enrichment by plasma was significantly higher than enrichment with heavy isotopes by a comparable gas flow without plasma. Dominant reactive species and reaction processes interlinking gas phase and liquid phase chemistry are described in the following.
3.8.3. Reactive species.
Plasma treatment of liquids generates reactivity through the processes mentioned in figure 47. In [115], it was demonstrated that the kINPen generates hydrogen peroxide in plasma-treated liquids. It could be shown that the net production rate of H2O2 in the gas phase is the same as in the liquid phase (see figure 50). The production rate in the gas phase was calculated from the measured H2O2 concentration and the gas flow velocity. The production rate in the liquid phase was calculated from the measured H2O2 concentration and the treatment time. It was found that hydrogen peroxide production, as well as OH generation in the gas phase, increases linearly with humidity admixture to the argon feed gas in the studied regime of water concentration up to 1600 ppm. Humidity was measured with a dew-point hygrometer. The same results were found in a study on OH for the kINPen in [129]. Here, for higher feed gas admixtures, the OH concentration saturates. In [115], it was furthermore shown that hydrogen peroxide can be assumed to be dominantly responsible for a reduction in cell viability of human skin cells, as studied by a redox-based cell viability assay [281]. A study of water admixture to the feed gas versus the water admixture to the surrounding shielding gas showed that the feed gas water admixture led to an about 20 times higher hydrogen peroxide production than ambient humidity [131]. From an application point of view, this means that the plasma jet can be operated with no relevant impact from changes in the atmospheric humidity conditions. The ambient humidity has a low impact, since the major part of the energy dissipation occurs in the core plasma region inside the capillary (see figure 37), which is protected from changes in the ambient. Feed gas humidity, however, can have a significant effect, for example, in plasma medical applications, due to the resulting OH formation: plasma-generated OH radicals can cause lipid peroxidation processes. In a biophysical phospholipid liposome cell model, it was shown that plasma treatment initiates a macroscopic structural change to the liposomes [282]. While structural changes of the phospholipid layer typically originate from lipid tail group oxidation, a recent study comparing plasma-oxidized lipids with molecular dynamics simulations showed that also head group oxidation leads to structural changes of the lipid layer [283].
Figure 50. Net production rate of H2O2 in the gas phase and in the liquid phase (5 ml complete cell growth medium (Roswell Park Memorial Institute) RPMI 1640 + 8% fetal calf serum +1% penicillin/streptomycin solution). Reproduced from [115]. © IOP Publishing Ltd. All rights reserved.
Download figure:
Standard image High-resolution imageHydrogen peroxide is expected to be produced either in the gas phase through a recombination of OH, or in the interphase and liquid phase region. However, while with increasing feed gas humidity, the H2O2 concentration increases linearly in the liquid and in the gas phase (see figure 50), the OH radical concentration increases linearly in the gas phase, but remains constant in the liquid phase, independent of the feed gas humidity. The linearly increasing H2O2 concentration does thus not originate dominantly from aqueous OH. These findings agree with studies on H2O2 formation in sonochemistry [284], stating that hydrogen peroxide, if formed from OH, does not originate from the liquid but from the cavitation phase. H2O2 has a high Henry's constant, which is almost 7 orders of magnitude higher than that of ozone [285]. Therefore, gas-phase H2O2 is very likely to be transferred to the treated liquid. In [284], three additional generation mechanisms for hydrogen peroxide are proposed, which are similarly possible in plasma liquid interaction as in sonochemistry. First, hydrogen peroxide can be produced by the dismutation of superoxide anion, which is a process that is also observed in biological systems [286]. A second generation pathway is through atomic oxygen, where recombination with water forms hydrogen peroxide. The study in [284] found that this is a fast reaction and can compete in its reaction rate with the formation of ozone through the reaction of atomic oxygen with molecular oxygen. A third pathway is through the recombination of water molecules with excited water molecules, as earlier studies in radiology found [287]. In all pathways, the generation of hydrogen peroxide from water molecules is independent of the pH values in the range from 6 to 9 [287].
On several reactive species other than hydrogen peroxide, the pH value has a larger influence. The pH value of unbuffered aqueous solutions changes through plasma treatment. In many cases, the liquid becomes more acidic. Several studies have tried to identify the cause for the acidification, with peroxinitrous acid being discussed as one of the candidate species for this so-called plasma acid. To study the effect of nitrogen and oxygen reactive species on liquid treatment with the kINPen, curtain gas variations were performed. A variation of the curtain gas composition from pure oxygen to pure nitrogen resulted in a decrease of the pH. The lowest pH value was achieved at an oxygen to nitrogen ratio that resembles the composition of air [288]. In carbonate-buffered media, kINPen treatment leads to an increase in pH value, which is attributed to a degassing of the carbonate buffer [288].
The lowest pH value correlates to the highest amount of nitrite and nitrate at 25% oxygen and 75% nitrogen, which is close to air composition conditions (see figure 51). The study was performed in non-buffered saline solution. For formation of nitrite and nitrate, both nitrogen and oxygen are required, which is why at 0% nitrogen, neither nitrite nor nitrate were detected. In the case of a pure nitrogen curtain, however, nitrite and nitrate were produced. A possible explanation might be the influence of nitrogen metastable species [139, 289] or VUV radiation resulting in oxygen species generation from water [182]. Gas phase and liquid phase chemistry are linked, and gas phase ROS and RNS dynamics correlate with liquid phase ROS and RNS dynamics for varying gas curtain compositions (see figure 46). Measured nitrite and nitrate concentrations in sodium chloride solution [49], shown in figure 51, exhibit comparable dynamics to HNO2 and HNO3 as well as NO2 in the gas phase [124]. In [124], gas phase species were measured in an FTIR multipass cell (setup shown in figure 13(a)) as a function of varying shielding gas composition and simulated with a model described in section 2.6.1. In the simulation, the concentration maximum of HNO3 densities is slightly shifted towards higher nitrogen concentrations in the shielding gas in comparison with the maximum of HNO2. The same trend is observed for nitrite and nitrate in the liquid phase, respectively. While the measurements are performed at different conditions, and the simulations could not yet be validated, it is still noteworthy that similar trends can be observed, allowing conclusions about generation mechanisms: generation mechanisms of nitric and nitrous acid in the gas phase are dominated by the following reactions:


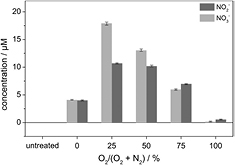
Figure 51. Nitrite and nitrate values in liquid (5 ml sodium chloride solution at treatment times of 10 min) (bar graph) measured for the kINPen09. The experiments were performed with pure argon feed gas. Reprinted with permission from [49]. Copyright 2015, AIP Publishing LLC.
Download figure:
Standard image High-resolution imageHNO2 can be transformed to HNO3 by (R10) followed by (R9) [19]

The reaction of hydrogen peroxide with nitrite leads to the generation of peroxynitrous acid according to (R11) [171]

which can lead to the formation of nitrate. In a buffered system, H+ can be considered constant, and (R11) can be described with a pseudo-second-order rate constant [171]. From the time development of hydrogen peroxide, nitrite and nitrate, the formation of peroxynitrite can thus be determined [171]. Peroxinitrous acid decomposes into biologically active OH and NO2 radicals:

Studies with the kINPen on bacterial inactivation mechanisms [181] show the often-observed increasing bacterial inactivation efficacy of plasma-treated Escherichia coli bacterial physiological solution with increasing treatment times. Measurements of reactive species in the liquid media show increasing nitrite, nitrate and hydrogen peroxide concentrations (see figure 52). The work suggests that bacterial inactivation mechanisms are at least partially due to OH and NO2 radicals from (R12), from post-discharge chemistry.
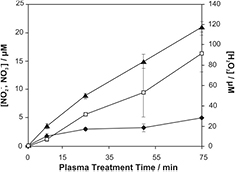
Figure 52. The formation of nitrites (◆), nitrates (□) and hydrogen peroxide (▴) in an aqueous solution (10 ml water treated with a kINPen09 at a distance of 6 mm to the liquid surface). Reprinted from [181]. Copyright 2015, with permission from Elsevier.
Download figure:
Standard image High-resolution imageControl over nitrogen and oxygen species allows us to control the biologic impact of plasma treatment: in [49], it was found that the condition of 25% oxygen to 75% nitrogen in the curtain gas shown in figure 51 led to a maximal inactivation of bacteria, while at the same time having the least impact on human skin cells. This study has the potential to form the basis for a tailored plasma wound treatment: switching the plasma composition to achieve bacterial inactivation, human cell inactivation (e.g. for cancer treatment), or stimulation of cell proliferation (wound healing), may in future be a unique feature of plasma-based therapy. Using feedback signals, tailored plasma chemistry will allow treating diseased tissue with certain parameters, and healthy tissue with different parameters within the same treatment.
Open questions still remain on the role of short-living active plasma species—not least due to the difficulties in their detection. Short-living plasma species can be excited species, charged species, atomic or molecular radicals, and other highly reactive molecules. Ions can be found in the effluent of the kINPen, as shown in figure 38. Their concentration—if derived from quasi-neutrality—lies around a density of 1012 cm−3, with quick recombination in the effluent. Ions can be stabilized by cluster formation, and their role in plasma liquid interaction still needs to be investigated. While plasma generated radicals and atoms can reach concentrations that are three orders of magnitude higher, ions can still play a vital role. Negative ions, for example, reduce the size of nano-bubbles [290]—bubbles with a diameter smaller than a micrometre [291]—and thus reduce stable pockets of gas reservoirs that can contribute to plasma-generated liquid chemistry. Recently, it was found that plasma-generated neutrals change the surface structure at the air/water interface [292]. It has been found in tropospheric chemistry that both hydrophobic and hydrophilic species saturate at the air/liquid interface [293], which shows its significance for chemical reactions. A special role must be attributed to the class of metastable neutrals generated by plasma. The kINPen is, depending on the operating gases and parameters, a source of ample metastable species including helium [21], argon [124], oxygen and nitrogen metastables [139]. These species carry an energy in the range of molecular bonds or ionization energy levels and have a long lifetime that can reach minutes. These properties make metastable species key candidates for an energy transfer to superficial layers of liquids or biological tissue. Metastables may be involved in the generation of reactive species in plasma-treated liquids, as discussed in a study of kINPen liquid treatment [289]. In medicine, plasma-generated singlet oxygen is stated to play a dominant role in tumour reduction [294], based on an inactivation of membrane bound catalase [295].
In particular, for an identification of the role of short-living species in plasma liquid interaction, important information can be gained by comparing plasma sources that differ only in few aspects. In [296], the kINPen was compared to an rf argon plasma jet of similar build. The main differences are the needle electrode position, the operating frequency of 13.56 MHz compared to 1.1 MHz for the kINPen, the gas flow, and the grounded electrode size. In [296], the findings of [130] were confirmed that cell viability in in vitro plasma treatment experiments depends purely on the H2O2 generation in the treated medium: both jets exhibit a distinct difference in hydrogen peroxide production as a function of distance (see figure 53). The rf jet exhibits a step in hydrogen peroxide concentration and the kINPen generates a more or less constant value. The stepwise concentration development indicates that short-living species are involved in hydrogen peroxide generation. At distances where the short-living species are not present anymore, the kINPen generates more hydrogen peroxide compared to the rf jet. This may indicate a gas-born generation of hydrogen peroxide. Although the authors did not identify the cause for the step in the hydrogen peroxide concentration, several hypotheses can be made:
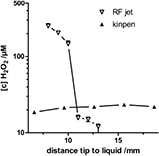
Figure 53. Production of H2O2 in phosphate-buffered saline solution with 1 g l−1 glucose as a function of the distance of the jet nozzle to the solution, 60 s treatment with an argon rf jet or kINPen. Reproduced from [296]. CC BY 3.0.
Download figure:
Standard image High-resolution imageThe most distinctive difference is the excitation frequency of the two jets. The excitation frequency in atmospheric pressure discharges influences the plasma sheath thickness. The higher the frequency, the closer electrons are to the electrode surface [297]. Another (possible) difference between the two jets is that one jet might come into contact with the liquid surface (depending on the distance), while the other one might not. A model calculation showed that touching versus non-touching case can lead to differences in hydrogen peroxide production by orders of magnitude [263]. An influx of electrons from the plasma may lead to the formation of solvated electrons [298]. Electron beam irradiation—although at completely different energy regimes—is known to generate hydrogen peroxide [299]. The different excitation frequencies of the plasma jets can furthermore result in a higher atomic oxygen concentration for the rf jet [296]. Atomic oxygen has been identified to play a role in plasma-initiated liquid chemistry [300, 301], and, as previously stated, can lead to the formation of hydrogen peroxide [284]. From a parameter study of the rf jet, it was concluded that dominant reaction pathways include interaction of atomic oxygen and chlorine forming  and ClO−.
A further, highly reactive short-living species is the hydro-peroxy radical (HO2), which has been measured in the kINPen effluent recently. HO2 concentrations were determined by cavity-enhanced AS [126].
In liquid media, hydroperoxy radicals are in equilibrium with superoxide anions [302] according to the pH value via

The formation of hydroperoxy radicals from superoxide anions at pH values lower than 4.8 leads to a pH dependence of bactericidal activity of plasma-activated liquid [302]. Both species are highly active and have a low lifetime in liquids [303].  is generated by plasma in the gas phase (see figure 38) and its concentration in the liquid can be influenced through a variation of the ambient gas composition around the plasma effluent.
  can also be generated in liquid through reactions of peroxinitric acid with hydrogen peroxide [304, 305]. For the kINPen, in a model-based evaluation of the liquid measurements of hydrogen peroxide, it was shown that HO2 plays a role in the gas phase reaction pathways leading to the generation of H2O2 via OH. A comparison of the gas phase chemistry with an analysis of the liquid connects the reactions of OH, H2O2 and HO2. The study [232] showed that the development of hydrogen peroxide in plasma-treated buffered medium by varying the oxygen to nitrogen ratio in a gas curtain can be explained by the reactions involving these three species. The OH dynamics calculated by the reaction model [124] follows the hydrogen peroxide concentration in the liquid (see figure 54), suggesting that gas phase OH and liquid phase hydrogen peroxide are strongly linked. Interestingly, a sharp increase by a factor of 1.5 towards 0% of oxygen in the hydrogen peroxide concentration was reproduced by the model calculations. The explanation for this increase was given by the model to originate from a large increase in HO2 concentration for small oxygen concentrations in the curtain gas [232]. HO2 concentrations in the proposed quantities were confirmed by cavity-enhanced AS [126]. The results shown in figure 54 support an assumption that an enriched concentration of gas phase OH at the gas/liquid interface is a potential origin for liquid hydrogen peroxide.
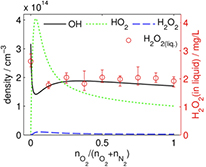
Figure 54. Comparison of the gas phase model and measurements in the liquid phase [232] (liquid measurements performed in 5 ml sodium chloride solution treated at 9 mm distance from the kINPen09 nozzle according to [48]). Reproduced with permission from [232].
Download figure:
Standard image High-resolution imageSummarizing, it can be stated that the role of the gas/liquid interface in plasma liquid interaction is still a topic for future studies [165, 260]. A lot can be gained from including perspectives from adjacent research fields, such as electron beam studies [299], sonochemistry [306], or photocatalytic chemistry, where plasma-generated electrons replace photocatalytically generated electrons and similar processes occur, for example in hydrogen peroxide formation [307]. The interdisciplinary exchange at the boundary of physics and chemistry will help reveal further fundamental mechanisms of plasma liquid interaction.
4. Applications
The kINPen has been developed from a laboratory prototype to a multi-use commercial plasma source. In particular, its certification as a medical device has received great attention worldwide. In the final chapter of this review, a brief introduction to the field of applications for the plasma jet is given. The interested reader is referred to the following reviews [1, 5, 8, 14, 17, 28, 41, 87, 308–314].
4.1. Surface modification
The kINPen was first studied for surface applications [315]. Its operation in argon and its relatively low gas temperature make it an ideal plasma source for sensitive surface treatments [36, 316]. The kINPen IND (neoplas GmbH, Greifswald, Germany) is aimed at technical applications of the kINPen, for example, in the optical, printing and synthetics industries. Applications range from the cleaning of surfaces in microelectronics (see figure 55(a)) [29], surface activation for the improved adhesion of paint and glue (see figure 55(c)), to enhancement of the contrast for scanning electron microscopy images (see figure 55(b)) [317, 318]. Applications in decontamination were sought in [35, 319]. The cold temperature allows treating polymers, and the kINPen has the property to enter complex cavities, as was proven in a stack of polymer discs with openings that formed a meandering cavity, through which the kINPen effluent is guided (see figure 55(f)) [320]. The generation of highly reactive oxygen species makes the kINPen suitable for etching polymers like polyetheretherketone [39] (see figure 56). In [39], it was shown that the etched polymer mass correlates to atomic oxygen concentrations. With the kINPen08, high etching rates of up to 300 nm s−1 were achieved [24].
Figure 55. (a) Cleaning of soldering contacts [29]; (b) cleaning of contaminations after SEM imaging, with kind permission from LOT quantum design [317] (see also [318]); (c) pretreatment of polymer surfaces for varnish adhesion improvement; (d) soot removal from house plaster [321]; (e) cleaning and restoring of daguerreotypes; (f) plasma treatment through a meander-like cavity in a stack of 24 PC-slices [320]. (a) Reproduced with permission from [29]. © neoplas GmbH. (b) Reproduced with permission from [317]. (d) Reproduced with permission from [321]. (e) [322] John Wiley & Sons. © 2016 WILEY-VCH Verlag GmbH & Co. KGaA, Weinheim. (f) Reproduced with permission from [320].
Download figure:
Standard image High-resolution image
Figure 56. Etching profile of polyetheretherketone (PEEK) by kINPen treatment, and an overlay of the atomic oxygen concentration at the treating distance measured by TALIF-spectroscopy. © 2012 IEEE. Reprinted, with permission, from [147].
Download figure:
Standard image High-resolution imageThe kINPen09 has been used for the deposition of zinc containing films [323], with zinc nitrate hexahydrate salt dissolved in water used as a source for zinc.
Recently, the kINPen was used in liquid-assisted plasma-enhanced chemical vapour deposition (LA PECVD) [324] for the synthesis of SiOx thin films from a liquid precursor. Using different liquid organosilicon precursor materials—namely HMDSO, TTMS and OMCTS—SiOx plasma polymers were generated with different stoichiometry (see figure 57). The films had a roughness of only 0.4 nm, and after annealing up to 550 °C, the film material was fully comparable to material synthesized by conventional PECVD and was well homogenized throughout the film. The advantage of this deposition method is that films can be deposited from liquids with less vapour pressure than needed for vapour transport in PECVD setups [324].
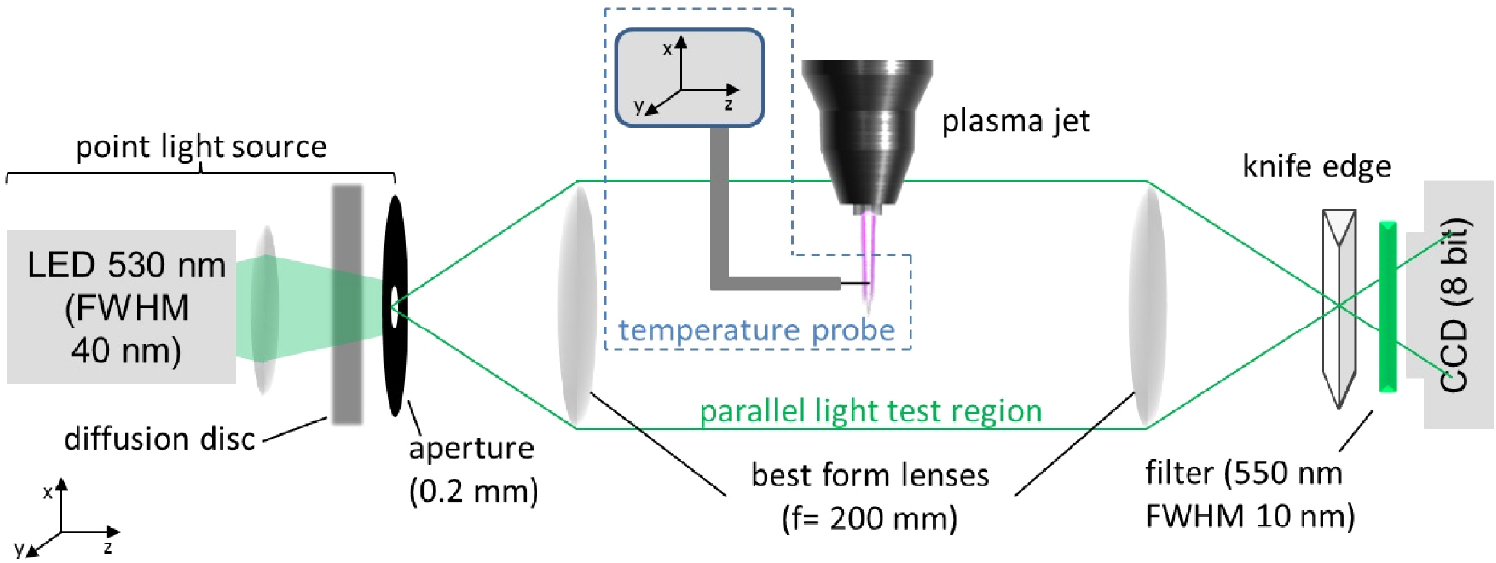
Figure 57. Dynamic changes of thin SiOx films deposited by liquid-assisted plasma- enhanced chemical vapour deposition during their vacuum annealing up to 550 °C. The coefficients x1,2 denote different views on the stoichiometry of the SiOx network; n is the mean oxidation degree. The difference between the characteristics (development of x1 and x2 with annealing temperature = coloured areas) demonstrates the chemical homogenization of the films with temperature. Reprinted from [326], Copyright 2017, with permission from Elsevier.
Download figure:
Standard image High-resolution image
The low invasiveness of the kINPen also allows it to be applied in architecture for soot removal from house plaster (see figure 55(d)). Soot removal with the kINPen compared to plasma torches took considerably longer, but the surface was not altered, as was the case for the other studied sources [321]. Plasma-based processes may thus be useful for restoration of stone or polymer art and architecture [325]. A further application for treatment of sensitive surfaces is the restoration of daguerreotypes in [322] (see figure 55(e)). Here, the use of hydrogen allowed a recovery of the oxidized parts of the picture.
The plasma jet has been used for interaction with cells or biomaterials with the aim of functionalizing the surface, for example, for cell growth on implants or to decontaminate biological surfaces, such as bone, with the aim of investigating the potential anti-bacterial efficacy of the kINPen in comparison to common treatment options in decontamination of superinfected bone [326] (see also figure 55). Plasma treatment with the kINPen improves bonding properties, which becomes relevant in the gluing of implant materials [327, 328], for example. In the Campus PlasmaMed [41] and the ZIK plasmatis, the kINPen has been further developed to meet the requirements of a medical product and is now used in plasma medicine.
4.2. Plasma medicine
Based on comprehensive biological, pre-clinical and clinical characterization [17], including comprehensive risk assessment [329–334], the kINPen MED (neoplas tools GmbH, Greifswald, Germany) received its certification as a medical device class IIa in 2013. Its use is mainly designated for treatment of chronic, infected wounds as well as skin diseases caused by pathogens. The first routine applications in medical practices, in clinics and in doctor's offices—predominantly in Germany—have started. To date, the device has been applied in the treatment of long-lasting chronic and infected wounds, particularly in cases where conventional treatment fails. As a preliminary result, the re-start or acceleration of the wound healing process up to complete wound closure is reported in more than 80% of the patients. Additionally, clinical users emphasize the kINPen's efficacy in eradicating multiple-drug-resistant bacteria (e.g. MRSA). Its effectiveness at inactivating wound pathogens, including multi-resistant bacteria, is well documented [335–342]. It is also reported that the kINPen can decontaminate skin [338]. The kINPen MED is also effective at supporting the healing of non-infected, acute (iatrogenic) wounds, as has been demonstrated in several case studies [343–345]. This therapeutic effect relating to direct stimulation of cell proliferation and tissue regeneration has also been confirmed for the kINPen by several cell and molecular biological [334, 345–362] as well as animal studies [363]. The kINPen MED has been shown to be active against inflammatory diseases of the skin [364]. A very promising niche application of the kINPen MED in cardiology is its use to treat superficial infections and inflammations of transcutaneous exit ports of the drivelines of ventricular assist devices [365]. Plasma treatment with the kINPen has shown to increase blood coagulation, which may be used to prevent haemorrhaging and to seal wounds against infection [366]. The kINPen VET is used to treat chronic wounds in animals [367].
An increasing topic of research in recent years is the application of plasma in cancer treatment [14, 368–370]. The ability to induce apoptosis in cancer cells by kINPen treatment has been demonstrated not only in vitro using cell cultures [346, 347, 357, 371–376], but also in semi-in vivo tumour models and in tumour tissue in vivo [377, 378]. However, clinical application in cancer treatment needs much more fundamental pre-clinical and clinical research. A next target of research is the supportive application of the kINPen MED in tumour surgery to inactivate possibly remaining cancer cells in cases where large-area surgical eradication is not possible [312], such as tumour tissue with neighbouring blood vessels. At present, a promising use of the kINPen MED in cancer treatment is in palliative care to reduce microbial load and the resulting typical fetid odour on surfaces of intraoral and extroral ulcerations of advanced squamous cell carcinomas of the head and neck area [379].
Another important field of kINPen application with high practical potential is in dentistry. Besides wound healing, the disinfection of tooth root canals and bones [40, 328, 380, 381], the treatment of teeth or dental implants, mainly to remove biofilms [25, 38, 60, 63, 382–385], or to improve cell spreading on tooth or implant surfaces [326, 386–390], the enhancement of the bond strength of orthodontic brackets [311], and the therapy of intraoral infections [385], are particularly promising fields of future application. kINPen treatment has also shown to increase the integration of implants in bone tissue [391]. However, despite strong research effort during the last few years, clinical application of cold atmospheric pressure plasmas in dentistry is rare up to now.
An indirect medical application of the kINPen is its use to prepare or optimize materials, surfaces or devices to become medically useable, such as antimicrobial treatment or functionalization of polymer implant surfaces [392–396], for example. Apart from plasma medicine, the kINPen has also been applied in biotechnology to increase the yield of plant-based pharmaceuticals [310, 397, 398]. Furthermore, with interest increasing in the field of plasma for food safety and for use in agriculture, the kINPen has been studied for its capability in food decontamination [399–402].
It can be summarized that the kINPen has found many fields of application due to its low energy dissipation at high reactivity that allows the treatment of sensitive systems with novel and exciting results.
Acknowledgments
Much of the reported work has been performed at the Leibniz Institute for Plasma Science and Technology INP, Greifs-wald, where the kINPen was developed, and at the Centre for Innovation Competence (ZIK) plasmatis, initiated by Prof Dr K-D Weltmann and Professor Dr Th von Woedtke, where fundamental research on plasmas interacting with liquids and biological systems is performed.
SR wishes to thank the members of his physics-oriented plasmatis research group, 'Extracellular Effects' (BMBF FKZ 03Z2DN12): J Winter, A Schmidt-Bleker, H Jablonowski, S Iseni, M Hammer, and M Dünnbier, who have performed many of the reported studies, as well as the cooperation partners, especially: A Bogaerts, P Bruggeman, B Graham, D Graves, S Hamaguchi, M Kushner, P Lukes, Z Machala, K Ostrikov, G Ritchie, A Rousseau and JS-Sousa. Thanks to all INP co-workers for support and cooperation. Discussions with N Lembke, T Gerling and R Titze about kINPen development are gratefully acknowledged. Thanks to JH van Helden, and for information about the commercial versions of the kINPen to C Theel and R Schönebeck; furthermore, for help with figures thanks to M Glawe and C Desjardin. Thanks to all authors, publishers and companies for their permission to reproduce figures from their work. SR would like to thank his international colleagues for many inspiring discussions on plasma liquid interaction, especially also within the European COST action TD1208 'Electrical discharges in contact with liquids for future applications', and at Mechanical and Aerospace Engineering Department of Princeton University. He expresses his gratitude to the Alexander von Humboldt Foundation and Princeton University for current funding.
Footnotes
- 4
kINPen® and derived names are registered trademarks. For better readability the plasma source is referred to as kINPen throughout the manuscript.
- 5
Questions regarding current and future research on the kINPen at the INP Greifswald can be directed to the Scientific Director: