
Abstract
The linear-quadratic model is one of the key tools in radiation biology and physics. It provides a simple relationship between cell survival and delivered dose:  , and has been used extensively to analyse and predict responses to ionising radiation both in vitro and in vivo. Despite its ubiquity, there remain questions about its interpretation and wider applicability—Is it a convenient empirical fit or representative of some deeper mechanistic behaviour? Does a model of single-cell survival in vitro really correspond to clinical tissue responses? Is it applicable at very high and very low doses? Here, we review these issues, discussing current usage of the LQ model, its historical context, what we now know about its mechanistic underpinnings, and the potential challenges and confounding factors that arise when trying to apply it across a range of systems.
Export citation and abstract BibTeX RIS

Original content from this work may be used under the terms of the Creative Commons Attribution 3.0 licence. Any further distribution of this work must maintain attribution to the author(s) and the title of the work, journal citation and DOI.
Introduction
From almost immediately after the first radiotherapy treatments over 100 years ago, mathematical modelling has played an important role in how we understand and optimise radiation delivery for the treatment of cancer. The importance of mathematics in treatment planning goes without saying—the reconstruction of patient structures, optimisation of treatment fields and the calculation of delivered doses are all mathematically intensive techniques and key parts of modern radiotherapy. But radiotherapy has also a long history of biological modelling, as researchers attempted to better understand how radiation affects the body and how this could be optimised to maximize therapeutic benefit.
It is difficult to over-state the ubiquity of the linear-quadratic (LQ) dose response model in this area. Since its early formulations over 50 years ago, it has become the preferred method for characterising radiation effects in both the laboratory and the clinic. It has weathered a range of challenges from other models and remains the first (and often only) choice for researchers and clinicians in a range of applications, despite its simplicity—or perhaps thanks to it.
The most common expression of the LQ describes the survival probability of a cell following exposure to a single dose of radiation,  , as:
, as:

where  and
and  are parameters describing the cell's radiosensitivity, and
  is the dose to which it is exposed. When survival is typically plotted on a log scale, this gives a quadratic response curve, as illustrated in figure 1. This is often referred to as a 'shouldered' dose response curve—with an initial region dominated by the linear
  term at low doses, followed by increasing curvature as the quadratic
  term becomes more significant. The degree of curvature is frequently defined in terms of the
  ratio—this has units of Gy, and corresponds to the dose at which the linear
  and quadratic
  contributions are equal. Thus, cells with high
  ratios see a relatively constant rate of cell killing with increasing dose, while those with a low
  ratio show a pronounced curvature.

Figure 1. Illustration of LQ curves. Left: Responses for cell lines with high and low α/β ratios. High α/β cell lines (10 Gy) have nearly-constant rates of cell killing with increasing dose, while low α/β lines (3 Gy) show a pronounced curvature, with greater killing per unit dose at higher doses. Right: Separation into one- and two-hit kinetics. At low doses, response is dominated by one-hit events, while at higher doses multi-hit killing is more important. These effects are equal when the dose matches the  ratio of the cell line (5 Gy).
Download figure:
Standard image High-resolution imageAn intuitive interpretation of these two contributions to cell killing is that the α term reflects death from 'single hit' events—that is, lethal damage caused by a single incident particle—while the  term represents 'multiple hit' cell death resulting from the interaction of damage from different radiation tracks, which scales in proportion to the square of the dose. This concept is illustrated in figure 1.
This shouldered response is particularly significant if a dose is broken up into many small exposures. If cells are allowed sufficient time to recover after irradiation (on the order of 6–24 h), sub-lethal damage from the initial exposure will be fully repaired, and cells will respond as if they had not previously been irradiated, repeating the 'shouldered' part of the curve. Thus, for an exposure to  well-separated fractions of dose
  , the predicted survival is

where  is again the total exposure dose, given by
  . It can be seen that this leads to increases in cell survival by reducing the magnitude of the quadratic contribution to cell killing (as
  ). This sparing is limited for high
  lines where single-hit killing dominates, while low
  lines experience significant sparing (figure 2). This enables the relative level of cell killing in different populations to be tailored by adjusting the fractionation schedule, an observation which proved extremely important to the development of clinical radiotherapy, where it remains a key predictive tool.
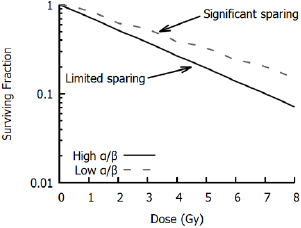
Figure 2. Illustration of impact of fractionation. In cells with the same  ratios as those in figure 1, splitting the treatment into well-separated 2 Gy fractions leads to a sparing effect by modulating the contribution of the
  component. This has a pronounced effect on survival in the low α/β cell lines, but relatively limited effects on high α/β cells.
Download figure:
Standard image High-resolution imageHowever, despite widespread usage of the LQ, there remain questions about its applicability. Its simplicity belies the complexity of the underlying biology, particularly in modern radiotherapy where we know that radiosensitivity can be modulated by both intrinsic genetic and phenotypic characteristics of the cell as well as extrinsic factors in the cellular environment and how radiation is delivered. As a result, many investigators have raised questions about the general validity of the LQ, and whether it truly represents underlying biology or is simply a useful empirical tool (Kirkpatrick et al 2009). These questions are particularly pressing as we seek to develop novel radiotherapy treatments, often in combination with other molecular agents.
This review discusses these issues in more detail, including the historical origins of the LQ, the biological mechanisms driving these cellular responses, and the prospects and challenges for continued use of the LQ in the future.
Historical background
Despite the modern prominence of the LQ, its origins cannot be simply traced back to a single source. A broad range of publications over several decades independently proposed models that are recognisably equivalent to the modern LQ, with justifications ranging from empirical fitting to detailed descriptions of DNA repair, emerging from both preclinical cell survival data as well as tissue iso-effect studies.
In vitro investigations of the effects of ionising radiation on different organisms began very shortly after the discovery of x-rays and other forms of ionising radiation at the end of the 19th century, and in the first few decades of the 20th century a number of reports were published describing biological responses to radiation. Due to the limited cell culture techniques available, most of these experiments were carried out in simpler organisms such as yeasts, bacteria and viruses. In the majority of these experiments, almost purely exponential response curves were obtained. This led to a number of investigators advancing a simple hypothesis for radiation-induced cell killing: exposure to ionising radiation causes damaging events (or 'hits') in proportion to the dose to which the cell is exposed (Crowther 1924, Curie 1929). If one of these hits occurs in a sensitive region (or 'target') in the cell, the cell then died.
If it is assumed that hits are Poisson distributed with a mean number proportional to the dose delivered, this 'single target' model gives a survival of:
Where  is the probability of a cell receiving
  hits following exposure to a dose of
  and
and  is the dose that leads to an average of one hit per cell (figure 3), reproducing the observed exponential dependence. Interestingly, based on
  and the number of ionisations caused by a given radiation exposure, the implied size of the radiation 'target' can be estimated. Early estimates suggested target sizes on the order of tens to hundreds of nm (Crowther 1924), which drew comparisons with the dimensions of the genetic material in chromosomes, and the suggestion that inactivation of viruses and bacteria was due to the formation of lethal mutations (Lea 1946).
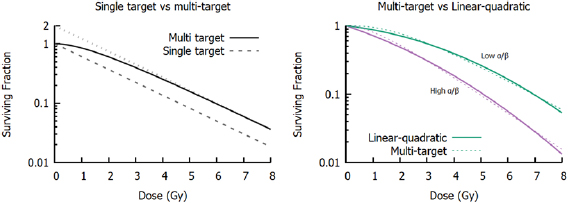
Figure 3. Left: Comparison of single- and multi-target survival models. Both models have  = 2 Gy, which corresponds to the slope at high doses, while the multi-target model has a target number of m = 2. The dotted line shows the extrapolation of the high-dose response to 0 Gy, with the intercept equal to m. Right: Comparison of LQ (solid lines) and multi-target models (dashed lines) for two different
  ratios. Although they have different underlying assumptions, it is often difficult to distinguish between the models, particularly if survival measurements are only available at a small number of doses.
Download figure:
Standard image High-resolution imageSingle target models dominated early radiation biology, even though investigations in some further biological systems began to show evidence for shouldered response curves (Alper et al 1960). However, interest in more sophisticated models expanded greatly following the work of Puck and Marcus which presented in vitro studies of radiation sensitivity in mammalian cells from both cancer and normal tissue (Puck and Marcus 1956, Puck et al 1957). Two major observations arose from studying mammalian cells: firstly, they were dramatically more sensitive to ionising radiation than viruses and bacteria; secondly, unlike simpler organisms, cells consistently showed shouldered response curves.
A number of generalisations of the single-hit single-target model were possible (Atwood and Norman 1949, Alper et al 1960, Fowler 1964), but the single-hit, multi-target model rapidly became the most common approach to these data. In this model, rather than assuming cells contained a single radiosensitive target, it is assumed they contain  targets, each of which must be inactivated. If the number of hits per target is still given by
  , then the probability of a single target being hit is given by
and thus the surviving probability (i.e. not all  targets are hit) is given as:
This model, illustrated in figure 3, reproduces the shouldered response, with an initial cell killing slope of zero. At higher doses, the slope of this curve becomes  , matching that of the single-hit single-target model. A similar approach—modelling single targets which require multiple hits to be inactivated—yields a similar overall trend (Fowler 1964).
While multi-hit curves can yield very similar results to the LQ model over typically studied dose ranges (figure 3), experimental disagreements began to arise at low and high doses. Evidence accumulated that many cells showed non-zero initial radiation response slopes, while at high doses many mammalian cells showed consistently increasing curvature (Barendsen et al 1960). And while a number of variants were proposed to address these issues (such as multi-hit multi-target models, or those which combined single-target and multi-target killing), these required additional fitting parameters which complicated analysis.
These experimental challenges were coupled with theoretical difficulties. While the high sensitivity of mammalian cells suggested that the 'targets' should be easy to visualise, there was limited progress in identifying them, with numerous disagreements about the value and interpretation of the target number  . For HeLa cells, Puck and Marcus fit their clonogenic survival data with an
  value of exactly 2 (Puck and Marcus 1956). This was justified based on the diploid nature of human cells, and by comparison with some early experiments in yeast that showed good correlation between ploidy and target number. However, this picture rapidly became more complex, as investigations in other cell lines showed an extremely broad range of
  , potentially up to hundreds for some cells (Fowler et al 1963). These observations led many authors to argue that rather than being a true number of targets,
  was instead an empirical descriptive factor. This was sometimes called the 'extrapolation number' of the curve, as this was the value at which the high-dose response crossed the y-axis when extrapolated back to zero dose, as shown in figure 3 (Alper et al 1960, Elkind and Sutton 2012).
Consequently, while target theory was the dominant approach for several decades, a number of other approaches were explored, including some that are recognisably similar to the modern LQ. Perhaps the earliest example of this was by Lea and Catcheside, who in 1942 fit chromosome aberration yields in Tradescantia seeds using a quadratic, and later predicted that only seeds free of chromosome aberrations were viable, which agreed well with experimental observations (Lea and Catcheside 1942, Lea 1946). Over the following decades, a number of other authors postulated LQ-like models, based on a range of motivations. In 1966, Sinclair published a review of cell survival curve models, where an LQ model is introduced as  , which Sinclair describes as an attempt 'to fit a mathematical expression to the shape of the curve and see if the result can be interpreted in terms of a model' (Sinclair 1966). By contrast, both Kellerer and Rossi (1971) and Chadwick and Leenhouts (1973) derived LQ models from theoretical models of the combination of damage from single- and multi-track events.
Kellerer and Rossi began from a relatively abstract two-step inactivation process, where undamaged cells could either be directly killed by a single particle, or moved into a 'pre-damaged' stage from which a second particle could lead to death. Chadwick and Leenhouts took a more mechanistic approach, arguing that it was the yield of DSBs which drove cell killing, and that these yields could be calculated based on the probability of DSBs being formed either by a pair of nearby backbone damages resulting from the same primary or by a combination of backbone damages from independent particles. In both models, after some modest simplifying assumptions, the average number of lethal events was found to follow a linear-quadratic relationship with dose.
Based on these experimental studies and theoretical discussions, LQ models grew rapidly in influence. This was further assisted by its simplicity and easily understandable parameters that could be linked with a number of other endpoints showing similar trends. But perhaps more importantly, the LQ model was also shown to be an effective tool to understand clinical responses, providing a direct link between the lab and clinical practice, discussed in more detail below.
Is the linear-quadratic model mechanistic?
However, even during its earliest applications, there were outstanding questions about the true nature of the LQ model. Its simplest empirical interpretation is that a Taylor series can be used to approximate any response using a polynomial, and examination of dose-response curves suggest that for practical doses only the  and
and  terms are significant. This simple argument was used by many investigators to justify quadratic dose response curves for a number of endpoints, including not only survival but also yields of mutations and chromosome aberrations (Lea and Catcheside 1942, Sinclair 1966, Lyon et al 1979).
Even at this level, the LQ remains useful as it still supports many of its key practical observations—such as one- and two-hit events giving rise to linear and quadratic terms, or the impact of fractionation—despite the mechanisms being left unspecified. However, this empirical approach hinders deeper analysis. Without an understanding of the underlying biology, it is difficult to develop rational links between observations in different systems, and we cannot apply our growing knowledge of fundamental radiation biology to better understand and optimise radiotherapy. As a result, there has been significant investigation into the mechanisms of LQ responses.
A number of early examples of the LQ came from approximations to models of misrepair processes, including the two-step model of Kellerer and Rossi (1971) and the Molecular Theory of Chadwick and Leenhouts (1973). As the LQ became more established, a number of other approaches were developed to attempt to put it on a more mechanistic footing, including the repair-misrepair (RMR) model (Tobias 1985), the lethal-potentially lethal (LPL) model (Curtis 1986), and the saturable repair model (Goodhead 1985). The RMR and LPL models are developed around the potential of 'lesions' interacting, similar to older models describing yields of chromosome aberrations (Lea and Catcheside 1942), while the saturable repair model takes a different approach, positing a single class of damage which cells have a limited capacity to repair.
In general, these responses were typically described in terms of three classes of damage: lethal damage, sub-lethal damage, and potentially lethal damage (Bedford 1991). Lethal damage refers to types of damage that are so severe that they cannot be repaired by the cell and will lead to death in all cases (say, extremely complex DNA damage), giving rise to the initial linear component of the dose response curve. Sub-lethal damage refers to less serious types of damage which will not be lethal on their own, but which can combine with further radiation-induced damage to kill the cell. This may represent, for example, simpler classes of DNA damage that can interact to form more serious lesions. As this involves the accumulation of multiple damage events, it gives rise to a curved component in the dose-response curve. Finally, potentially lethal damage refers to types of damage that are lethal in some cases, but not others—for example, cells forced to undergo division with unrepaired DNA damage may die due to a failure at mitosis, even if the damage could otherwise have been successfully repaired. Depending on the cell and environmental condition, this may contribute to the linear component, the quadratic component, or both.
These interpretations naturally yield LQ-like response curves, with directly lethal events giving rise to an initial linear component, and multi-track effects leading to increasing curvature, and can agree with experimental data over the ranges typically used in clonogenic assays. They also provide the potential to more naturally incorporate other effects, such as the impact of partial repair and dose rate on response. However, in all these cases they still abstract out much of the underlying biology.
This fact has become particularly significant as growing evidence indicates that the LQ model may not be a perfect description of all cellular responses. For example, in the phenomenon of low-dose hypersensitivity, some cells show dramatic sensitivity to low doses of radiation (typically <0.5 Gy) before plateauing or even exhibiting partial recovery before returning to an LQ-like response at higher doses (Joiner et al 2001). In addition, some investigators report that the dose-response curve begins to straighten at higher doses, leading some to propose that a linear-quadratic-linear dose response model is more appropriate (Astrahan 2008). Given these and other questions, together with the considerable advances that have been made in our understanding of radiation biology over the past 30 years, it is useful to review the mechanisms which govern how cells which respond to radiation, and their compatibility with the assumptions of the LQ model.
Mechanisms of radiation response
Initial damage
Many early target theory applications calculated target volumes which were consistent with the dimensions of a chromosome (Crowther 1924), and radiation's ability to induce mutations provided clear evidence that it was active against the genetic material of the cell, even before the nature of genes was fully understood (Lea 1946). Following the discovery of the structure of DNA, it became clear that radiation's ability to disrupt the structure of DNA was the major driver of its biological effects.
A range of experimental studies confirmed DNA's role as the key target for radiation sensitivity. Warters et al treated cells with radionuclides targeted to either the nucleus or the cell membrane. By analysing the sub-cellular dose distribution for each radionuclide, they were able to show that not only were the nuclear-targeted agents much more effective per unit activity, but that the activity of either agent that killed 50% of cells delivered the same dose to the nucleus. This was despite doses to the cytoplasm and membrane differing by several orders of magnitude (Warters et al 1978). This indicated that radiation targets outside nuclear DNA are only minimally sensitive, an observation which has been supported by a number of other sub-cellular irradiation studies (Munro 1970, Kaplan and Morgan 1998).
Radiation can induce DNA damage either directly by causing ionisations and breaking bonds within the DNA molecule itself, or indirectly by ionising other molecules (particularly water) which can then go on to interact with and disrupt DNA. A wide range of types of lesion can be created following these interactions (Ward 1988), but they can be broadly separated into two categories: base damage and strand breaks. Base damage represents structural changes to the DNA base pairs that make up the genetic code. These changes can range from the attachment of an OH molecule to the base to its complete removal. Strand breaks refer to damage to the sugar-phosphate backbone which disrupts the structure of the DNA helix. These are further sub-divided into single-strand breaks (SSB)—where the only one strand is damaged—and double-strand breaks (DSBs), where opposite strands are damaged in close proximity (typically separations of less than ten base pairs, or approximately 4 nm), which can lead to complete separation of the DNA molecule. On the order of 1000 damaged bases and SSBs are typically created following exposure of a cell to 1 Gy of x-rays, while the yield of DSBs is on the order of 30 to 40 per Gray (Ward 1988).
However, base damages and SSBs have only minimal biological impact. In both cases, the overall structure of the DNA molecule is likely to be intact and the cell can repair the damage both quickly and accurately, making use of the opposite undamaged strand as a template to ensure genetic integrity. This was demonstrated by a comparing the effects of hydrogen peroxide to ionising radiation. Hydrogen peroxide very efficiently generates SSBs via free radicals, but only rarely produces DSBs when SSBs coincide. Ward et al showed that doses of hydrogen peroxide which produced yields of SSB similar to 1 Gy of x-rays had no significant effect on cell survival. In fact, to cause significant toxicity hydrogen peroxide had to generate yields of SSB equivalent to thousands of Gray, highlighting the resistance of cells to these simple damages (Ward et al 1985).
As a result, despite their relative rarity, DNA double-strand breaks are widely accepted as the key driver of radiobiological effects in cells. Because DSBs involve the severing of both strands, often including 'dirty' ends with the modification or loss of multiple base pairs, there is no complementary strand to act as a template for repair. As a result, more complex processes are required to repair this damage, with a high probability of the introduction of at least small genetic alterations, if not large-scale genomic rearrangements.
Once DSBs were identified as the primary driver of radiation-induced biological effects, there were a number of hypotheses about how their yield related to the linear-quadratic dependence of cell survival. Some models proposed that DSBs themselves had a linear-quadratic dependence on dose (Chadwick and Leenhouts 1973), assuming that DSBs can either be formed directly by the interaction of a single incident particle or as a combination of SSB and other damage types from multiple particles. However, while these one- and two-hit effects can be observed in plasmid DNA, two-hit events typically only become significant at doses much higher than those used in clinical radiotherapy (Siddiqi and Bothe 1987). Instead, in mammalian cells the yield of DSBs is extremely linear over a dose range spanning 1 mGy to 100 Gy using a range of different quantification methods (Rothkamm and Löbrich 2003). As a result, the LQ dependence of survival cannot solely depend on the yield of DSBs, and must instead be mediated by the cell's response to these damages.
Double strand break repair
As noted above, 30–40 DSBs are induced per Gray of ionising radiation. However, even in relatively radiosensitive cells less than one lethal event is typically observed per Gray. This indicates that, although they are acknowledged as the primary driver of cell death, most DSBs are repaired correctly. Three pathways are primarily responsible for the repair of DSBs—nonhomologous end joining (NHEJ), homologous recombination (HR) and microhomology-mediated end joining (MMEJ).
In NHEJ, two free DNA ends are rapidly bound together and subjected to processing to remove damaged or mismatched nucleotides before the two strands are ligated together to restore the DNA structure. Because the end-processing and ligation steps can lead to the loss of genetic material at the site of repair, NHEJ can introduce small mutations, even in 'correctly' repaired DSBs. However, because it is available throughout the cell cycle and can be completed relatively rapidly (on the order of minutes for simple breaks) it is the dominant DSB repair process in mammalian cells (Waters et al 2014).
HR is a more complex process which takes advantage of duplicated DNA to carry out accurate repair. After DNA replication in the early S phase, each chromosome consists of two replicated sister chromatids with identical sequences. HR can then take advantage of these chromatids to support accurate repair of damage incurred in the late S and G2 phases. HR resects back the DNA strands near the DSB to expose undamaged ends on both sides of the break, and the sister chromatid is then used as a template to accurately fill in the resulting gap without loss of genetic information. While accurate, this process is restricted to the latter stages of the cell cycle where DNA has been replicated to provide a homologous template strand, and is a more complex and slower process than NHEJ (Krejci et al 2012). Significantly, because HR is a higher-fidelity process than NHEJ, this introduces a cell-cycle dependence to radiation sensitivity, with more accurate DSB repair in S and G2, and correspondingly greater radiation resistance.
NHEJ and HR are responsible for the resolution of almost all damage in repair competent-cells, but MMEJ (also known as Alternative-NHEJ) provides a backup process. MMEJ is similar to NHEJ, but resects both DSB ends to align DNA based on short (5–25 bp) homologous sections. This process leads to the loss of genetic material in almost all cases, and is highly prone to misalignment and incorrect repair (Deriano and Roth 2013). Crucially, however, it is very simple and flexible, providing a method to repair breaks which have proven resistant to other repair mechanisms (Iliakis et al 2015).
However, even if the cell has sufficient repair pathways to ensure all DSBs are re-joined, there is still a risk of a number of classes of incorrect repair, which can have significant negative effects on the cell.
Consequences of misrepair
Misrepair can be separated into two broad classes. Firstly, as noted above, NHEJ and MMEJ can introduce small alterations to the genome during repair due to the lack of reference template strands. These can involve the loss, duplication or alteration of one or a small numbers of base pairs. Although this class of event represents by far the majority of misrepair events, such changes often have only minor impacts—for example, if they occur in non-coding DNA—but may also lead to mutations in individual genes. In many cases these mutations are stable and compatible with cell survival and proliferation, although they may prove to be carcinogenic (Hoeijmakers 2001).
A much less common class of misrepair, which poses a much more significant challenge to cell survival, can occur when the repair processes incorrectly join ends from distinct DSBs, leading to large-scale reorganisations of genetic material known as chromosome aberrations. Gross chromosome aberrations can be visualised relatively easily with simple staining and microscopy techniques, and so were some of the earliest categories of radiation-induced cytogenetic changes to be studied (Sax 1938, 1940). It rapidly became clear that, although relatively rare compared to the total yield of DSBs, these changes were also some of the most biologically consequential effects of radiation.
Even in the simplest form—so-called 'binary' aberrations which involve only two DSBs—these can lead to a range of different reorganisations, depending on the regions of the chromosomes involved, with some of the major categories possible in G1 illustrated in figure 4 (Hlatky et al 2002). Chromosome aberrations can be broadly grouped according to two features. Firstly, whether they are inter-chromosome events, involving DSBs on two separate chromosomes, or intra-chromosome events, involving ends from two DSBs on the same chromosome. Secondly, whether they are symmetric or asymmetric—that is, whether each of the resulting re-joined chromosomes contain a single centromere, or if acentric and dicentric chromosomes are formed.
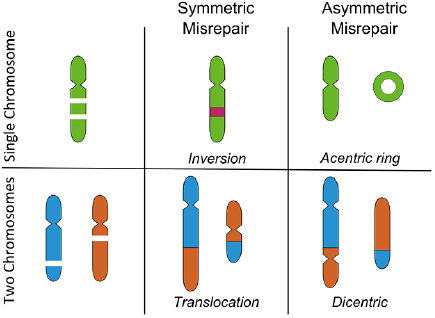
Figure 4. Illustration of some binary chromosome aberrations in G1. These events involve two breaks in either a single chromosome (top) or two chromosomes (bottom). Incorrect rejoining can lead to a range of biological effects, depending on whether the misrepair is symmetric (all chromosomes retain a centromere) or asymmetric (some chromosomes lack a centromere). Symmetric exchanges can lead to inversions or translocations, which are generally well tolerated by cells. Asymmetric exchanges cause the formation of acentric and dicentric fragments, which can lead to significant genetic loss or failure to complete mitosis.
Download figure:
Standard image High-resolution imageCentromeres are specialised sub-regions of the chromosome which link sister chromatids during replication, and are the binding site for kinetochores which ensure accurate chromosome separation during mitosis. Because of this, the asymmetric versus symmetric distinction is most significant for cell viability. While symmetric exchanges may move genetic material between two chromosomes or invert a portion of their sequence, outside the immediate vicinity of the DSBs this has little impact on cellular function. By contrast, asymmetric exchanges lead to the formation of structures that are not effectively processed during mitosis. Dicentric chromosomes may fail to separate and lead to mitotic catastrophe, while acentric DNA fragments will not be passed on during mitosis and lead to the loss of significant genetic material if large sections of a chromosome are lost. Symmetric and asymmetric events are believed to be equally likely, because the DNA ends involved are otherwise identical (Savage and Papworth 1982).
It should be noted that a range of further sub-divisions are also possible, particularly in late S and G2 phases where chromatid-type aberrations are also possible, when breaks lead to misrepair between replicated sister chromatids. In addition, higher-order interactions involving misrepair between multiple DSBs are also possible, leading to more complex exchanges. These effects are reviewed in more detail elsewhere (Hlatky et al 2002).
Of particular relevance to this review is the fact that chromosome aberrations were also some of the earliest biological effects to which linear-quadratic models were fit (Lea and Catcheside 1942). While many early investigators initially expected this to be a purely quadratic effect as each chromosome aberration required two 'hits'—now known to be DSBs—experiments suggested a two-component response (Lea 1946). Indeed, experiments at extremely low doses, dose rates, and with very low-energy radiation have all confirmed that chromosome aberrations can be formed by individual radiation-induced DSBs, even those which resemble two-hit events (Lloyd et al 1975, Cornforth et al 2002). The mechanism of these one-hit types of damage remains the subject of some debate, with several suggested mechanisms, including interaction of radiation-induced DSBs with endogenous damage (Pfeiffer et al 2000), or complex repair process failures interacting with undamaged DNA (Goodhead et al 1993).
However, even before the mechanisms of aberration formation were understood, the shape of their dose-response curve together with the similarity in yield with rates of cell killing led many investigators to suggest that chromosome aberrations were the key lethal event determining cell survival following ionising radiation. This was supported by research which showed that large structural changes—such as dicentric and large deletions—rapidly disappeared from a population of dividing cells, suggesting they were not compatible with continued cell survival (Carrano 1973, Brown and Attardi 2005).
This hypothesis was quantitatively confirmed by Cornforth and Bedford, who compared yields of chromosome aberrations in non-cycling AGO-1522 cells to cell survival following x-ray irradiation (Bedford and Cornforth 1987). These data (illustrated in figure 5) showed a 1:1 correlation between the types of aberration which were detected in their Giemsa stain assay (dicentrics, rings, large deletions) and the number of 'lethal events' per cell, defined as  , where
  is the surviving fraction. Similar results, although with slightly greater uncertainties, were also obtained for repair-defective cells. This indicated that despite representing only a small fraction of misrepair events, not only were these aberrations lethal, but in this experimental model they were the dominant driver of lethality.
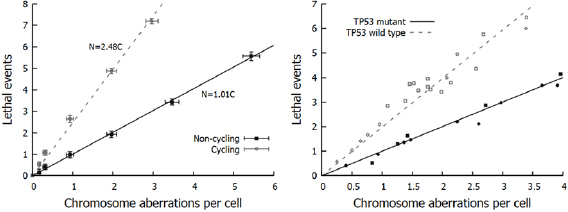
Figure 5. Relationship between chromosome aberrations and cell death. Left: In non-cycling normal AGO-1522 cells, chromosome aberrations and lethal events display an almost exactly 1:1 relationship. However, the rate of death is significantly greater in cycling cells, indicating other death pathways. (Derived from Bedford and Cornforth (1987)). Right: In cycling cells, these additional cell-death pathway depends on cell genetics. Even when cycling, TP53-mutant cells (closed symbols) show the 1:1 correlation between aberrations and cell survival, while TP53-competent cells (open symbols) show additional sensitivity as with AGO-1522 cells. (Derived from Borgmann et al 2004.)
Download figure:
Standard image High-resolution imageThe actual process by which cells die following chromosome aberration formation can vary according to the type of aberration formed and the cell's genetic background. This can include failure to successfully divide, the activation of programmed cell death (apoptosis (Watters Dianne 1999, Roos and Kaina 2013)), or less structured death due to the loss of key genetic functions (necrosis (Zong and Thompson 2006)). However these results suggested a relatively simple interpretation can be applied: If the yield of chromosome aberrations following radiation exposure is given by  , then clonogenic cell survival is given by the fraction free from aberrations, that is
  , indicating that the
  and
and  parameters describing the yield of chromosome aberrations are identical to the
  and
and  LQ parameters.
Unfortunately for those seeking a simple conceptual model, even within this dataset there was evidence that there were other mechanisms by which cells could be rendered non-viable.
Other cell death mechanisms
The direct relationship between aberrations and cell survival was observed in non-cycling cells, held in G0 and given 24 h to repair initial damage before being released into the cell cycle. By contrast, when cells were immediately released into the cell cycle, they showed significantly greater sensitivity to ionising radiation (figure 5). This pointed to additional death mechanisms due to unresolved damage in cycling cells.
Significantly, when these studies were repeated in cycling cells from different cell lines, it was seen that this effect depended on the cell's genetic background (Borgmann et al 2004). As illustrated in figure 5, two distinct groups are seen, which are separated by the presence of mutations in the TP53 gene. TP53 is a key gene in the maintenance of cellular genetic integrity, mutated in over 40% of cancers (Kandoth et al 2013). It is involved in the detection and repair of DNA damage, and activation of DNA-damage cell cycle checkpoints (Fei and El-Deiry 2003). Consequently, this dependence points to the involvement of active cell death processes in cycling cells.
Exposure to ionising radiation induces a number of cellular responses. In particular, cell cycle checkpoints are activated (particularly at the G1/S and G2/M transitions) to prevent cell cycle progression with unresolved damage. Most commonly, this is a short-term delay in cell cycle progression to allow the cell time to repair small amounts of damage (Deckbar et al 2011). Faced with larger amounts of damage, cells can alternatively enter a state of permanent arrest known as senescence (Ewald et al 2010). In this state, the cell will not undergo any further division, but may remain alive for extended periods. Finally, apoptosis may also be triggered rapidly in response to significant levels of genetic damage (Dewey et al 1995, Watters Dianne 1999, Roos and Kaina 2013). As this active apoptosis process typically occurs within 24 h of irradiation, it is sometimes referred to as 'early' apoptosis, to distinguish it from apoptosis resulting from misrepair which typically only occurs after one or more attempts by the cell to divide (Algan et al 1996, Endlich et al 2000).
These active cell death pathways can be a significant contribution to radiation sensitivity, acting in addition to death which results from misrepair (Algan et al 1996, Borgmann et al 2004). The interactions between unrepaired damage, senescence and apoptosis in determining cellular fate for a particular cell are very complex, depending on a range of genes in addition to TP53, and are beyond the scope of this review. However, quantitatively, experimental studies of the probability of different cell lines successfully evading apoptosis and passing through the G1 checkpoint following irradiation very closely follows an exponential dependence on dose (Di Leonardo et al 1994, Algan et al 1996, Chapman 2003). That is, the contribution of the effects of early active apoptosis and senescence can be modelled as a single exponential  .
.
It is important to note that the value of  is very strongly cell- and exposure condition-dependent, with both the absolute and relative contributions of apoptosis and senescence varying significantly. Cell death pathways are differentially regulated between cell types, giving rise to extremely rapid high levels of apoptosis in lymphoid and hemopoietic cells with comparatively low levels in fibroblast cells (Radford 1991), and intermediate levels in endothelial cells (Langley et al 1997). Furthermore, as noted above, genetic alterations can influence the activity of cell cycle checkpoints, DNA repair processes and the death pathways themselves, further modifying radiation sensitivity.
Unrepaired DNA damage can also have one final effect, in mitotic catastrophe (Vakifahmetoglu et al 2008). Mitotic catastrophe is a general term for cells that fail to successfully undergo mitosis, and can be caused by a range of factors, including asymmetric chromosome aberrations as noted above. Because DSBs split chromosomes in two, there is also a high chance that genetic material will be lost and division will fail if a cell enters mitosis with unresolved damage. This gives rise to an extreme sensitivity to ionising radiation for cells irradiated just before or during mitosis, as each break has a high probability of rendering the cell non-viable. Once again, experimental studies show an almost purely exponential radiation response in M phase with respect to dose (and in turn, DSB yield). Thus, the probability of evading mitotic catastrophe can be described as  , where
  is a term which depends on the amount of unrepaired damage which can reach the mitotic phase of the cell cycle and its likelihood of causing a failure of division (Biade et al 1997, Stobbe et al 2002, Heijink et al 2013).
While the G2/M checkpoint typically prevents mitosis until this damage is repaired, it has an activation threshold. Cells can fail to detect small amounts of damage, and thus progress to mitosis without delaying for repair (Deckbar et al 2011). Despite the relatively small level of damage needed to activate G2 arrest (10–20 DSBs), the extreme sensitivity of cells during mitosis means this can significantly reduce survival.
This effect can be seen to naturally parallel the low-dose hypersensitivity effect described above—at very low doses, cells escape G2 arrest and have an elevated risk of death, while at higher doses the arrest activates, giving the cell additional time to repair damage and potentially seeing an increase in survival. Indeed, this link has been explored and confirmed experimentally, with investigations showing that hypersensitivity is strongly associated with G2 cells, and in particular the activity of the G2 arrest checkpoint (Marples et al 2004). This represents one area where there is a clear breakdown in LQ responses and has led to the development of new models (such as the Induced Repair model (Joiner and Marples 1993)), although because of its cell-cycle specificity its impact is frequently small in many cell lines.
Considering all of these effects, we can see that while a number of different effects contribute to cell killing, for most cells they have broadly similar exponential dependencies on either dose or the square of dose. Thus, the final cellular survival probability is that it is not killed by any of these mechanisms, and can be expressed as

In this interpretation, we can see that the LQ model parameters may correspond mechanistically to summaries of cell death via different processes ( and
and  based on above notation, schematically illustrated in figure 6), capturing much of the overall trends in sensitivity with good accuracy (with perhaps the exception of G2 hypersensitivity). However, the mechanistic interpretability of these LQ parameters is somewhat limited, as they reflect the combined contributions of a range of different biological processes, which can depend on a range of intrinsic factors such as the genetic background and tissue of origin of the individual cells.
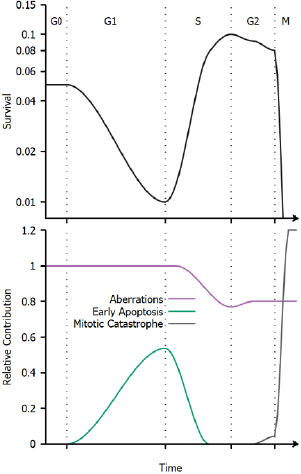
Figure 6. Schematic illustration of cell cycle variations in sensitivity. Top: Illustration of radiation sensitivity in a human cell line exposed to x-ray irradiation, following e.g. Sinclair et al (1968). Bottom: Illustration of relative contribution of different processes to cell death through the cell cycle. While the overall trends in cell cycle dependence are common to all cell lines, the relative contributions of these effects can change depending on the irradiation, environmental conditions, genetic background and tissue of origin of the cells being exposed.
Download figure:
Standard image High-resolution imageWhile the above discussion has focused on these intrinsic cell properties, extrinsic effects from a cell's microenvironment can also significantly modulate its response to ionising radiation. This can include factors such as the availability of oxygen or other nutrients and communication with nearby cells, as well as the type of incident radiation.
Radiation quality
Much of the key early research in radiation biology, including the majority work referenced above, was performed using x-rays. Due to their long ranges and sparse ionisation density, x-rays tend to cause DNA damage that is approximately randomly distributed throughout the cell nucleus. However, ionising radiation encompasses a wide range of different particle types—including not only massless photons but also electrons and heavier charged particles such as protons and carbon ions—which deliver dose with different distributions both on the macro- and nano-scales. On the macro-scale, this is reflected by a move from the approximately exponential dose fall-off seen in photon therapy, to the characteristic Bragg curve of heavy charged particles that show a roughly flat, low dose in an entrance 'plateau', before rising to a Bragg peak of dose deposition towards the end of the particle range. This offers significant dosimetric benefits in treatment planning, as by tuning the initial particle energy doses can be much more precisely confined to target volumes. These physical benefits underpin much of the clinical interest in charged particle radiotherapy (Loeffler and Durante 2013).
However, on the nanoscale heavy charged particles also deposit their energy much more densely than sparsely ionising radiation such as photons or electrons, particularly towards the end of their range. This is typically defined in terms of the linear energy transfer (LET) of the radiation—the amount of energy deposited per unit track length. This increases from approximately 0.2 keV µm−1 for photons or electrons, to values between 2 and 20 keV µm−1 for protons, and potentially 100 keV µm−1 or more for heavier charged particles. This increase in energy deposition leads to denser distributions of ionisations in DNA and thus greater levels of biological damage (Tommasino and Durante 2015). This increase in sensitivity is frequently attributed to two different processes—firstly, when energy is deposited more densely on the nano-scale, the complexity of individual sites of damage increases. Thus, instead of simple isolated DSBs, there is an increase in the number of DSBs with additional nearby strand or base damages, and there is a chance of simpler strand damages overlapping closely enough to form additional DSBs (Goodhead 1994). At slightly longer scales of a few hundred nm to a few microns, independent DSBs from the same charged particle are also spatially correlated along its 'track' (Nakajima et al 2013). This significantly reduces the average spatial separation between DSBs, which has been suggested to increase the risk of misrepair. The exact contributions of these two processes remains an outstanding question.
However, despite uncertainty about the underlying mechanism, there is broad agreement about the overall trend of radiosensitivity with LET, as illustrated in figure 7 (Chaudhary et al 2014). This shows increasing sensitivity to protons with increasing LET at different positions in a Spread-Out Bragg peak. These differences are typically described in terms of relative biological effectiveness (RBE), defined as the ratio between the dose of a reference radiation and test radiation which give the same biological effect. Thus, the RBE of protons relative to photons at 10% survival is given as:

where  and
and  are the photon and proton doses which give 10% survival, respectively.
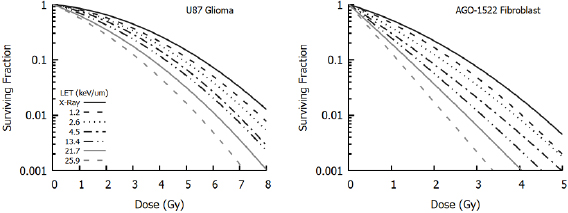
Figure 7. Variation of sensitivity with proton LET at different positions within a Spread Out Bragg Peak. When compared to x-rays, protons cause greater levels of cell killing for a given dose. The size of this effect depends on the LET of the incident radiation, with cells becoming more sensitive (through an increased  component) at higher LETs. This also depends on cell line, with different responses seen in low
  glioma cells (left) compared to high
  normal fibroblasts (right). Illustration derived from Chaudhary et al (2014).
Download figure:
Standard image High-resolution imageFrom a consideration of figure 7 and other data it can be seen that not only are cells more sensitive to high LET radiation, but the shape of the dose response curve also changes, becoming more linear at high LET (Paganetti 2014). This can be understood from the LQ perspective as an increasing importance of single-hit death, as each high LET particle deposits more energy per cell traversal with a correspondingly higher chance of causing lethal damage. Numerous empirical LQ-based models have been developed to describe these effects through alteration of the α and β parameters to reflect the contribution of LET (Carabe-Fernandez et al 2007, Wedenberg et al 2013, McNamara et al 2015), recently reviewed in Rørvik et al (2018). These models typically reflect the increasing single-hit effects through an LET dependent modification to α of the form:
where  and
and  correspond to the proton and photon α parameters, and
  and
and  are empirical fitting terms. The presence of the inverse dependence on the photon
  indicates that these effects are more significant in cells with low
  ratios. Similar functions are also sometimes applied to changes in
  with LET, although there greater disagreement on both the magnitude of this effect and its dependence on factors such as the
  ratio.
However, despite the existence of these models demonstrating a departure from standard LQ behaviours, proton therapy is still typically planned with a constant RBE of 1.1 and the assumption tissues otherwise respond as they do to photons. This is in part due to the relatively large uncertainties in experimental studies of RBE (Paganetti 2014). However, heavier charged particles such as carbon have significantly greater RBEs, necessitating the use of more detailed models. Two—the local effect model (LEM) and the microdosimetric Kinetic model (MKM)—are currently used for planning in Europe and Japan (Krämer and Scholz 2000, Inaniwa et al 2010). These approaches move away from a purely LQ formalism to incorporate detail on the nanoscale deposition of energy and its impact on radiation sensitivity. This integration of mechanistic models to predict how cellular sensitivity changes under different scenarios indicates a potential future direction for research in this area.
Microenvironmental factors
Oxygen availability was one of the first radiation modifiers to be identified, when early investigators noted that exposures when blood vessels were constricted were less effective than those where blood could flow freely (Hahn 1904). Crabtree and Cramer observed significantly higher cell viability in ex vivo tissue cultures irradiated in anaerobic conditions, demonstrating experimentally that oxygen was a key driver of this effect (Crabtree and Cramer 1933).
This effect is now typically quantified as the ratio of doses which are needed to give the same biological effect in hypoxic and oxic conditions, known as the oxygen enhancement ratio (OER), which is observed to be approximately three for most cell types (Hill et al 2015). Cells are most resistant in the complete absence of oxygen, but see a rapid increase in sensitivity as the oxygen partial pressure increases from approximately 0.5 mbar to 25 mbar (0.5 mmHg to 20 mmHg), with a sigmoidal trend (Wouters and Brown 1997). Resistance under hypoxia has classically been associated with the 'oxygen fixation hypothesis'. This posits that indirect radiation damage is a two-step process, where first a radiation-induced free radical interacts with DNA to form a transient DNA radical. In the absence of oxygen, this DNA radical has a high probability of being chemically reduced and restored to its original configuration without the need for biological repair. However if oxygen is present, it can bind with the DNA radical to form a DNA peroxide which cannot be easily reduced, 'fixing' the damage in place. However, in recent years there has being growing interest in the fact that hypoxia also drives a number of epigenetic and molecular changes within the cell, modifying its response to stress signals and potentially ionising radiation sensitivity (Höckel and Vaupel 2001, Bertout et al 2008).
Hypoxia is important in radiotherapy as it is a common feature of many tumours, due to their growth outstripping the available local vasculature. This gives rise to radiation-resistant hypoxic sub-regions, which are associated with poor prognosis (Horsman and Overgaard 2016). This heterogeneous distribution of sensitivity has been suggested to give rise to deviations from LQ responses in hypoxic tumours, but to date there is limited evidence of significant differences in clinical settings. This may be due to oxygen levels within the tumour being highly dynamic with varying regions of transient and chronic hypoxia obscuring this effect (Bayer et al 2011), or reoxygenation (one of the five 'R's of radiotherapy) occurring throughout the treatment course (Kallman and Dorie 1986).
In addition to the impact of oxygen, neighbouring cell populations can also impact on radiation responses. While direct radiation interaction with cellular DNA is the key driver of radiation sensitivity, there is growing evidence that intercellular communication can also cause cell death. In vitro, this can occur due to direct communication between cells via a process known as the 'radiation-induced bystander effect' (Prise and O'Sullivan 2009).
In this effect, cells exposed to ionising radiation signal neighbouring cells (either through gap junctions or the secretion of signals within exosomes), inducing stress responses which can include elevated oxidative stress. This can lead to long-term genomic instability and reduced viability (Little 2003). While these effects were first observed in cells exposed to very low or zero dose (Mothersill and Seymour 1997, Nagasawa and Little 1999), more recent studies have shown significant alterations in out-of-field survival for cell populations exposed to modulated fields similar to those used in radiotherapy (Mackonis et al 2007, Butterworth et al 2012). Mathematical modelling of these effects suggest that signalling may play a greater role than previously anticipated, and could become more significant as radiotherapy delivery becomes more precise (Ebert et al 2010, McMahon et al 2013a, 2013b). However, although signalling-driven carcinogenesis have been demonstrated in radiation-sensitive mice (Mancuso et al 2008), there is still a lack of definitive clinical evidence of these effects.
In vivo, the immune system can also potentially play a role (Demaria and Formenti 2012, Hanna et al 2015). It has long been known that in some systems a functional immune system impacts on the likelihood of formation of cancer and the radiation dose needed to control it (Stone et al 1979). However, most cancers have developed the capacity to evade the immune system, mitigating this effect. Recent evidence suggests that radiation exposure can promote immune responses against tumours, particularly when combined with novel immunotherapy techniques, potentially causing significant shifts in overall sensitivity (Dewan et al 2009, Reynders et al 2015, Weichselbaum et al 2017).
Challenges in applying the LQ model
Heterogeneous populations
It is quite common to refer to a given cell line as having, for example, a 'high  ratio'. However, care must be taken to ensure statements like this are placed in an appropriate context. Cells with active apoptosis pathways, for example, often show much greater resistance in late S and G2, accompanied by a much lower
  ratio (Sinclair 1968, Chapman 2003). This is particularly important when cells are irradiated as a heterogeneous population in different cell cycle phases. As seen in figure 8, the response of a heterogeneous cell population is actually the combination of a range of sensitivities, despite often being plotted as a single curve. Indeed, the aggregate radiation response curve may not particularly resemble any of the individual radiation response curves, and may obscure key components of the radiation response in individual phases. In this example, the aggregate population appears to be a relatively resistant, high
  cell line (>20 Gy). This is despite individual cells having a significant range of sensitivities, and all showing significantly lower
  ratios. In extreme cases (e.g. extrapolating to very high doses or when genetic defects impart particularly sensitivity in some phases (Denekamp et al 1989)) this can even lead to departures from LQ responses with, for example, reducing slope at high doses, despite each individual cell following an LQ behaviour.
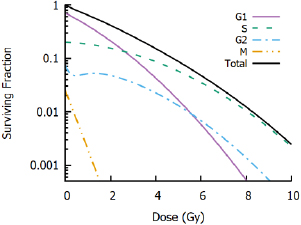
Figure 8. Impact of cell cycle heterogeneity. Illustrative radiation response curves are shown for G1, S, G2 and M populations, in proportions typical for heterogeneous in vitro cultures. G1 cells show higher radiosensitivity than S and G2 cells, while G2 cells show some evidence of low dose hyper-sensitivity and M cells show acute radiosensitivity. However, experiments will typically measure only the whole-population response (black line). While this population may still be well described by an LQ model, these parameters may not accurately reflect the response of any individual cells.
Download figure:
Standard image High-resolution imageAs a result, although survival curves obtained from an asynchronous cell population are frequently useful, it is important to bear in mind the conditions in which a particular radiation response curve was obtained. Shifts in cell cycle distribution or irradiation condition may be all that is required to change a cell line from 'high  ' to 'low
  ' responses, or cause apparent breakdowns in the applicability of the LQ model, despite its underlying accuracy for well-defined populations.
Hypofractionation
Much early radiotherapy research focused on hyperfractionation—the delivery of a larger number of smaller fractions—to further improve the separation between tumours and late-responding normal tissues (Thames et al 1983). However, this has not seen widespread clinical uptake, and with the introduction of more precise delivery techniques, hypofractionation has become an increasingly significant part of the radiotherapy landscape, and seen good results in a number of sites (Nahum 2015). Because of the apparent contrast with the traditional LQ interpretation, this has led some investigators to question the validity of the LQ model, and in particular if it is accurate at high doses or if the response curve straightens at high doses necessitating new models (Kirkpatrick et al 2009).
Linearization of biological effects at higher doses is suggested by a number of mechanistic models, particularly those which consider the interaction of lesions (whether DSBs or otherwise). This can be understood by noting that moving from 2 to 4 DSBs effectively doubles the number of potential misrepair partners, while moving from 200 to 202 DSBs would have a relatively minor effect. Similar trends have been experimentally observed in pulsed field gel electrophoresis studies of DSB repair, which show that an initially linear increase in the rate of misrepair slows at higher doses, with non-linearities becoming apparent at doses above 20 Gy (Löbrich et al 2000, Rydberg et al 2005).
Such a trend would be expected to translate into reductions in aberrations and cell death compared to a purely LQ model. However, it is difficult to robustly quantify many endpoints, including survival, at very high doses. Because of the high level of cell killing, such experiments require the irradiation of very large numbers of cells to yield even small numbers of survivors. This introduces a number of very sensitive sources of error, as even small experimental errors or heterogeneities in the irradiated population can significantly influence measured responses. Further uncertainty is introduced by the protracted times needed to deliver high doses in some scenarios, as this opens the potential for sub-lethal damage repair to reduce cell killing at high doses (Dasu and Toma-Dasu 2015).
Alternative response models
These challenges mean there remains significant disagreement about the validity and applicable range of the LQ model in vitro, with some authors suggesting significant discrepancies at doses of 5 Gy or above, while others report good agreement up to tens of Gy. As a result, there is considerable interest in the development of alternative models to describe in vitro radiation response. These include simple modifications of the original LQ with a third parameter proportional to the cube of dose to give a 'linear-quadratic-cubic' model, or modifying the LQ such that it has a maximum slope and linear response at high doses, giving rise to a linear-quadratic-linear model (Astrahan 2008). Alternative approaches have attempted to introduce more mechanistic rationale for alteration of the LQ parameters, such as by moving smoothly between linear-quadratic and multi-target models (Park et al 2008) or incorporating corrections for dose protraction and lesion interaction (Guerrero and Li 2004, Wang et al 2010).
However, in many cases these models introduce new parameters that are difficult to interpret biologically. As an alternative, there is also interest in developing further mechanistic interpretations. These include revisiting approaches such as the LPL and RMR to place modified LQ curves on a stronger theoretical footing (Carlson et al 2008, Guerrero and Carlone 2009); the development of updated target-theory approaches (Zhao et al 2015); or the development of mechanistic models characterising particular aspects of the DNA repair process, such as the involvement of ATM (Bodgi and Foray 2016).
Both empirical and mechanistic models face a significant challenge, however—by necessity, they involve the inclusion of additional parameters, requiring additional data to be robustly fit. Coupled with the generally good performance of the LQ model in the majority of preclinical in vitro datasets, there has been comparatively little uptake of these more sophisticated models in preclinical radiobiology. Instead, the standard LQ remains the dominant tool in preclinical radiobiological modelling.
But despite the LQ's successes in preclinical models, its ability to translate this success into the clinic, and its validity for predictions of tissue-level responses, also remains the subject of some debate.
Clinical use of the LQ model
Historical development
The clinical uptake of radiation was if anything more rapid than in the laboratory. Within a few years of Roentgen's discovery of the x-ray, several groups reported the use of x-rays in the treatment of cancer (Thames 1992), with the first clearly documented cures of skin cancer reported in Sweden by Stenbeck at the turn of the century (Stenbeck 1900). A burgeoning community began to investigate how best to treat cancers with ionising radiation. Initial treatments were typically protracted over multiple days or weeks, limited by the activity and stability of the early x-ray sources. However, as source quality improved, a move to deliver single- or few-fraction treatments led to unexpectedly severe toxicity.
Early developments in fractionation were largely empirical, beginning from demonstrations that rapidly-dividing organs show greater radiosensitivity if treatments are fractionated. Perhaps the best-known early demonstration of this was the use of x-rays in the sterilisation of rams, where it was shown that fractionation could achieve this effect with minimal other toxicity, whereas doses large enough to sterilize the animals in a single fraction lead to unacceptable side-effects (Regaud and Ferroux 1927). Fractionation schedules were developed locally in numerous centres over the next several decades, with many groups quickly settling on daily fractions of approximately 2 Gy, delivered over a period of several weeks with total doses on the order of 45–70 Gy, typically based on clinical experience rather than biological rationale (Fletcher 1988).
There was significant interest in more precisely quantifying this relationship between dose, fractionation and treatment time in different tissues to better optimise therapy. Early work by Strandqvist on skin cancers suggested a relationship between the dose needed for a particular biological endpoint and the total treatment time, of:

where  is the isoeffect dose,
  is the dose needed in a single treatment to deliver the same effect, and
  is the total treatment time in days.
  was found to be a function of the biological endpoint, but the exponent on
  was suggested to be a constant (Strandqvist 1944). However, the treatments modelled in this study involved multiple fractions per day, making the number of fractions proportional to the treatment time. Research quickly showed that changing the number and size of fractions had a significant effect, even when the total treatment time was held constant.
Ellis sought to address this by introducing the concept of nominal standard dose (NSD), which incorporated both number of fractions and total treatment time:

where  is the number of fractions,
  is the endpoint-specific single dose needed to yield the effect, and the exponents are taken to be independent of endpoint (Ellis 1969). While this model embodies a number of factors which are known to be important for radiotherapy, it was almost immediately the subject of considerable debate, with many authors arguing both against specific coefficient values and its underlying assumptions (Liversage 1971). This left significant space for the development of new approaches to understand clinical response.
As in vitro survival data became more readily available in the 1960s and 70s, there was growing interest in linking models in these two areas. Fowler initially used a multi-target model to evaluate a 'target cell' description of clinical response, where in vivo responses were predicted to be proportional to cell survival. These initial analyses performed poorly, with poor quality fits for some schedules, and unreasonable multi-target model parameters (Fowler et al 1963)—suggesting that this was not an ideal model for clinical fractionation. However, in later years Douglas and Fowler revisited this approach using an LQ model of cell survival, and showed excellent agreement with models of skin reactions in mice, superior to those of either the multi-target survival model or the NSD approach. Significantly, the resulting  and
and  LQ parameters were also reasonable based on preclinical measurements in in vitro and in vivo conditions (Douglas and Fowler 1976).
Similar results were obtained by other authors for a number of different measures of normal tissue and tumour responses, giving credence to the LQ as an effective tool to describe clinical responses for a range of doses, fractionation schedules and endpoints (Barendsen 1982, Thames et al 1982). Together with its relative simplicity, its applicability to preclinical data, and the more natural explanation of differential responses in different tissues, LQ-based approaches rapidly supplanted the NSD as the primary model by which clinical plans were evaluated.
Clinical application of the LQ
The LQ model is by far the dominant radiobiological tool used in clinical situations. This can be understood as a combination of both its simplicity and the intuitive way in which it enables discussions around fractionation, scheduling and tissue sensitivity, based on a 'cell survival' model of radiation response.
Early studies of tissue responses to radiation showed that organs containing rapidly proliferating cells—such as skin, oral mucosa and bone marrow—typically exhibited little sensitivity to fraction size and presented symptoms during or shortly after the completion of radiotherapy. These early responding tissues are now known to have high  ratios, on the order of 7–10 Gy. By contrast organs with slower cellular turnover—such as heart, lung or kidney—respond over a much longer timescale of months to years, and show much greater sensitivity to fraction size. Late responding tissues are typically found to have
  ratios of 3–5 Gy (Fowler 1989).
Much of the early clinical development of radiotherapy focused on the observation that, since cancer is a disease characterised by the uncontrolled proliferation of cells, it should be expected to have a high  ratio. Historically this has been assumed to be on the order of 10 Gy, similar to early-responding tissues (Williams et al 1985). As a result, fractionation preferentially spares the slowly dividing normal tissues that are often the dose-limiting factors in radiation treatments, allowing an escalation of tumour dose without causing unacceptable normal tissue toxicity, as illustrated in figure 2. Thus, the LQ provides a simple way to explain both the impact of fractionation, and the specific differences in response between different tissues.
This description assumes that clinical endpoints (whether tumour control or normal tissue response) are driven by the death of some cell population, and the magnitude of effect is directly related to the fraction of surviving target cells. The nature of target cells is deliberately left vague in many of these models, and may represent all cells in a population (such as in tumours) or 'critical' sub-populations (e.g. stem cells) without significantly affecting the following analysis (Douglas and Fowler 1976).
In this approach, the level of clinical effect is assumed to depend only on the number of surviving cells. For simplicity, a given level of effect  is often related to the log of the survival probability. Thus, assuming an LQ response to
  fractions of dose
  gives
gives

where  is again the total dose delivered. Once again, this relationship highlights the sparing effects of fractionation—if the same dose D is delivered in a larger number of fractions (reducing
  ), the clinical effect
  is also reduced. And while fractionation spares all tissues, the degree of sparing can be seen to depend on the
  ratio of the target population. In particular,
  is frequently expressed as:
Thus the magnitude of effect can be expressed as the product of a fraction-size independent term related to the total dose ( ) and a fraction-size dependent term which scales inversely with the
  ratio.
As proposed by Withers et al (1983), this expression provides a simple method for calculating iso-effective doses between different fractionation regimes—if two regimes give the same effect level E, they should be equally clinically effective, as illustrated in figure 9. Because of the prominence of 2 Gy fractionation schedules, treatments are frequently compared on the basis of equivalent dose in 2 Gy Fractions,  . To obtain the
  for an arbitrary schedule of
  fractions of dose
  , we find the dose which yields an equal effect level:
which can be rearranged to give:
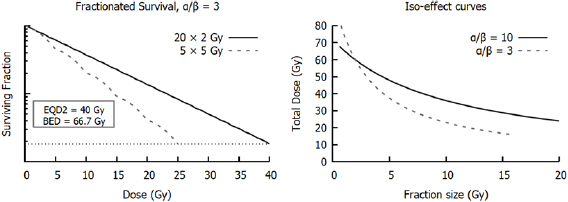
Figure 9. Left: Illustration of iso-effective LQ schedules for a tissue with  . A treatment of 20 × 2 Gy fractions leads to the same level of cell killing (and thus clinical effect) as treatment with 5 × 5 Gy fractions. Because these two curves are iso-effective, they have the same equivalent dose in 2 Gy fractions (EQD2) and biologically effective dose (BED) (inset). Right: Iso-effect curves for low and high α/β cells. For each fraction size, the total dose needed to deliver an EQD2 of 60 Gy was calculated, highlighting the greater fraction size sensitivity of low
  cells.
Download figure:
Standard image High-resolution imageA closely related concept is that of BED, which seeks to compare treatments without reference to a specific fractionation schedule. As defined by Fowler (Barendsen 1982, Fowler 1989), this represents the dose needed to deliver a level of effect as the fraction size goes to zero. In this limit, the contribution from multi-hit events goes to zero, and the BED is obtained by dividing the effect level  by the α term:
Similar approaches were also proposed by other authors (Barendsen 1982, Thames and Hendry 1987), under different names. In general, all LQ-based iso-effect models agree on the equivalence of different schedules, typically differing from one another only by a constant factor based on the reference fraction size.
A note about nomenclature is important here—'Equivalent' and 'Effective' are words that have multiple meanings in radiation biology. In addition to here in metrics of fractionation, they appear in the SI definition of the Sievert, referring to radiation-quality weighted and target-tissue weighted doses respectively. In addition, BED is sometimes referred to as an 'Equivalent' doses rather than 'Effective' dose, which can potentially lead to further confusion. As a result, care must be taken when comparing quoted 'Effective' dose values, to ensure they are calculated against the same reference standard (Fowler and Dale 2010).
These model predictions can also be corrected for temporal effects, which can span short and long timescales. Over short timescales, incomplete sub-lethal damage repair can be significant. In the above analysis, it is assumed that fractions are delivered instantaneously, and are sufficiently well separated that damage is fully repaired between exposures. However, for low dose-rate exposures or closely-spaced fractions, this may not be the case.
This can be incorporated through the use of a dose protraction factor (Lea and Catcheside 1942). This approach builds on the assumption that  represents the interaction of sub-lethal damages, which are repaired with first-order kinetics with characteristic rate
  . Thus a maximum effect is seen for instantaneous dose delivery, but when exposure is protracted survival becomes

where  is the dose-protraction factor. For an exposure to a varying dose rate
  , this is given by:
This expression indicates that the 'multiple-hit' damage done by a dose  is proportional to the total amount of remaining unrepaired sub-lethal damage from all exposures up to time
  . This has the effect of reducing the value of the
  component, and can provide correction factors for protracted exposures to arbitrary dose rates (Brenner 2008). For a series of acute well-separated fractions, this also returns the simple fractionated model presented above, which will be used in the remainder of this text for simplicity.
On longer timescales, clinical outcomes can also be affected by the repopulation of the target cells (Travis and Tucker 1987, Peters et al 1988). If a cell population is growing exponentially with rate  during radiotherapy, the effective surviving fraction will be:
where  is the total treatment time. While exponential growth is a suitable model for proliferation in tumours, it has been observed that there is little evidence for repopulation during short treatments. This led to models incorporating a 'kick-off' time,
  , before repopulation begins (Fowler 1989). This gives a survival model of:
where the growth term is taken to be 1 if  . This can be converted into a BED as above to give:
This suggests that extending the treatment past  reduces the BED, by an amount which depends on the relationship between the growth rate (equal to
  , where
  is the tumour doubling time) and the
  component of radiosensitivity. This
  value depends on the tumour type, with estimates of the dose 'lost' to tumour proliferation ranging from 0.3 to 2.0 Gy d−1, potentially offsetting much of the benefit of delivering additional fractions (Denekamp and Thomlinson 1971, Thames et al 1990, Dale et al 2002, Vogelius and Bentzen 2013). For slowly proliferating late-responding normal tissues,
  is often taken to be sufficiently close to 0 that it can be neglected. Much like the LQ survival model, this is necessarily a simplified model of repopulation, and there is significant interest in the development of more realistic models of tumour and normal tissue recovery, although these are outside the scope of this review (O'Rourke et al 2009, Leder et al 2014).
Tissue type and  ratio
ratio

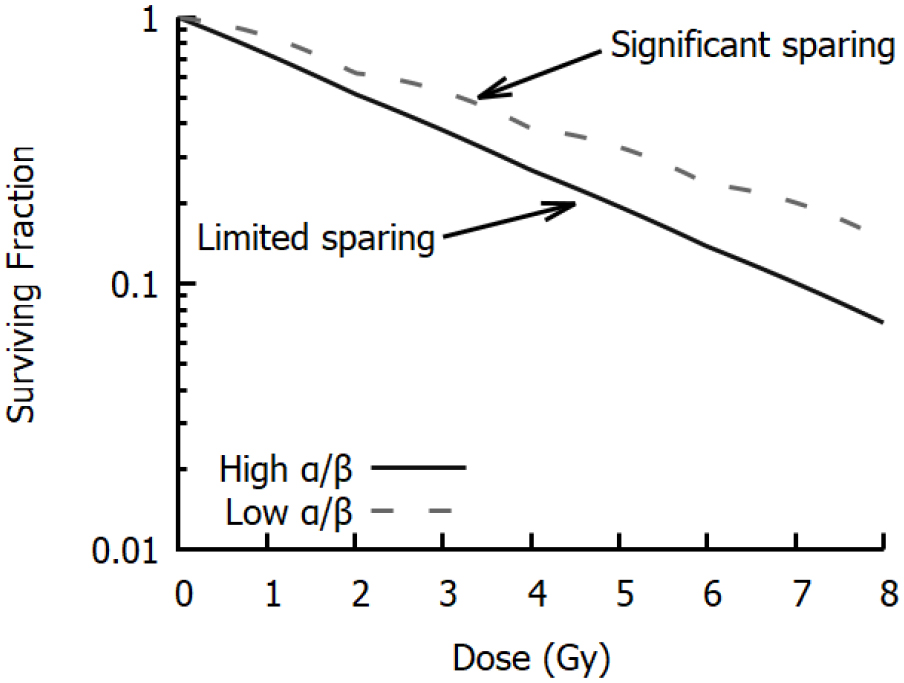
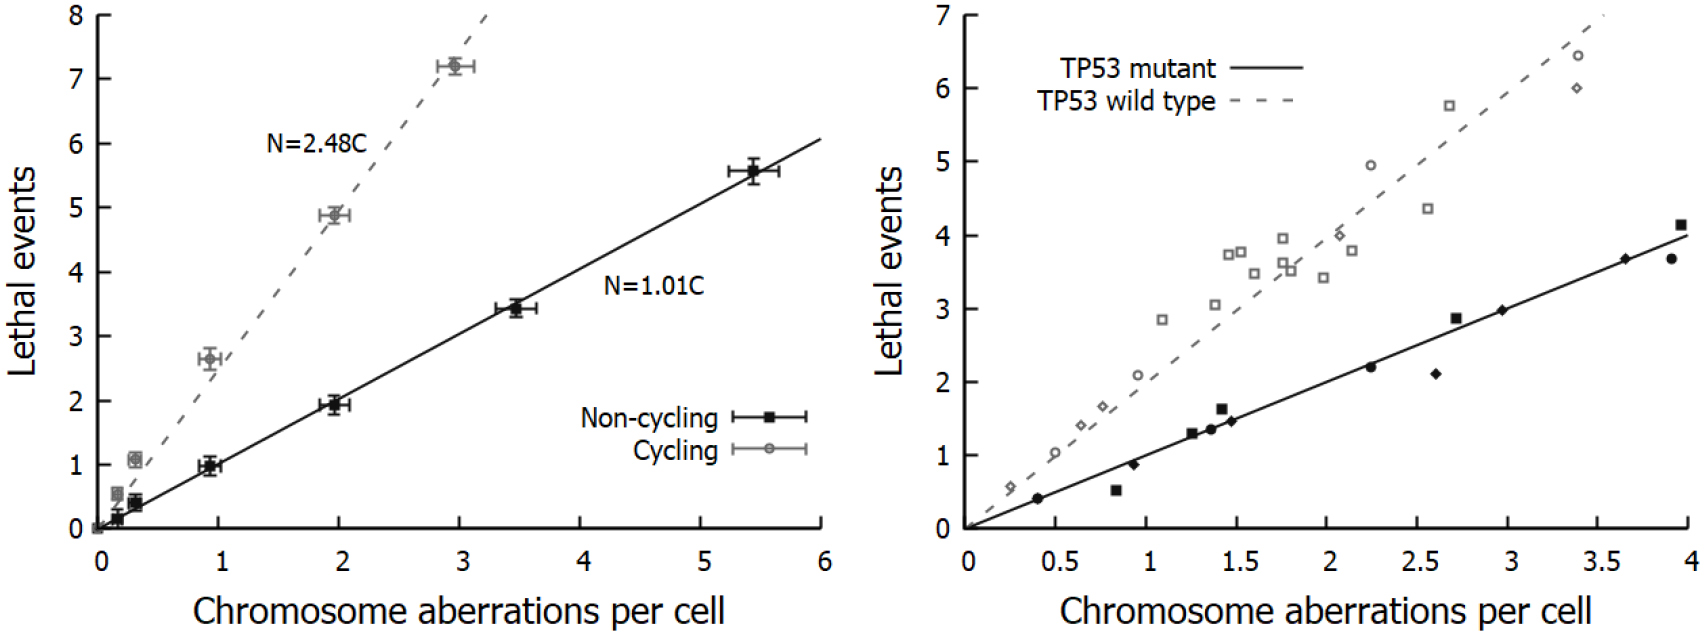
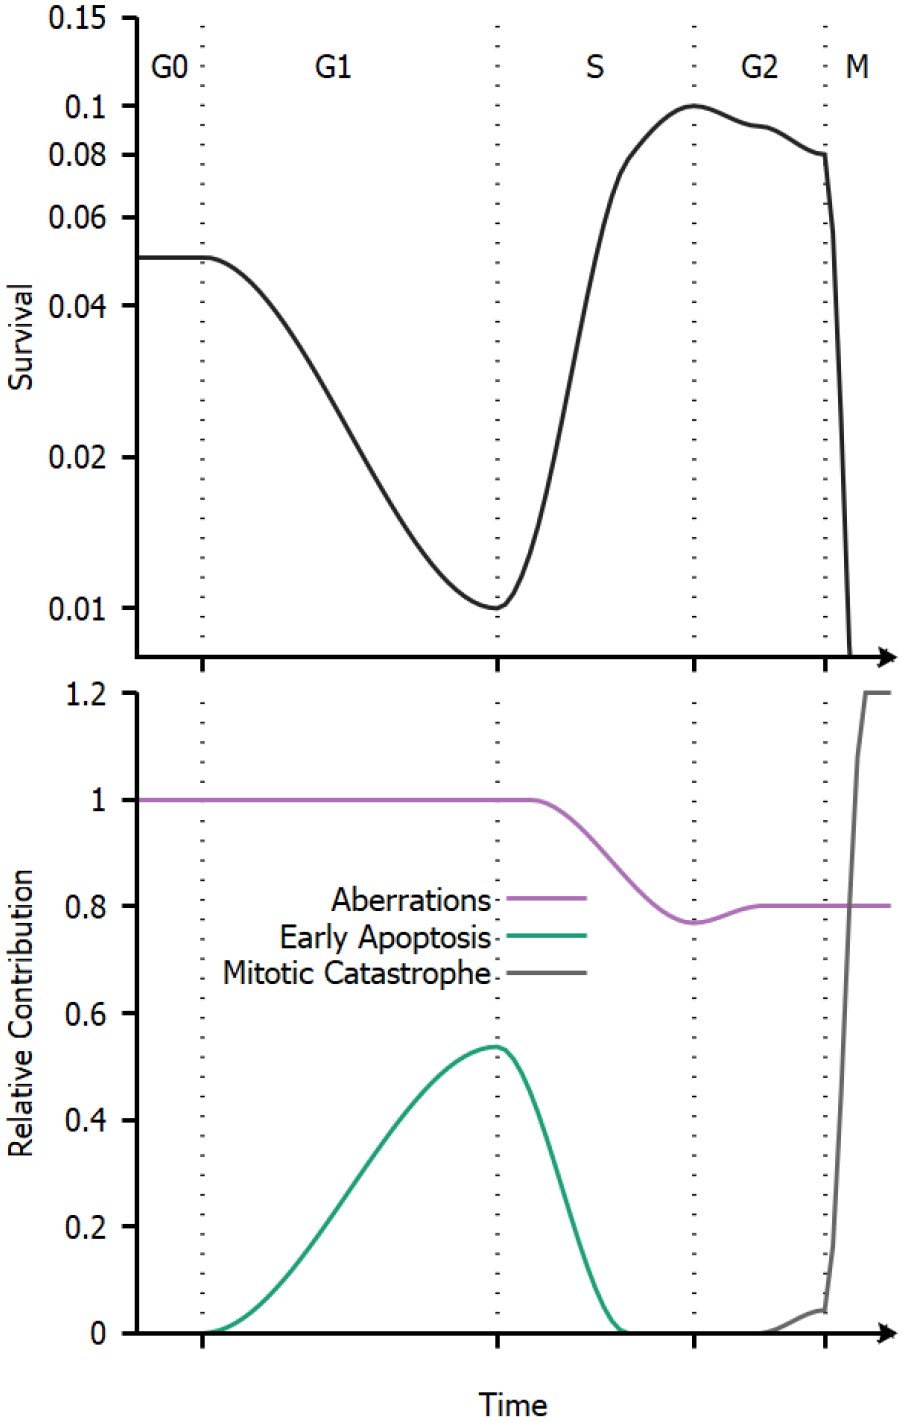
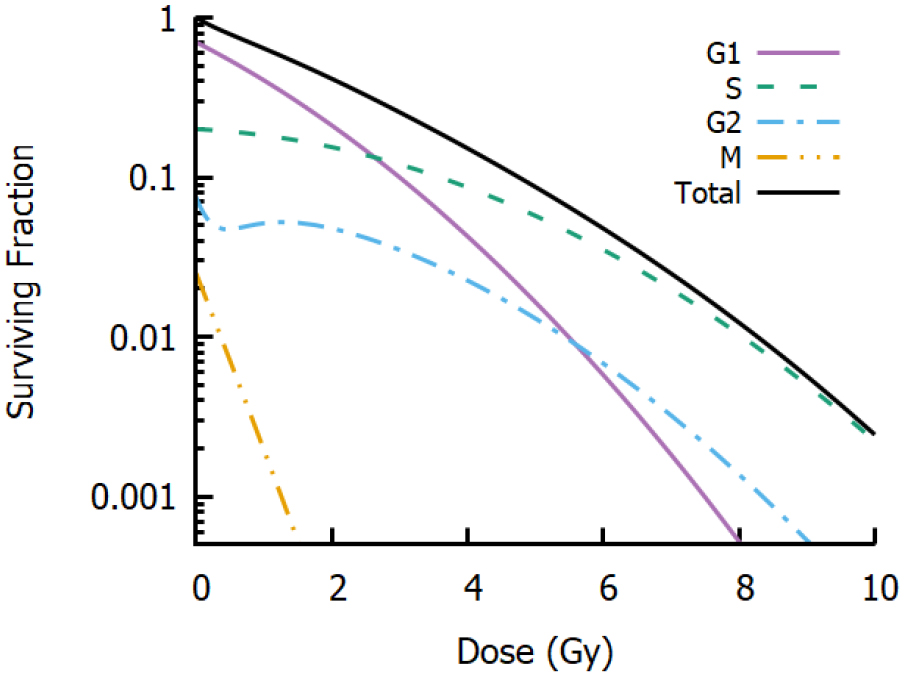
As noted above, in discussions of the LQ model tissues are typically separated into two broad groups. Early responding tissues (e.g. skin, hair, mucosa, bone marrow, and also tumours) were believed to have a high  ratio, reflecting relative insensitivity to fraction size. By contrast, late responding tissues (e.g. heart, lung, breast) were believed to be sensitive to fraction size, represented as a low
  ratio (Thames et al 1983).
This can be interpreted as reflecting the link between proliferation status and radiation sensitivity in cells. Late-responding tissues have low turnover and many non-cycling cells, which gives a reduced radiation sensitivity as cells can remain functional if not stimulated to divide (quiescent cells in vitro have been shown to be able to complete repair and remain metabolically active after exposure to 80 Gy (Kühne et al 2004)). By contrast, early responding cells have a high turnover, which leads to both increased radiosensitivity and a more rapid appearance of the consequences of radiation.
For normal tissues, these observations have generally held true. Reviews of clinical studies of normal tissue responses have broadly stratified tissues into two categories, with late-responding tissues having  values in the range from 1 to 4 Gy, while early-responding tissues have
  ratios in the range of 8–15 Gy (Joiner and van der Kogel 2016). However, it is important to note that in addition to fraction size sensitivity, organs also have different absolute sensitivities to radiation, and different sensitivity to dose distributions. In many cases, this reflects the structure of the organ—'parallel' organs such as the lung are tolerant to high dose exposures in small regions, while more 'serial' organs such as the spinal cord see significant toxicity after focused exposures. Numerous retrospective studies have been carried out to characterise these behaviours for different organs, and are summarised elsewhere (Bentzen et al 2010).
For tumours, however, a more complex picture has emerged. Despite much of the development of fractionation being based on the assumption that tumours had a high  ratio, in a recent meta-analysis van Leeuwen et al identified considerable heterogeneity across many sites (van Leeuwen et al 2018). While some tumours (head & neck, cervix, bladder and liver) consistently showed
  in line with previous assumptions, others showed much lower values. Breast, prostate and some sarcomas showed
  values less than 4 Gy, suggesting they had a similar sensitivity to nearby late-responding normal tissue. Indeed, there is evidence that prostate cancer may have an
  of approximately 1, lower than almost all normal tissue (Wang 2003). For a number of other tissue types (including rectum, nervous system, skin and lung) mixed results were seen, with a wide range of values reported. Some of this heterogeneity may be the result of underlying tissue histology, with adenocarcinomas tending to show greater fraction size sensitivity than tumours with epithelial origins.
Van Leeuwen also identified considerable variation in reported estimates for  in most cancers, with evidence that 75% of the variation between studies was due to inter-study heterogeneity, rather than expected statistical uncertainty. This increases to over 90% when considering studies which directly estimated the
  and
and  sensitivity parameters, highlighting the high degree of uncertainty in these factors. These discrepancies were attributed to both technical differences—in patient populations and radiotherapy techniques—as well as the models used to predict tumour response and determine the
  ratio. This highlights the importance of carefully considering underlying assumptions when attempting to apply radiobiological models in clinical settings, and the ongoing challenge in robustly quantifying radiation response.
Hypofractionation in the clinic
This continuing uncertainty in tissue and tumour  ratios is of particular interest due to the growing usage of hypofractionation. Many centres are now moving away from 2 Gy fractions, and instead using fewer, larger fractions. Large-scale UK trials in prostate (CHHiP, (Dearnaley et al 2016)) and breast (START, (Haviland et al 2013)) have supported moderate hypofractionation, moving to doses closer to 3 Gy per fraction, with ongoing trials exploring even larger doses. However other approaches have made much more dramatic increases in fraction size.
Stereotactic radiotherapy—sometimes referred to as 'stereotactic ablative radiotherapy' (SABR) or 'stereotactic body radiotherapy' (SBRT)—aims to use high-precision delivery techniques to complete radiotherapy treatments in one or a few fractions. Early experience in brain metastases (Lippitz et al 2014) and lung (Murray et al 2017) has shown good outcomes for treatments with 1–3 fractions of 15–20 Gy, making use of advanced delivery techniques such as volumetric modulated arc therapy (VMAT), Tomotherapy or Gammaknife to precisely target dose delivery to tumour volumes.
These positive outcomes seem to stand in contrast to the traditional LQ interpretation of clinical radiotherapy, and raise the question of other biological processes playing a role in modulating clinical responses. Notably, normal tissue and tumours are not simple agglomerations of cells, but instead are embedded within a network of stroma and vascular cells, which have their own radiation sensitivity and biological responses which may contribute to tumour response (Park et al 2012). In addition, there is the potential for involvement of the immune system, which can act in combination with radiation to enhance cell killing and tumour control. This can be seen both in the primary target (Stone and Milas 1978, Dewan et al 2009, Hanna et al 2015, Pilones et al 2015), as well as untargeted sub-volumes, in a phenomenon known as the abscopal effect (Reynders et al 2015, Siva et al 2015, Poleszczuk et al 2016).
However, despite these mechanistic arguments and the initial apparent disagreement between the outcomes of these extremely hypofractionated treatments and typical expectations, there is limited quantitative evidence for a divergence from the LQ at any dose level. In retrospective studies and meta-analyses of responses in lung and prostate tumours, brain metastases, and lung normal tissue, the LQ model was found to adequately describe clinical results, and alternative models such as the LQ-L and USC were found to not add significant predictive power (Borst et al 2010, Guckenberger et al 2013, Tree et al 2014, Shuryak et al 2015).
There are several factors which may contribute to this seemingly surprising result. Firstly, as discussed above, there is now growing evidence that many tumours respond more similarly to late-responding normal tissues. Secondly, the high precision delivery techniques used in hypofractionated radiotherapy enables significant reductions in irradiated volumes, and relative doses between normal tissue and tumour. This reduction in normal tissue dose can offset fraction-size related effects, potentially enabling an increase in tumour control without additional toxicity (Bentzen 2004, Nahum 2015).
Taken together, these results suggest that even bearing in mind its mechanistic shortcomings, there is limited clinical evidence to justify moving away from the LQ formalism for describing clinical responses. Rather, it is important to holistically compare different treatments, incorporating not only LQ predictions but other factors such as dose-volume and scheduling effects together with uncertainties in clinical parameters in an integrated radiobiological understanding of these effects (Brown et al 2014).
Beyond the LQ?
It is clear that a linear quadratic dose response curve and its  and
and  parameters describe—at best—a given cell's radiation response for one very specific condition. Fully characterising the cell's radiobiological response would require quantifying how these parameters depend not only on the cell's underlying phenotype, but also its cell cycle, its micro-environment, the type of radiation to which it is exposed and the way in which this radiation is delivered.
Unfortunately, while the impact of some factors such as oxygen availability are well characterised, others, such as LET, have proven much less tractable and remain the subject of considerable uncertainty (Paganetti 2014). In an empirical approach, comprehensively characterising even a single cell line for all possible conditions is not feasible. As a result, there is interest in the development of new more mechanistically-informed models to more systematically understand the underlying biology.
Some of the empirical models mentioned above provided a first step towards this goal, moving away from the LQ's sensitivity parameters towards mechanistic quantities such as yields of initial damage and rates of repair. Advances in biological assays and computing power has led to a dramatic expansion of research in this area in recent years, as investigators seek to develop models that more fully describe the mechanisms of radiation response. As the processes involved in cell death are very complex and span a range of scales from nanoscale interactions of primary radiation to biological processes taking place over hours and days, most current models focus on one stage of this response.
In the physical domain, much work has focused on the development of nanodosimetric Monte Carlo codes, which enable the calculation of how energy is deposited in and around DNA, and the resulting DNA damage distributions. These include KURBUC (Nikjoo et al 2006), the Monte Carlo Damage Simulation (Semenenko and Stewart 2004), PARTRAC (Friedland et al 2011), Geant4-DNA (Meylan et al 2017) and TOPAS-nBio (McNamara et al 2017). By simulating the initial physical (and in some cases chemical) interactions of radiation with DNA, these codes generate predictions of the number, type, and distribution of DNA damage, typically with a focus on understanding variations in RBE and OER.
This initial DNA damage must then be translated into biological effects. Some DNA damage codes (e.g. PARTRAC) incorporate some explicit modelling of repair, while there are a number of other independent models which begin from distributions of DSBs and simulate the processes of DNA repair and misrepair (Ballarini and Ottolenghi 2004, Frese et al 2011, McMahon et al 2017, Henthorn et al 2018). Some other models take an intermediate approach, and link from distributions of energy to biological effect, without explicitly simulating initial damage. Of particular note among such models are the two—the LEM, and the MKM which are currently in use in clinical practice for the prediction of carbon ion RBE (Krämer and Scholz 2000, Inaniwa et al 2010).
However, physical interactions are only one aspect of radiation response, and there is also significant research into better understanding the underlying biology, and how responses are affected by the cell's particular phenotype and genetic background. There are a range of models of different aspects of radiation response, describing processes such as the activity of DNA repair pathways (Cucinotta et al 2008, Taleei et al 2013, Belov et al 2014), cell cycle arrest (Qi et al 2007, Singhania et al 2011, Kempf et al 2013), or the induction of apoptosis (Lindner et al 2017, Kundrát et al 2018), and integrating these processes into models which can predict radiation sensitivity without purely phenomenological parameters (Vadhavkar et al 2014, McMahon et al 2016, Verkhovtsev et al 2016).
While the pathways underlying these models are complex—with even single DNA repair pathway models involving ten or more parameters—they remain conceptually very attractive. If the mechanisms underlying radiation response can be quantified, then predictions can be made of individual radiosensitivity for a particular tissue under a particular irradiation condition without the need for extensive empirical testing. Furthermore, an integrated model would enable the combination of a range of different datasets, including not only survival but also mechanistic aspects of radiation response to more accurately and robustly parameterise responses. If these models can be developed to fulfil the promise of mechanistic, situation-specific predictions of radiosensitivity, then this may significantly impact on how radiosensitivity is approached in clinical and pre-clinical scenarios.
Conclusions
It is difficult to summarise the current usage of the Linear Quadratic model without invoking George Box's well-worn aphorism: 'All models are wrong, but some are useful' (Box 1979). From our modern knowledge of radiobiology, we know the LQ is at best an approximation to the cumulative effects of a range of biological processes which depend on an array of environmental and exposure conditions, whose impacts can be further obscured by the heterogeneous nature of cell populations both in vitro and in vivo.
But despite these challenges and its venerable age, the LQ model continues to prove to be an effective tool in preclinical and clinical radiobiology. It has many strengths—its simplicity makes it easily understandable to non-specialists and straightforward to apply when comparing treatment schedules, while its functional form provides insights into aspects of radiation biology including one-hit and two-hit lethal events; early- and late-responding tissues; and the rationale behind fractionation and dose protraction. As a result, it is likely to remain a mainstay of clinical and preclinical radiobiology for some time to come. And, provided investigators are mindful that measured LQ parameters are specific to a particular treatment condition and how its approximations may break down in edge cases, it is also well-suited to these applications.
As our understanding of radiobiology improves, it is expected that new more detailed mechanistic models of radiation sensitivity will be developed, drawing in expertise from investigators across a range of backgrounds and skillsets. While these models may open the way to improved, personalised predictions of radiation sensitivity for patients based on their unique disease, there is a strong possibility that the LQ model will remain the common language to describe radiation sensitivity across disciplines.