
Abstract
While public awareness of sleep related disorders is growing, sleep apnea syndrome (SAS) remains a public health and economic challenge. Over the last two decades, extensive controlled epidemiologic research has clarified the incidence, risk factors including the obesity epidemic, and global prevalence of obstructive sleep apnea (OSA), as well as establishing a growing body of literature linking OSA with cardiovascular morbidity, mortality, metabolic dysregulation, and neurocognitive impairment. The US Institute of Medicine Committee on Sleep Medicine estimates that 50–70 million US adults have sleep or wakefulness disorders. Furthermore, the American Academy of Sleep Medicine (AASM) estimates that more than 29 million US adults suffer from moderate to severe OSA, with an estimated 80% of those individuals living unaware and undiagnosed, contributing to more than $149.6 billion in healthcare and other costs in 2015. Although various devices have been used to measure physiological signals, detect apneic events, and help treat sleep apnea, significant opportunities remain to improve the quality, efficiency, and affordability of sleep apnea care. As our understanding of respiratory and neurophysiological signals and sleep apnea physiological mechanisms continues to grow, and our ability to detect and process biomedical signals improves, novel diagnostic and treatment modalities emerge. Objective: This article reviews the current engineering approaches for the detection and treatment of sleep apnea. Approach: It discusses signal acquisition and processing, highlights the current nonsurgical and nonpharmacological treatments, and discusses potential new therapeutic approaches. Main results: This work has led to an array of validated signal and sensor modalities for acquiring, storing and viewing sleep data; a broad class of computational and signal processing approaches to detect and classify SAS disease patterns; and a set of distinctive therapeutic technologies whose use cases span the continuum of disease severity. Significance: This review provides a current perspective of the classes of tools at hand, along with a sense of their relative strengths and areas for further improvement.
Export citation and abstract BibTeX RIS
Glossary
| AASM | American Academy of Sleep Medicine |
| AHI | Apnea hypopnea index |
| ANN | Artificial neural network |
| APAP | Auto-titrating positive airway pressure |
| APEN | Approximate entropy |
| ASV | Adaptive servo ventilation |
| BiPAP | Bi-level positive airway pressure |
| BP | Blood pressure |
| CIH | Chronic intermittent hypoxemia |
| COPD | Chronic obstructive pulmonary disease |
| CPAP | Continuous positive airway pressure |
| CSA | Central sleep apnea |
| CVD | Cardiovascular disease |
| DFA | Detrended fluctuation analysis |
| DNN-HMM | Deep neural network-hidden Markov model |
| DWT | Discrete wavelet transform |
| EEG | Electroencephalogram |
| ECG | Electrocardiogram |
| EMG | Electromyogram |
| EOG | Electrooculogram |
| EPAP | Expiration positive airway pressure |
| EPR | Expiratory pressure relief |
| FIS | Fuzzy inference system |
| FOT | Forced oscillation technique |
| GG | Genioglossus |
| GH | Geniohyoideus |
| GMMs | Gaussian mixture models |
| HFIS | High-frequency inspiratory sounds |
| HMM | Hidden Markov models |
| HRV | Heart rate variability |
| IPAP | Pressure during inspiration |
| LLE | Largest Lyapunov exponent |
| MAAs | Mandibular advancement appliances |
| MRA | Multiresolution analytical |
| NAF | Nasal airflow |
| NEPAP | Nasal expiratory positive airway pressure |
| OAs | Oral appliances |
| OPT | Oral pressure therapy |
| OSA | Obstructive sleep apnea |
| PAP | Positive airway pressure |
| PLMs | Periodic leg movements |
| PPG | Photoplethymography |
| PSG | Polysomnogram |
| PVDF | Polyvinylidene fluoride |
| RDI | Respiratory disturbance index |
| REM | Rapid eye movement |
| REM sleep | Rapid eye movement sleep |
| RL | REM latency |
| RIP | Respiratory inductance plethysmography |
| SAHS | Sleep apnea hypopnea syndrome, the terminology that summarizes OSA, CSA, and mixed sleep apnea |
| SAS | Sleep apnea syndrome |
| SE | Sleep efficiency |
| SI | Severity index |
| SL | Sleep latency |
| SNA | Sympathetic nerve activity |
| SPLs | Soft palate lifters |
| SVM | Support vector machine |
| TEO | Teager energy operators |
| TMJ | Temporomandibular joint |
| TRDs | Tongue retaining devices |
| TST | Total sleep time |
| WPF | Weighted peak flow |
1. Introduction
Over the last two decades, extensive controlled epidemiologic research has clarified the incidence, risk factors, and global prevalence of OSA, as well as establishing a growing body of literature linking OSA with cardiovascular morbidity, mortality, metabolic dysregulation, and neurocognitive impairment. The US Center for Disease Control (CDC) and Institute of Medicine Committee on Sleep Medicine estimates that 50–70 million US adults have sleep or wakefulness disorders (Colten and Altevogt 2006). Furthermore, the American Academy of Sleep Medicine (AASM) estimates that more than 29 million US adults suffer from moderate to severe obstructive sleep apnea (OSA), with an estimated 80% of those individuals living unaware and undiagnosed, contributing to more than $149.6 billion in healthcare and other costs in 2015 (Watson 2016).
An escalating 10% of the general United States population has clinically significant sleep apnea (Peppard et al 2013). It is estimated that between 24–26% of men and 9–28% of women in the United States and Europe suffer from the disease, which is characterized by repeated periods of reduced or absent airflow that interrupt sleep (Young et al 2002). Sleep apnea is categorized into three forms: OSA, central sleep apnea (CSA), and the combination of OSA and CSA, constituting 84%, 0.4%, 15% of cases, respectively (Morgenthaler et al 2006). These disturbances have been shown to have significant effects on health and behavior such as cardiovascular morbidities, insulin resistance, neural injury, accelerated mortality, reduced cognitive function and poor work efficiency (Young et al 2002, Gottlieb et al 2010). In fact, OSA is believed to be a contributing factor to multiple devastating events such as the Three Mile Island accident, the Challenger explosion (Durning et al 2014), and Chernobyl (Hossain and Shapiro 2002). In addition, it can often amplify other medical conditions such as depression and schizophrenia (Cho et al 2008, Wulff et al 2012).
The gold standard diagnostic procedure for sleep apnea is polysomnography (PSG), more commonly known as a 'sleep study'. During this test, the patient stays overnight at a sleep laboratory where their respiratory and neurophysiological signals are recorded while they sleep. The Standards of Practice Committee of the AASM develops and reviews indications for polysomnography (PSG) in the diagnosis of commonly encountered sleep disorders, including sleep apnea. The resulting data are then analyzed by a specialist. Overall, it is a very time-consuming and expensive process as it can cost up to several thousand dollars (Bruyneel et al 2011, Masa et al 2011, Leger et al 2012). Some systems are available for home-use, but it is still unclear if these machines are appropriate, or efficient diagnostic tools (Behar et al 2013). There is still a need for automatic systems that reliably detect apneic events, so many ongoing research efforts are concentrated on this task. There are more than 2500 AASM Accredited Sleep Testing Facilities in the US that perform routine PSG diagnostic testing as well as the analytic scoring and interpretation of PSG results.
For over 25 years, the primary treatment intervention for sleep apnea has been continuous positive airway pressure (CPAP) (Sassani et al 2004), but nearly half of patients cannot tolerate CPAP and thus adherence is poor (Wohlgemuth et al 2015). Due to the limited effectiveness of current CPAP systems, more acceptable designs for CPAP treatment and other innovations have been developed to prevent sleep apnea.
In this article, we provide a comprehensive overview of: (1) diagnostic signal modalities for respiratory events (section 2.1); (2) algorithms and computational approaches for their detection and classification (section 2.2); (3) current nonsurgical and nonpharmacological treatments, and therapeutic approaches (section 3). Finally, we present some concluding remarks (section 4).
2. Methods to diagnose and detect apneic events
Today, digital and computerized systems for monitoring and analyzing sleep data have replaced paper-based systems. According to the AASM digital task force, systems used to diagnose and detect respiratory events encompass five basic and distinct processes (Penzel and Conradt 2000). First, the system must provide data acquisition and recording mechanisms. Second, the system must provide data viewing capabilities. Third, the system must enable the manipulation of data, in terms of visual scoring and editing of events. Fourth, the system must allow for data reduction, where epoch and event resolution data can be parametrized into useful diagnostic summary statistics for reporting. Finally, the system must enable storage and archival of relevant data and results. Despite the necessity of these systems in the clinical arena, to date, no uniform standard exists for any of these defined data processes.
According to the classification proposed by the AASM, sleep diagnostic devices could be categorized into four types. Type-1, standard PSG system which includes conventional biosignals, allowing acquisition of physiologic data from different organs, such as brain activity (EEG), muscle activity (EMG), eye movement (EOG), cardiac function (ECG, heart rate variability), as well as respiratory parameters such as airflow, respiratory movement/effort, and oxygen saturation. Type-2, Type-3, and Type-4 devices include a minimum of seven, four, and one signal channel of respiratory/neurophysiological biosignals, respectively (Ferber et al 1994, Collop et al 2011). Several clinically useful sensor modalities and techniques for observing relevant biosignals have been developed for the detection of respiratory events, which is described in the following section 2.1 and summarized in table 1.
Table 1. Comparison between breathing monitoring technologies.
| Airflow Measurement Technology | Description | Direct or Indirect | Distinguish between OSA or CSA | Pros | Cons |
|---|---|---|---|---|---|
| Pneumotachography | Measures airflow through the pressure difference of linearized flow that is captured by a facemask | Direct | No | Considered Gold Standard, high accuracy | Wearing mask can be uncomfortable and cumbersome |
| Differential Pressure Sensors | Measure through pressure difference caused by an orifice that disrupts airflow captured by a facemask | Direct | No | Well characterized flow characteristics for flow calculations | Create pressure drop and resistance, a bad seal between the mask and the patient can cause erroneous measurements |
| Hotwire Anemometers | Measure through temperature change caused by airflow captured by a facemask | Direct | No | Fast frequency response, high accuracy, large range of measurable flows | Susceptible to patient debris, dependent on laminar flow, need a tight seal for accurate measurements |
| Thermistors placed in Nasal Cannula | Measure Temperature difference in nasal cannula from breathing | Direct | No | Able to be comfortably placed in nasal cannula | Slow response time, unable to accurately detect full range of flow values |
| Nasal Cannula Pressure Measurements | Measure pressure changes in nasal cannula from breathing | Direct | No | Correlates well with measurements from pneumotachometers | Proportionality coefficients drift over longer periods of study |
| PVDF | Produces linear output based on pressure and temperature changes from breathing | Direct | No | Respond to both heat and pressure, eliminates need for multiple sensors | Similar disadvantages to those of nasal cannula temperature and pressure measurement |
| RIP | Records changes in thoracic and abdomen cross sections through changes in self-inductance of wires wrapped around the body | Indirect | Yes | High accuracy, sensitivity and patient safety | Calibration posture affects accuracy |
| IP | Measures changes in chest area through changes in electrical resistance | Indirect | Yes | Provides nonrestrictive continuous monitoring of respiratory rate | Calibration posture affects accuracy |
| Esophageal Manometry | Monitors pressure along the esophagus | Indirect | Yes | Useful in detecting upper airway resistance syndrome | Invasive |
| Acoustic Monitoring | Detects breathing events through the frequency of noise produced from airflow | Indirect | No | Does not require patient contact | Does not yet accurately assess AHI indexes |
| FGV Sensing and Laser Sensing | Movements of chest and abdomen are monitored using lasers or light to detect cessation of breathing | Indirect | No | Does not require patient contact | Requires patient to patient calibration, and is highly dependent on patient movement |
Collop et al (2011) have also proposed a different classification system to help clinicians decide which testing devices are appropriate for diagnosing sleep apnea. The system categorizes the devices based on the sleep, cardiovascular, oximetry, position, effort, and respiratory (SCOPER) parameters. The SCOPER system also specifies criteria on which to evaluate sleep apnea devices.
2.1. Signal and sensors for detecting and diagnosing apneic events
2.1.1. Direct and indirect measurement of airflow.
Pneumotachography is the gold standard for monitoring ventilation during sleep. A flow meter is attached to a facemask which is placed on the nose and mouth (Webster 2014). The patient's airflow passes through a flow-resistive element with channels that laminarize the flow. With a laminar flow, the energy loss of the air going through the resistive element is due to viscosity. The pressure difference is measured across the resistive element to quantify the energy loss, and the flow F is directly proportional to the pressure difference:  . Under laminar flow, the pneumotachometer obeys the Hagen–Poiseuille law, where r is the radius of the channel, Pi and Po are the pressures of the inlet and outlet ports, η is the viscosity, and L is the length of the channel (Ehrenwerth et al 2013) (figure 1). Miscalculations of the viscosity can cause erroneous measurements of the flow.

Figure 1. Pneumotachometer ((a) and (c)) fine mesh or ((b) and (d)) closely-packed channels help to laminarize flow, so that energy loss of the flow is due to the viscosity. The pressure drops ΔP measured with sampling lines corresponds to the energy loss due to gas viscosity.
Download figure:
Standard image High-resolution imageIn addition to the pneumotachometer, sensors commonly used in spirometry and ventilation monitoring include differential pressure sensors and hotwire anemometers. Differential pressure sensors operate by having a fixed orifice in the line of flow. The flow is laminar upstream from the orifice and turbulent downstream from the orifice, causing a pressure difference. Using Bernoulli's principle and a known cross-sectional area of the channel, the flow is calculated from the pressure drop across the orifice.
Although differential pressure sensors are widely used in anesthesia systems, ventilators, and spirometers, they result in a high pressure drop across the orifice at high flows, which is not ideal, and are insensitive to low flows (Ehrenwerth et al 2013). Additionally, differential pressure sensors are pressure dependent, and an unsealed respiratory circuit could cause erroneous measurements.
Hotwire anemometers are also used widely in spirometry and ventilation monitoring. Hot wire anemometers use a very fine wire electrically heated to some temperature above ambient. Air flowing past the wire cools the wire. Hotwire anemometers show great potential for medical airflow monitoring because they have a fast frequency response, high accuracy, a low pressure drop, and the ability to measure low flows and a wide dynamic range (Ardekani and Motlagh 2010). However, hotwire anemometry is susceptible to turbulent flows and debris. If placed proximally to the patient, notice should be taken to laminarize the flow and ensure debris does not affect the sensor or patient. When used in a mask for respiratory monitoring, a tight seal between the mask and the patient should be ensured to prevent leaks and cause erroneous flow measurement.
Use of a facemask with a pneumotachometer, differential pressure sensor, and hotwire anemometer sensor is often considered bulky or uncomfortable for a patient to wear during an entire sleep study. In order to prevent disturbance of sleep and circumvent the need for patient participation for flow measurement, flow sensors have been placed in nasal cannulas or above the mouth and below the nose. When measured from a nose cannula, parameters such as humidity, end-tidal CO2, temperature, and pressure can assess changes in flow and be used to detect apneas and hypopneas. Although thermistors placed in a nose cannula have been widely used to assess cessation of flow, they have a slow response time and cannot reliably detect the full range of flows that occur during respiratory events (Montserrat et al 1997, Norman et al 1997, Teichtahl et al 2003). Positioning of thermoelements on the face, body positioning, and variation in sensitivity and frequency response between different sensors can cause variability which contributes to a poor relationship between air temperature and airflow (Berg et al 1997, Berry et al 2005).
Alternatively, the pressure measured from a nasal cannula has shown to correlate well with patient breathing. When measuring the pressure of the nasal cannula, the measurement is linearized by computing the square root of the nasal prong pressure (Farre et al 2001). Several studies have compared the Apnea hypopnea indexes (AHI) that resulted from nasal cannula pressure measurements to scores that resulted from thermistors or chest wall movements with reported bias of the AHI ranging from −9.6 h−1 to +4.6 h−1 (Bradley et al 1995, Fleury et al 1996, Kiely et al 1996, Mayer et al 1998, Rees et al 1998, Hernández et al 2001). When compared with face mask pneumotachometers, the AHI score of the nasal pressure cannula had a fair correlation to that derived from pneumotachometer. However, when measured over several hours, proportionality coefficients shifted, and therefore the nasal pressure recordings did not quantitatively reflect airflow (Thurnheer et al 2001). Although not quantitatively reflecting patient airflow, the nasal pressure cannula monitoring can be used to detect inspiratory flow limitation or hypopneas because these events are detected based on relative comparison to normal breathing of the patient (Farré et al 2001). When compared with pneumotachography, the golden standard for ventilation measurement in sleep studies, nasal pressure monitoring and subsequent linearization by a square root transform provided an AHI and detected apneas and hypopneas without a significant bias (Thurnheer et al 2001). Comparing nasal pressure monitoring to pneumotachography on an event-by-event basis rather than complete AHI scores, breathing event classification agreed well with an average Cohen's κ statistic of 0.76, where 1.0 represents complete agreement and 0.0 represents agreement no better than chance (Heitman et al 2002).
Polyvinylidene fluoride (PVDF) sensors have been recently introduced for sleep respiratory monitoring. PVDF consists of a thin plastic film, that when polarized, is sensitive to both temperature and pressure changes, and produces a linear voltage output based on those changes. When compared with the traditional methods of a thermistor and nasal pressure cannula in one study, PVDF had a near unity correlation coefficient for the four indices calculated, including apnea–hypopnea index (0.990), obstructive apnea index (0.992), hypopnea index (0.958), and central apnea index (1.0) (Kryger et al 2013). PVDF sensors eliminate the need to have multiple sensors placed at the same location, as they respond to both heat and pressure. However, they have similar limitations to those of thermistors and pressure sensors.
The commonly used respiratory inductance plethysmography (RIP) indirectly measures ventilation by recording changes in thoracic and abdomen cross-section. RIP measures abdomen chest movements through coiled wires wrapped around a patient's chest that carry a low-amplitude sine wave. Changes in chest and abdomen circumference alter the self-inductance of the wires, and therefore the frequency of the sine wave, which can be demodulated and processed to track changes in chest and abdomen size (Watson et al 1988). RIP is widely studied and regarded highly by the AASM due to its great accuracy, sensitivity, and high patient safety (Zhang et al 2012). The wires were initially integrated into two elastic bands, one around the abdomen and one around the chest, but RIP has also been used with wires sewn into shirts, comfortably worn by patients.
With proper calibration, RIP can achieve a tidal volume measurement accuracy of 96% when compared with pneumotachography or spirometry (Gonzalez et al 1984). The posture of the patient greatly affects the measurement of tidal volume; if the RIP is calibrated with the patient in the upright position, sleeping and breathing in the supine position can lead to greater sources of error. However, Gonzalez et al (1984) found that using a two-body posture calibration method can improve the error due to changing body position, with measured tidal volumes falling within 4–10% of those measured by spirometry.
RIP is noted for its added benefit of helping to distinguish between OSA and CSA, as illustrated in figure 2. During OSA, cessation of breathing occurs despite an ongoing effort to breathe, while CSA occurs when the brain does not properly send signals to the muscles controlling respiration. During CSA, the lack of effort by the muscles in the abdomen and chest can be noted with the use of RIP, aiding distinguishing CSA from OSA.

Figure 2. Polysomnography with central sleep apnea (A) and obstructive sleep apnea (B). Chest effort indicated by the arrows is absent in CSA. Reprinted with permission from Grimm and Koehler (2014). CC BY 4.0
Download figure:
Standard image High-resolution imageRIP accuracy and precision is limited in obese patients. The accuracy in estimating minute ventilation is considered acceptable, with a relative difference of 5.2%. The precision of RIP in obese patients can limit the accuracy of detecting hypopneas. The SD of the difference between RIP and measurements from a pneumotachograph was 10.5% during wakefulness and 33% during sleep (Cantineau et al 1992). However, RIP scoring has been shown to have increased sensitivity and specificity in overweight or obese patients when compared to the recommended and acceptable criteria for sleep scoring by the AASM (Kogan et al 2016). Although RIP accuracy and precision is significantly decreased during sleep in obese patients, RIP is still clinically useful (Cantineau et al 1992).
Impedance plethysmography (IP) measures respiratory cycles by changes in electrical resistance. When volume changes within an induced electrical field, a high frequency (about 100 kHz), low level current (about 1 mA or more) is injected through electrodes placed on the chest wall. As the thoracic cross-sectional area changes during breathing, it changes the electrical resistance, which can be recorded as a change in voltage (Webster 2014). Like RIP, IP is prone to error and inconsistency due to changes in patients' posture during recording signal.
Esophageal manometry, or measuring the esophageal pressure, can be useful in assessing patients with upper airway resistance syndrome. Esophageal manometry can indicate increased respiratory effort during respiratory events. However, esophageal manometry is relatively invasive, not tolerated well by most patients, and therefore is not used for routine testing (McNicholas 2008). Additionally, it has been shown that the use of nasal cannula pressure monitoring can be used to identify non-invasively the same events as esophageal manometry including Respiratory Effort-Related Arousals, apneas, and hypopneas (Rapoport 2000).
Electromyographic (EMG) activity can also be recorded during sleep apnea studies. The sternocleidomastoid (SCM), genioglossal (GG) and abdominal wall (ABD) muscle activity can be observed to represent inspiratory pressure generating, inspiratory airway-maintaining, and expiratory muscles respectively. The phasic activity of the GG muscles is normally reduced in REM sleep compared to wakefulness, but children with OSA were found to have phasic GG EMG activity during sleep. The SCM and GG muscles EMG indexes indicate that they increase activity with worsening hypoxemia and hypercarbia (Jeffries et al 1984, Dempsey et al 2010).
In addition to more traditional thermal and pressure sensors, acoustic monitoring has also been researched as a possible means to detect apneas and hypopneas. An acoustic sensor is used to record the signals generated from the expired air flow. These signals can be acquired in the natural sleep environment without any contact to the subject and can be used to detect breathing events, obstruction and snoring (Vegfors et al 1993, Gordh et al 1995, Roebuck et al 2013). Children with suspected obstructive Sleep Disordered Breathing were found to produce louder high-frequency inspiratory sounds (HFIS) during sleep as well as have narrower airways (Rembold and Suratt 2004). The HFIS were observed using a microphone placed above the observed patient. Although the occurrence of HFIS correlated with the patient's rate of obstructive respiratory events, the HFIS intensity did not correlate well with respiratory effort as measured by an esophageal catheter (Rembold and Suratt 2014). This could be explained by the fact that HFIS intensity increases with high-velocity, high-turbulent flows, and some obstructive events do not have any patient airflow. While acoustic monitoring has not yet been used to accurately assess AHI indexes, acoustic monitoring has been used in the commercially available Masimo RRa® to determine respiratory rate and apneas through an acoustic sensor that adheres to patients' necks. The RRa® was found to be 3% more accurate than a capnograph when assessing respiratory rate, and had a higher sensitivity (P = 0.0461) when detecting cessation of breathing (⩾30 s) (Ramsay et al 2013).
In another effort to diagnose and monitor respiratory events without patient contact, fiber grating vision sensing and laser sensing has been researched. With this technology, the positions or movements of the chest and abdomen are monitored with respect to the patient's center of gravity. Using over 100 sampling locations, respiratory events could be determined and distinction between OSA and CSA could be made (Takemura et al 2005). However, this method requires much calibration between patients, and is highly dependent upon patient movement, which can occur during sleep. With refinement, fiber-grating vision sensing could be used to detect sleep apnea without patient contact.
Researchers have also explored the use of off-the-shelf smart phones and applications to diagnose sleep apnea using a sonar system with frequency modulated continuous waves. The system uses the phone's speakers to emit sound waves and analyzes the reflections. The reflections from the body arrive back to the phone at different times depending on the distance from the phone, and amplitude changes due to changes in breathing are extracted. The system can even analyze breathing from two patients lying in the same bed. When placed within 1 m of the patient, the phone application can estimate respiratory rate with 99.2% accuracy. When compared with a traditional PSG, the application identified CSAs with a 0.9957 correlation coefficient, OSAs with a 0.9860 correlation coefficient, and hypopneas with a 0.9533 correlation coefficient. The system accurately predicted apneic events without patient contact, but does not provide other information provided in a traditional PSG, including patient position, visual information, and electroencephalogram (EEG) signals used to determine sleep stages (REM, non-REM, and awake) (Nandakumar et al 2015).
2.1.2. Measurement of the concentration or partial pressure of respiratory gases.
2.1.2.1. CO2 concentration.
The concentration of respiratory gases in the blood can reflect the condition of patients' breathing patterns. While the arterial CO2 concentration is a parameter of interest, it is expensive and invasive to monitor during polysomnography. Alternatively, capnometry is the measurement of the CO2 concentration of exhaled air, and end-tidal  (et
(et ), is marked as an important parameter with significant correlation for apneic event detection (Magnan et al 1993). Transcutaneous carbon dioxide (tc
 ) can also be monitored. For both et
 and tc
 the accuracy and potential sources of error of estimating the arterial CO2 concentration must be considered.
Monitoring of et is commonly used in pediatric patients and can be used to score apneic events. An apnea could be observed by the absence of an et
 peak or wave from the capnography monitor. The et
 is typically sampled via a sampling line connecting the nasal cannula to an external sensor, so mouth breathing or occlusion of the nasal cannula can affect the ability to monitor breathing events. Additionally, because et
 corresponds to the highest concentration of CO2 within a breath rather than the flow or volume of the breath, et
 signals could be misleading during an inspiratory apnea if small breaths with a high CO2 concentration continue (Berry et al 2012a).
tc measurement is a warm sensor placed on the surface of the skin and an electrochemical cell that determines the pH change due to CO2 concentration. The elevated temperature of the sensor causes local hyperemia and an increased arterial blood supply below the sensor. The tc
 at the sensor is higher than the actual arterial value due to increased local blood and tissue
  and epidermal cells producing CO2, so a correction factor is often used to determine the arterial
  from the tc
 . A highly permeable membrane separates the electrochemical cell from the skin, and an Ag/AgCl reference electrode is used to measure the pH. With sensor temperatures of 42 °C, or even as low as 37 °C, a good correlation between
  and tc
 has been reported (Eberhard 2007). However, it is not recommended to use transcutaneous monitoring if the patient has thick skin edema or thick subcutaneous tissue where the sensor is applied. Also, the sensor location used for transcutaneous monitoring should be changed often to avoid thermal injury from the local heating (Restrepo et al 2012).
2.1.2.2. O2 concentration.
Oxygen concentration is also of great interest during sleep studies, because the arterial oxygen concentration may fall dramatically during an apneic event. Pulse oximetry monitors the peripheral oxygen saturation (SpO2) by shining red and infrared light through a fingertip, ear or toe. The amount of red or infrared light that is absorbed corresponds to the concentration of oxygenated hemoglobin and deoxyhemoglobin in the blood, and therefore the oxygen concentration in the blood can be determined (Webster 2014). The SpO2 changes during respiratory events such as apneas and hypopneas, and hypopneas are even classified as reduced airflow accompanied generally by a SpO2 drop of at least 4%. Normal SpO2 levels vary between patients, with normal ranges falling between 85–95% (Roebuck et al 2013).
Pulse oximetry monitors are prone to error and false desaturation measurements due to motion artifact, noise, or missed readings. To reduce errors, pulse oximeters average readings and report oxygen levels every 3–12 s, which may cause a delay in alarms or monitoring. Notwithstanding, whether incorporated into at home monitors or used as a part of a polysomnography suite, pulse oximetry has proven to be a valuable tool in detecting and diagnosing sleep apnea. The channel typically provides summary statistics (means, minimum levels), quantifies the total time the patient experiences oxygen saturation under various thresholds and tallies the number of events where the patient experiences desaturation between 2–5% (Flemons et al 2003).
Additionally, near-infrared spectroscopy (NIRS) is a method used to continuously and non-invasively monitor cerebral oxygen concentration. NIRS uses light with wavelengths from 700 to 1300 nm to penetrate the skull to the cerebral tissue. Changes in the relative amounts of oxygenated hemoglobin and deoxygenated hemoglobin can be monitored through changes in the absorption of the light (Hayakawa et al 1996). NIRS may provide an earlier warning of decreased blood oxygenation. In a study of ten children who required episodes of apnea during laser airway surgery, cerebral oximetry indicated a 5% decrease in cerebral oximetry (rSO2) in all patients before pulse oximeter measurements decreased by 5%. Also, in all patients, the rSO2 decreased by 10% before the pulse oximeter measurements decreased by 10% (Tobias 2008). Cerebral oximetry with NIRS provides a non-invasive measurement of oxygenation with a possibly faster response time than pulse oximetry.
Photoplethymography (PPG) is an uncomplicated and relatively inexpensive optical measurement technique that has been used to detect variations of blood volume in the microvascular bed of tissue. Using simultaneous reflective PPG and a force sensor, placed on the opposite sides of the same fingertip, Keikhosravi et al (2013) showed that the photoplethysmogram signal is mainly due to volume changes not the blood compression and rarefaction induced by heartbeat. Although, PPG has traditionally been used to measure oxygen saturation and heart rate determination, it has shown that its capability and usefulness is not limited to the calculation of the aforementioned physiological parameters. Active research efforts in this field are being devoted to identifying additional physiological parameters that can be extracted and measured from the PPG signal. Thus, investigation into the analysis of the PPG signal has increasingly become widespread. Ghamari et al (2016) proposed a mathematical model to represent the original PPG signal as a summation of two Gaussian functions. In the case of sleep apnea as an example, when apnea occurs, the sympathetic activity of the nervous system increases. This increase leads to vasoconstriction which directly reflects on the original shape of the PPG signal by a decrease in the signal amplitude. (Somers et al 1995, Nitzan et al 1998, Leuenberger et al 2001).
Peripheral arterial tonometry (PAT) technology uses a finger pneumo-optic plethysmograph to assess arterial oxyhemoglobin desaturation. The PAT signal is sensitive to the sympathetic nervous activity to the periphery that is characteristic of obstructive apneic events (O'Donnell et al 2002). Greater airflow obstruction produces greater reductions in PAT signal amplitude, and brief periods of airflow obstruction that do not cause EEG arousal can significantly reduce the PAT signal amplitude (O'Donnell et al 2002). When compared with polysomnography, the Watch_PAT system, which combines PAT technology with actigraphy and arterial oxygen saturation to diagnose OSA, had high concordance with both the respiratory disturbance index Chicago criteria (RDI.C) and the Medicare criteria (RDI.M) with intra-class correlation coefficients of 0.88 and 0.95 respectively for in-lab assessments, and 0.72 and 0.80 for in-home assessments (Pittman et al 2004). In another study comparing in-home polysomnography and the Watch_PAT system, there was strong correlation of the AHI, RDI, and ODI assessed by the PSG and the Watch_PAT system (r = 0.90, 0.88 and 0.92 (n = 92), p < 0.0001, respectively) (Zou et al 2006). The Watch_PAT system is an effective, portable, and less-costly method for sleep studies that correlates well with PSG measurements.
2.1.3. Measurement of electropotentials.
Electropotentials are measured during sleep studies to detect SAS events and sleep patterns. Signals such as EMG, EEG, and EOG are collected during polysomnography, as illustrated in figure 3.

Figure 3. The polysomnographic tracing includes electroencephalogram (EEG), electromyogram (EMG) EMGgg: Electromyogram of the genioglossus muscle (intramuscular); EMGsub: EMG of the submental muscle (surface), RESP flow, SaO2, etc. (A) The cessation and resumption of flow defines the apneic event. (B) One obstructed apneic event (between the dotted vertical lines in (A)) is expanded to illustrate the progressive increase in inspiratory effort, pressure at the level of the epiglottis (Pepi) and dilator muscle EMG (EMGgg) during the apnea. It demonstrates snoring on the flow tracing followed by apnea, and increases in EMG activity throughout the apneic event. Reprinted with permission of the American Thoracic Society, Copyright © 2016 American Thoracic Society (Eckert and Malhotra 2008).
Download figure:
Standard image High-resolution imageA number of studies have shown that SAS events and patterns can be detected with high accuracy using only single channel ECG data. HRV information can be obtained from the ECG signal, and using the standard deviation of the NN interval of both nighttime and daytime heart beats has shown to detect obstructive sleep apnea with high sensitivity (89.7%) and high specificity (98.1%). However, using ECG as the sole parameter for sleep apnea screening has its limitations, as diseases such as diabetes, sequelae of myocardial infarction and chronic heart failure, which are often associated with OSA, can cause false negatives when screening for OSA (Roche et al 1999, Shiomi et al 1996). Changes in HRV due to tidal volume and breathing effort must be taken into account when processing HRV data (Meziane et al 2015). Even when not used as the sole parameter for sleep apnea detection, ECG data are still a valuable tool used in polysomnography.
Chin and leg EMG is a traditional parameter used during polysomnography. EMG data are most often used during polysomnography to monitor sleep stages, along with EEG and EOG, because muscle tone subsides during NREM sleep and is at its lowest during REM sleep. In addition, chin electrodes are typically placed close to the geniohyoideus (GH) and genioglossus (GG) muscles which are pharyngeal dilator muscles and which play an important part in maintaining upper airway patency. Therefore, chin EMG can be considered a noninvasive method to assess upper-airway muscles' EMG activity shown in figure 3. OSA patients have been found to have significantly higher chin EMG at sleep termination, which correlates with other findings that OSA patients have higher upper airway muscle activities than normal subjects in wakefulness (Mezzanotte et al 1992, Al-Angari 2008).
Lastly, surface EEG allows for detailed analysis of depth of sleep through sleep staging, as well as sleep architecture and efficiency based on phasic transitions through sleep cycles. While not required to obtain a SAS diagnosis, EEG provides a clinically useful measure of the effect of SAS respiratory pathology on the overall quality of sleep. In SAS patients, conventional parameters showed predictable decrements in total sleep time (TST), fragmentation of sleep architecture, slow wave sleep, and REM sleep and increases in stage 1 and nocturnal awakenings (Terzano et al 1996). Moreover, obstructive event-induced work of breathing or hypoxemia has an effect on electrocortical activity. In a study of severe SAS patients, statistically significant differences were observed in the brain activity of apneic patients relative to normative patients globally and in particular in the local temporal region to SAHS events. More specifically, EEG signals measured directly following apnea onset displayed average differences of 268% between initial and maximum signal amplitude measurements, and 202% between initial and final values of amplitude, frequency, phase, and other signal and descriptive statistical parameters (Svanborg and Guilleminault 1996). As such, the AASM recommends three EEG derivations for scoring of sleep, including frontal, central, and occipital sensor locations F4/M1, C4/M1, O2/M1, as well as back-up derivations: F3/M2, C3/M2, and O1/M2 (Iber 2007, Ruehland et al 2011).
Electrooculogram (EOG) is used to capture the distinct sharp eye movements characteristic of REM sleep. Arousal from REM sleep is accompanied by sudden halting of rapid eye movement on EOG and increased muscle tone recorded on EMG.
2.1.4. Patients' sleeping behavior and body movements in sleep.
Body position of patients during a sleep cycle is of great interest to researchers because OSA severity can vary with body position. To monitor body position, accelerometers or video recordings have been used.
Using accelerometry (or actigraphy), patient body movements can be recorded, typically with inexpensive piezoelectric sensors. Its ability to track body motion and snoring helps track information such as sleep duration and the number of times a patient wakes during the night. Although actigraphy has lower specificity than polysomnography in identifying wakefulness in patients, its use might be preferred to polysomnography when patient monitoring spans a long duration, as it is easier for patients to comply with actigraphy monitoring than traditional polysomnography (Roebuck et al 2013).
Video recordings and corresponding image processing technology have been widely used in the noncontact apnea detecting field. Many researchers correlate the PSG signals to the patient's sleeping behavior, such as body position, which is extracted from videos. In some cases, video recordings have helped to confirm diagnoses when used in conjunction with PSG signals. Even though the AHI limits may be normal, video recordings may show supplemental information about respiratory events such as head movements and arousals (Griffiths et al 1991, Sivan et al 1996, Anders and Sostek 1976, Silvestri et al 2009, Kryger et al 2013).
Table 2 shows summary of SAS diagnostic parameters from PSG, types of physiological events encompassing those parameters, sensor modalities for detecting events, and classification methods, and algorithms commonly used to recognize SAS event patterns.
Table 2. Summary of SAS diagnostic parameters, the types of physiological events, sensor modalities, and commonly used classification methods.
| Diagnostic parameters | Characteristic physiological events | Relevant signal and sensor modalities | Classification methods | Reliable sensor modalities |
|---|---|---|---|---|
| Apnea–hypopnea index (AHI), respiratory disturbance index (RDI), other respiratory parameters | Obstructive apneas, central apneas, mixed apneas, hypopneas, respiratory effort-related arousals, oxygen desaturations, bradycardia, sinus tachycardia | Pneumotachometry, nasal cannula pressure sensors, thermistor, thermocouples, polyvinylidene fluoride, hotwire anemometers, respiratory inductance plethysmography (RIP), impedance pneumography (IP), magnetometer, strain gages, end-tidal  , pulse oximetry, photoplethysmography, ECG, audio (acoustic sensor), IR, sonar, video, actigraphy, peripheral arterial tonometry , pulse oximetry, photoplethysmography, ECG, audio (acoustic sensor), IR, sonar, video, actigraphy, peripheral arterial tonometry |
Amplitude and adaptive thresholding, fuzzy networks, artificial neural networks, decision trees, ensemble models, nearest neighbor methods, linear and kernel SVM, deep neural networks | Gold standard PSG studies recommend thermal and pressure based airflow sensors used with 2 effort belts, nasal cannula pressure sensors, End-tidal  in a hospital setting (Collop 2011) in a hospital setting (Collop 2011) |
| Sleep architecture, sleep efficiency (SE), arousal index (ArI), sleep latency (SL), REM latency (RL), total sleep time (TST), periodic leg movements (PLMS) index, other arousal and sleep parameters | Stage wake, stage REM, stage N1, stage N2, stage N3, arousals, sleep spindles, K-complexes, periodic leg movements, spikes, sharps, vertex wave sharps | EEG (F4-M1, C4-M1, O2-M1, F3-M2, C3-M2,O3-M2), Chin EMG, EOG, ECG, Leg EMG, audio, video, actigraphy | Autoregressive models, hidden Markov models, Gaussian mixture models, linear and quadratic discriminant analysis, random forests, regression trees, deep belief networks, deep neural networks | Gold standard PSG studies recommend primary EEG derivations at F4/M1, C4/M1, O2/M1, submental EMG, and back-up EEG derivations at F3/M2, C3/M2, and O1/M2 (Iber 2007, Ruehland et al 2011) |
2.2. Signal processing, algorithms, and techniques
Once single or multichannel sleep data of sufficient quality has been acquired, subsequent analysis is needed to quantify and summarize relevant diagnostic parameters for SAS including the apnea–hypopnea index (AHI), respiratory disturbance index (RDI), arousal index, sleep architecture, and sleep efficiency. The current gold standard for obtaining these measurements is manual scoring, and typically involves a certified polysomnography technician applying visual pattern recognition techniques to the sleep data on a 30 s epoch basis. For each epoch, the technician identifies any obstructive, central or mixed apneas, hypopneas, respiratory effort related arousals, EEG arousals, oxygen desaturations, arrhythmias, periodic leg movements, the relevant sleep stage, among other physiological variables (Benca 2012, Berry et al 2012b).
This manual scoring process is time consuming, often requiring 1–2 h per Type-1 sleep study. In addition, manual scoring is prone to error and inconsistency. The AASM Inter-Scorer Reliability program enables estimation of the average epoch by epoch agreement between an individual technician's scoring to an expertly scored sample polysomnography study. The latest results indicate a 77.1% agreement on OSAs, 52.4% on CSAs, 65.4% on hypopneas, and 82.6% on arousals (Rosenberg and Van Hout 2013, 2014). A key source of variability comes from indirect measurement of respiratory airflow; thermistor on the nose, pressure measurements at the nose, and other common signals are indirect measures of airflow and breathing, and render it difficult to objectively detect hypopneas or CSAs. Other factors contributing to relatively low inter-rater agreement include physiological variability between patients, data quality and noise characteristics, human fatigue, and the task complexity of analyzing hundreds of epochs of multimodal sensor data for dozens of multivariate physiological patterns.
Significant research efforts have focused on exploring computational approaches to sleep scoring, with the aim of developing automated systems that can achieve non-inferior, equivalent, or superior performance relative to expert humans (Cabrero-Canosa et al 2004). Multisite studies at five academic centers have evaluated the performance of an automated scoring system versus computer-assisted manual scoring, as well as the computer-assisted scoring agreement across sleep centers (Kuna et al 2013, Malhotra et al 2013). Large validation studies like these have assisted in the development of commercially available systems for autoscoring (Anderer et al, 2005, 2010). Yet the acceptance of these systems remains limited; in 2015, a survey of 179 sleep labs reported by ResMed showed only 14% used any form of autoscoring or computed assisted scoring as of 2015. As such, the development of broadly accepted and utilized computational approaches to scoring remains an open research challenge.
This review section provides an overview of the fundamental algorithmic and signal processing techniques employed to automate the detection of apnea related physiological events. In particular, we discuss the application of amplitude based analysis, time-frequency and wavelet based transformations, nonlinear transformations, autoregressive models, and recent machine learning approaches to identify apneas, hypopneas, and sleep stages in single and multichannel polysomnography data settings. This discussion is by no means comprehensive, and seeks to give readers a sense of the classes of tools at hand. For additional information, we refer the reader to a review on computer-assisted diagnosis specific to apnea–hypopnea event detection (Alvarez-Estevez and Moret-Bonillo 2015), a comparative review of automated sleep staging algorithms (Şen et al 2014), and a review specific to artificial neural network applications for sleep scoring (Ronzhina et al 2012).
2.2.1. Signal processing and data representations.
A common framework through which we can consider the problem of recognizing SAS related patterns in physiological data involves two general concepts—data representations and models. Data representations can be defined as abstract reformulations of the original raw signal data that aim to exhibit desirable analytical properties for classification, such as being more discriminative between disease and normative classes, better conditioned, lower in dimensionality, sparser, among others. Models then operate on these resulting data representations, and estimate or predict the corresponding class label for each representation. In the context of automated approaches to sleep scoring, each data representation typically represents a single epoch of sleep data, while the applied models output which, if any, of the aforementioned apnea related events are found within that epoch.
Figure 4 shows the process of obtaining data representations involves applying techniques from fields including signal processing, pattern recognition, data mining, feature engineering, and machine learning to single and multichannel polysomnography data. The sections below discuss some common data representation techniques that have exhibited promising performance for respiratory and neural event detection in empirical studies.

Figure 4. SAS diagnostic parameters of interest, the types of physiological events that characterize those parameters, clinically useful sensor modalities for observing disease relevant biosignals, and classification methods commonly used to recognize SAS event patterns.
Download figure:
Standard image High-resolution image2.2.1.1. Time-frequency based transforms.
Time-frequency domain transformations are among the most popular techniques for producing data representations for apnea and hypopnea detection problems, by analyzing the temporal and spectral characteristics and changes in relevant respiratory signals. This approach commonly involves computing sufficient statistics such as mean, variance, skewness, kurtosis, variation and others on the data in the frequency or another transform domain, and supplying these summary level statistics to an adaptive model for detecting apnea and hypopnea events (Khandoker et al 2009, Kocak et al 2012). For sleep staging, frequency power spectrum, power ratio, spectral frequency, duration ratio, spindle ratio, SWS ratio, relative spectral band energy, harmonic parameters, Itakura distance, and interdependency measures have also been effective (Krakovská and Mezeiová 2011, Liang et al 2012b).
2.2.1.2. Multiresolution and wavelet based transforms.
Multiresolution analytical (MRA) techniques, like the discrete wavelet transform (DWT), have also demonstrated promising performance for sleep apnea event detection (Khandoker et al 2009, Sweeney et al 2013) and sleep staging (Garg et al 2011, Fraiwan et al 2012) in both single and multichannel settings. These techniques commonly involve an orthonormal decomposition of the signal data into some wavelet basis, whereby summary statistics can be computed at multiple levels of resolution. In the multiscale setting, additional informative parameters like multiscale entropy have been incorporated for effective single channel sleep staging (Fraiwan et al 2012). Sleep data tend to exhibit greater sparsity in the wavelet domain than the original, so this technique can be used to compress the dimensionality of epoch representations in cases where there are few epochs for analysis and the modeling system becomes underdetermined.
2.2.1.3. Nonlinear and other transforms.
Epoch by epoch data representations have been generated using nonlinear and other transformation procedures to classify respiratory and neuronal signals with some success. This class of transformations applies mathematical and information theoretic processes for producing analytical systems whose changes in outputs are not proportionate to changes in input, enabling the modeling of chaotic, unstable, aperiodic, and solitionious dynamics. Largest Lyapunov exponent (LLE), detrended fluctuation analysis (DFA) and approximate entropy (APEN) have been used to estimate OSA severity (Kaimakamis et al 2009). Analysis of ECG signals enables the extraction of information on both heart rate and the rate of respiratory inspiration and expiration. Cardiorespiratory coupling techniques explore the interplay between these derived heart and respiratory rate signals by analyzing their covariance structure, a measure of how the correlated variables change together. In the single ECG channel setting, nonlinear cardiorespiratory coupling dynamics were extracted based on recurrence quantification analysis to identify apnea and hypopneas (Karandikar et al 2013). The Choi–Williams distribution, Hilbert–Huang transform, as well as nonlinear spectral techniques including bispectral analysis, nonlinear higher order spectra, the scattering transform, and reflection coefficients produced by a lattice filter representation of a recursive autoregressive process have been used for classifying sleep stages with comparable accuracy to human experts (Dagum and Galper 1993, Khandoker et al 2009, Acharya et al 2010). Some work has applied unsupervised machine learning approaches to apnea hypopnea detection, including particle swarm feature optimization paired with 1-nearest-neighbor classification methods with robust performance (Chen et al 2012).
While many algorithmic approaches focus on automatically scoring apneic events, another well-established method seeks to characterize a whole signal, such as airflow or SpO2, subsequently enabling automated SAHS determination methods that do not rely on events as the sole source of information. Nocturnal pulse oximetry is a widely studied single channel signal modality proposed as an alternative to PSG as a screening tool for OSA. Several oximetric indexes have been derived from nocturnal blood oxygen saturation (SaO2). Prior work has analyzed the performance of nonlinear transformations applied to the SaO2 and airflow signals individually to characterize SAHS including the central tendency measure (CTM), principal component analysis (PCA), APEN, sample entropy (SEn), kernel entropy (KEn), spectral entropy (SE), multiscale entropy (MsE), second- and fourth-order statistical moments in the time domain, the Lempel-Ziv complexity (LZC), respiratory rate variability (RRV), and other methods (Álvarez et al 2007, Hornero et al 2007, Alvarez et al 2010, Gutiérrez-Tobal et al 2012, 2013, 2015, Marcos et al 2016). Overall, multiclass-classifiers and AHI estimators using SpO2 and airflow signals have been analyzed in validation studies showing substantially similar performance to more traditional manual and automatic event scoring approaches.
2.2.2. Algorithms and classification models.
Models and classifiers take individual feature vectors or representations and output either continuous or discrete class labels. For sleep scoring, the data representations are typically vectors that correspond to a single 30 s epoch of polysomnography data. These vectors are used as inputs, while class labels for each epoch include normal breathing, apnea events, hypopnea events, and the relevant stage of sleep. The available classifiers range in complexity from simple models with a small number of static parameters such as adaptive thresholds, to architectures composed of hundreds of millions of tunable parameters as in the case of deep learning. The key aspect of machine learning classifiers is that their core models can be adaptively parameterized through a training optimization procedure that seeks to minimize the prediction error on available data while maximizing the generality to unseen data. In this sense, all models discussed here with data-adaptive parameters whose performance improves with experience could be understood in a machine learning context. This section of the review discusses specific algorithmic approaches for the classification of SAS patterns in single or multichannel PSG data.
2.2.2.1. Amplitude and adaptive thresholding.
Some studies proposed an amplitude-based thresholding algorithm while their method included nasal airflow (NAF), forced oscillation technique (FOT), and/or abdominal breathing signals (Reisch et al 2000). In these cases, numeric thresholds were predefined or adaptively defined with programmatic methods to classify the presence or absence of SAHS related pathologies based on changes in signal amplitude, frequency powers, statistical characteristics, or other derived measures. There have been many studies showing the amplitude-based thresholding of different respiratory signals for online detection of the apneic events. Studies show that online automated apneic detection would be efficient when incorporating two or more different respiratory derivations. Taha et al (1997) presented detection of hypopnea and cessation in breathing by analyzing the oxyhemoglobin saturation level combined with RIP. Further classification of apnea into central, mixed, or obstructive was achieved based on the presence of abdominal breathing effort. The algorithm was able to detect 93.1% of the manually detected events.
Other studies investigated amplitude-based and breath-by-breath ways for offline detection by using a FOT and nasal mask pressure signal time series (Steltner et al 2002). The method is based on pressure amplitude, FOT amplitude and baseline extraction. Then, these features were compared with defined thresholds which lead to detection and classification of hypopneas as well as obstructive, mixed, and central apneas (Steltner et al 2002). In addition, adaptive thresholding has been used with Teager energy operators (TEO) and other R-wave detection methods to predict OSA and CSA events from single channel ECG (Karandikar et al 2013).
2.2.2.2. Linear and kernel methods.
Linear and kernel methods have been utilized for pattern recognition for SAS applications due to their simple implementation, theoretical soundness, and broad extendibility. These models can be described succinctly as a weighted linear combination of input parameters whose weights are adaptively selected based on a learning optimization process when applied to training or development data. Kernel methods extend the previously defined linear models by applying the kernel trick, a method for introducing nonlinearities such as polynomial or Gaussian radial basis functions to the input data for learning in a computationally feasible and efficient way. First and second order autoregressive techniques have used model sleep phasic transitions as autoregressive processes. Autoregressive models such as these have been employed to utilize single channel EEG data for the estimation of epoch-by-epoch sleep stages (Ning and Bronzino 1990) (Liang et al 2012b). Additionally, classifiers based on quadratic (QDA), linear (LDA) discriminant analysis, K-nearest neighbors (KNN) and logistic regression (LR) were evaluated on spectral and nonlinear input features from single channel SpO2. In this study, the classifier based on LDA with spectral features provided the best diagnostic ability with an accuracy of 87.61% (91.05% sensitivity and 82.61% specificity) and an area under the ROC curve (AROC) of 0.925 (Marcos et al 2009).
Another popular machine learning method is support vector machine (SVM). Al-Angari and Sahakian (2012) and Vapnik (2013) used SVM classifiers with linear and second-order polynomial kernels to evaluate the classification of normal and apneic events using the respiratory signals, thoracic and abdominal, combined with ECG and oxygen saturation signals. The best performance of their implemented algorithm was achieved when features of available respiratory and oxygen saturation data sets were used. In the subject experiment, the polynomial kernel had distinct improvement in the oxygen saturation accuracy as the highest accuracy of 95% was achieved by both the oxygen saturation (Sensitivity: 100%, Specificity: 90.2%) and combined-features (Sensitivity: 91.8%, Specificity: 98.0%). Stepwise feature selection (FSFS), genetic algorithms (GAs), Fisher's linear discriminant (FLD), logistic regression (LR) and SVMs were applied to overnight SpO2 in the classification of OSA diagnosis, GAs + SVM also achieved high generalization with 84.2% accuracy on the validation set and 84.5% accuracy in the test set (Alvarez et al 2013). However, uses of long data sets need long training time which is considered a disadvantage of the SVM. Theoretical and empirically-driven development of new kernel methods which are well suited to the recognition of SAS related events is an open area of ongoing research.
2.2.2.3. Tree based models.
Tree based models have grown more popular in SAS event detection literature for their numerous desirable properties including robustness to noisy signal data, built in feature selection mechanisms, and human interpretability. Tree based methods are similar to linear classification models from a computational learning theory standpoint, except in that the model itself represents an adaptive histogram based classifier instead of a separating linear function or hyperplane. Random forest models incorporate bootstrap resampling statistics to improve the generalizability of single tree classifiers by utilizing an ensemble hypothesis learning approach. Prior work includes using C4.5 decision trees to estimate OSA severity from Nasal cannula flow, thoracic belt movement and blood oxygen saturation (Kaimakamis et al 2009). In another study, decision trees were evaluated against the performance of neural network, auto neural, regression to identify apnea and hypopnea events from single channel ECG (Karandikar et al 2013). Moreover, regression trees or random forests with single channel EEG were used to perform sleep staging (Fraiwan et al 2009, Chapotot and Becq 2010). In the multichannel setting, hierarchical decision trees have been used to invoke rule-based learning methods to perform reliable sleep staging (Liang et al 2012b). Linear discriminant analysis (LDA) and classification and regression trees (CART) models sequentially obtained through AdaBoost (AB) showed high diagnostic performance when determining SAHS and its severity with performance testing results including 86.5% (5 events h−1), 86.5% (10 events h−1), 81.0% (15 events h−1), and 83.3% (30 events h−1) for AHI estimation on an independent test set (Gutiérrez-Tobal et al 2016).
2.2.2.4. Artificial neural networks.
The use of an artificial neural network (ANN) approach is known as a predictive tool for sleep apnea. Artificial neural networks apply the backpropagation training algorithm, typically based on stochastic gradient decent optimization and softmax classification methods, to sequentially transfer nonlinear error gradients through a predefined directed acyclic graphical network based accrued losses on training data. The validity of neural networks in sleep apnea has been investigated since the late 1990s (El-Solh et al 1999). Several other papers since then have reported the use of ANN and variants, including two-stage feedforward networks and neural-fuzzy networks (Flexer et al 2005, Khandoker et al 2009). Studies have demonstrated the diagnostic performance of OSA prediction tools based on an ANN by using the PSG signal as reference (Teferra et al 2014). Multiple linear regression (MLR) and multilayer perceptron (MLP) neural networks were evaluated comparatively to predict the apnea–hypopnea index based on a dataset of 240 SaO2 signals. In this experiment, the MLP algorithm achieved the highest performance with an intraclass correlation coefficient (ICC) of 0.91 (Marcos et al 2012).
Várady et al (2002) presented neural network apnea and hypopnea online detection which is based on the analysis of NAF and/or RIP. This method can serve as a basis of an on-line respiration monitoring system. From the respiratory signal the instantaneous respiration amplitude and interval signals were derived and four feedforward ANNs were investigated. In this article, the signal processing techniques (both time- and frequency-based) were used to extract the feature and quantify respiratory events over each channel. Then, extracted features were grouped into reasoning units. Finally, the reasoning units were evaluated by a fuzzy inference system (FIS) to characterize them as each of three breathing types: apnea, hypopnea, and normal (Álvarez-Estévez and Moret-Bonillo 2009).
2.2.2.5. Fuzzy logic systems and networks.
Zadeh (1965) devised fuzzy logic to mimic decision making process in computing. Fuzzy logic systems are similar to probabilistic estimators in that they both provide scaled mathematical models (from 0 to 1) that quantify important aspects of an algorithmic conclusion; fuzzy logic characterizes the degree of truth and vagueness in measurement scales to express partial or inexact knowledge as a continuous variable versus the probabilistic chance uncertainty as a modeling of observer ignorance to latent factors. The use of fuzzy logic in medical research is now found in many disciplines, such as sleep-disordered breathing. Nazeran et al (2001) and Al-Ashmouny et al (2006) proposed a fuzzy logic-based algorithm to emulate human level decision-making. Their fuzzy inference algorithm used three input variables derived on a breath-by-breath basis from respiratory airflow measurements in order to produce a 'severity index' (SI) quantifying the degree of SAS. Nazeran et al (2001) demonstrated the usage of fuzzy logic to process the normalized area and the standard deviation of consecutive 3 s intervals of baseline adjusted and rectified airflow signal to detect apnea and hypopnea in OSA patient data with an overall correct detection rate of 83% across all patients. Overall, FIS has been shown to improve the decision making process in the epidemiology of sleep disorders. There have been many short term studies showing usage of other classifier algorithms which use multichannel signals for sleep apnea detection which are discussed in the next section. Morillo and Gross (2013) proposed another multivariate system for SAHS detection from the analysis of overnight SpO2 that included sequential forward feature selection and a probabilistic neural network to achieve 92.4% sensitivity and 95.9% specificity. Methods such as these demonstrate potential to be used as an alternative or supplementary method in a domiciliary approach to early diagnosis of SAHS.
2.2.2.6. Deep learning.
Deep learning is an active subfield of machine learning whereby the feature extraction and selection process is incorporated directly in the feature learning process. In the context of SAS event detection, deep learning algorithms can be applied directly to raw signal data on an epoch by epoch basis, and adaptively derived data representations that optimize the statistical differences between non-apnea and apnea epochs. In the signal channel ECG setting, Kaguara et al (2015) employed stacked autoencoders with deep multilayer perceptron classifiers to robustly recognize apnea events, even with the computational and energy constraints of mobile computing. Längkvist et al (2012) trained deep belief nets to perform sleep staging on multichannel neural signals with high accuracy. In this approach, hidden Markov models (HMM) were used as a postprocessing step to accurately capture the transitions between sleep stages probabilistically. Zhang et al (2015) applied sparse deep belief networks to raw multichannel EEG data to provide staging of sleep phases. In another series of studies researchers showed the highly successful application of parallel multi-state HMMs with generative models, such as GMMs or discriminative models such as deep neural networks (DNNs), for describing the posterior probability of HMM states in real time detection of a wide range of acoustic events under high noise conditions (Najafian and Hansen 2016). These approaches are appealing, because they enable practitioners to avoid the expertise and time intensive process of iterative, manual feature extraction.
2.2.2.7. Low dimensionality and total variability based approaches.
Significant training dataset sample sizes are a necessary prerequisite for training an accurate Gaussian mixture model (GMM) or hybrid deep neural network-hidden Markov model (DNN-HMM) based classification system. These algorithms enable data to be fitted using parametric probabilistic distributions that statistically model data as an expression of transition dynamics of the data a Baysian network through unobserved states following a Markov process. Senoussaoui et al (2010) have shown that similar accuracies can be achieved using i-vector based approaches in which the acoustic features are mapped to a lower dimensional total variability space where the necessary information for a target classification task can be found. I-vectors provide a low-dimensional representation of feature vectors that can be successfully used for classification and recognition tasks. Presenting the acoustic events in the low-dimensional total variability space, ensures that for representing a new acoustic feature only a small number of parameters need to be estimated. To achieve this total variability space needs to encapsulate as much as possible of the super vectors in its restricted number of dimensions. Najafian et al (2016) proposed and successfully used this approach for acoustic event and speaker's acoustic characteristic classification. It is interesting to measure their success in sleep apnea detection tasks using corresponding acoustic features where the amount of data is limited and applying deep learning based approaches is not possible.
2.2.2.8. Discussion of signal processing and algorithm techniques.
To sum up, a rich library of methods has been developed and validated in prior work for the automated detection of obstructive and central apneas, hypopneas, sleep stages, among other pathophysiological patterns in polysomnography signals. Table 3 shows a summary of data representations, classification methods, and results from reviewed studies. Contributions have included a collection of signal processing and representational learning methods that seek to expose useful structure in PSG data by exploiting a variety of time, frequency, multiresolution, and other nonlinear transformation techniques. Paired with detection algorithms and adaptive classification models, these elements are combined in modern diagnostic hardware and software systems to enable time savings and benefits to reproducibility in the clinical setting.
Table 3. Summary of data representations, classification methods, and results from empirical studies of the performance of automated approaches to scoring and SAS event recognition.
| Prediction type | Signal modalities | Data representations | Classification methods | Main results | References |
|---|---|---|---|---|---|
| Apnea events | ECG and accelerometer | DWT based features | Decision tree | Classification F1 score 91.4% | Sweeney et al (2013) |
| Apnea events | ECG | Raw signals | Deep neural network with stacked autoencoders | 90% detection accuracy | Kaguara et al (2015) |
| Apnea events | ECG | Statistical time-frequency features | R-wave detection methods including adaptive thresholding and Teager energy operators (TEO) | Significant differences in normal, OSA, and CSA HRV spectral ratios | Kocak et al (2012) |
| Apnea, hypopnea events | ECG | Dynamic coupling based on recurrence quantification | Neural network, autoneural, regression, decision tree and ensemble models | 88.06% detection accuracy | Karandikar et al (2013) |
| Apnea, hypopnea events | ECG | Statistical DTW based features | Two-staged feedforward neural network | Detection accuracy 94.84% for OSA and 76.82% Hypopnea | Khandoker et al (2009) |
| Apnea, hypopnea events | RIP, Oxygen Saturation | Raw signals | Amplitude thresholding and AASM rules | 93.1% detection accuracy | Taha et al (1997) |
| Apnea, hypopnea events | Single-channel airflow record | Square-law, Hilbert-based, and modified envelope detectors | Adaptive thresholding | 82%–95% Cohen's coefficient of agreement | Ciolek et al (2014) |
| Apnea severity | Nasal cannula flow, thoracic belt movement, SpO2 | Largest Lyapunov exponent, detrended fluctuation analysis, and approximate entropy | C4.5 decision Trees | 74.2% accuracy dividing patients into severity groups | Kaimakamis et al (2009) |
| Sleep stages | Single EEG channel | Autoregressive modeling and multiscale entropy | Linear Discriminant Analysis | 88.1% sensitivity, Kappa coefficient 0.81 | Liang et al (2012b) |
| Sleep stages | Single EEG channel | Choi–Williams distribution, CWT, and Hilbert–Huang Transform | Random Forest | 83% detection agreement, Kappa coefficient 0.76 | Fraiwan et al (2009) |
| Sleep stages | Single EEG channel | Reflection coefficients | Gaussian observation hidden Markov Model | 80% approximate detection accuracy | Flexer et al (2005) |
| Sleep stages | Savitzky-Golay filtered Single EEG channel | DWT Based Features | Regression Trees | 75% detection accuracy | Fraiwan et al (2009, 2012) |
| Sleep stages | EEG | Relative spectral band energy, harmonic parameters, and Itakura distance | Autoregressive modeling and neuro-fuzzy classification | — | Estrada et al (2004) |
| Sleep stages | EEG | Bispectral analysis techniques | Second-order AR model | 96% agreement SWS, 95% Agreement REM | Ning and Bronzino (1990) |
| Sleep stages | EEG | Nonlinear higher order spectra | Gaussian mixture model | 88.7% detection accuracy | Acharya (2010) |
| Sleep stages | Multichannel EEG | Sparse and collaborative representations of classical time-frequency features | Extreme learning machine | 81.1% detection accuracy | Shi et al (2015) |
| Sleep stages | Multichannel EEG | Raw signals | Sparse deep belief net | 91.31% detection accuracy | Zhang et al (2015) |
| Sleep stages | EOG and EEG | DWT with Relative Wavelet Energy | ANFIS based neurofuzzy classifier | 97.4% detection accuracy | Garg et al (2011) |
| Sleep stages | EEG (C4 − A1), chin EMG | Shannon entropy, sample entropy | Artificial neural network | 82% detection accuracy for deep and paradoxical sleep | Chapotot and Becq (2010) |
| Sleep Stages | EOG, EMG, EEG | Frequency power spectrum, power ratio, spectral frequency, duration ratio, spindle ratio, SWS ratio | Rule based methods, hierarchical decision tree | 86.68% detection agreement, Kappa coefficient 0.79 | Liang et al (2012a, 2012b) |
| Sleep stages | EEG, EMG, EOG | Raw Signals | Deep belief networks with hidden Markov model | — | Längkvist et al (2012) |
| Sleep stages | EEG, EMG, EOG, and ECG | Linear spectral measures, interdependency measures, and nonlinear measures of complexity, entropy | Quadratic discriminant analysis | 74% detection accuracy | Krakovská and Mezeiová (2011) |
A combination of statistical, information theoretic, signal processing, machine learning, techniques are used to reduce and summarize different representations of multivariate signal data. Common statistical measures alone do not always elucidate discriminative and underlying structures of interest in data, and can be supplemented with techniques including entropy, other complexity measures, factorizations of the original data, among other feature extraction methods to achieve robust and accurate classification performance (Garg et al 2011). Exploratory data analysis of data in different transform domains may be useful and important to the development of new methods. Domain expertise and computational methods may be applied to produce novel features and phenotypes that have an interpretable physiological basis, and may be investigated and validated to improve the understanding of the biological basis for sleep apnea (Fernandez et al 2017).
Examples from prior work of simple classification modules have similarly demonstrated good performance, such as envelop tracking of single channel airflow signals with adaptive thresholding for 93.1% apnea detection accuracy (Ciolek et al 2014). While humans seek to interpret scoring rules such as the AASM or R&K guidelines quantitatively, the ultimate output of the scoring process is based on visual perceptual reasoning and is therefore qualitative in nature and prone to disagreement unrelated to chance. With that, accurate performance has been validated with machine learning methods, such as kernel SVM and random forests, that may adaptively incorporate a degree of high-dimensional data that may be suited to modeling and emulating the human visual pattern recognition process with greater generalizability to noise characteristics, physiologic variability, and expected human disagreement that are inherent to manual analysis of sleep signals (Fraiwan et al 2009, Al-Angari and Sahakian 2012). Methods like these work well for a broad class of general applications, and may be tested during exploratory analysis side-by-side with simple models, like linear regression, to provide a sense of the benefit of more complex, high-dimensional, or adaptive models.
Other research areas show promising potential to advance the field of computational and algorithmic approaches to SAS detection and diagnosis. First, deep learning techniques have been identified as an area of significant potential to increase the efficiency and productivity of the engineering design process, as well as having shown very promising performance and accuracy in preliminary sleep applications (Längkvist et al 2012). However, a significant disadvantage of deep learning is the lack of interpretability in both the features and models, which may consist of nonlinear interactions between hundreds of thousands or hundreds of millions of tunable parameters. Physiological models that better exploit and model the causal structure underling PSG data may inform high performance simple models that are highly interpretable. However, physiological systems are highly dynamic and complex, and therefore may be hypothesized to be well modeled by systems with hundreds of thousands or millions of parameters than to be characterized by simple models such as linear or histogram based learning algorithms. Theoretical advances in the statistical basis for deep learning, nonconvex optimization, and physiological modeling together may allow for a rich class of models that are both highly performant and accurate, as well as and highly interpretable from a clinical and physiological perspective. Moreover, there are several research efforts to validate new and existing methods for automatic SAS event detection. A significant critique of existing validation studies lies in the size of the dataset analyzed, and therefore the statistical power and reproducibility of the described performance. Larger scale validation studies, involving multiple sites, device modalities, and thousands of normative and SAS affected patients would greatly assist in directing the field with generalizable algorithms and computational methods that are safe and effective in clinical practice for a broad class of patients and sleep disorders (Fernandez et al 2016).
3. Current treatment modalities
Due to the complex pathophysiology of sleep apnea, several nonsurgical and nonpharmacological treatments have emerged that have proven quite effective. However, an effective and comfortable treatment option for sleep apnea has yet to be developed. This section discusses the assistive and therapeutic oral devices for sleep apneas.
3.1. Assistive devices
A positive airway pressure (PAP) device usually consists of three major parts: a positive pressure generator; a nasal or oral interface such as a mask; and a tube connecting the two parts. The pressure generator is a fan or turbine which is used to apply external pressure to the patient's upper airway. PAP devices are normally divided into four different types which are summarized in table 5 and discussed shortly along with their major advantages, features and target patients (Levitt 2001, Randerath et al 2001, Ayas et al 2004, Hukins 2004, Essouri et al 2005, Ho and Wong 2006, Philippe et al 2006). Additionally, another recent review discusses engineering advances in the treatment of OSAHS related to optimization of the positive pressure delivered to the patient, methods and systems for continuous self-adjusting pressure during inspiration (IPAP) and expiration phases, and techniques for electrical stimulation of nerves and muscles responsible for the airway patency (Álvarez et al 2015).
3.1.1. Types of PAP device.
The first developed PAP device, CPAP, delivers constant pressure for the whole night, which requires manual titration in the laboratory before use. CPAP is the basic type of PAP machine, invented by Colin Sullivan in 1981 (Sullivan et al 1981), and has been widely accepted as the gold standard for treatment of OSA (Kribbs et al 1993). CPAP is effective at eliminating apneas and hypopneas (Weaver et al 2012, Becker et al 2003). The major problem for CPAP is that over 40% of the patients with OSA are noncompliant with the treatment (Kribbs et al 1993, Weaver and Grunstein 2008). Several components were added to the CPAP device to improve the adherence such as chin straps, mask re-fitting, and humidification for the tube (Engleman and Wild 2003). While effective at treating OSA, CPAP may not suppress CSA, particularly in patients with heart failure (Arzt et al 2007), causing search for alternative treatment options.
The second developed PAP device, bi-level positive airway pressure (BPAP) delivers a higher IPAP and a lower pressure during expiration (EPAP), which decreases the effort for the patients to breathe. BPAP is the pressure-controlled ventilation that allows spontaneous breathing at any time. A flow sensor detects the timing to change from EPAP to IPAP. IPAP and EPAP usually range from 4 to 30 cmH2O (Berry et al 2012b). Other parameters, such as inspiration time, pressure rise time, and flow trigger sensitivity are set by the technician (Zdrojkowski and Estes 2000).
The third PAP device, auto-titrating positive airway pressure (APAP) provides adjustable pressure to maintain airway patency, and gives appropriate response to the respiratory events. Several studies have been hypothesized that adjustable lower pressure with APAP could increase acceptance and adherence with chronic positive pressure treatment (Teschler and Berthon-Jones 1998, Berthon-Jones et al 1996, Berry et al 2002, Berry and Sriram 2014). The data in the literature mostly shows that CPAP and APAP have similar sleep quality. Since the treatment effects are similar between APAP and CPAP, the therapy of choice may depend on other factors such as patient preference, specific reasons for non-compliance and cost (Ip et al 2012). APAP and CPAP devices can adjust and compensate the pressure when leaks occur. However, due to excessive increases in pressure in the case of mask/tube leakage, potential risk may arise, and some patients may be sensitive to the pressure changes and thus feel less comfortable with APAP (Hussain et al 2004, Berry and Sriram 2014).
The final PAP device, adaptive servo ventilation (ASV) provides patients steady, minute ventilation based on the measurement of patient breaths. Although initially used in CSA patients (Hussain et al 2004), a 2015 study SERVE-HF involving 1325 patients showed that while ASV was efficacious in treating CSA, it had no significant effect on a broad spectrum of functional measures including quality-of-life measures, 6 min walk distance, or unplanned hospitalization for worsening heart failure. In contrast to smaller studies and meta-analysis, a significant increase in both cardiovascular mortality and all-cause mortality was observed in the ASV group. A first possible explanation for this trial failure is that CSA is a compensatory mechanism for heart failure. The second hypothesis is that PAP device may impair the cardiac function for some patients (Cowie et al 2015). While theoretically feasible, these hypotheses have no experimental basis, and based on the many adverse effects of CSA on CHF pathophysiology, further research is needed to understand why the SERVE-HF study failed.
3.1.2. Current PAP technology.
In addition to the types of the PAP devices, this section discusses current continuous technological advances that aim to improve the patient's comfort, adherence, and clinical benefits which could be categorized as respiration phase detection, ventilation estimation, CSA distinguishing, humidifiers, expiratory pressure relief (EPR), ramp, and automatic start and finish.
Determining the respiration phase is essential for auto PAP devices to apply future EPR and inspiratory flow limitation. ResMed's devices employ fuzzy logic to separate the whole respiration cycle into nine different phases described in table 4, which is based on the respiration flow rate direction and the volume of flow (Berthon-Jones 2014). Respironics's devices divide the respiration cycle into fixed time segments (64 ms). To estimate the total duration of the respiration cycle, Respironics records and analyzes the history inspiration time and expiration time data (Hill 2004).
Table 4. ResMed's fuzzy logic for phase determination.
| Flow | Rate of change | Fuzzy phase |
|---|---|---|
| Zero | Increasing | Start inspiration |
| Small positive | Increasing slowly | Early inspiration |
| Large positive | Steady | Peak inspiration |
| Small positive | Decreasing slowly | Late inspiration |
| Zero | Decreasing fast | Start expiration |
| Small negative | Decreasing slowly | Early expiration |
| Large negative | Steady | Peak expiration |
| Small negative | Increasing slowly | Late expiration |
| Zero | Steady | Expiratory phase |
To quantify a patient's breath quality, different companies employ different algorithms to estimate ventilation. A weighted peak flow (WPF) method which averages the WPF over a current period of time (Matthews et al 2007, 2012) has a good noise rejection to estimate the ventilation. ResMed measures long term average ventilation (for example, the instantaneous ventilation is averaged within a 100 s interval by a low pass filter). The target ventilation is taken as 95% of the long term average ventilation (Berthon-Jones 2003).
Airway patency detection could distinguish CSA from OSA. Two methods are used to detect airway patency: cardiogenic oscillation testing (Morrell et al 1995) and device-generated pressure oscillation testing (Berthon-Jones 2010). The first method tries to detect the cardiogenic flow, which is the airflow induced in the lungs. It is related to the proximity of the lungs and the heart during sleep. Based on analysis of a large number of clinical cases, some researchers concluded that no cardiogenic oscillation was shown in OSA thus it could be a good indicator of CSA (Ayappa et al 1999, Martin and Oates 2014). Cardiogenic oscillations in the airflow have been observed during some central apneas, but there is controversy over whether they correlate with airway patency (Morrell et al 1995). The presence of cardiogenic oscillations on the current CPAP flow signal is a specific indicator of central apnea and may have a role in self-titrating CPAP algorithms. Some results from the trials are promising, but larger studies are needed to determine the accurate correlation between airway patency and cardiogenic oscillations (Ayappa et al 1999). The second method, applies an oscillatory pressure waveform to a patient's airway. This waveform induces an airflow signal. Figure 5 shows that patients with OSA (airway obstructed) have lower mid-inspiratory flow than CSA patients. This indicator, compared with the pre-set threshold, helps the device to distinguish CSA from OSA (Berthon-Jones 2010).

Figure 5. The high airway resistance of OSA patients causes the mid-inspiratory flow limitation.
Download figure:
Standard image High-resolution imagePatients without airway obstructed (CSA patients or normal people) have higher mid-inspiratory flow.
Several methods have been developed to increase patient comfort on PAP. Humidifiers increase the humidity of inhaled air. They most often are heated, and consist of a water chamber and a heating plate. To get desirable humidification of air, temperature sensors at the heating plate or humidification at the tube are necessary to control the production of water vapor. Higher humidification of inhaled air helps to reduce nasal irritation and congestion (Massie et al 1999). If bedroom temperature is much cooler than the heating temperature, water may condense in the tube or mask, which is called 'rainout'. Insulation of the PAP hose can prevent condensation. Also, a heated hose could also benefit the user's comfort, which could increase humidification and eliminate 'rainout'.
To aid patients' exhalation against CPAP, the EPR feature was introduced. With EPR, when the patient exhales, the flow generator device detects the beginning of exhalation, and then adjusts the motor speed to drop treatment pressure, thus reducing the breathing effort. Generally, EPR is set from 0 to 3 cmH2O and should not drop below 4 cmH2O. Manufacturers have different names for exhalation relief, but they mostly work the same way. ResMed uses EPR for pressure relief. Respironics calls their pressure relief C-Flex, A-Flex, or C-Flex+. Zhu et al (2016) reported the effect of the pressure-relief feature on fixed CPAP and APAP treatment efficacy with a respiratory bench model. They found out pressure-relief features may attenuate CPAP efficacy if not adjusted and calibrated at the beginning of the treatment. On the other hand, the pressure-relief feature may overstate delivered pressures in APAP.
The ramp feature reduces the uncomfortable feeling of sudden air pressure increase. It works by gradually increasing pressure over a defined time range. Commonly this time is around 15–20 min. ResMed's AutoRamp fixes the starting pressure and keeps tracking the state of the patients' sleep. When patients have fallen asleep, the pressure increases gradually until it reaches the preset pressure. It determines the state of sleep by detecting the breath stability or the occurrence of sleep events. Respironics smart ramp increases the speed of ramp if hypopneas or obstructive apneas are detected (Ogden 1997).
Some PAP devices automatically start working when the machine senses airflow from breathing, which indicates that the patient is wearing the mask. If the machine senses very high airflow for a certain period of time (e.g. 1.5 s) this indicates the machine is working incorrectly and will automatically turn off.
Other new technology to mention is SensAwake CPAP modality (reducing pressure on awakenings) which works in conjunction with the Auto CPAP algorithm. SensAwake uses flow to continuously monitor patients' breathing patterns. It senses the change from breathing patterns associated with sleep to those associated with awake states. Once it detects a transition from sleep to awake it promptly reduces that pressure delivered to the patient (Dungan et al 2011).
Table 5 summarizes the benefits and challenges of PAP modalities. In summary, PAP devices are extremely effective when used correctly; however, their major challenge remains the patients' intolerance and nonadherence. Several studies have looked into improving adherence through various forms of additional communication and monitoring systems. Fox et al (2012) found that sending data every night to a web-based database can improve PAP adherence rates. By sending data such as air leaks, applied pressures, and objective adherence, coordinators could reach out to patients to help when necessary. However, other forms of communication were not as successful (Munafo et al 2016). In addition, the use of psychological and behavioral therapies have been shown to have significant effect on CPAP compliance rates. This suggests that possible improvements to increase CPAP compliance rates should consider the psychological aspect of CPAP as well (Somiah et al 2012).
Table 5. Summary of benefits and challenges of PAP modalities.
| Types of PAP device | Benefits | Challenges | Target | Features | Typical models |
|---|---|---|---|---|---|
| CPAP | Less expensive, CPAP Fixed pressure setting does not require monitoring | Relative high pressure, less patient comfort, low compliance | OSA patients | Fixed pressure by manual titration | AirSense 10 CPAP, System One CPAP devices ICON™ + Novo, IntelliPAP® |
| BPAP | Significant and comparable decrease in respiratory effort (Ho and Wong 2006, Levitt 2001) | Ventilation was associated with patient-machine asynchrony; does not offer any significant clinical benefits over CPAP | OSA patients nonresponsive or nontolerant of CPAP | Bi-level pressure by manual titration | System One bi-level devices, IntelliPAP Bilevel S® |
| APAP | Improved sleep architecture, reduced treatment pressure, low pressure leak, less side effects (Randerath et al 2001, Ayas et al 2004, Hukins 2004) | Costly; it has no better ability to eliminate respiratory events or to improve subjective sleepiness | OSA patients and home testing patients | Adjustable pressure | Airsense 10 AutoSet, System One auto devices, ICON™ + Auto, IntelliPAP |
| ASV | Greater benefit for CSA-CSR patients for improved respiratory disturbances, oxygen desaturations, and arousals (Essouri et al 2005, Philippe et al 2006) | Costly, no significant effect on quality-of-life measures, observed significant increase in cardiovascular mortality (Cowie et al 2015) | OSA and respiratory insufficiency patients with central apnea, periodic breathing such as Cheyne-Stokes respiration (CSR), or complex apnea | Pressure support | AutoAdjust® |
3.2. Therapeutic oral devices
3.2.1. Oral appliances.
OAs or intraoral devices (ODs) which aim to treat OSA by physically altering the mandible, tongue, or soft palate during sleep to prevent the collapse of upper airway muscles that is characteristic of OSA (Hoffstein 2007). ODs are growing in popularity, as they are found to be more comfortable than CPAP and have higher adherence rates. However, ODs tend to be a secondary form of treatment for OSA to CPAP as CPAP has a higher efficacy; ODs are recommended when a patient becomes noncompliant to CPAP (Kushida et al 2006). Yet, there is no predictive effectiveness ability for ODs since they have been shown to either help, hinder, or not alter sleep apnea in patients.
There are three types of ODs: soft palate lifters (SPLs), tongue retaining devices (TRDs), and mandibular advancement appliances (MAAs or OA). MAAs are by far the most used ODs today to combat OSA. MAAs operates by holding the mandible in an anterior position to physically open up the airway. When the mandible is kept anteriorly to its normal position, the MAA prevents the mandible from receding into the oropharynx and blocking the airway. TRDs hold the tongue forward in the mouth to prevent it from receding into the airway, while SPLs hold the soft palate in place to prevent collapsing in the airway. With the main airway kept open during sleep, OAs prevent apneic episodes (Hoffstein 2007).
3.2.2. Types of oral devices.
3.2.2.1. Mandibular advancement appliances (MAA).
MAAs have many different designs but are fairly consistent in their effectiveness. MAAs are fixed in the mouth by attaching them to one or two dental arches. They can be molded using dental impressions obtained at the dentist's office or use thermoplastics that can be molded at the clinic. Depending on the MAA, the mouth can be left opened during sleep while other designs keep it closed. Tubes and holes can be used to allow for pressure relief or oral breathing. Some MAAs combine with posterior additions to retain the tongue or hold up the soft palate. All MAAs rotate the mandible downwards and protrude the mandible into an anterior position to create an increase in the upper oropharyngeal airway (Schmidt-Nowara et al 1995).
Material choice and construction can vary across MAAs. They may be made from a custom molding using plaster casts (Marklund et al 2004) or wax interocclusal records. More recently, there have been MAAs that can be customized by using a thermoplastic, removing the need for time-intensive molds to be made. Possible material choices include soft elastomers (Marklund et al 2004), acrylic (Mehta et al 2001), and soft polyethylene (Rose et al 2002) among others. MAAs may be fixed in the oral cavity by hugging the dental arches (Mehta et al 2001) or by being molded to the teeth (Rose et al 2002). Keeping the lower mandible in the proper position has been achieved by using screws (Mehta et al 2001), plastic flanges for biting, and U-shaped springs (Rose et al 2002).
The major concern with using MAAs is determining how far protruded the mandible needs to be, to reduce the AHI to an acceptable level while preventing temporo-mandibular joint pain. Previously, to determine the correct mandible placement, the MAA was set as far forward as tolerable by the patient and then a polysomnography was performed to determine the effectiveness, and repeated until the minimal protrusion was found. Titration protocols have been developed to determine the correct protrusion level, but no common consensus has yet been reached. With current titration protocols call for adjustments to be made over weeks in the clinic or remotely at the patient's home instead of having multiple arousals during the night in a sleep lab, obtaining the proper jaw placement has become more effective. Tsai et al (2004) found an absence of apneas of participants at 64% using this protocol. A newer protocol involves using a remote controlled mandibular positioner to advance the MAA in sub-millimeter steps anteriorly until apneas cease as determined by a sleep clinician using a polysomnography (Remmers et al 2013). This new protocol differs from older ones by starting at posterior position and moving forward versus from the outmost anterior position and moving posteriorly and it is also remote controlled to avoid sleep disturbances while older methods were manual adjustments.
3.2.2.2. Tongue retaining device (TRD).
Tongue retention devices are the second most utilized form of OA, as they can be both a stand-alone appliance or in combination with MAAs. TRDs utilize negative pressure to secure the tongue (Deane et al 2009). The negative pressure can come from either a stand-alone vacuum device that connects to a plastic mouthpiece that provides suction, or a plastic bulb that fits in between the teeth (Hoffstein 2007, Schwab et al 2014). TRDs have lower efficacy rates and compliance rates than their MAA counterparts, making them less common to treat OSA. TRDs can be used in conjunction with MAAs or stand-alone if there are dental issues with using MAAs.
3.2.2.3. Soft palate lifter (SPL).
SPLs presently are rarely used. SPLs are the most uncomfortable OA since they operate on the most posterior region of the mouth, next to the uvula. SPLs are secured by a mouth guard or retainer along the maxilla with a plate or rigid planar extrusion from the posterior side, supporting the soft palate. This device has not been shown to be effective against OSA nor tolerable by patients (Barthlen et al 2000).
3.2.2.4. Oral pressure therapy (OPT).
A newer approach to oral treatment of sleep apnea is by use of OPT. OPT uses a vacuum in the mouth to pull the soft tissues forward and prevent collapse. By using negative pressure in the mouth, the soft palate and tongue are held forward when the muscles would normally relax and allow for airflow to continue through the nose. While this approach still requires an external device, it tends to be quieter than CPAP and is less obstructed by being able to use a small mouth guard versus a mask (Farid-Moayer et al 2013).
3.2.3. Comparison of OA to CPAP.
MMAs have a role as alternative treatment strategies for OSA. Since CPAP has been proven to be the most effective method of treatment for OSA, it is the first-line treatment strategy. If the patient cannot tolerate CPAP due to side-effects, the next course of action may be to use OAs. OAs are used only for mild cases of OSA, as for more severe cases of OSA CPAP is still the better option. Also, OAs are not effective against CSA. When considering using OAs, it is important to establish what is causing the OSA and determine if oral adjustments can possibly treat the cause. Furthermore, dental factors have to be considered when using OAs. If there are issues with any dental structures from teeth to the temporomandibular joint (TMJ), OAs therapy might not be possible, as common side effects of OAs are teeth discomfort and TMJ pain (Epstein et al 2009).
OA have promise as a main treatment for sleep apnea for patients who can't tolerate CPAP. OAs have been shown to greatly reduce or eliminate snoring in almost all patients according to bed partners and patients. The effectiveness of OAs also proves attractive, with relatively high rates in reduction of AHI. The side-effects for both MAAs and TRDs are mild and can be overcome with continued use of the device. Compliance rates for OAs tend to be higher than CPAP, which supports the use of OAs when patients don't comply with CPAP (Schmidt-Nowara et al 1995). Although OA are not as effective as CPAP in reducing sleep apnea, snoring, and improving daytime function, they have a definite role in the treatment of snoring and mild sleep apnea.
3.2.4. Comparisons between intra-oral devices.
3.2.4.1. MAA versus OPT.
OPTs also have a role in treatment of OSA, which can be considered as alternative therapy for sleep apnea. Since MAAs have a high compliance rate and are effective at treating mild OSA making them the first choice for ODs. OPTs can be used as a secondary option if the patient does not tolerate MAAs. OPTs were found to have a 90% compliance rate after three months and had a 53% reduction in AHI over the night in patients with mild-severe OSA. These results suggest that OPT could be used as alternative treatment for a small subset of the sleep apnea population who are nonusers of other forms of ODs or CPAP (Colrain et al 2013). There has been no direct comparison between MAAs and OPTs.
3.2.4.2. MAA versus TRD.
When comparing MAAs to TRDs, it was found that MAAs were favored and performed better than TRDs. After three weeks, MAAs had a compliance rate of 86.4% whereas TRDs of 36.4%. MAA was favored over TRD by 90.9% of patients and eliminated snoring in 40.9% of patients versus 27.3% for TRD. MAAs were also ripped out of the mouth during sleep less often than TRDs, 9% versus 86.4%, respectively (Deane et al 2009).
3.2.5. Compliance/adherence issues of oral devices.
While compliance rates are high for oral devices, the main reason for discontinued use often deals with the perception of the device's effectiveness. Wearers of OAs most frequently use their devices because of complaints from their bed partners about snoring. Since the patients tend to only have a mild form of sleep apnea, they experience few daytime symptoms. This lack of daytime symptoms can lead the patient to not realize they have sleep apnea or that it has been dealt with and they stop usage. With no bed partner to detect snoring, or if they stop noticing it, the patient might stop using their treatment device even if it is comfortable. This can lead to lower compliance rates for sleep apnea patients, even though they are pleased with their devices (Hoffstein 2007).
Compliance rates for OAs have had difficulty in being accurately described due to various reasons for discontinued use. Since OAs are used to treat mild forms of OSA, patients can discontinue use even though they still have sleep apnea because they do not realize it. This leads to variations in studies about how many patients continue compliance with their devices over time as between different studies that use different lengths of follow-up and definition of compliance. For instance, three different studies had a compliance rate of 100% for 3 to 21 months, 75% after 7 months, and 52% after 3 years (Schmidt-Nowara et al 1995). However, a new method to measure compliance uses a small embedded temperature sensor that detects when the device is inside the mouth will allow for more accurate compliance values in future studies (Sutherland et al 2014). CPAP, in contrast, compliance is best measured quantitively by downloading the usage data from the machine itself so there is no need for additional sensors like in OAs (Lal et al 2010, Somiah et al 2012).
Side effects for OD can be common, but are relatively mild and tolerable, especially when compared to CPAP. Possible adverse effects for MAA were found to include jaw discomfort, TMJ pain, dryness of mouth, and slight shifting of the teeth. Similar side effects were also found with TRDs, being dryness of mouth, excess salivation, and soft tissue irritation (Deane et al 2009). For SPL, the side effects were more severe and have led to lower compliance rates. They are: gagging, soft tissue irritation, and choking (Barthlen et al 2000). Table 6 summarizes the comparison of the oral appliances.
Table 6. Comparison of oral appliances.
| Device | Method | Effectiveness | Compliance | Side effects | Comparison against CPAP | Reference |
|---|---|---|---|---|---|---|
| Mandibular advancement appliance | Hold mandible forward to open airway using intraoral appliance | 68.2% | 50–100% | Jaw soreness, mouth dryness | Less effective, higher compliance | Hoffstein (2007), Deane et al (2009) |
| Soft palate lifter | Prevent soft palate collapse into airway | minimal | 25% | Gagging, soft tissue irritation, and choking | Less effective and less compliance | Barthlen et al (2000) |
| Tongue retaining device | Retain tongue to prevent obstruction | 45.4% | 36.4% | Excess salivation, dryness of mouth, soft tissue irritation | Less effective, similar compliance | Deane et al (2009) |
| Oral pressure therapy | Provide suction to hold soft tissue in place | ~50% | 48% | Soft tissue irritation | Less effective, similar compliance | Farid-Moayer et al (2013) |
3.3. Nasal EPAP
Another form of sleep apnea therapy is by the use of nasal expiratory positive airway pressure (NEPAP). In NEPAP, two nasal valves placed on the nostrils provide low resistance during inhalation and high resistance during exhalation. The high resistance causes a positive pressure to build up through the airway to open the soft tissues up (Berry et al 2011). In a randomized control study, at a three month follow up 50% of the NEPAP subjects experienced treatment success (either a 50% reduction in AHI or <10 apneas h−1) while the sham control device had a 22% success rate. The compliance rate among the study participants was 88% as recorded in user diary entries. In a review of NEPAP, two mechanisms were thought to be at play: (1) increased upper airway pressure; (2) increased CO2 concentrations from retained CO2 during exhalation that causes increased respiratory drive, similarly to rebreathing CO2. Reported side effects of NEPAP included dry mouth, headache, trouble falling asleep, and congestion. The review concluded that the efficacy and compliance rates for EPAP were similar to what was found in the Barry study, more studies are needed to draw larger conclusions on the effectiveness of NEPAP (Wu et al 2015).
3.4. Positional Therapy
Positional OSA is a subset of OSA that can be defined by a two-fold increase in AHI while in a supine position versus a non-supine position. Under this definition, about half of all OSA patients have positional OSA. To correct positional OSA, positional therapy (PT) is used. Examples of PT include alarm systems, pillows with straps, a tennis ball technique, and vibrating devices. There lacks long term data, but compliance with PT starts well but decreases over time to sub-optimal rates (>60% rejection after a year). A waistband PT study found that there was a reduction in supine sleeping time and in AHI (~60% effective). Overtime, however, these gains were lost. PT has promise as a primary option for positional OSA patients, but otherwise should be used in conjunction with other therapies until more research can be conducted on long term success
3.5. Inspired CO2
Another potential method for controlling abnormal breathing abnormalities is the use of inspired CO2. Since the early 1980s, several studies have shown that the constant inhalation of CO2 can help prevent apneas (Berssenbrugge et al 1983, Badr et al 1994, Steens et al 1994, Xie et al 1997, Lorenzi-Filho et al 1999). It is believed that breathing in low CO2 concentrations can help prevent periodic reductions in  . By preventing these levels from falling below the apnea threshold, the number of breathing cessations can be reduced. However, handling all the equipment for exogenous CO2 can be cumbersome in a household setting, and the benefits towards sleep quality are still debated (Steens et al 1994, Andreas et al 1998, Szollosi et al 2004). Another method of increasing CO2, is the addition of extra dead space. Dead space is the portion of the airway passages that does not contribute to gas exchange (i.e. trachea and bronchi). It has been shown that the apnoea-hypopnoea index (AHI) can be decreased by the addition of as little as 400–600 ml of dead space (Khayat et al 2003, Xie et al 2001, 2013). Though there are possible adverse effects to the cardiovascular system (Khayat et al 2003, Shokoueinejad et al 2017), CO2 rebreathing has been shown to be highly effective in preventing central apnea and instabilities in sleep caused by hypoxic exposure and CHF, and over many months in CPAP-treated OSA patients with 'residual' central apnea, i.e. so-called 'complex' sleep apnea (Gilmartin et al 2005, Thomas 2005).
Xie et al reported the first experimental study that tested added CO2 alone as a treatment for OSA (Xie et al 2013). When dead space was added in size sufficient to increase  by 1–5 mmHg, over 1–5 h of sleep, they found that AHI was reduced to 15 ± 4% of control and most often to <10 event h−1 in 17 of the 21 patients (see figure 6) (Xie et al 2013). Further, adding smaller amounts of inspired CO2 during the hyperpneic phase of the apnea cycle so that transient hypocapnia was prevented and
  maintained at control levels, caused a smaller reduction in AHI to 31 ± 6% of control in 14 of 26 OSA patients. These data suggest that added CO2 had two types of effects on OSA, depending on the amount of consequent hypercapnia: (1) stabilizing respiratory motor output when transient hypocapnia was prevented, and (2) recruiting upper airway muscle dilators to prevent airway obstruction at mild to moderate elevations in
  . While this study showed added CO2 to be a remarkably effective treatment of even moderately severe OSA, before we can envision clinical application of this treatment, there is a need to consider other unwanted side-effects of hypercapnia.

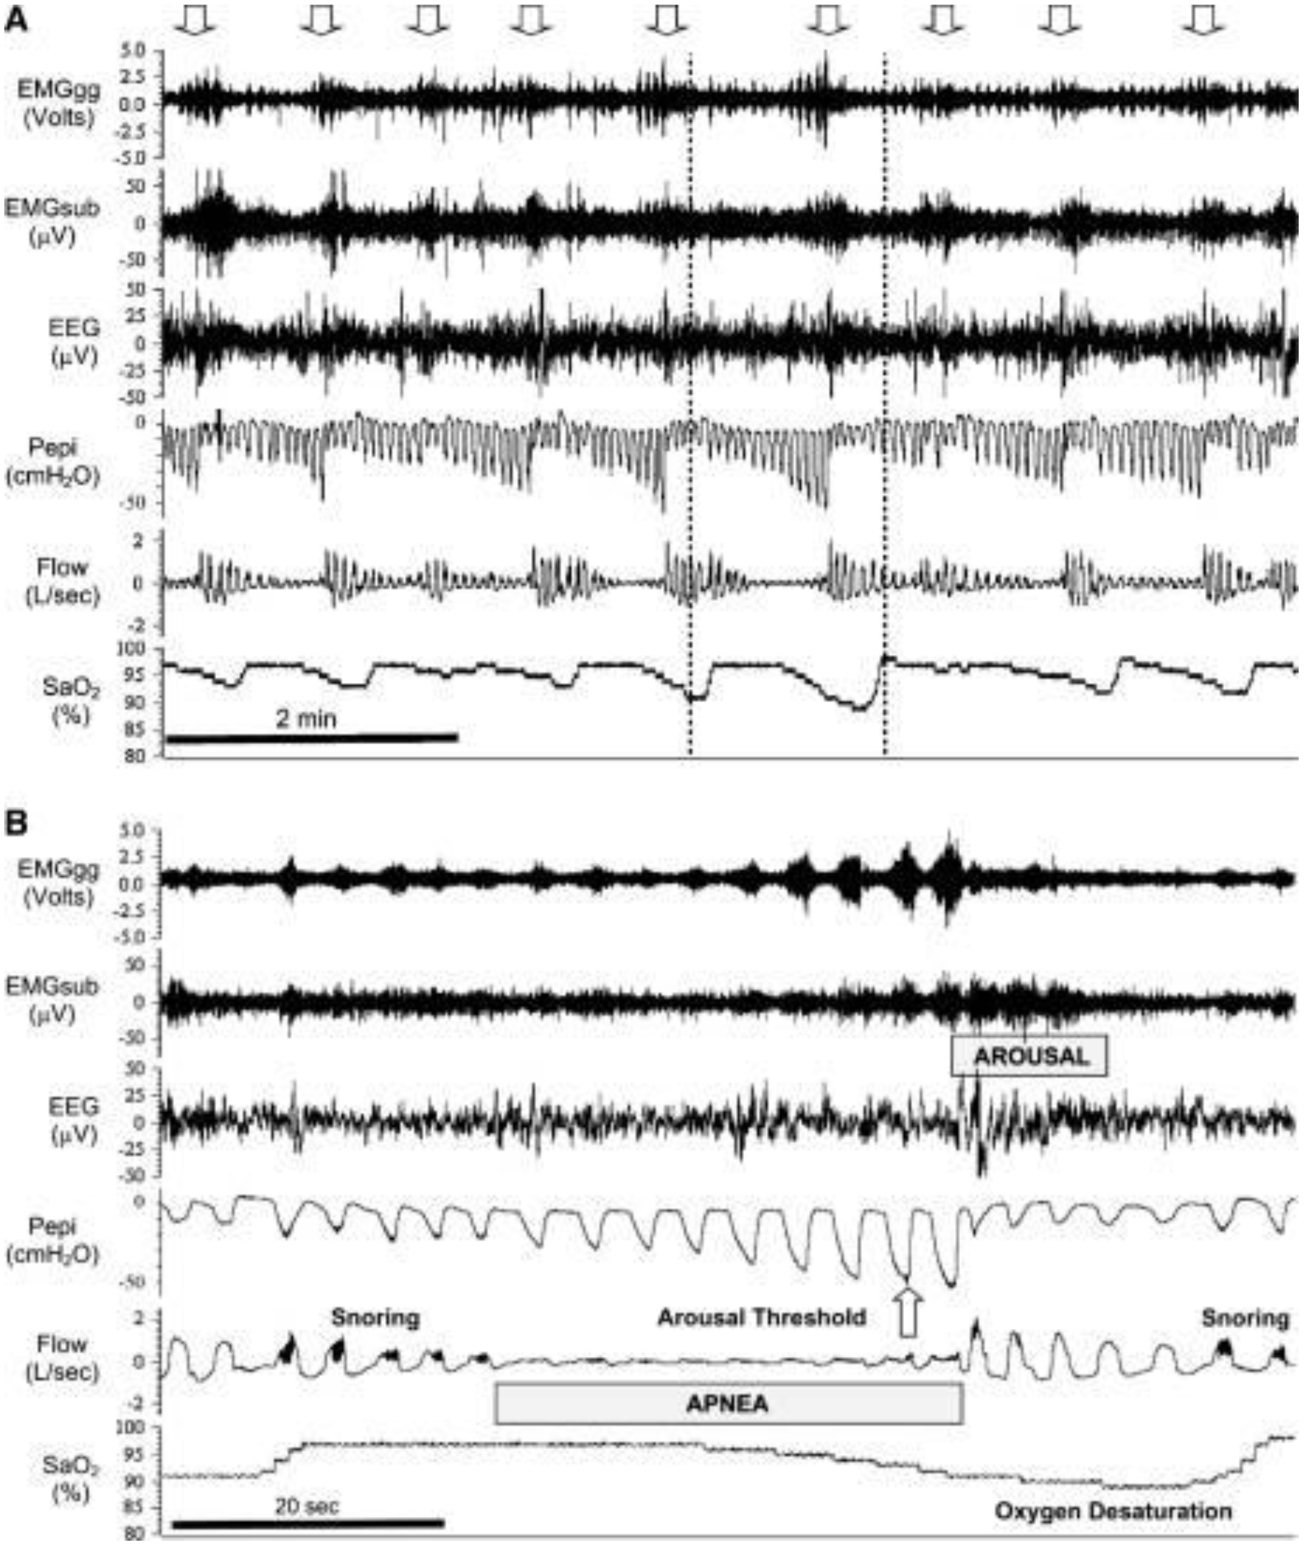
Figure 6. Effect of mild hypercapnia via rebreathing with fixed-volume dead space in a patient with OSA (AHI = 60). Repetitive obstructive apneas with associated transient EEG arousals were noted during air breathing as indicated by the repeated absence of flow despite respiratory efforts. Almost all of these obstructions and arousals were eliminated by raising  an average of 2 mmHg (left arrow) above stable, non-obstructed breathing levels in sleep. Abrupt removal of the added
  (right arrow) resulted in the immediate return of the cyclical obstructive apneas. On the basis of these types of findings, we raised
  2–5 mmHg via dead space rebreathing during 90–120 min of sleep in a group of patients with moderate to severe OSA and observed an average 85% reduction in AHI below air-breathing control in 17 of 21 patients (Xie et al 2013, Dempsey et al 2014). Copyright © 2013 and 2014, The American Physiological Society.
Download figure:
Standard image High-resolution image
Although upper airway collapsibility is a critical component of OSA, it is now well-established that pathophysiologic characteristics such as a sensitive arousal threshold (to elicit ventilatory overshoots), high 'loop gain', i.e. chemosensitivity and plant gain, and/or reduced responsiveness of airway dilator musculature to chemoreceptor stimulation are also commonly present in the majority of OSA patients (Eckert et al 2013, Dempsey et al 2014). In turn, CO2 has been shown to be a major regulator of upper airway caliber during sleep, i.e. when the 'wakefulness' stimulus is removed, as evidenced by the following observations: (1) small transient reductions in  —as experienced with ventilatory overshoots which occur upon recovery from an apnea and/or via transient arousals—of 1–4 mmHg will elicit apneas and ventilatory instability during NREM sleep (Skatrud and Dempsey 1983, Iber et al 1986); (2) adding inspired CO2 sufficient to increase
  1–3 mmHg removes most or all of the hypocapnic induced central apneas and the periodic breathing induced via hypoxic exposure and/or CHF, spinal cord injury, or with idiopathic central apnea (Berssenbrugge et al 1983, Xie et al 1997, Lorenzi-Filho et al 1999, Khayat et al 2003, Sankari et al 2014); and (3) adding inspired CO2 increases both phrenic (linear) and hypoglossal (alinear) motor nerve activity, thereby recruiting both diaphragm and upper airway dilator muscles (Haxhiu et al 1987, Horner et al 2002).
So theoretically, increasing CO2 should stabilize central respiratory motor output, as well as improve upper airway caliber and prevent upper airway obstruction. There have also been several short-term studies where inspired CO2 has been shown to successfully treat CSA (Xie et al 1997, Khayat et al 2003), and even those that also suffer from congestive heart failure (CHF) (Steens et al 1994, Lorenzi-Filho et al 1999, Guntheroth 2011). The CO2 was able to stabilize overall breathing rhythm,  , pH (Khoo et al 1982) as well as general CSA symptoms (Szollosi et al 2004). While there are some very promising studies regarding the use of inspired CO2, there are also several potentially dangerous safety concerns that should be explored in longer term studies before being used as a possible treatment for SA (Mulchrone et al 2016).
3.6. Electrical stimulation of the hypoglossal and phrenic nerves
An alternative to CPAP, custom-made OA, and upper airway surgery, electrical stimulation of the hypoglossal and phrenic nerves has been explored to treat the ineffectiveness of pharyngeal dilator muscles (Malhotra 2014). Recent technological advancements have allowed for the development of an implantable hypoglossal nerve stimulation (HGNS) device, with acceptable performance with regards to patient safety, respiration sensors, lead failures, and stimulation failures (Eastwood et al 2011).
Stimulation of the hypoglossal nerve innervates the GG muscle while minimizing the stimulation of sensory nerves, thus preventing waking the patient (Eastwood et al 2011). Stimulation of the GG muscle leads to increased inspiratory airflow, and activation of the GG muscle is correlated with increased upper airway patency (Schwartz et al 2001). With improved upper airway patency and decreased apneic events, patients are able to go into deeper stages NREM sleep (Schwartz et al 2001).
Patients who undergo HGNS require surgery to implant the electrical stimulator. A stimulation electrode is placed on the hypoglossal nerve, which stimulates tongue-protrusion; sensing leads are used to detect ventilation effort; and a neurostimulator is implanted (Schwartz et al 2001, Strollo et al 2014). Stimulation is delivered just prior to inspiration, when the upper airway is most prone to narrowing and collapse (Eastwood et al 2011).
Several feasibility studies and clinical trials have been conducted on HGNS. Schwartz et al (2001) found that stimulation significantly reduced the mean AHI in patients with an AHI of 52.0 ± 20.4 without stimulation and 22.6 ± 12.1 (P < 0.001) with stimulation during NREM sleep, and AHIs of 48.2 ± 30.5 without stimulation and 16.6 ± 17.1 (P < 0.001) with stimulation during REM sleep. Eastwood et al (2011) demonstrated that HGNS has favorable safety, efficacy, and compliance with reduced OSA severity. Patients in the trial had significantly reduced AHI, with an AHI of 43.1 ± 17.5 without stimulation and an AHI of 19.5 ± 16.7 (P < 0.05) with stimulation throughout the night. Strollo et al (2014) observed a 68% decrease in median AHI from baseline measurements of 29.3 events h−1 to 9.0 events h−1 measured 12 months after implantation. The studies have shown strong efficacy of HGNS with minimal complications.
The cost effectiveness of HGNS should be considered. However, the cost of surgical implantation for HGNS may be especially valuable if it can help avoid the consequences of sleep apnea such as stroke and motor vehicle accidents (Malhotra 2014). Also, patient selection for the procedure needs to be refined by analyzing airflow signals and other biomarkers to ensure that the patients suffer from pharyngeal muscle dysfunction and could benefit from HGNS (Malhotra 2014). However, the studies conducted on HGNS show promise for HGNS as an alternative treatment for patients who do not respond well to CPAP.
Stimulation of the phrenic nerve has also been explored as a method to treat sleep apnea, by stimulating the diaphragm to restore a normal, physiological breathing pattern during sleep (Abraham et al 2015). Stimulation of the phrenic nerve has been used as treatment for diaphragmatic paralysis from cervical spine injuries for over 50 years (Joseph and Costanzo 2016). Phrenic nerve stimulation systems are similar to hypoglossal nerve stimulation systems, consisting of a pulse generator, stimulation lead, and sensing lead (Abraham et al 2015). The phrenic nerve stimulators stimulate the phrenic nerve if it is within normal sleeping hours, the patient activity is low, the patient is in sleeping posture, and the patient should be in the inspiratory phase of respiration.
Initial studies of phrenic nerve stimulation have shown improvements of AHI. Abraham et al (2015) found a reduction in AHI from 49.5 ± 14.6 for baseline measurements to 22.4 ± 13.6 three months after implantation (P < 0.0001). However, 26% of patients in this study had serious adverse effects related to the device or procedure, including hematoma, migraine, and atypical chest discomfort. However, this rate of adverse health effects is similar to other newly introduced cardiac devices at the stage of early development.
While still in development and trials, phrenic nerve stimulation has shown promise as an alternative to CPAP, possibly leading to improved patient compliance (Joseph and Costanzo 2016).
4. Discussion and conclusions
In summary, tremendous research and engineering efforts have been applied to design and optimize tools that enable the study and understanding of physiological substrates that characterize sleep apnea syndrome. These efforts have contributed to the advent of a broad class of signal and sensor modalities that can be administered clinically, individually or in combination, to provide reliable measures for SAS diagnosis. With this, an extensive collection of computational and signal processing methods has been proposed and evaluated to automate the identification of SAS disease patterns. Once diagnosed, patients benefit from a growing array of therapeutic techniques and technologies that continue to evolve with ongoing research and development.
Despite this significant progress in our understanding of SAS, as well as development and refinement of diagnostic and therapeutic tools, the epidemiological problem of sleep apnea and its impact on population health, productivity and healthcare costs continues to grow. It is estimated that between 18 and 22 million Americans suffer from SAS, 80–90% of adults suffering from SAS remain undiagnosed and untreated, and costs of untreated SAS may double a patient's medical expenses mainly due to increased CVD risk and mortality (Tarasiuk and Reuveni 2013). Motivated by the scale of this growing problem, significant remaining research challenges must be addressed to reach the unaddressed SAS population and ensure access to efficient and effective care. This review concludes with a discussion of open research and engineering challenges for signal, sensor, and computational approaches to SAS detection, as well as the development of new therapeutic methods.
First, there is a significant opportunity to improve the detection and understanding of SAS phenotypes through research on new and improved diagnostic signal and sensor modalities. Complex patients suffering from a combination of SAS along with comorbid neurological and cardiopulmonary conditions indeed require a Type 1 supervised nocturnal polysomnography study. For these patients, attended in-lab PSG remains the gold standard for diagnosis because the controlled environment allows for expert application and monitoring of biosensors, acquisition of a larger quantity and variety of signals, and helps to ensure high quality and fidelity of diagnostic data. However, with 26% of persons age 30–70 estimated to suffer from sleep apnea, these complex cases represent a significant minority of the total affected population (Peppard et al 2013). At-home sleep studies decouple the acquisition of diagnostic SAS data from the equipment, personnel, and capacity constraints of physical sleep labs, offering a faster and lower cost pathway for the majority of patients. Nonetheless, Type 1 in-lab sleep studies account for the vast majority of diagnostic tests for patients of all suspected severity levels conducted each year. Therefore, research that aims to improve signal and sensor technology for at-home sleep studies, such that it more closely reproduces the quality, quantity, and comprehensive variety of controlled in-lab sleep studies is paramount. We hypothesize that acceptance of at-home sleep studies can be improved among clinicians, while allowing for more convenient and inexpensive testing options for patients. Moreover, increasingly noninvasive and noncontact sensor modalities promise the potential for ongoing at-home monitoring of SAS patterns and sleep quality, to inform preventive care and treatment optimization.
Second, research focused on computational and signal processing methods for SAS pattern identification offers potential to introduce significant efficiencies into the clinical diagnostic workflow. The scoring of sleep studies represents a critical step in the SAS diagnostic process, whereby the collection of relevant disease patterns is reduced to clinically relevant diagnostic parameters including AHI, RDI, and others. Today, an estimated 86% of sleep centers don't use any form of either computer assisted or automated scoring, despite the availability of clinically validated commercial systems. A common hypothesis for the slow clinical acceptance of these systems is the complex, repetitive, and genuinely ambiguous nature of the event scoring task, where, for example, even expert scorers on average agree 52.4% on CSAs and 65.4% on Hypopneas (Rosenberg and Van Hout 2014). With these factors in mind, additional research is needed to create automated scoring methods, algorithms, and software that can overcome the barriers to clinical acceptance with improved sensitivity and specificity towards the expert human standard. To advance this research, open data formats and interoperability standards will be required to enable both retrospective and prospective evaluations of new computational, signal processing, and algorithmic methods.
Finally, development of new treatment techniques and deeper investigations into the alterations in physiological mechanisms are needed. It is well understood that patient compliance with PAP devices is very low, with over 40% of patients with OSA being non-adherent to CPAP, and many patients regularly adherent for a small fraction of their TST (Weaver and Grunstein 2008). OA have shown significant benefits in this regard for mild OSA sufferers, but do not offer the same efficacy as PAP for moderate to severe OSA, CSA, or complex comorbid patients. Moreover, the recent SERVE-HF study indicated not only that ASV therapy did not significantly improve many quality of life indicators, but resulted in an observed increase in cardiovascular and all-cause mortality in CSA patients (Cowie et al 2015). It is clear that new alternative devices that are more comfortable, tolerable, and better accepted by patients are needed to truly achieve an improved sleep quality. For CSA and complex comorbid patients in particular, more research and greater knowledge of disease alterations to sleep physiology are needed, to understand which, if any, of the expressed physiological symptoms may in fact be beneficially acquired compensatory mechanisms that present as seemingly pathological, but assist in patient homeostasis and systemic preservation through nonobvious pathways. These and other alternative and improved therapies are critical to effectively treat the growing SAS population.
In conclusion, sleep apnea is a significant and rapidly growing problem at the societal scale, for which tremendous scientific and engineering effort has been applied to understand and develop diagnostic and therapeutic tools. This work has led to an array of validated signal and sensor modalities for acquiring, storing and viewing sleep data, a broad class of computational and signal processing approaches to detect and classify SAS disease patterns, and a set of distinctive therapeutic technologies whose use cases span the continuum of disease severity. This review provides a current perspective of the classes of tools at hand, along with a sense of their relative strengths and areas for further improvement. These engineering contributions have defined our understanding of sleep science and pathology, and cannot be understated. However, diagnosing and treating the large and growing unaddressed SAS population remains a paramount challenge. Future work in improved at-home signal acquisition systems, new noninvasive and noncontact sensor modalities, sensitive and specific computational approaches to automate sleep scoring, and open interoperable sleep data formats show significant promise to increase the efficiency and accuracy of SAS diagnosis. These, paired with research into comfortable therapeutics that improve adherence, and safer, better understood treatment alternatives for severe and complex comorbid patients, will enable a transformative difference in sleep, quality of life, productivity, and reduce healthcare costs for tens of millions of patients, globally.