
Abstract
Objective: Over the last 15 years, developments in camera technology have coincided with increased availability and affordability. This has led to an increasing interest in using these technologies in healthcare settings. Image-based monitoring methods potentially allow multiple vital signs to be measured concurrently using a non-contact sensor. We have undertaken a systematic review of the current availability and performance of these monitoring methods. Approach: A multiple database search was conducted using MEDLINE, Embase, CINAHL, Cochrane Library, OpenGrey, IEEE Xplore Library and ACM Digital Library to July 2018. We included studies comparing image-based heart rate, respiratory rate, oxygen saturation and blood pressure monitoring methods against one or more validated reference device(s). Each included study was assessed using the modified GRRAS criteria for reporting bias. Main results: Of 30 279 identified studies, 161 were included in the final analysis. Twenty studies (20/161, 12%) were carried out on patients in clinical settings, while the remainder were conducted in academic settings using healthy volunteer populations. The 18–40 age group was best represented across the identified studies. One hundred and twenty studies (120/161, 75%) estimated heart rate, followed by 62 studies (62/161, 39%) estimating respiratory rate. Fewer studies focused on oxygen saturation (11/161, 7%) or blood pressure (6/161, 4%) estimation. Fifty-one heart rate studies (51/120, 43%) and 24 respiratory rate studies (24/62, 39%) used Bland–Altman analysis to report their results. Of the heart rate studies, 28 studies (28/51, 55%) showed agreement within industry standards of  5 beats per minute. Only two studies achieved this within clinical settings. Of the respiratory rate studies, 13 studies (13/24, 54%) showed agreement within industry standards of
  3 breaths per minute, but only one study achieved this in a clinical setting. Statistical analysis was heterogeneous across studies with frequent inappropriate use of correlation. The majority of studies (99/161, 61%) monitored subjects for under 5 min. Three studies (3/161, 2%) monitored subjects for over 60 min, all of which were conducted in hospital settings. Significance: Heart rate and respiratory rate monitoring using video images is currently possible and performs within clinically acceptable limits under experimental conditions. Camera-derived estimates were less accurate in the proportion of studies conducted in clinical settings. We would encourage thorough reporting of the population studied, details of clinically relevant aspects of methodology, and the use of appropriate statistical methods in future studies.
Systematic review registration: PROSPERO CRD42016029167
Protocol: https://systematicreviewsjournal.biomedcentral.com/articles/10.1186/s13643-017-0615-3
Export citation and abstract BibTeX RIS

Original content from this work may be used under the terms of the Creative Commons Attribution 3.0 licence. Any further distribution of this work must maintain attribution to the author(s) and the title of the work, journal citation and DOI.
1. Introduction
Clinical decision making relies on accurate measurement or estimation of vital signs. The term vital signs typically refers to measurements including heart rate (HR), respiratory rate (RR), blood pressure (BP), arterial oxygen saturation (SpO2) and temperature.
Commonly used methods of vital signs monitoring including electrocardiograph (ECG), pulse oximeter, and sphygmomanometer are widely established and are easily available, quick to use, and non-invasive. In primary and most secondary care settings, these methods provide adequate information. However, there are clinical areas such as critical care and operating theatres where patients may be more unstable and physiological changes can occur rapidly. In these settings, it is important that any changes from baseline are brought to attention immediately and a continuous monitor is more suitable. For example, invasive arterial catheters are frequently used for continuous beat-to-beat estimation of BP in patients requiring vasopressor therapy.
There has been a growing interest over the last 15 years in health monitoring using cameras. An image-based monitor can avoid the complications associated with contact monitors such as tethering, skin irritation, and loss of contact. Furthermore, simultaneous data collection from multiple regions allow estimation of more than one vital sign by a single monitor. A broader receiving system which can use spatial information from multiple anatomical sites (e.g. face and arm) may allow mapping of physiological parameters and reveal insights that would be difficult to appreciate from a single point analysis. These factors are particularly relevant with the development of telemedicine and growing interest in remote monitoring of patients.
Some aspects of this type of monitoring have been reviewed in the literature. Sun and Thakor (2016) discussed the use of image-based photoplethysmography (PPG) and its technical challenges. Kranjec et al (2014) reviewed non-contact HR estimation using image and non-image based techniques. However, no systematic search of the literature has been performed in this field.
We aim to review non-contact, non-invasive image-based vital signs monitoring in both healthcare and pre-clinical academic settings. To our knowledge, this is the first systematic review of the evidence for this type of monitoring. The review will provide a basis for further research using similar technology in a rapidly evolving field.
2. Methods/design
2.1. Protocol and registration
We have developed this systematic review in accordance with the Preferred Reporting Items for Systematic Reviews and Meta-Analyses (PRISMA) guideline (Moher et al 2009). The PRISMA checklist is available as supplementary material (stacks.iop.org/PM/40/06TR01/mmedia). We registered this systematic review with PROSPERO (CRD42016029167) and published the protocol (Harford et al 2017).
2.2. Eligibility criteria
We included all study types looking at monitoring of HR, BP, RR or SpO2 using image analysis with comparison to a reference device. We did not restrict based on clinical setting and included all age groups. Only non-contact methods using cameras were included. All unpublished studies found were included wherever possible to minimize publication bias.
2.3. Data sources
We performed searches in Medline, Embase, CINAHL, Cochrane Library, OpenGrey, Institute of Electrical and Electronics Engineers (IEEE) Xplore Digital Library, and Associations for Computing Machinery (ACM) Digital library. We performed a smartphone application search and primary original research data leading to application development were sought. The details of search strategy used is included in the supplementary file, table 1. The final search was completed on 31st July 2018.
2.4. Outcomes
Our primary aim was to describe the current availability and performance of image-based vital signs monitoring methods compared to recognized reference methodologies. The secondary aims were: to assess the quality of the methodology reporting with respect to Guidelines for Reporting Reliability and Agreement Studies (GRRAS) (Kottner et al 2011), practical elements of the new method proposed, advantages and disadvantages, complications, main interference, and ease of monitoring in different populations.
2.5. Study selection and data extraction
We used a four-stage review process to select final articles for inclusion as stated in the protocol. We consolidated all identified references to a reference manager software (Endnote 7.0, Thomson Reuters, www.endnote.com) for duplication removal. Two researchers (MH and JC) performed the title, abstract, and full-text screening independently. A third researcher (PW or DY) was consulted on any discrepancy not resolved by discussion. Two researchers (MH and JC) extracted data from included studies using a piloted extraction form using Distiller Systematic Review software (Evidence Partners, Ottawa, Ontario). We extracted the type and date of publication, funding source, conflict of interest, study type, vital sign(s) of interest, setting, the number of participants, population and cohort data, eligibility criteria, image technology used, reference method(s), distance from camera to skin region of interest, body part imaged, frames per second, simulated physiological changes, duration of recording per subject, performance of new technology compared to reference method, limitations reported, and data to allow assessment of reporting quality according to GRRAS guidelines. For the purpose of constructing the final results table, we extracted the average number of minutes of image data collected per subject. This averaging was performed to allow the reader to estimate the total amount of data per study by multiplication of the duration and the number of subjects. For studies conducted in non-clinical settings, any methods used to simulate the clinical environment or vary the vital signs to clinically relevant abnormal ranges were extracted.
2.6. Assessment of study quality
Two reviewers (MH and JC) performed the quality assessment and agreed on the final score. A third reviewer (PW or DY) was consulted on any discrepancy not resolved by discussion. We assessed the study quality using a modified GRRAS reporting tool (supplementary file, table 2). As the technology is still in relative infancy, we expected many of the studies to be pilot studies done in healthy volunteer populations. Therefore, we felt an analysis of intra-study bias was not appropriate at this stage. Instead, we chose to assess the reporting quality among these early-phase studies with the aim of improving the transparency and reliability of future publications in this expanding field. During pilot extraction form assessment, we noted that several aspects assessed by the modified GRRAS assessment tool were reported consistently while others were not. Based on this, we chose to focus study quality assessment on the following aspects which were deemed important but not consistently reported: states the determined number of subjects and describes the population studied; describes the measurement process; and reports estimates of reliability/agreement including measures of statistical uncertainty using valid statistical methods.
The description of population and the measurement process were given a composite score out of 3. One point was given for stating the number of subjects along with the age range/gender of the participants, one point for reporting skin colour or ethnicity, and one for stating the frame rate used and the distance between camera and the skin region of interest.
An assessment of the appropriateness of statistical methods used was included as an assessment of study quality. As most studies were analyzing agreement between reference and index methods, we deemed it most appropriate to use Bland–Altman plots (Bland and Altman 1986). We assessed the quality of statistical analysis using the classification of statistical methods in the protocol (supplementary file, table 3) and awarded each study a score out of 3. Gold standard methods were defined as Bland–Altman plot/limits of agreement analysis, intraclass correlation coefficient, Lin's concordance correlation coefficient, and British standards reprodu-cibility/repeatability coefficient. Studies meeting the gold standard were scored 3, studies using the gold standard method but did not account for repeat measurements per subject (Bland and Altman 2007) were scored 2, studies using other acceptable statistical methods or a mixture of gold standard and inappropriate methods were scored 1, and all others using inappropriate statistical methods only were scored 0.
We gave an overall study reporting quality rating based on the aggregate number of points for each study, with a maximal score of 6. We rated studies with scores of 5 or 6 'Good', those with scores of 3 or 4 'Fair', and those with scores of 2 or less 'Weak'. Identified studies in abstract format only (<250 words) were included for the purpose of comparing results but were not rated for reporting quality.
2.7. Heterogeneity
We did not undertake a formal quantitative analysis. As the study designs, results and outcome reports were heterogeneous, any single summary statistic would be incomplete and misleading. Instead, we compared similar numerical reports and aimed to provide a narrative summary.
2.8. Missing data
We contacted authors via electronic mail regarding missing data.
2.9. Subgroup analysis
As quantitative analysis was deemed inappropriate for our study data, further numerical subgroup analysis was not undertaken. We aimed to group studies according to the vital signs of interest and population of interest for a narrative summary.
2.10. Amendment to protocol
A search of the literature with respect to measurement of blood pressure found that no image-based methods were used for a direct measurement of blood pressure. This is understandable as a direct estimate of pressures within vessels cannot be made using non-contact or non-invasive methods. Instead, the literature search identified papers which compared surrogate measures of blood pressure (e.g. pulse transit time) against reference device measurements of blood pressure. We included studies where the surrogate measures of blood pressure were compared to acceptable reference device measurements of blood pressure.
3. Results
3.1. Search results
Our search identified 30 279 titles after duplicate removal. A further 52 titles were identified for full text screening from the references list of studies that underwent full text screen. The PRISMA flow diagram of search results is shown in figure 1. One hundred and sixty-one studies were included in the final review. One hundred and twenty-six studies (126/161, 78%) focused on one vital sign, and the remainder aimed to extract two or more vital signs. Four pairs of papers identified were based on the same clinical data set or subset, but reporting different vital sign results or separate analysis (indicated in supplementary file, table 4, column 14). These were included as independent studies.

Figure 1. PRISMA flow diagram.
Download figure:
Standard image High-resolution imageThere were two papers we were unable to retrieve (Wang and Han 2014) and Zhao et al (2012) due to no electronic or paper records. We attempted to contact the authors but no responses were received.
3.2. Population studied
3.2.1. Size of trials
Most studies had a small sample size with 76% (123/161) of studies having 20 or fewer subjects (figure 2(a)). This did not reflect the size of the data set acquired as multiple measurements were taken from individuals sometimes under different conditions or on separate occasions. The multiple data points taken from individuals were often not taken into account in the subsequent statistical analysis.
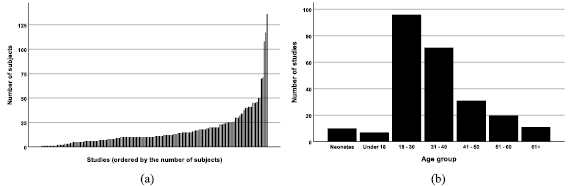
Figure 2. Demographics represented in the systematic review: (a) Distribution of the size of the studies, (b) The age groups represented across the studies.
Download figure:
Standard image High-resolution image3.2.2. Age and gender
The majority of papers reported the age (111/161, 69%) and gender (110/161, 68%) of the study participants. The exact age distribution among the studies was often difficult to identify as they were reported as a range. Instead, we assigned each study into age group bin(s) to show which age groups were represented. The 18–30 and 31–40 age groups were best represented across all studies (figure 2(b)). Across all studies where subject gender was reported the population was predominantly male (1248, 62%).
3.2.3. Ethnicity and skin colour
Fifty-seven (57/161, 35%) of the included studies reported the skin colour or ethnicity of the study participants. Of these, 35 studies (35/57, 61%) included more than one skin colour or ethnicity in their study while 22 studies (22/57, 39%) reported no variation. The Fitzpatrick scale remains the most commonly used tool for skin colour coding, used by nine studies (9/57, 16%).
3.2.4. Settings and population
The locations of the included studies are shown in figure 3. The vast majority of studies found were healthy volunteer studies conducted in academic settings (141/161, 88%). One study (Davila et al 2017) recruited within academic settings, but had a subset of subjects with health conditions (3/20, 15%). The subjects were included in the study but not included in the data analysis. Therefore, for the purpose of this review, it was classified as a healthy volunteer study. We identified 12 studies conducted in neonatal critical care unit (Abbas et al 2011, Scalise et al 2012, Aarts et al 2013, Blanik et al 2014a, Klaessens et al 2014, Mestha et al 2014, Villarroel et al 2014, Cenci et al 2015, Janssen et al 2016, van Gastel et al 2016, Jorge et al 2017, Antognoli et al 2018), 1 in paediatric critical care unit (Bal 2015), 2 studies in adult critical care unit (Rasche et al 2016, Wedekind et al 2017), and 6 other studies conducted in non-critical in-hospital settings (Goldman 2012, Tarassenko et al 2014, Maclaren et al 2015, Secerbegovic et al 2016, Coppetti et al 2017, Trumpp et al 2018).
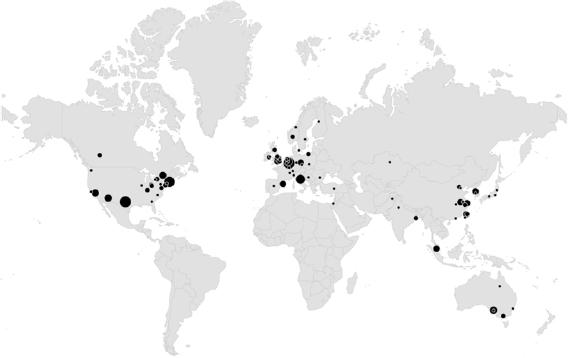
Figure 3. Locations of studies included in systematic review. The size of the circle displays the number of studies by the same group.
Download figure:
Standard image High-resolution image3.3. Study designs
3.3.1. Vital signs of interest
One hundred and twenty studies (120/161, 75%) compared camera-derived measurements of HR to reference device(s). Sixty-two studies (62/161, 39%) compared camera-derived RR to reference device(s). We found relatively few studies looking at SpO2 (11/161, 7%) and BP surrogates (6/161, 4%). There was a significant overlap between these with 31 studies (31/161, 19%) measuring both HR and RR in the same set of data.
3.3.2. Reference device used
The most common reference device used depended on the vital sign of interest. The most commonly used reference devices were ECG and peripheral PPG (supplementary file, table 4, column 4). PPG monitoring has the advantage of being able to estimate both HR and RR concurrently. There is an increasing trend of using commercially available chest strap monitors (e.g. respiratory belt transducers used by Al-Naji et al (2017b) or Polar belt monitors (Capdevila et al 2012, Cheatham et al 2015)). Fifty-seven studies (57/161, 35%) used a chest strap monitor, the majority of which (47/57, 82%) were published after 2013.
3.3.3. Distance measurement
Thirty-two studies (32/161, 20%) did not report the distance between the camera(s) and the region of interest (supplementary file, table 4, column 20). We obtained nine further results by contacting the authors. Most studies focused on near patient monitoring with skin to camera distance between 0.5 and 2.5 m. Eighty studies (80/161, 50%) reported on cameras under 1 m away. A longer distance of between 1 and 2.5 m was used in 75 studies (75/161, 47%). Six studies (6/161, 4%) reported camera performance from distance over 2.5 m (McDuff et al 2014a, van Gastel et al 2015, Blackford et al 2016, Al-Naji et al 2017a, 2017b, Davila et al 2017), with the longest distance monitoring being 50 m away from subjects (Al-Naji et al 2017b).
3.3.4. Body region of interest
Different regions of skin including face, neck, upper limb and thorax have been used for clinical monitoring (supplementary file, table 4, column 21). Most studies (113/161, 70%) focus on information from skin of the face and neck. HR monitoring was achievable using distance PPG from the face and neck, limbs, and chest. RR studies using visible spectrum cameras use oscillatory chest wall movement (Tan et al 2010, Iles 2012, Bartula et al 2013, Loblaw et al 2013, Benetazzo et al 2014, Cenci et al 2015, Al-Naji and Chahl 2016, Janssen et al 2016, Nam et al 2016, Jorge et al 2017, Reyes et al 2017), whereas those that use infrared spectrum cameras also utilise temperature variation in the nasal area (Murthy et al 2004, Fei et al 2005, Zhu et al 2005, Fei and Pavlidis 2010, Abbas et al 2011, Lewis et al 2011, Goldman 2012, Loblaw et al 2013, Klaessens et al 2014, Li et al 2014, Bennett et al 2015, Elphick et al 2015, Pereira et al 2015b, van Gastel et al 2016, Hu et al 2017, Jeong et al 2017, Kwasniewska et al 2017, Pereira et al 2017, Mutlu et al 2018). BP studies mainly use measurements between two sites for pulse transit time calculations, e.g. face/neck and distal upper limb (Jensen 2014, Murakami et al 2015, Sugita et al 2015, Jeong and Finkelstein 2016, Secerbegovic et al 2016).
3.3.5. Duration of camera recording
The duration of monitoring per subject for the included studies is included in the supplementary file (table 4, column 23). Twenty-one studies (21/161, 13%) monitored subjects for under 1 minute on average, and 99 studies (99/161, 61%) for under 5 min. Three studies in hospital settings monitored patients for over 60 min (Villarroel et al 2014, Tarassenko et al 2014, Jorge et al 2017).
3.4. Cameras/technology
Multichannel cameras recording in the visible spectrum were the most frequently used with 133 studies (133/161, 83%) using visible spectrum cameras with or without another modality camera (supplementary file, table 4, columns 5–8). Twenty-two studies (22/161, 14%) used cameras monitoring in the near-infrared (NIR) spectrum, six studies (6/161, 4%) in the medium wavelength infrared spectrum (MWIR), and 24 studies (24/161, 15%) used cameras in the long wavelength infrared (LWIR) spectrum. There was a considerable overlap between these with visible and NIR spectrum being measured with one or more cameras in 17 studies (17/161, 11%) and visible and LWIR spectrum being measured by two cameras in six studies (6/161, 4%).
HR monitoring predominantly used multichannel cameras in visible spectrum with 96 studies (96/120, 80%) using visible spectrum cameras only. Fifteen studies (15/120, 13%) used NIR cameras with or without also measuring in the visible spectrum. Ten studies (10/120, 8%) used LWIR cameras, with seven using LWIR cameras only. RR monitoring was performed by the most variety of cameras with 12 studies (12/62, 19%) using NIR cameras, five studies (5/62, 8%) using MWIR cameras and 20 studies (20/62, 32%) using LWIR cameras. Twenty-six RR studies (26/62, 42%) used visible spectrum cameras only. Of the 11 SpO2 studies, four studies (4/11, 36%) used a combination of visible and NIR spectrum measurements similar to a pulse oximeter, six studies (6/11, 55%) used visible spectrum cameras only (measuring multiple wavelengths within this spectrum), and one study used two wavelengths within NIR spectrum with a single NIR monochromatic camera (Humphreys et al 2007). All 6 BP studies used visible spectrum cameras.
3.4.1. Frame rates for different modalities
Frame rates used by studies was consistently reported (149/161, 93%, supplementary file, table 4, column 22). One hundred and thirteen studies (113/161, 70%) used a frame rate of 30 or less per second. Lower frame rates were used in a larger proportion of RR and SpO2 studies rather than HR or BP. Of the 14 papers using less than 15 frames per second, nine studies monitored RR and three studies monitored SpO2. Highest frame rates were used for studies monitoring BP (140 per second by Sugita et al (2015) and 420 per second by Jeong and Finkelstein (2016)).
3.4.2. Camera specification
The full details of cameras used in the included studies including the resolution can be found in the supplementary file, table 4, columns 5–9. Variable grades of cameras were used by the studies. Twenty-eight studies (28/161, 17%) used inexpensive webcams, 25 studies (25/161, 16%) used smartphone or tablet cameras, and 43 studies (43/161, 27%) used commercial cameras or video recorders. Image resolution used was reported by 131 studies (131/161, 81%). Of the studies where the resolution used in the study was reported, 97 studies (97/131, 74%) used resolution under 1 megapixels and 119 studies (119/131, 92%) used resolution under 3 megapixels.
3.4.3. Use of multiple cameras
Thirty studies (30/161, 19%) used more than one camera in their study design.
Fifteen studies (15/30, 50%) used two or more cameras of the same imaging modality. Three studies used multiple identical cameras to utilize changing images from different angle/space (Estepp et al 2014, Blackford and Estepp 2015, McDuff et al 2018). Five studies used multiple cameras from the same subtype (e.g. smartphones or webcams) to show utilization of software/algorithm across different platforms (Lee et al 2012, Xu et al 2014, Fletcher et al 2015, Koprowski 2016, Coppetti et al 2017). Three studies used different quality/specifications to show similar results can be achieved by high and low performance cameras. Sun et al (2012) and Roald (2013) showed this for HR comparing a high speed visible spectrum camera with a webcam. Lewis et al (2011) used two grades of LWIR camera to similarly determine RR monitoring accuracy. Jensen (2014) used two grades of visible spectrum cameras for different vital signs (lower resolution for HR and higher resolution for BP). Kong et al (2013) used two identical monochrome cameras set to measure from two wavelengths for SpO2 measurement. Three digital camera subtypes were used by Verkruysse et al (2008) who noted that two had automatic adjustment functions which may introduce artefacts. Kumar et al (2015) showed robust HR measurement performance with a monochrome camera (green) and went onto use a multichannel camera in challenging conditions (movement, lighting changes, darker skin colours).
Fifteen studies (15/30, 50%) used two or more different imaging modality cameras. Four studies used different image modalities to detect different vital signs (e.g. infrared camera for RR and visible spectrum multichannel camera for HR) (Blanik et al 2014a, Klaessens et al 2014, Aubakir et al 2016, Prochazka et al 2016). Blanik et al (2014a) used an additional camera for peripheral temperature measurement which is outside the scope of this review. Four studies used a combination of visible and infrared spectrum cameras for monitoring across different lighting levels (Fallet et al 2016, Gupta et al 2016, Li et al 2016, Rasche et al 2016). A combination of NIR and LWIR cameras were used for monitoring in the dark by Hu et al (2018). Three studies used the second camera for improving image analysis or the accuracy of the primary video modality (Lewandowska et al 2011, Blanik et al 2014a, Hu et al 2017, Trumpp et al 2018). For example, Trumpp et al (2018) showed that NIR camera made the highest contribution to maximizing the HR detection rate when used alongside a multichannel set up. van Gastel et al (2015) compared the performance of a monochrome set up against visible spectrum multichannel camera in maintaining signal reliability during movement. Two studies used multiple cameras for the purpose of monitoring from different body areas (Scalise et al 2013, Shao et al 2014).
3.5. Performance/accuracy
3.5.1. Heart rate
Of the 120 studies measuring HR, 65 studies (65/120, 54%) included a Bland–Altman analysis. In five cases the Bland–Altman table or figure did not show a summary data which could be extracted and in nine cases the analysis had been conducted using units other than beats per minute (bpm). In 51 studies it was possible to extract the mean of the differences and the limits of agreement as shown in figure 4. In seven of these, the summary statistic was not reported within the text and estimates were made using a graph reading product (Rohathi 2018). The dotted lines show the acceptable error limits of HR monitors approved for clinical use of  5 bpm (ANSI/AAMI 2002). The full extracted Bland–Altman analysis data can be found in the supplementary file (table 5).

Figure 4. Limits of agreement across studies measuring the heart rate. The studies are displayed in a chronological order, and the bars show the limits of agreement around the mean difference.
Download figure:
Standard image High-resolution imageAmong the studies measuring HR, 48 studies (48/120, 40%) calculated a Pearson correlation coefficient as a measure of accuracy (supplementary file, table 6). In 88% of these studies the correlation coefficient was greater than or equal to 0.9, and in 63% it was greater than or equal to 0.95.
There were 36 studies (36/120, 30%) that reported the root mean square error (RMSE) of the values returned by devices (supplementary file, table 9). In 30 studies (30/36, 83%) the RMSE was less than 5 bpm (ANSI/AAMI 2002). In the majority of the studies (24/36, 67%) reporting this measure, the RMSE was less than 3 bpm.
3.5.2. Respiratory rate
Twenty-four RR studies (24/62, 39%) used Bland–Altman analysis, and of these it was possible to extract the data from 20 studies for comparison (figure 5). In 13 studies (13/20, 65%), the limits of agreement lay within the acceptable clinical range ( 3 breaths per minute (brpm)) (Bergese et al 2017). The full extracted Bland–Altman analysis data can be found in the supplementary file (table 11).

Figure 5. Limits of agreement across studies measuring the respiratory rate. The studies are displayed in a chronological order, and the bars show the limits of agreement around the mean difference.
Download figure:
Standard image High-resolution image
Among the studies measuring RR, 24 studies (24/62, 39%) used Pearson correlation coefficient as a measure of accuracy (supplementary file, table 12). In 92% of these studies the correlation coefficient was greater than or equal to 0.9, and in 71% it was greater than or equal to 0.95. Of the 15 studies which reported RMSE, 13 studies (13/15, 87%) reported RMSE less than 3 brpm.
3.5.3. SpO2
One study (1/11, 9%) measuring SpO2 used a Bland–Altman analysis, showing mean difference of  and limits of agreement
  2.58%. Four studies (4/11, 36%) reported Pearson correlation (range 0.64–0.94). RMSE was reported by 2 studies (1.3% in Shao et al (2016), 1.15% in Verkruysse et al (2017)).
3.5.4. Blood pressure
None of the six BP studies used Bland–Altman analysis. Pearson correlation coefficient between BP and pulse transit time was reported by four studies (4/6, 66%) with range −0.72 to −0.89. Two studies reported mean absolute errors between 3.9 mmHg (Jain et al 2017) and 9.48 mmHg (Secerbegovic et al 2016). Normalized mean square error was reported by one study as 4.63% (Jain et al 2017).
3.5.5. Vital signs range
Within the 141 studies performed in healthy subjects, 91 studies (91/141, 65%) used one or more methods to vary the environment or the vital sign(s) of interest. Further details of interventions within the studies can be found in the supplementary file (table 4, column 19). The majority of interventions were used to show the robustness of the system under different lighting or its ability to compensate for movement. Exercise was used by 16 HR studies and two RR studies. Of the 51 studies monitoring RR in healthy subjects, 11 studies (11/51, 22%) used altered breathing patterns or rates. Hypoxia was induced in 2 SpO2 studies in healthy subjects (Guazzi et al 2015, Verkruysse et al 2017). Of the six studies assessing BP in healthy subjects, two studies (2/6, 33%) used exercise (Jeong and Finkelstein 2016, Secerbegovic et al 2016) to cause changes from baseline and 1 study (1/6, 17%) used the valsalva maneuver (Sugita et al 2015).
The vital sign range achieved by the above interventions were variably reported. Of the 16 HR studies in volunteers using exercise, the range of HR achieved was reported by 11 studies (11/16, 69%). All 11 achieved HR over 100 bpm and seven studies (7/16, 44%) achieved HR over 120 bpm. It was not possible to extract the range of HR values from the remaining five. In most studies a large proportion of data points were still from the normal HR range of 60–100 bpm. Lin et al (2015) reported that within their cohort of subjects, image-based monitor estimates performed worse once HR reached over 100 bpm (errors of >20 bpm). The two RR studies using exercise (Murthy et al 2004, Fei et al 2005)) achieved RR of 35 and 25 brpm respectively, although in the former only four subjects (4/10, 40%) reached RR over 20 brpm. The 11 studies using altered breathing pattern effectively achieved higher simulated breathing rates with nine studies (9/11, 82%) achieving RR over 30 brpm and five studies (5/11, 45%) achieving RR over 60 brpm. In the two studies where hypoxia was induced, the SpO2 ranges recorded by the reference device were 70%–100% (Guazzi et al 2015) and 80%–100% (Verkruysse et al 2017). The two BP studies using exercise (Jeong and Finkelstein 2016, Secerbegovic et al 2016)) had systolic BP ranges of 90–170 mmHg and 145–175 mmHg respectively. It was not possible to extract the BP changes created using the Valsalva maneuver from Sugita et al (2015).
3.6. Clinical studies
Twenty studies (20/161, 12%) were conducted either wholly or partly in non-healthy populations. Four studies (Tan et al 2010, Bal 2015, Janssen et al 2016, van Gastel et al 2016) had a mixture of results from healthy volunteers and paediatric or neonatal critical care populations. The subset of results from these studies are reported in this section to demonstrate the performance within clinical settings.
3.6.1. Heart rate
Six clinical studies reported their results using Bland–Altman analysis. Two of these studies reported results within clinically acceptable error limits (Bal 2015, Rasche et al 2016). Three studies reported RMSE values ranging from 2.06 bpm (Bal 2015) to 12.2 bpm (Antognoli et al 2018).
Aarts et al (2013) reported that in 13 out of 19 patients, the camera estimates matched the reference device (defined as bpm difference  5) for over 90% of the total measured time. Rasche et al (2016) reported camera and reference monitor match in 83% of total recording time. Coppetti et al (2017) found a discrepancy of >10 bpm between the camera monitor and reference device in 20% of the measurements and >40 bpm in 9% of measurements. Better performance was achieved by Mestha et al (2014) with mean bias of 2.52 bpm and 95% limits of agreement
  5.48 bpm. However, the authors reported motion related data loss of 10.5% which were not included in the analysis. During periods with little movement, Tarassenko et al (2014) observed mean absolute error (MAE) of approximately 3 bpm but significantly worsened accuracy during periods of movement. Villarroel et al (2014) reported continuous HR estimation was possible in between 38.4% and 69.6% of all data sessions within the entire study window.
3.6.2. Respiratory rate
Three clinical studies reported their results using Bland–Altman analysis (Janssen et al 2016, van Gastel et al 2016, Antognoli et al 2018). Of these, the results from Janssen et al (2016) were from their healthy subjects subset. The other studies reported agreement ranges of 0.3  6.3 brpm (Antognoli et al 2018) and 0
  20 brpm (van Gastel et al 2016). Two studies reported RMSE values ranging from 7.6 brpm (Antognoli et al 2018) to 9.35 brpm (van Gastel et al 2016). Correlation coefficients reported varied from 0.87 (van Gastel et al 2016) to 0.95 (Cenci et al 2015). Janssen et al (2016) achieved accuracy of 88.65%–92.55% in neonates. Tan et al (2010) tested their algorithm in one pediatric patient and reported camera monitor estimation of 19.4 brpm, compared to a clinical measurement of 20 brpm. Although (Klaessens et al 2014) visually showed agreement between the camera and reference monitors, it is unclear what proportion of time this was possible as the authors selected best periods for the comparison to be made.
3.6.3. SpO2
Bal (2015) observed a correlation of 0.71 between camera and reference device measurements of SpO2. Tarassenko et al (2014) used a 'ratio of ratios' method in patients undergoing dialysis who have desaturation episodes, with coefficient of determination (r2) of 0.64 over the 87%–95% saturation range.
3.6.4. Blood pressure
None of the BP studies identified were conducted within clinical settings.
3.6.5. Vital signs range within clinical studies
Within the clinical studies, Aarts et al (2013) and Mestha et al (2014) (both studies were in neonates) reported HR range of 140–170 bpm while (Scalise et al 2012) had a wider range of 100–190 bpm. Coppetti et al (2017) had HR range between 43 and 123 bpm, although the majority of measurements fell between 50 and 100 bpm (with non-contact camera measurements performing significantly worse at higher HR). Bal (2015) tested their algorithm in a group of pediatric intensive care patients with HR ranges of 86–130. Cenci et al (2015) had a RR window of 45–75 brpm. Jorge et al (2017) had a wider RR window of 10–110 brpm within the long recording periods. Bal (2015) had reference SpO2 range between 95% and 98% while (Tarassenko et al 2014) captured desaturation episodes in renal dialysis population with reference ranges between 87% and 95%.
3.7. Neonatal studies
Of the 20 clinical studies, 12 studies (12/20, 60%) were within the neonatal critical care population. Compared to other clinical studies, those within neonatal critical care were smaller in size (ranging from 2–30 patients). Eight studies (8/12, 67%) used visible spectrum cameras, one study ((Abbas et al 2011), 1/12, 8%) used a single infrared camera, and the remaining three studies (3/12, 25%) used a dual camera setup. The first neonatal study to be reported was RR monitoring using nasal temperature variation (Abbas et al 2011). This was followed by two studies estimating HR by tracking movements in skin surface secondary to vascular pulsation (Scalise et al 2012) and monitoring fluctuation in skin colour with cardiac cycle (Aarts et al 2013). Further methods of RR monitoring using a colour camera to track chest wall movement were described by Villarroel et al (2014), Cenci et al (2015), and Jorge et al (2017). We identified one SpO2 study in neonatal population (Villarroel et al 2014). Compared to studies conducted in adults, authors reported technical challenges of monitoring neonates due to their naturally higher signal frequency in both HR and RR (Villarroel et al 2014) and lower amplitude in signals of interest (Abbas et al 2011).
3.8. Challenges/intervention
A similar range of limitations was reported by most studies. The commonest limitations were frequent loss of signal, reliance on constant lighting, and noise from movements of the subject (even small). Of further relevance to practical application, 46 studies (46/161, 29%) reported that translating the analysis to real-time analysis will provide a challenge and 39 studies (39/161, 24%) reported that image analysis is likely to be disease-state dependent. There was also evidence of difficulty in collecting data in clinical settings, with only 70/160 (44%) recordings being available for processing in a study conducted within adult critical care unit (Rasche et al 2016).
3.8.1. Skin colour
Skin colour was reported as a challenge by 26 studies (26/161, 16%). No studies mentioned skin colour as an exclusion criteria but of the 57 studies where skin colour was reported, 22 studies (22/57, 39%) had no variation in skin colour or ethnicity. Several authors stated that the ease of vital signs detection from skin using visible spectrum cameras can vary depending on the skin colour (de Haan and Jeanne 2013, Wang et al 2017). Addison et al (2018) gave their accuracy results stratified by skin pigmentation (Fitzpatrick score 1–6) and showed a variable range from 1.74 bpm to 2.89 bpm but with no obvious pattern across the studies.
3.9. Statistical analysis
Thirty-two studies (32/120, 20%) were deemed to have used appropriate statistical methods as defined in our protocol, of which 18 studies (18/32, 56%) took multiple measurements per subject into account in their statistical analysis. Although 65 HR and 24 RR studies had used Bland–Altman methods, a significant proportion of them also used correlation analysis for which they were penalized in our statistical assessment (supplementary file, table 4, column 24).
3.10. Reporting standard
Several aspects assessed within the GRRAS tool (supplementary file, table 2) were reported by all studies included in this review. These were the following: the name and description of the measurement device used, description of current knowledge and rationale for the study, description of the measurement process (including time interval between repeated measurements, the duration of recording), and description of the practical relevance of the studies.
A priori description of statistical methods to be used and an explanation of the sample size were rarely included. The aspects of reporting standards which most separated studies were description of the study subjects included and the appropriateness of statistical methods used. The results of the study detail reporting and statistical analysis are included in supplementary material (table 4, columns 24 to 26). We rated 18 studies as 'Good', 102 studies as 'Fair', and 38 as 'Weak'.
3.11. Commercial application
The results of smartphone application search conducted for HR monitoring is shown in supplementary file, table 25. Four applications were identified which appear to use non-contact camera technology to measure HR. Accuracy data was not publicly available. The authors also note that at the time of writing at least one non-contact, image-based device for the measurement of vital signs is now commercially available in Europe (Hughes 2018).
4. Discussion
The aim of this review was to systematically find and summarize the current availability and performance of non-contact image-based vital sign monitoring. The use of this technology in the clinical environment could have multiple potential benefits. Furthermore, the improvement in imaging technology over the last decade combined with the interest in artificial intelligence and deep learning opens the potential for more sophisticated use of vital signs and earlier recognition of clinical deterioration. This comparison of the accuracy and agreement results across studies should provide researchers in this field with knowledge of where the outcomes of their own studies stand.
4.1. Summary of evidence
The majority of studies in this field are in the proof-of-concept stage with small sample size and heterogeneity. Most studies were conducted in academic settings on healthy volunteers, many under optimal or artificial settings. Many studies were designed and conducted from an engineering perspective and have limited clinical context. In particular, it was noticeable that several studies did not meet the criteria for this review as they omitted the use of a clinically validated reference device which limits their clinical applicability. In terms of the reference devices used, it is worth noting that the accuracy of PPG-derived RR estimates depend on normal circulation and regular breathing pattern (Charlton et al 2017). Wearable reference devices provide a practical alternative to ECG or PPG monitoring in study settings, but their agreement with ECG should not be assumed (Georgiou et al 2018). The use of a valid reference device is key in method comparison studies, and important to recognize the limitations of commonly used reference devices in interpretation of the results.
Of key relevance to the potential application of the technologies discussed in this review in clinical practice, many studies based their vital sign estimation on a limited amount of data. Less than 5 min data was captured per subject in 61% of studies. The short recording duration in some studies may limit the validity of their results, especially for lower frequency vital signs such as RR in healthy populations. The longer duration studies in a clinical setting provide extra insight on the proportion of time accurate recording is achievable. The studies were also limited in terms of the vital sign ranges measured, with many of the volunteer results being based on a large pool of data within the normal range and only small numbers in the extremes (where arguably all monitors need to perform better for clinical usefulness). Approximately half of the included studies (80/161, 50%) monitored subjects from under 1 m away which may be practical for self-monitoring (e.g. subject holding a smartphone). However, these methods may require further validation at a greater distance for longer term clinical use or bedside and home monitoring purposes. The challenges of translating the promising laboratory-based studies to clinical settings are clear from the 20 studies conducted in non-academic settings. Technical challenges in terms of image collection and camera setting adjustment meant a significant proportion of data were lost or not possible to analyze (Rasche et al 2016). Where monitoring for longer periods in a clinical environment has been attempted, there remain substantial challenges, including movement and ambient lighting, to overcome. Based on these factors, it is far too early in the development of this technology to be able to say whether this type of monitoring could be used in clinical settings, where correct and reliable identification of worsening vital signs is imperative.
There is a drive in the literature to achieve accurate monitoring using inexpensive and readily available equipment. Twenty-eight studies (28/161, 17%) used inexpensive webcams with resolution under 0.5 megapixels and 25 studies (25/161, 16%) used smartphone or tablet cameras. Of those that reported the camera resolution used, 74% of studies used resolution under 1 megapixels. Similarly, 70% of studies used a frame rate of 30 or less, potentially reflecting efforts to improve algorithm used with lower performance cameras. Two grades of the same modality cameras were compared by Sun et al (2012), Roald (2013), and Lewis et al (2011), reporting comparable performance within visible spectrum cameras and infrared cameras.
The reported accuracy of HR monitoring was the closest to clinically acceptable limits. Currently HR monitoring is possible by non-contact PPG and vascular pulsation movement detection using visible and infrared spectrum cameras. However, the large majority of studies had readings heavily clustered within the normal range, recorded for periods of less than 5 min in ideal conditions. The changes in nasal temperature with respiratory cycle lends itself to infrared detection of RR. Image detection of chest wall and abdominal movement within the visible spectrum have also been used for RR monitoring. Similarly to HR, the accuracy of these methods fall within clinically acceptable error limits in ideal conditions. For both HR and RR, it was evident that the performance of image-based monitors were worse within clinical populations.
The detection of SpO2 is technically challenging and the literature reflects this. Current camera methods replicate the contact pulse oximetry method of differential light absorbance. The technical challenge include the non-contact nature, the relatively small change component delivered by saturated blood, and further noise from the effect of variable angle of incidence at skin surface on light absorption. In the literature reviewed, this modality has not been widely investigated and its performance is not yet clinically acceptable. We identified 6 studies comparing camera-derived measurements to reference BP. Although the use of pulse transit time for estimation of BP look promising, its clinical application to the non-healthy population has not been explored in the literature so far. However, the employment of visible, wearable proxies may facilitate remote monitoring by calculation of a derived variable.
Despite the heterogeneity of the studies, we found several common themes in the challenges and limitations faced by the study authors. The most commonly discussed were movement, lighting, and skin colour. In recent years, these have been incorporated in the design of the studies or the advance in technology has allowed compensation for these challenges.
4.2. Limitations
There were several challenges and limitations in the synthesis of this review. Firstly, there is a high likelihood of publication bias and our search strategy may have excluded more specialist engineering studies. Being a review of the literature, there is also the potential that commercially driven projects were excluded. This was previously discussed in the protocol for this review hence our searches for non-published data. Publication bias is a major challenge in synthesis of systematic reviews. This is particularly true for technologically relevant areas and the fact that many of the relevant publications for this may be in a form not accessible to search (e.g. thesis). Three doctoral and postgraduate theses were included as they were found in reference lists of included studies or web searches, but other relevant unpublished literature may not have been included. Given our search criteria and the fact that most of the studies were found in databases, there is potential for reporting and lead time bias.
4.3. Recommendations
Our systematic review shows considerable interest in the area of non-contact vital signs monitoring, and the importance of high quality reporting by researchers in this rapidly evolving field. We have highlighted several methodological areas where published studies could be improved. The population used should be described in detail to allow valid interpretation of the results. The study design should allow testing of the new monitor across the vital sign range of clinical interest (Hanneman 2008). Studies should use clinically validated reference devices. Furthermore, the comparison with any reference device should employ recommended statistical analysis. It is difficult to give didactic instructions for an exact statistical analysis plan but the outcome variables of any new technology should be comparable with those of currently used reference standards. We would encourage the use of Bland–Altman analysis, RMSE calculations, and reports of percentage accuracy (Lin et al 2012, Obuchowski et al 2015). Although the excellent correlation with the references devices is encouraging, it should be noted that the use of correlation is inappropriate as the reference devices are also estimating the vital signs rather than giving the ground truth. This is particularly true as the values deviate from the normal range. For example, as HR increases the agreement between ECG and pulse oximeter is known to deteriorate (Iyriboz et al 1991). Therefore, we would advise against the use of commonly used correlation coefficients as an indication of accuracy. Studies in the field should follow recommended reporting guidance. Finally, the large majority of studies in this review monitored subjects for very short periods (commonly 5 min or less) in a non-clinical setting. Future clinical application of this technology requires longer duration studies in clinical environments, aiming to overcome specific challenges including movement, lighting, performance across different populations, and real-time image analysis.
5. Conclusion
Non-contact image-based monitoring is currently available for HR and RR. In this area, the technology currently performs to an acceptable level of accuracy in non-clinical settings. The future clinical application of this technology is likely to depend on more clinically-focused studies in order to refine and validate these devices for use in a healthcare setting. In particular, the levels of accuracy and reliability shown in a laboratory environment requires extending over longer time periods and testing over a wider, clinically relevant range. With regard to monitoring of SpO2 and BP using non-contact image-base methods, it appears from the current literature that direct measurement is unlikely to be achievable in the immediate future. We would encourage future studies in this field to fully report aspects assessed within the modified GRRAS criteria for improved transparency and reliability.
Acknowledgments
We are grateful to Professor Lionel Tarassenko, Dr Mauricio Villarroel, and Dr Joao Jorge for useful discussions regarding the context of this systematic review and for providing the necessary engineering insight.
MH and PW are supported by the NIHR Biomedical Research Centre, Oxford. PW is Chief Medical Officer for Sensyne Health and owns shares in the company. His organisation has received research funding from Sensyne Health not associated with this work. SG is funded by an NIHR Doctoral Fellowship (DRF-2016-09-073). JC reports a consulting role for Oxehealth, a company that has produced a commercial non-contact vital signs monitor. She was an author for the published protocol for this systematic review prior to her role as a clinical consultant for Oxehealth. The funders have not played any role in the development of this review.