


Abstract
We report on the application of an optical imaging technique, the biospeckle laser, as a potential tool to assess biological and medicinal plant leaves. The biospeckle laser technique is a non-invasive and non-destructive optical technique used to investigate biological objects. Just after their removal from plants, the torn leaves were used for biospeckle laser imaging. Quantitative evaluation of the biospeckle data using the inertia moment (IM) of the time history speckle pattern, showed that the IM can be utilized to provide a biospeckle signature to the plant leaves. It showed that leaves from different plants can have their own characteristic IM values. We further investigated the infected regions of the leaves that display a relatively lower biospeckle activity than the healthy tissue. It was easy to discriminate between the infected and healthy regions of the leaf tissue. The biospeckle technique can successfully be implemented as a potential tool for the taxonomy of quality leaves. Furthermore, the technique can help boost the quality of ayurvedic medicines.
Export citation and abstract BibTeX RIS
1. Introduction
Leaves are important organs of plants, and function to store energy and water. Leaves of certain plants serve to purify air polluted with synthetic chemicals. Many leaves are categorised as medicinal, and have great importance in the ayurvedic pharmaceutical industry [1]. The juice and poultice of the leaves are utilized for healing various diseases. However, leaves can be infected by several microorganisms, such as fungi, bacteria, and viruses under certain environmental conditions. The infected leaves thus show a reduced medicinal quality and can harm the human body when consumed. Detection and monitoring of such infections on leaf tissues is important from the biological point of view. In the present study, we aim to utilize an optical imaging technique, the biospeckle laser, to assess the information related to the biological leaf tissue.
The biospeckle laser technique is an optical technique based on the generation of dynamic speckle phenomenon varying in both space and time dimensions [2]. The sample under study is illuminated using a coherent light, and the resulting scattered pattern is recorded using a high-speed device such as a CCD or CMOS [3–6].
The biospeckle laser technique has been used to infer information from several biological and non-biological processes, including perfusion imaging [7–9], quality evaluation of fruits and vegetables [10–13], assessment of seed viability [14, 15], detection of fungi colony growth [16], assessment of bacteria and parasites [3, 4, 6], assessment of biological leaves [5], non-biological drying processes [17, 18], visualization of self-healing processes in polymers [19], etc.
The present study reports on the application the biospeckle laser as a potential tool to assess biological plant leaves. Two different leaves, the Plumeria rubra (Frangipani) leaf and Epipremnum aureum (known as the money plant) leaf, were selected for the experiment. Just after their removal from the plants, the leaves were used for biospeckle laser imaging. Data were evaluated using the inertia moment (IM) of the time history speckle pattern (THSP). Results showed that the IM index can be used as a biospeckle signature to the plant leaves. Using qualitative methods, we detected the infected regions on the leaves. From the results, we concluded that the biospeckle technique can be successfully implemented as a potential tool for the taxonomy of quality leaves.
2. Materials and methods
2.1. Analysis of biospeckle data
2.1.1. IM of THSP.
The biospeckle data was numerically evaluated using the biospeckle index (the IM). In each leaf sample, the region of interest (ROI) was selected and analysed by means of the IM index; this was followed by the creation of a THSP and then a co-occurrence matrix (COM). Figure 1 shows an example of the formation of THSP and COM matrices from raw speckle frames of a biospeckle video sequence.
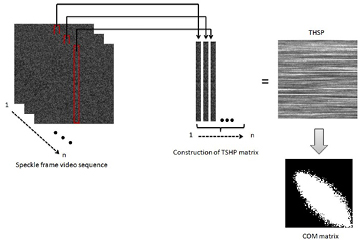
Figure 1. Construction of THSP and COM matrices from a biospeckle video sequence.
Download figure:
Standard image High-resolution imageThe IM index can then be computed as [3, 20, 21]
where COM is related to the THSP, and i and j represent the dimensions of the COM matrix [21].
2.2. Analysis of spatial biospeckle activity
The activity of the biological sample was evaluated using the methods of Fujii, generalised difference (GD) [5], and the temporal LASCA [18]. These processing methods are based on the intensity variations in the biospeckle sequence pattern. The measurements are defined as functions of a sequence of n integer values ![$s=\left[ {{x}_{0}},{{x}_{1}},...,{{x}_{n-1}} \right]$](https://content.cld.iop.org/journals/1555-6611/28/6/065608/revision1/lpaab65cieqn001.gif) , as illustrated in figure 2.
, as illustrated in figure 2.
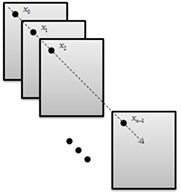
Figure 2. Single pixel activity evolution. The activity of pixel p at frame  is represented by
  , and the activity evolution of pixel p is thus given by the sequence
 ![${{s}_{p}}=\left[ {{x}_{0}},{{x}_{1}},...,{{x}_{n-1}} \right]$](https://content.cld.iop.org/journals/1555-6611/28/6/065608/revision1/lpaab65cieqn004.gif) .
.
Download figure:
Standard image High-resolution imageThe Fujii function (F) for a sequence ![${{s}_{p}}=\left[ {{x}_{0}},{{x}_{1}},...,{{x}_{n-1}} \right]$](https://content.cld.iop.org/journals/1555-6611/28/6/065608/revision1/lpaab65cieqn005.gif) can be defined as follows [5]:
can be defined as follows [5]:
The GD can be expressed by
where i and j are indices spanning all possible numbers in the sequence ![${{s}_{p}}=\left[ {{x}_{0}},{{x}_{1}},...,{{x}_{n-1}} \right]$](https://content.cld.iop.org/journals/1555-6611/28/6/065608/revision1/lpaab65cieqn006.gif) .
.
2.2.1. LASCA using temporal correlation (tLASCA).
Temporal speckle contrast is a method in which averaging in the spatial domain is performed [18, 22]. For each frame, the contrast value  of pixel (i, j) of a particular frame can be computed by using
Here,  is the standard deviation of all pixels at (i, j), and
  is the mean intensity of all pixels at (i, j) of n frames along the temporal dimension. This method is typically used to distinguish the contrast between slow- and fast-moving speckles, which correspond to the mean and standard deviation, respectively.
2.3. Experimental
Two different plants leaves, the P. rubra leaf and E. aureum leaf, were selected for the biospeckle study. Five leaves with almost similar shape and size from each plant were taken. The torn leaves were then used for the biospeckle laser imaging.
Two basic experimental optical setups were employed for the biospeckle assessment of the leaf tissue. Figure 3 shows the first experimental configuration, which is normally used to assess the biospeckle in Fraunhoffer's plane. This geometry allows for quantitative evaluation of the leaf tissue. Figure 4 shows the second configuration in which the phenomenon is followed in the image plane; this is also used for the quantitative evaluation of the specimen. In figure 5, we demonstrate a third backscattering configuration that allows for the study of the spatial distribution of activity across the leaf tissue.
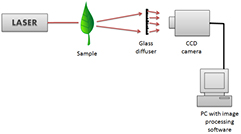
Figure 3. A biospeckle optical imaging configuration for quantitative evaluation of the biological leaf tissue.
Download figure:
Standard image High-resolution image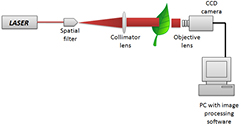
Figure 4. A forward scattering biospeckle optical configuration for the quantitative evaluation of the biological leaf.
Download figure:
Standard image High-resolution image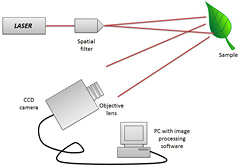
Figure 5. A backward scattering biospeckle optical imaging configuration for qualitative evaluation of the biological leaf tissue.
Download figure:
Standard image High-resolution imageA He–Ne laser of 2 mW operating at 632.8 nm was used to illuminate the leaf surface. The laser beam was spatially filtered and expanded to cover the ROI of the specimen. A CCD camera (Basler, Germany), with a resolution of 1294 × 964 pixels (pixel size of 3.75 square pixels) and having a frame rate of 32 fps, was used to collect the biospeckle data. The camera exposure time was set to 8.9 ms.
For the qualitative evaluation of the leaf tissue, a set of 500 speckle images (500 × 500 pixels) were acquired at every 0.08 s. However, a raw speckle data containing 256 images (256 × 256 pixels) was used for the quantitative evaluation of the leaf tissue.
3. Results and discussion
3.1. Evolution of the THSP and IM index
After harvest from the plants, leaves present different degrees of activity as a result of several phenomena, including evaporation, exchanges across cell membranes, attacks of microorganisms, micro flow, etc. This activity can be effectively obtained using the biospeckle optical technique.
The biospeckle pattern on a leaf tissue varies in the space and time dimensions. The temporal information can be extracted by generating a 2D map called the THSP, where the vertical direction represents the time evolution of the phenomenon. For a specimen showing high activity, the corresponding biospeckle pattern quickly evolves with time, and the THSP image resembles a pattern of a general speckle. However, for samples displaying low activity, the THSP pattern becomes similar to parallel vertical bars.
The evolution of activity can be obtained through the generation of a matrix called the COM, and the subsequent computation of the numerical index IM. In the COM matrix, activity is obtained through the points spread around its principle diagonal. For a sample showing high activity, the points on the COM matrix become more spread.
Figure 6 shows a bright field image of an E. aureum leaf. The leaves were submitted for biospeckle illumination as shown in figure 3. For a quantitative evaluation of the leaf, an ROI was selected from the tissue, and raw speckle frames were collected from the given ROI (as shown in figure 6). From figure 6, one can see the time evolution of a single pixel intensity as well as the mean intensity variation on the given ROI.
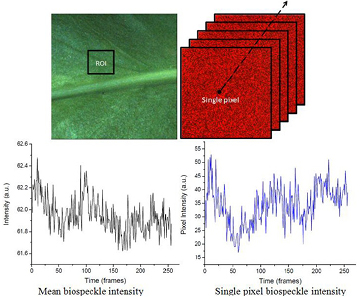
Figure 6. The original E. aureum leaf tissue and its biospeckle video sequence showing the data matrix of the ROI, intensity spectrum of the full frame (ROI), and the intensity profile of a single pixel.
Download figure:
Standard image High-resolution imageFigures 7 and 8 respectively present the THSP image and corresponding COM matrix for E. aureum and P. rubra leaves. As can be seen, the THSPs and COM matrices for the leaves are distinctive and can be easily differentiated.

Figure 7. THSP and COM matrices for an E. aureum leaf. (a) Original image of the leaf; (b) THSP map of the leaf tissue; and (c) its corresponding COM matrix.
Download figure:
Standard image High-resolution image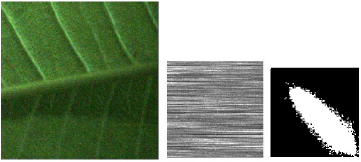
Figure 8. THSP and COM matrices of a P. rubra. (a) Original image of the leaf; (b) THSP map of the leaf tissue; and (c) its corresponding COM matrix.
Download figure:
Standard image High-resolution imageTable 1 shows the computed values of the IM index for the two biological leaves. As can be seen, the IM values for both leaves are statistically significant and can be discriminated. The IM index can therefore be employed as a biospeckle numerical index for the biological signature to a particular leaf species.
Table 1. Comparison between IM values of the P. rubra and E. aureum leaves.
| Leaf | Mean |
Standard deviation | Standard error |
|---|---|---|---|
| P. rubra (Frangipani) leaf | 1161.15 | 78.15 | 20.18 |
| E. aureum (money plant) leaf | 2371.43 | 191.15 | 49.35 |
From figure 9, one can see the statistical plot of the IM index of the two leaves. The values are significant and statistically different for both leaf samples.
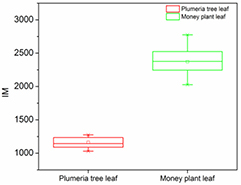
Figure 9. Evolution of IM index for the E. aureum and P. rubra leaves. On each box, the line in the centre is the median, the small square is the mean, and the edges are the 25th and 75th percentiles; the whiskers represent the most extreme data considering the outliers.
Download figure:
Standard image High-resolution image3.2. Visualization of infected regions on leaf tissue
Three infected (due to microbiological organism attacks) E. aureum leaves were collected from the plant and submitted for biospeckle imaging.
Figure 10 shows the spatial distribution of biospeckle activity of E. aureum leaf tissue generated using the methods mentioned in section 2.2. By following the activity maps, one can easily identify the infected regions within the leaf. The regions infected by microbiological organisms in different proportions have been highlighted within the circles, and show a lower biospeckle activity (presented in blue colour).
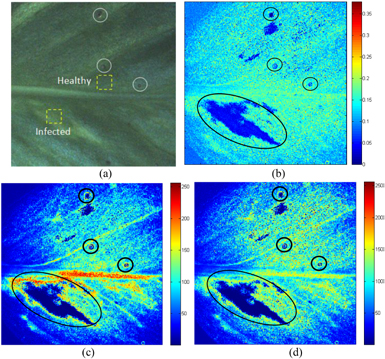
Figure 10. The activity maps in the E. aureum leaf. (a) Original leaf; (b) tLASCA image; (c) Fujii image; and (d) GD image. The colour bar represents the activity level, with blue indicating low activity and red indicating high activity. The infected region shows a lower activity (indicated within circles).
Download figure:
Standard image High-resolution imageFigure 11 presents a time evolution of the biospeckle intensity computed within the healthy and infected regions (as indicated by dotted yellow squares in figure 10). In comparison to the healthy region, intensity fluctuation within the infected zone is almost constant, which causes a lower biospeckle activity as can be observed using the activity maps in figure 10.

Figure 11. Time evolution of biospeckle intensity of the E. aureum leaf from the healthy and infected regions (as indicated in figure 10(a)).
Download figure:
Standard image High-resolution imageUsing the tLASCA, Fujii, and GD images, one can easily observe the infected zones within the tissue. However, in the image generated using the tLASCA algorithm, it is not visible to identify the activity of the midvein. This activity has clearly been identified in the Fujii and GD activity maps (see figures 10(c) and (d)). The activity of the vein corresponds to the internal microflow of fluid through the vein.
3.3. Detection of early infection on leaf tissue
Five E. aureum leaves were collected from the plant. Leaves exhibiting an initial degree of infection caused by microorganism attack were selected and used for laser biospeckle imaging.
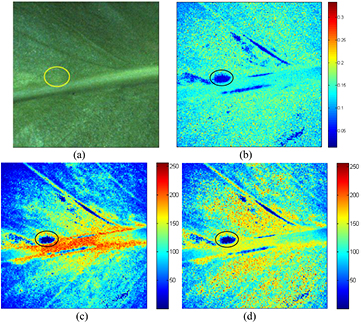
Figure 12 presents the biospeckle activity distribution in an E. aureum leaf tissue showing an initial degree of infection. The maps were generated using the methods mentioned in section 2.2. As can be observed, the regions containing initial infection were clearly identified, reflecting a lower biospeckle activity. The infected region is highlighted by circles, and is hardly visible in the original leaf (figure 12(a)).
Figure 12. The activity maps of the E. aureum leaf. (a) Original leaf; (b) tLASCA map; (c) Fujii map; and (d) GD map. The colour bar represents the activity level, with blue indicating low activity and red indicating high activity. An early stage of infection has been detected, and the region shows a lower activity (indicated within the circle).
Download figure:
Standard image High-resolution image
One can easily differentiate the infected region within the tissue in all activity images computed using the different methods. Moreover, using the Fujii and GD maps, it is easy to observe the higher activity of the midvein caused by internal fluid flow. Conversely, in the tLASCA image this activity is hardly visible.
With the passage of time, microbes continue to consume nutrients from the plant. This results in the infected region drying rapidly, which then causes a lower biospeckle activity.
4. Conclusion
We reported on the application of the biospeckle laser imaging technique as a potential tool to assess biological plant leaves. It has been shown that the numerical IM index can be utilized as a biospeckle signature to the plant leaves. Leaves from different plants may have characteristic IM values. We further investigated the infected regions of the leaves that display a relatively lower biospeckle activity compared to healthy tissue. Through the computation of biospeckle activity maps, it was easy to discriminate between infected and healthy regions of leaf tissue. The biospeckle technique can be successfully implemented as a potential tool for the taxonomy of quality leaves, and it can help boost the quality of ayurvedic medicines.
Acknowledgment
This work was financially supported by the institutions of the authors.