

Abstract
Recent studies have shown that exposure to particulate black carbon (BC) has significant adverse health effects and may be more detrimental to human health than exposure to PM2.5 as a whole. Mobile source BC emission controls, mostly on diesel-burning vehicles, have successfully decreased mobile source BC emissions to less than half of what they were 30 years ago. Quantification of the benefits of previous emissions controls conveys the value of these regulatory actions and provides a method by which future control alternatives could be evaluated. In this study we use the adjoint of the Community Multiscale Air Quality (CMAQ) model to estimate highly-resolved spatial distributions of benefits related to emission reductions for six urban regions within the continental US. Emissions from outside each of the six chosen regions account for between 7% and 27% of the premature deaths attributed to exposure to BC within the region. While we estimate that nonroad mobile and onroad diesel emissions account for the largest number of premature deaths attributable to exposure to BC, onroad gasoline is shown to have more than double the benefit per unit emission relative to that of nonroad mobile and onroad diesel. Within the region encompassing New York City and Philadelphia, reductions in emissions from large industrial combustion sources that are not classified as EGUs (i.e., non-EGU) are estimated to have up to triple the benefits per unit emission relative to reductions to onroad diesel sectors, and provide similar benefits per unit emission to that of onroad gasoline emissions in the region. While onroad mobile emissions have been decreasing in the past 30 years and a majority of vehicle emission controls that regulate PM focus on diesel emissions, our analysis shows the most efficient target for stricter controls is actually onroad gasoline emissions.
Export citation and abstract BibTeX RIS

Content from this work may be used under the terms of the Creative Commons Attribution 3.0 licence. Any further distribution of this work must maintain attribution to the author(s) and the title of the work, journal citation and DOI.
1. Introduction
Epidemiological studies have identified significant relationships between exposure to ambient fine particulate matter (PM2.5) and an array of adverse health effects, including premature death [1–11]. Relative risk values from this literature have been applied to quantify the health burden of exposure to PM2.5 both in the US and globally [12–17]. Recent studies have found a stronger link between adverse health effects and exposure to black carbon (BC) than exposure to PM2.5 as a whole [18–24]. Janssen et al [25] found that reducing a unit of BC increases life expectancy by four to nine times that of reducing a unit of PM2.5. Grahame et al [26] performed a review of epidemiological and toxicological literature regarding BC and suggested that exposure to BC is causally linked to premature death. In addition to resulting in premature death, exposure to ambient BC has also been shown to result in health effects such as cardiovascular and respiratory effects [21, 27–30].
Fortunately, onroad mobile source emissions of BC have decreased by approximately 66% in the past 30 years [31]; however, a majority of the vehicle emission controls that regulate PM emissions focus on diesel emissions [32, 33]. To understand the benefits of these controls, there have been numerous investigations of the human health impacts of BC emission reductions, including the role of varying geographical locations and emission sources. Fann et al [34] used a reduced-form air quality model to estimate the benefits-per-ton of total carbonaceous aerosol emission reductions for several US urban regions. They found that benefits-per-ton vary not only by emission source but also by geographical location, with estimates ranging from $65 000 for EGU and non-EGU (large industrial combustion sources that are not classified as EGUs) sources of carbonaceous aerosol in Salt Lake City to $2 500 000 for area sources of carbonaceous aerosol in Phoenix. Anenberg et al [35] used a global chemical transport model to evaluate the effects of sectoral BC emission reductions on premature deaths. They found that global emission reductions in the transportation sector resulted in the highest number of avoided premature deaths in North America (2 000–3 000 avoided deaths), while reductions of global BC emissions in the residential sector resulted in up to 1 000 avoided deaths. Caiazzo et al [36] used the Community Multiscale Air Quality (CMAQ) model to investigate the health impacts of major emission sectors in the US and found that onroad vehicles accounted for the largest contribution to population-weighted BC concentrations.
While these studies have shown that the human health benefits of emission reductions have orders of magnitude variability across different geographical regions and sectors, they relied on coarser approaches that limited the number or specificity of emission reductions for which benefits could be estimated. Other studies have used the adjoint modeling approach, which can more specifically estimate the benefits of reductions to emissions from numerous times and locations at less computational cost than forward sensitivity analysis. Dedoussi and Barrett [37] used the GEOS-Chem adjoint to attribute premature deaths from exposure to PM2.5 to emission sectors and locations. Their analysis found that a maximum number of premature deaths (approximately 8 000) are attributed to road emissions in California, while road emissions in Georgia result in approximately 1 500 premature deaths. Bastien et al [38] used the CMAQ adjoint model at a 1 km horizontal resolution to perform source attribution of ambient BC and benzene concentrations in the San Francisco Bay area. They found that the largest sensitivities with respect to emissions occur in the winter, with contributions from local sources of BC contributing between 62% and 85%. In Turner et al [39], we used the CMAQ adjoint to estimate the BC emission sources that contribute the most to total premature deaths annually throughout the US. We found that onroad diesel and nonroad vehicle emissions account for a majority of the premature deaths in the US associated with exposure to BC. We also analyzed the benefits-per-ton of BC emission reductions and found that reductions to emissions in the cold seasons resulted in an average of approximately 15 more premature deaths per sector (per unit emission) than emissions in the warm seasons. The adjoint approach has also been used to estimate ozone health impacts [40–43].
While the work of Dedoussi and Barrett [37], Bastien et al [38], Lee et al [44], and Turner et al [39] utilized adjoint models to perform source attribution studies at high spatial, temporal, and sectoral resolutions, each study focused on health impacts across a large domain, such as the entire globe or the entire US. The extent to which emissions from individual locations and sources cause adverse health effects in specific urban areas has thus yet to be addressed. Such information is required for determining the extent to which local versus distant sources impact individual metropolitan regions, and in helping identify which emission sources may offer the largest health benefits from emission reduction measures. For this purpose, here we use the adjoint of the CMAQ model to quantify the importance of transport of BC from distant emission sources on premature deaths in six major US urban regions. Additionally, we estimate the spatial distribution of benefits-per-ton of emission reductions for each of the six areas. The analysis in this work allows for the determination of sources and locations (resolved at 12 × 12 km) of BC emissions whose reduction could most effectively mitigate human health impacts attributed to exposure to BC, with specific attention paid to comparisons between onroad diesel and onroad gasoline emissions. Finally, the analysis in this work also estimates the adverse health impacts of potential future emissions.
2. Materials and methods
Annual average BC concentrations for 2007 were simulated at a 12 km horizontal resolution using the CMAQ model v4.7.1 [45]. The resultant concentrations are used to estimate premature deaths attributed to exposure to BC in six urban regions. Simulated annual average BC concentrations are evaluated through comparison to measurements from the Interagency Monitoring of Protected Visual Environments [46] (IMPROVE) and Chemical Speciation Network [47] (CSN) and are found to be similar to observed concentrations for both IMPROVE (mean bias = 0.09  ) and CSN (mean bias = −0.22
  ), with lower accuracy at the largest concentrations. An additional consideration is the extent to which the model captures gradients of BC concentrations around urban areas. Comparison of the difference between the average observed concentration at CSN and IMPROVE sites, a proxy for urban to rural gradients, in the Northeastern US to simulated differences shows that the model underestimates the urban-rural concentration gradient by approximately 25% (where the model predicts smaller differences between urban and rural sites). This difference would likely result in an underestimate of the premature deaths associated with exposure to BC, and biases in the adjoint results towards background emissions. This is somewhat expected, given that the urban measurement sites may reflect highly localized concentration peaks that are beyond that captured by the model. For discussion of the meteorology inputs, emissions inputs, and further details regarding model performance, see supporting information and Turner et al [39].
Estimates of premature deaths attributed to exposure to BC for six regions (Denver, Dallas, Houston, Phoenix, San Joaquin Valley, and a region that encompasses New York City and Philadelphia (referred to as NY/PHI), see figure S1) are calculated using the following health impact function:

where Mi is the gridded annual non-accidental premature deaths in the region of interest for people age 30 or older, Cav,i is the gridded annual average BC concentration, i is the grid cell index, N is the number of grid cells, and β is the concentration response factor. While previous studies [1, 11] have shown that β values differ across different regions, we use a constant β across each region to allow for our results to be consistent with the value currently used by the US EPA for policy development [48]. Further details of the forward model simulations, as well as the calculation of the health impact function can be found in Turner et al [39]. This health impact function is formulated to estimate impacts of changes to total PM2.5 concentrations. Here we use this function for estimating the impacts of BC alone. Formally, this should be based on the exponential difference between total PM2.5 concentrations and the amount excluding BC. Directly using the BC concentrations alone assumes the estimate responds linearly to changes in PM2.5 concentrations. While this is not a good assumption in general, for the PM2.5 concentrations typically encountered in the US (in the range of 10–35  ), our linear approximation results in a positive bias of approximately 15%. When estimating benefits per unit emission, we used a value of statistical life of $6.2 million, consistent with the value from Fann et al [34].
We use the CMAQ adjoint to obtain the sensitivities of national premature deaths attributed to exposure to BC with respect to emissions for each region. See Turner et al [39] for full details of the development and validation of the CMAQ adjoint model. In order to reduce the computational cost of this analysis, adjoint simulations were run for the first week of each month. The resulting 12 week average has been shown to be an accurate representation of the year as a whole [39]. Semi-normalized sensitivities ( ) represent the contributions of BC emissions in grid cell i, sector k, and month m, to the number of estimated premature deaths attributed to exposure to BC. The ratio of these contributions to the emissions Ei,k,m represents the number of premature deaths per unit emission, which we refer to as efficiency.
3. Results and discussion
3.1. Sectoral analysis
In this section, we perform an analysis of the contributions of different emission sectors to BC health impacts in each of the six regions. Figure 1 shows the sectoral contributions (left) and sectoral efficiencies (right) for each region. For the efficiency plot in figure 1, emissions and contributions were summed over all grid cells within each region. The sectors are sorted by the number of premature deaths resulting from emissions from each sector for NY/PHI. The contributions for NY/PHI are divided by four, for scale; the efficiency values for NY/PHI are unaltered.
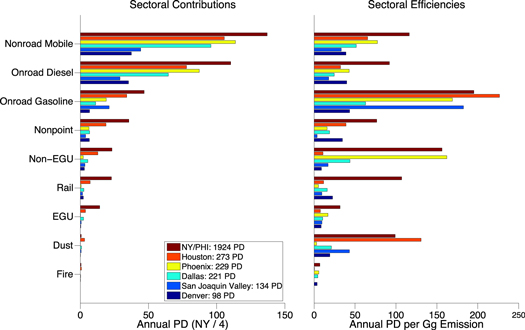
Figure 1. Sectoral comparison of contribution (left) and efficiency of emissions to result in premature deaths (right) for the NY/PHI, Dallas, Denver, Houston, Phoenix, and San Joaquin Valley regions. Contributions for NY/PHI region (left) are divided by four for scale, while contributions are unaltered for efficiency figure (right). PD = premature deaths.
Download figure:
Standard image High-resolution imageSeveral interesting similarities and differences in sector-specific health impacts are evident across these regions. Nonroad mobile emissions are the largest contributor across all regions (followed closely by onroad diesel); however, onroad diesel and nonroad mobile contributions are nearly identical for Denver. For most regions, onroad gasoline emissions are the third largest contributor by a significant margin (e.g., contributions from onroad gasoline in Phoenix are approximately three times larger than the next largest sector). However, Denver onroad gasoline contributions are nearly equal to nonpoint emissions. Additionally, EGU emissions contribute to over 7% of premature deaths in NY/PHI yet EGU emissions contribute to a significantly smaller fraction of the premature deaths in the other regions. Finally, contributions from nonroad mobile and onroad diesel sources in Phoenix are larger than contributions from the same sectors in Houston. However, nearly twice as many premature deaths result from onroad gasoline emission in Houston than in Phoenix.
In addition to the total number of premature deaths resulting from emissions in each sector, it is of interest to compare health effects on a per-unit-emission basis. As shown in figure 1 (right), the efficiency of emissions to result in premature deaths can vary by up to two orders of magnitude across sectors in a single region. Nonroad mobile and onroad diesel sources are the two largest contributors in every region, with both sectors having two to three times as many contributions as onroad gasoline sources. However, onroad gasoline sources have larger efficiencies than both nonroad mobile and onroad diesel sources in every region, with Houston onroad gasoline sources having an efficiency nearly three times larger than nonroad mobile sources. Onroad gasoline sources in Denver contribute to approximately 4 times fewer premature deaths than onroad diesel and nonroad mobile sources in Denver, yet the efficiency of onroad gasoline emissions is nearly equal to both nonroad mobile and onroad diesel (with the efficiency from onroad gasoline being slightly larger).
While onroad gasoline emissions account for very few premature deaths when compared to onroad diesel and nonroad mobile emissions for each region, onroad gasoline emissions in NY/PHI, Houston, Phoenix, and San Joaquin Valley result in the largest number of premature deaths per unit emission (up to 10 times larger than efficiencies of onroad diesel emissions). This is attributed to the difference in driving patterns for onroad diesel and onroad gasoline vehicles. While many onroad diesel vehicles are used for long-range transport of goods along interstates, onroad gasoline vehicles are used mainly for personal transportation in populated areas (see figures S9–11 for spatial maps of emissions for onroad gasoline, onroad diesel, and nonroad mobile sources, and figure S12 for a spatial map of population). In contrast, emissions of BC associated with dust (BC made aloft through transport along paved and unpaved roads, including vehicle tire dust) are shown to result in a negligible number of premature deaths for every region. Still, the efficiency of fugitive dust to result in premature deaths in NY/PHI and Houston is larger than the efficiencies from EGU and nonpoint BC emissions. This is attributed to, in these two regions, the largest dust emissions occuring within the most populous grid cells. The proximity of the dust emissions to high populations greatly increases the exposure, resulting in a larger efficiency. In the other regions, the dust emissions are more distributed throughout the region and result in lower efficiencies.
Another potentially important result obtained from figure 1 (right) relates to the efficiency of non-EGU emissions. In most regions, the efficiency of non-EGU emissions is rather low when compared to the other sectors, with non-EGU contributions in Houston being approximately 25% that of nonroad mobile contributions. However, for NY/PHI and Phoenix, the non-EGU emission efficiency is larger than both the nonroad mobile and onroad diesel sectors, and is nearly equal to the efficiency of onroad gasoline emissions. Additionally, the efficiency of commercial railroad emissions to result in premature deaths is substantial in NY/PHI. This is attributed to the proximity of commercial railways within the region to the major population centers. While our simulations estimate very few premature deaths associated with exposure to BC from fire emissions, contributions from fires have large variabilities across multiple years due to the inconsistencies in both emission magnitudes and spatial distributions. Finally, while non-EGU, rail, and fugitive dust contributions show little variation across regions, these sources have efficiencies that range between approximately 10 premature deaths per Gg of emission to approximately 160 premature deaths per Gg of emission. Analysis of the spatial distribution of efficiencies is presented in the supporting information. From a spatial analysis of the efficiencies in the San Joaquin Valley (figure 2), a majority of the significant efficiencies coincidentally occurring along CA-99, which lies in the eastern portion of the Valley. This suggests that, when considering the health impacts of vehicle emissions, it is preferable for onroad vehicles to travel on I-5 than CA-99. This is potentially significant, as emissions from the construction and operation of the new California rail system [49] will be occurring within the locations of highest efficiency. This suggests that, in the short term, there is the potential for an increase in the number of premature deaths from nonroad mobile emissions in the region while the rail system is being constructed. However, in the long term, the reduction in onroad mobile contributions along CA-99 will likely be greater than the increase in rail contributions from the new rail system. A rough estimate of the short-term costs versus long-term benefits of the California rail system suggests that the potential increase in the number of premature deaths in the short-term would be outweighed by the decrease in premature deaths resulting from onroad emission reductions within two years of operation (see supporting information for details).
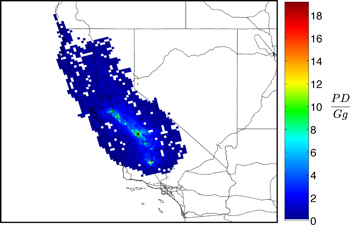
Figure 2. Plot of the efficiency of emissions to result in premature deaths  from exposure to BC in the San Joaquin Valley region. Data presented as premature deaths per Gg of BC emitted.
Download figure:
Standard image High-resolution image3.2. Spatial distribution of contributions
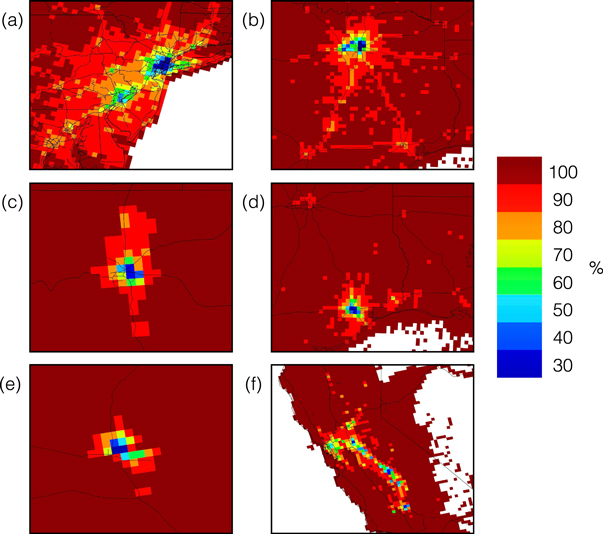
Figure 3 shows contour plots of the contributions (i.e., the number of premature deaths resulting from emissions in each grid cell) for each of the six regions summed across all sectors k and months m. The contours are created by summing the fewest number of grid cells in order to sum to the given contour percentage. For example, the 30% contour in each plot shows the locations with the largest contributions that sum to 30% of the premature deaths attributed to exposure to BC in a region.
Figure 3. Contour plots of contributions (i.e., the number of premature deaths resulting from emissions in each grid cell) for (a) the NY/PHI region, (b) the Dallas region, (c) the Denver region, (d) the Houston region, (e) the Phoenix region, and (f) the San Joaquin Valley region.
Download figure:
Standard image High-resolution image
Figure 3(a) shows the contribution contours for premature deaths in NY/PHI. We estimate that 1 290 (95% CI: 860–1 720, for details of uncertainty calculation see supporting information) premature deaths were attributed to exposure to BC in the region in 2007, and 78% of these premature deaths are attributed to emissions within the region (see table 1). However, it should be noted that the premature death estimates are a result of the overall loading of BC, which partially comes from emissions both inside and outside of the region. Therefore, when we say that 78% of premature deaths are attributed to emissions within the region, this should be interpreted as 78% of the contribution to the health impact function is from emissions within the region. The largest contributors (the 30% contour) are New York City and northeastern New Jersey. These are followed closely by Philadelphia and the suburbs surrounding New York City, making up the 40% contour. The next largest contributors (the 50% and 60% contours) include other suburbs around the urban centers, as well as the major roadways within the region. This reinforces the conclusion from figure 1 that mobile sources account for a majority of the premature deaths in the region attributed to exposure to BC. Additionally, in order to account for 80% of the premature deaths in the region, emissions from as far away as Detroit, MI must be included in the analysis. Finally, the background (sensitivities that create the 90%–100% contours, figure S2) includes emissions from as far away as the I-5 corridor in northern California, Oregon, and Washington. While the sum of the emissions from Chicago, IL and Minneapolis, MN are required to reach the 90% contour, contributions from individual cities themselves are relatively small. For example, emissions from the greater Chicago area account for only 3 premature deaths (0.23%), and emissions from the greater Minneapolis area account for only 1 premature death (0.08%) in the NY/PHI region.
Table 1. Analysis of annual premature death percentage attributed to exposure to BC from emission sources inside and outside of each region.
| PD (95% CI) | % Inside | PD Inside | PD Outside | |
|---|---|---|---|---|
| NY/PHI | 1 290 (860–1720) | 78% | 1013 (678–1347) | 277 (186–368) |
| Dallas | 220 (145–295) | 83% | 185 (124–246) | 35 (23–46) |
| Denver | 100 (65–135) | 88% | 87 (58–116) | 13 (9–17) |
| Houston | 270 (180–360) | 88 % | 238 (159–317) | 32 (21–43) |
| Phoenix | 230 (145–315) | 93% | 214 (143–285) | 16 (11–21) |
| San Joaquin | 130 (85–175) | 73% | 95 (64–126) | 35 (23–47) |
For Dallas (figure 3(b)), we estimate a much smaller number of premature deaths attributed to exposure to BC (220 premature deaths) than in the NY/PHI region. Of these 220 (95% CI: 145–295) premature deaths, 83% come from emissions within the Dallas region. The largest contributions once again come from the urban centers within the region. As with NY/PHI, the 40%–60% contours include the suburbs around the urban center, as well as major roadways in the area. However, the contours show that emissions from Houston, Austin, and San Antonio must be included to account for 80% of the premature deaths in Dallas. Many of the larger contributions that are not within the region of interest occur along the major roadways connecting nearby cities.
Figure 3(c) shows the contribution contours for premature deaths in the Denver region. We estimate 100 (95% CI: 65–135) premature deaths were attributed to exposure to BC in the region, 88% of which result from BC emissions within the region. The largest contributions are from Denver and the suburbs within Denver county, with other less-substantial contributions coming from Fort Collins and Colorado Springs. In fact, even though Colorado Springs is in close proximity Denver, emissions from Colorado Springs result in few premature deaths and only show up in the background. As opposed to figures 3(a) and (b), transport of BC from distant sources does not become important until considering the background (figure S4). This is a result of the regions in figures 3(a) and (b) having significant emission sources near to and upwind of the region. However, for Denver there are no significant nearby or upwind emissions sources. In addition to differences in the proximity of emissions to populous areas, other factors such as topography and meteorology have the potential to alter the percentage of premature deaths resulting from emissions inside versus outside the region of interest.
While the above-background contours for Dallas (figure 3(b)) clearly showed the contributions from mobile sources (as shown by the 80%–90% contours forming a triangle of highways that connect other major cities), figure 3(d) shows that a majority of the above-background contributions for Houston fall within the greater Houston area. Additionally, the largest contributions are from emissions within the city limits, with smaller contribution contours encompassing the suburbs surrounding Houston. While we estimate 220 premature deaths in the Dallas region, we estimate 270 (95% CI: 180–360) premature deaths in the Houston region (88% of which come from emissions in the region). The background in the contour plot for the Houston region (figure S5) is similar to that of the Dallas region (figure S3), since Houston and Dallas are in close proximity to each other.
Similarly to Denver, the Phoenix contour plot (figure 3(e)) shows that all of the above-background contributions occur within the region of interest. The largest contributions again occur within the city limits, followed closely by the suburbs surrounding the city. Additionally, transport of BC from distant sources is not important until considering the background (figure S6). We estimate that 230 (95% CI: 145–315) premature deaths are attributed to exposure to BC in Phoenix, with 93% of the premature deaths being attributed to BC emissions within the Phoenix region.
Lastly, figure 3(f) shows the contour plots for the San Joaquin Valley. We estimate that 130 (95% CI: 85–175) premature deaths are attributed to exposure to BC in the San Joaquin Valley, 73% of which are attributed to BC emissions within the region. As with NY/PHI and Dallas, the San Joaquin Valley analysis suggests that onroad vehicle emissions account for a significant percentage of the contributions in the region. The largest contributions within this region occur near cities along CA-99 (Bakersfield, Fresno, Modesto), supporting the conclusion in figure 1 that mobile sources are the largest contributors to premature death in the region associated with exposure to BC. Additionally, a majority of the locations within the 40%–70% contours occur along the highways in the San Joaquin Valley, with additional contributions from the San Francisco Bay area. While only 73% of the premature deaths are attributed to emissions in the region, transport of BC from distant sources is only important when considering the background.
4. Conclusions
In this study we estimate the extent to which emissions from individual locations and sources throughout the US result in adverse health effects in six urban areas. While onroad gasoline emissions account for approximately half of the premature deaths of nonroad mobile and onroad diesel emissions, reductions to onroad gasoline emissions of BC result in the greatest benefit per unit emission. Some emission sources, such as fugitive dust emissions, result in a negligible amount of premature deaths, yet have significant estimates of premature deaths per unit emission (higher efficiencies than EGU and nonpoint for some regions). Additionally, in the NY/PHI and Phoenix regions non-EGU emissions have efficiencies close to that of onroad gasoline emissions, yet result in a fraction of the premature deaths of onroad gasoline emissions (approximately 10% for Phoenix, approximately 50% for NY/PHI). As expected for a short-lived primary pollutant, we find that the largest contributions occur within the urban centers in the regions of interest. However, contributions from emissions outside of the region account for between 7% and 27% of the premature deaths within each of the six regions. Finally, the largest efficiencies in the San Joaquin Valley coincidentally occur along CA-99, which is also the location along which the new California rail system is to be built. This suggests that, in the short term, there will be significantly more premature deaths from nonroad mobile emissions in the region while the rail system is being constructed. However, in the long term, the reduction in onroad mobile contributions along CA-99 will likely be greater than the increase in rail contributions from the new rail system.
Recent studies have shown that onroad mobile source emissions of BC have decreased by approximately 66% in the past 30 years and offroad mobile engines are estimated to account for 37% of mobile emissions of BC in 2010 [31]. Also, a majority of the vehicle emission controls that regulate PM emissions focus on diesel emissions [32, 33]. However, the greatest benefit per unit emission for reductions of BC emissions occurs for onroad gasoline sources, suggesting that BC emissions from gasoline sources would be the ideal target for stricter controls. That being said, several caveats about the present analysis warrant consideration. First, our approach utilized a single chemical transport model, while other air quality modeling studies have used an ensemble of simulations to better characterize the uncertainty [50–53]. Second, our simulations were performed with emissions from 2007, which do not reflect further recent declines in the US [31, 54]. Using information on BC emission trends through 2010 [31], and assuming that the reported trends in San Francisco and Los Angeles are representative of the entire US, we can extrapolate these trends to 2015 to estimate that the number of premature deaths resulting from exposure to BC from both onroad and offroad diesel vehicle emissions in 2015 may be approximately 33% less than that estimated for 2007. Decreased onroad gasoline emissions of BC may result in approximately 40% less premature deaths in 2015 than 2007. Third, our analysis used a single concentration response factor that corresponds to the relative risk of exposure to PM2.5 for every region, while BC might have pronounced toxicity [20–23, 55] and relative risks associated with exposure to pollution may vary by region [1, 11]. Fourth, our analysis only considers premature deaths attributed to BC exposure for the entire adult population, while certain demographic groups may be at a higher risk [56–62]. Additionally, our adjoint model configuration did not include gas phase or aqueous phase chemistry, both of which have a negligible effect on simulated BC [39]. Furthermore, while this paper analyzes the effects of BC emissions on premature deaths, it is important to recognize that reduction to emissions from the source sectors evaluated here have additional impacts on air quality and health via changes to co-emitted species that affect total PM2.5 or O3, such as NOx. Finally, studies have shown that estimates of premature deaths attributed to pollutant exposure have large variability depending on the horizontal model resolution [63–65], with estimates of premature deaths being greatest at finer resolution. Using the information presented in these studies, we estimate that our 12 km simulations have a low bias of a few percent, relative to higher resolution (4 km) simulations. However, neither 12 nor 4 km simulations are sufficient to accurately resolve near-roadway gradients in BC concentrations.
Overall, this paper shows the utility of the CMAQ adjoint model for analysis of air quality concerns within a specific city or state. The results not only allow for the determination of the fraction of premature deaths that are a result of emissions within the city or state's jurisdiction, but also provide information about the emission sectors that offer the greatest potential benefits for additional emission controls. Additionally, this type of analysis can be extended to other metrics based on pollutant concentrations including analysis of the climate and health co-benefits of emission reductions.
Acknowledgments
This research was supported by NASA Applied Sciences Program grant NNX09AN77G. This paper has been subjected to the United States Environmental Protection Agency's administrative review and approved for publication but solely reflects the views of the authors. Shannon L Capps was supported by an appointment to the Research Participation Program at the Office of Research and Development, US EPA, administered by ORISE.
Disclaimer: although this work has been reviewed and approved for publication by the US Environmental Protection Agency, it does not necessarily reflect the views and policies of the agency.