

Abstract
While the effect of climate change on the prevalence of malaria in the highlands of Eastern Africa has been the topic of protracted debate, temperature is widely accepted as a fundamentally important environmental factor constraining its transmission. Air temperatures below approximately 18 °C and 15 °C, respectively, prohibit the development of the Plasmodium falciparum and P. vivax parasites responsible for the majority of malaria cases in Ethiopia. Low temperatures also impede the development rates of the Anopheles mosquito vectors. While locations of sufficiently high elevation have temperatures below these transmission thresholds, a fundamental question is how such temperature 'threshold elevations' are changing with time. A lack of high quality, high spatial resolution climate data has previously prohibited a rigorous investigation. Using a newly developed national temperature dataset for Ethiopia that combines numerous in-situ surface observations with downscaled reanalysis data, we here identify statistically significant increases in elevation for both the 18 °C and 15 °C thresholds in highland areas between 1981–2014. Substantial interannual and spatial variations in threshold elevations are identified, the former associated with the El Niño Southern-Oscillation and the latter with the complex climate of the region. The estimated population in locations with an upward trend in the 15 °C threshold elevation is approximately 6.5 million people (2.2 million for 18 °C). While not a direct prediction of the additional population made vulnerable to malaria through a shift to higher temperature, our results underscore a newly acquired ability to investigate climate variability and trends at fine spatial scales across Ethiopia, including changes in a fundamental constraint on malaria transmission in the Ethiopian Highlands.
Export citation and abstract BibTeX RIS
Introduction
Malaria is a climate sensitive disease. While the biology of malaria transmission is intricately linked to environmental conditions and is quite complex (McKenzie 2000), a major constraint is minimum air temperature (Gething et al 2011). Sufficiently low temperatures impede the development rates of both the parasites that cause malaria and the Anopheles mosquito vectors that carry them (Patz and Olson 2006, Pascual et al 2006), with mosquito populations consequently lower in highland versus lowland areas (Minakawa et al 2002, Bodker et al 2003). In the Ethiopian highlands, the focus of this study (see figure 1), Plasmodium falciparum is the primary cause of malaria (Howes et al 2015) although P. vivax is also important (World Malaria Report 2015). Minimum temperature thresholds of 18 °C and 15 °C have been identified for the survival of P. falicparum and P. vivax, respectively (Craig et al 1999, Gilles 1999). Since air temperature decreases with altitude in the troposphere, much of the Ethiopian highlands are below these thresholds, serving as a natural barrier to malaria transmission. As such, elevation is used as the primary factor in malaria control decisions made by the Ethiopia Ministry of Health (Aregawi et al 2014).
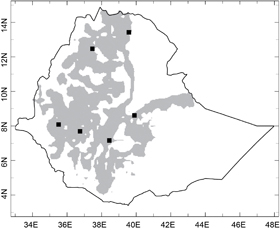
Figure 1 Map of Ethiopia, with grey shading indicating the Ethiopian Highlands, identified as having elevations between 1500–2500 m above mean sea level. The black squares indicate the locations of six meteorological stations used to examine shifts in minimum temperature frequency distributions as described in the supplemental information.
Download figure:
Standard image High-resolution imageThe effect of a warming climate on malaria transmission in highland areas of the tropics is a clear concern (Confalonieri et al 2007), however its specific influence on transmission dynamics, and the extent to which such changes may already be underway, has been the topic of a protracted debate (Hay et al 2002, Reiter 2008, Pascual et al 2008). What is not in dispute is that a warmer climate will lead to in an increase in the elevation where the threshold temperature for parasite survival occurs, eroding the current malaria barrier in the densely populated highland areas of Ethiopia (Himeidan and Kweka 2012, see supplemental figure S1 stacks.iop.org/ERL/12/064015/mmedia). Whether or not climate change has already contributed to a recent upsurge in the prevalence of malaria in the East African highlands remains controversial. From a climate perspective, however, a fundamental issue frequently overlooked in this debate is the lack of high quality climate data for the highland region (Thomson et al 2011). Most publically available climate datasets for eastern Africa consist of either a limited number of station observations, gridded datasets based on limited station data inputs that are highly interpolated spatially, or land surface temperature estimates from satellite observations that are un-calibrated and of relatively short duration (Vancutsem et al 2010). It has been challenging, for example, to robustly quantify temperature trends at a single location, much less across all highland areas (Himeidan and Kweka 2012, Omumbo et al 2011, Christy et al 2009). In Ethiopia, the climate can exhibit substantial spatial variations on the scale of just tens of kilometers (e.g. Hession and Moore 2011), exacerbating the problem.
Methods
In this study a new, high quality climate dataset for Ethiopia obtained from the Enhanced National Climate Services (ENACTS) initiative (Dinku et al 2016) and implemented by the Ethiopian National Meteorological Agency (NMA) is utilized to examine changes in elevation of the minimum temperature thresholds for P. falciparum and P. vivax in the Ethiopian highlands. In keeping with other studies (Aregawi et al 2014), highland areas are defined as locations between 1500–2500 m in elevation (figure 1). The ENACTS data used consists of dekad (10 d) averages of daily minimum air temperature covering the period 1981−2014 at roughly 4 km spatial resolution obtained by merging downscaled, reanalysis temperature data generated by the Japan Meteorologi cal Agency (JRA-55; Kobayashi et al 2015) with quality-controlled station observations from over 150 stations across Ethiopia. The JRA-55 reanalysis dataset combines (assimilates) numerous in situ and satellite observations with output from an operational numerical weather prediction model to generate gridded fields of several atmospheric variables. Here, the surface temperature field from JRA-55 is utilized and was first downscaled from a 50 km to 4 km spatial resolution by using station-based atmospheric temperature lapse rate information in combination with a gridded elevation dataset (NOAA 1988). The station observations are used to compute local bias adjustments for the downscaled JRA-55 data for each dekad, which are then spatially interpolated and applied to generate adjusted JRA-55 temperature fields. The station observations are then merged with the adjusted JRA-55 data for every dekad from 1981–2014 using regression-kriging (Hengl et al 2007). The number of stations used as input into the ENACTS gridding scheme does vary slightly from year to year, but typically by less than 15% (see supplemental figure S2). Nonetheless, a sensitivity analysis was undertaken to examine how a changing number of station inputs affect the gridded temperature analysis in ENACTS. It was found that even when station inputs vary by a factor of two over the course of the analysis period (1981–2014) the gridded maximum and minimum temperature fields show little difference from those based on the set of stations used in ENACTS v5 (see supplemental section 2 for more details).
Using the gridded ENACTS temperature data and a digital elevation model the highest elevation where the dekad average minimum temperature reaches 18 °C and 15 °C during the course of a calendar year was identified across the Ethiopian highlands (see schematic in figure 2). The elevation where these temperature conditions are met is subsequently referred to as the 'threshold elevation' for 18 °C or 15 °C and will hereafter be abbreviated as TE18 and TE15, respectively. Collectively, the TE18 and TE15 values are thus akin to delineating a 'high water mark' across the highlands for the two temperature thresholds in a given year. Once these elevations have been identified, both their variations in space and changes over time are evaluated.

Figure 2 Schematic cross section of topography showing how the threshold elevations are identified. Black, slanted lines indicate the highest elevation obtained by the 18 °C and 15 °C isotherms over the course of a given calendar year based on dekad (10 d) average values of minimum temperature in ENACTS. The elevation at each point where this occurs is referred to as the threshold elevation (TE), which is measured in meters above mean sea level.
Download figure:
Standard image High-resolution imageThe specific steps used to calculate TE18 and TE15 are straightforward and are described here for TE18. The first step in the calculation is to flag all grid points in the ENACTS minimum temperature field as 1 (0) if they remain, (do not remain) below 18 °C throughout the course of a given calendar year. Next, for a given year, the grid point locations where adjacent, flagged values differ by one are identified, with the elevation of these grid points (the TE18 values) obtained from the ETOP05 dataset (NOAA 1988). There is some uncertainty in the computed local values of TE18 owing to differences in elevation between the adjacent grid points used to test for differences in the flagged values described above. A summary measure of this uncertainty across the highlands is obtained by first computing the difference in elevation between the TE18 value at a given grid point and the elevation at adjacent grid points and then computing the standard deviation of these differences across all TE18 locations for a given year. The procedure for computing TE15 is the same as for TE18 but using the lower temperature threshold to flag the data in the first step. Once determined, the TE18 and TE15 values were evaluated in three ways. First, the mean values of TE18 and TE15 were computed across all highland locations during a given year to generate time series covering the period 1981–2014. An assessment of temporal trends in these two time series was then undertaken. A second analysis examined local variations in TE18 and TE15 by computing their cumulative frequency distributions as a function of elevation. A third assessment was to determine local trends in TE18 and TE15 based on the Mann-Whitney-Wilcoxon test, which is described below in the discussion of testing for statistical significance.
To examine the relationship between interannual variations in TE18 and TE15 and the El Niño-Southern Oscillation (ENSO), a linear trend was first removed from both time series using ordinary least squares regression. These de-trended time series were then regressed onto the previous year's October–December average sea surface temperature (SST) anomalies (Reynolds et al 2007) averaged over the Niño 3.4 region of the east-central equatorial Pacific. The October–December SST values were used since ENSO events tend to be reaching their peak strength during this season, which tends to persist into the following calendar year. The ENSO contribution to interannual variations in TE18 and TE15 was then removed by multiplying the regression coefficients obtained above by the observed Niño 3.4 SST anomalies for a given year and then subtracting this value from the original TE18 and TE15 time series. The resulting 'residual' time series were then again tested for temporal trends.
In addition to aggregating results across the highlands region to form time series, spatial variations in TE15 were also investigated to examine spatial variations in elevation during El Niño and La Niña as well as for all years in the study. The linearly de-trended TE15 data was used for this purpose, with cumulative probability (relative frequency) distributions of elevation generated for strong El Niño (1998) and La Niña (2000) events (based on the Niño 3.4 SST index). The 10th, 50th and 90th percentile values in elevation were also computed across all years (1981–2014), again based on the relative frequency of elevation occurrence.
Statistical significance of temporal trends in TE18 and TE15 averaged across the highlands was computed using the Mann–Kendall test. The magnitude of the trend was determined by the slope term in an ordinary least squares regression fit to the time series data. The statistical significance of the local (grid point) trend in the 18 °C and 15 °C temperature thresholds was determined using the Mann–Whitney–Wilcoxon test. This test was applied to binary data, which indicated at each grid point whether or not the temperature had exceeded the 18 °C or 15 °C threshold during a given year. To assess trends in this occurrence over time, the full binary data time series were divided into two equal samples (1981–1997 and 1998–2014) and then the statistical test applied. To estimate the human population living in locations having a statistically significant increase in these temperature thresholds, a gridded population density dataset (CIESIN 2016) was employed. The total population was obtained by summing the population across all grid points where the trends were statistically significant (p < 0.05).
Results
Time series (figure 3) showing the mean value of threshold elevation (TE18 and TE15) averaged across all highland locations indicates both substantial interannual variability as well as statistically significant (p < 0.01) upward trends. The interannual fluctuations in the elevation time series are closely linked to the status of the El Niño-Southern Oscillation (ENSO), with El Niño (La Niña) associated with higher (lower) threshold elevations, as seen in their correspondence to October–December average sea surface temperature (SST) anomalies in the Niño 3.4 region of the east-central equatorial Pacific (vertical bars in figure 3). Using the linearly de-trended TE18 and TE15 time series, the temporal correlation with the Niño 3.4 SST index is r = 0.62 (r = 0.73) for the 18 °C (15 °C) threshold, both statistically significant at p < 0.01. This strong association with ENSO is expected, given the warming (cooling) influence of El Niño (La Niña) conditions on the tropical atmosphere (Chiang and Sobel 2002).

Figure 3 Time series (1981–2014) of the mean elevation above mean sea level (m) where the dekad (10 d) average minimum temperature in a given calendar year never exceeds 18 °C (15 °C) is indicated by the solid red (blue) line. Dashed lines around both curves indicate a measure of the uncertainty in mean elevation. Colored bars show anomalous values (°C) of the October–December Niño 3.4 sea surface temperature index. Trend lines for each series and their associated slopes are also shown.
Download figure:
Standard image High-resolution imageWhen the influence of ENSO is removed from the TE18 and TE15 time series in figure 3 via linear regression, the residual time series still show statistically significant (p < 0.01) trends of similar magnitude to those obtained for the original series. This is shown in figure 4, where the residual TE18 and TE15 time series are plotted along with linear trends fit to both time series. The increase in elevation for both variables is thus not simply a result of temporal variations in the behavior of ENSO over the 1981–2014.

Figure 4 Time series (1981–2014) of the mean elevation (m) where the dekad-average minimum temperature in a given calendar year never exceeds 15 °C (thick grey line) or 18 °C (thick black line) after removing the influence of ENSO by linear regression. Vertical grey bars on both series are a measure of uncertainty in the mean elevation. An ordinary least squares regression fit to each time series is shown by the dashed lines, with the magnitude of the slope and its standard error indicated below each curve.
Download figure:
Standard image High-resolution imageResults assessing local variations in TE15 during the El Niño of 1998 and La Niña of 2000 are shown in figure 5, where associated cumulative frequencies in elevation values are plotted (in percent). The figure indicates a difference in median elevation for these two years of approximately 100 m, a clear indication of the importance of ENSO on interannual variations in the elevation of malaria temperature suitability. Another interesting result seen in figure 4 is that the difference in elevation between the 10th and 90th percentiles of TE15 for either ENSO phase (as well as for all study years) is approximately 900 m. This large range in elevation is an indication of substantial spatial variation in climate of the highlands region, likely associated with the interaction of low-level winds and topography, variations in cloud cover and its influence on net surface radiation and other factors (e.g. Lundquist and Cayan 2007).

Figure 5 The cumulative frequency (in percent) of the elevation where the dekad-average minimum temperature never exceeds 15 °C during a year with El Niño (1998, solid black line) and La Niña (2000, solid grey line) conditions. The X's on the plot indicate the elevation values representing the 10th, 50th and 90th percentiles computed by ranking across all years (1981–2014). The difference between median values for the El Niño and La Niña years is about 150 m.
Download figure:
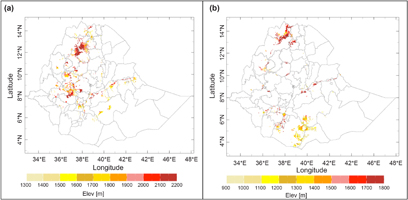
Standard image High-resolution imageFinally, figure 6 indicates locations having a statistically significant (p < 0.05) increase in the 18 °C and 15 °C minimum temperature thresholds, with shading in the figure representing local elevation. Using the gridded population dataset (CIESIN 2016) an estimate of the highlands population living in these locations was found to be approximately 6.5 million for the 15 °C threshold and 2.2 million people for the 18 °C threshold.
Figure 6 The elevation (m) of locations that show a statistically significant (p < 0.05) increase in the occurrence of the dekad-average minimum temperature exceeding, (a) 15 °C, or (b) 18 °C in a given calendar year.
Download figure:
Standard image High-resolution image
Discussion and conclusions
The increasing trends in TE18 and TE15 are consistent with a statistically significant (p < 0.05) upward trend in minimum temperature across Ethiopia of 0.20 °C/decade from 1981−2014 seen in the ENACTS v5 data (figure S5). It is also consistent with observed shifts towards higher minimum temperatures in the probability distribution functions for six highland temperature stations (figure S6). While minimum temperatures, and thus their trends, can be sensitive to local factors such as land use changes (Pielke 2005), the observed increases in TE18 and TE15 are consistent with anthropogenic climate change associated with increasing greenhouse gases (IPCC 2013). In addition, both maximum and minimum temperatures show statistically significant upward trends.
The marked spatial variations in TE18 and TE15 indicate a very practical limitation of using elevation alone to demarcate regions with or without epidemic malaria (Aregawi et al 2014). In addition, this result provides an important caveat to assuming tropical air temperature at higher elevation land areas decrease at a fixed rate with altitude, or lapse rate (Patz and Olson 2006). In land regions with highly heterogeneous topography there can be substantial differences in air temperature at different land locations at the same elevation and between surface air temperatures in mountainous locations with that in the free atmosphere (e.g. above the ocean) at the same altitude (Lundquist and Cayan 2007). Using a fixed lapse rate assumption and the spatial interpolation of sparse temperature station observations would lead to substantial errors when conducting the type of analysis considered here.
Exceeding the minimum temperature threshold necessary for malaria transmission is not, of course, a prediction of an actual increase in malaria. The dynamics of malaria transmission are markedly more complex, with TE18 and TE15 indicating only necessary but not sufficient conditions for the transmission of two important malarial parasites. However, those necessary conditions do show statistically significant upward trends in elevation over the past three plus decades. In addition, a recent study by Siraj et al (2014) found that the El Niño years of 1997 and 2002 were both associated with increased temperatures as well as an increase in prevalence of malaria at higher elevations in a sub-domain of the Ethiopian highlands. The upward trends in TE15 and TE18 identified here are therefore a concern. In particular, the TE increases are occurring in the densely populated highlands, where higher elevation has historically served as a buffer against malaria transmission.
A fundamental challenge in undertaking assessments of possible linkages between climate variability and trends on changes in malaria prevalence in the highlands of East Africa has been access to quality-controlled, high spatial resolution climate data. The ENACTS climate dataset was developed to address such problems and was used here to explore temporal variations and trends in minimum temperature conditions necessary for the transmission of malaria in the Ethiopian highlands. Using these new data we have quantified the influence of the warm and cold phases of ENSO on the elevation where these two temperature thresholds occur while also identifying statistically significant increases in these elevations over roughly the past three decades. Overall, our results underscore a new capability for conducting detailed climate analyses in the Ethiopian Highlands, which in the current case provides substantial evidence that the temperature suitability for malaria transmission is climbing the Ethiopian highlands.
Acknowledgments
We are grateful to the National Meteorology Agency (NMA) of Ethiopia who provided the ENACTS and station data. NMA was the first of nine African countries that have now implemented the ENACTS methodological approach. This study was supported in part by a grant from the National Institutes of Health (Award No: 5R21TW009537-02) to MCT and BL 'Climate Variability and Change: Implications for Malaria Control in East Africa, along with a grant to MCT from WHO Roll Back Malaria 'Strengthening National Climate Data and Information for Malaria Decision-Making in Africa', which supported IRI work with NMA to improve the ENACTS databases.'. Additional support for BL was provided by a grant from the National Science Foundation (Award No: AGS 12-52301).