Article Text

Abstract
Aim: To characterise and monitor abnormal fundus autofluorescence (AF) in patients with retinitis pigmentosa (RP) who have good visual acuity.
Methods: 21 patients with a clinical diagnosis of RP were examined. All had rod-cone dystrophy (ISCEV standard electroretinograms (ERGs)), visual acuity of 6/9 or better, and manifested a parafoveal ring of high density fundus AF. Repeat AF imaging was performed after periods of between 2 years and 5 years in 12 patients. Pattern ERG (PERG) and multifocal ERG (mfERG) were performed in 20 cases. Visual fields (VF), photopic and scotopic fine matrix mapping and small field PERGs were performed in representative cases.
Results: The rings of high density AF varied in size between patients (from 4°–16° diameter). MfERGs showed relative preservation over the central macular area, correlating with the size of AF ring and with PERG and psychophysical data. Progressive constriction of the AF ring was demonstrated at follow up in three patients. Serial PERG, mfERG, and VFs, performed in one of these cases, showed evidence of deterioration concordant with ring constriction.
Conclusions: High density rings of AF, seen in some patients with RP with good visual acuity, demarcate areas of preserved central photopic function. MfERGs correlate with the area encircled by high density AF and the PERG data. The size of the ring of AF can show progressive constriction accompanied by increasing macular dysfunction.
- AF, autofluorescence
- ERG, electroretinogram
- mfERG, multifocal ERG
- PERG, pattern ERG
- RP, retinitis pigmentosa
- VF, visual fields
- retinitis pigmentosa
- fundus autofluorescence
- image analysis
- scanning laser ophthalmolscopy
- AF, autofluorescence
- ERG, electroretinogram
- mfERG, multifocal ERG
- PERG, pattern ERG
- RP, retinitis pigmentosa
- VF, visual fields
- retinitis pigmentosa
- fundus autofluorescence
- image analysis
- scanning laser ophthalmolscopy
Statistics from Altmetric.com
- AF, autofluorescence
- ERG, electroretinogram
- mfERG, multifocal ERG
- PERG, pattern ERG
- RP, retinitis pigmentosa
- VF, visual fields
- retinitis pigmentosa
- fundus autofluorescence
- image analysis
- scanning laser ophthalmolscopy
- AF, autofluorescence
- ERG, electroretinogram
- mfERG, multifocal ERG
- PERG, pattern ERG
- RP, retinitis pigmentosa
- VF, visual fields
- retinitis pigmentosa
- fundus autofluorescence
- image analysis
- scanning laser ophthalmolscopy
Fundus autofluorescence (AF) imaging using a scanning laser ophthalmoscope is a non-invasive technique that has proved useful in numerous recent studies of inherited and acquired retinal disease in humans.1–8 The major fluorophore (lipofuscin) accumulates in pigment epithelial cells and is derived from photoreceptor outer segments. Some patients with retinitis pigmentosa (RP) have abnormal fundus AF in the form of a parafoveal ring of high density that is not visible on routine ophthalmoscopic examination and that varies in size between patients.9–11 The size of the high density ring correlates with the amplitude of the pattern electroretinogram (PERG) P50 component in patients with good visual acuity,9,12 indicating differing degrees of cone system preservation over areas of central macula. Psychophysically determined sensitivity losses are consistent with the distribution of these high density annuli of fundus AF and with PERG data. Hyper-autofluorescent areas represent a transition between abnormal paracentral and normal central cone system function10,11 and correspond with the internal edge of visual field loss. The question of whether the ring is stationary or may represent a progressive phenomenon has not yet been satisfactorily addressed.
Multifocal ERGs (mfERG) are mathematically derived cone driven responses associated with localised retinal areas across the posterior pole. Stimulus elements within a hexagonal array are activated according to a rapid pseudo-random binary sequence (m-sequence) and the resultant continuous ERG signal is cross correlated with the area stimulated. The technique has proved increasingly popular in the assessment of localised photopic function in retinal disorders, including RP, but few studies have made a direct comparison between mfERG and other indices of macular function.
The main objectives of the current study were to examine the relation between mfERGs, PERGs, visual fields, and psychophysical tests of photoreceptor sensitivity (photopic and scotopic fine matrix mapping) in patients with RP that manifest an AF ring in order to establish the functional significance of the ring and further to determine whether the characteristics of the ring change with time.
METHODS
Twenty one patients were examined. All had a Snellen visual acuity of 6/9 or better, a clinical diagnosis of RP supported by ISCEV standard full field ERGs,13 and abnormal AF of the posterior pole in the form of a high density parafoveal ring as an inclusion criterion. AF imaging was performed1,14 and AF rings measured according to previously described techniques.3,9 AF imaging was repeated in 12 patients after a period of between 2 years and 5 years. The tenets of the declaration of Helsinki were followed and the study was approved by the local ethics committee.
Photopic fine matrix mapping was performed in six cases according to previously described techniques.11 Photopic sensitivity was tested at 1 degree intervals within a 9×9 degree area. Subjects signalled detection thresholds using a push button control. The matrix was positioned over the retinal area of interest, usually covering areas of abnormal AF, and aligned according to the position of the blind spot. Sensitivities were shown as contour plots, illustrating the position and orientation of test matrices, and as three dimensional threshold profiles plotted using interpolated values at 0.25° intervals, obtained by Gaussian filtering. Scotopic fine matrix mapping was performed over identical retinal locations following pupil dilation (tropicamide 1%) and 40 minutes of dark adaptation.
Pattern ERGs evoked by high contrast checkerboard reversal were recorded from all patients according to the ISCEV standard15 and in six cases using circular fields of different diameters (3°, 6°, 9°, 12°, and 18°) presented to each patient in random sequence; check size was 45′ or 23′, Michelson contrast was 0.98.9
MfERGs were elicited using an array of 61 hexagonal stimulus elements (RETiscan System; Roland Consult, Wiesbaden, Germany) subtending a maximum visual angle of 57 degrees and recorded using gold foil corneal electrodes. Pupils were dilated with 1% tropicamide and/or phenylephrine (2.5%). The viewing distance was 33 cm and refractive errors were corrected. Four radially orientated cross hairs aided fixation and responses were recorded binocularly. Detailed methods have been previously described.16,17 As fundus AF abnormalities were concentric, mfERGs were additionally analysed by examining summated responses12,18 related to stimulus rings associated with the central 1, 7, 19, and 61 stimulus elements and by assessing mean responses associated with four concentric stimulus rings.12 In this study, the lower limit of normal for the mfERG P1 amplitude was defined as the smallest value obtained in an age matched healthy population minus 5% of the reference interval.
RESULTS
The main clinical findings are summarised in table 1. Full field ERGs and pattern ERGs from three representative patients (A–C) and from a normal subject (D) are shown in figure 1. The full field ERGs in the patients are consistent with rod-cone dystrophy (RP). Pattern ERG P50 components varied in amplitude according to the degree of macular involvement. All patients had a parafoveal ring of high density as an inclusion criterion.
Summary of clinical features of 21 patients with retinitis pigmentosa included in the study

Full field ERGs and pattern ERGs from the right eye of three patients with rod-cone dystrophy (A–C) and in a normal subject (D).
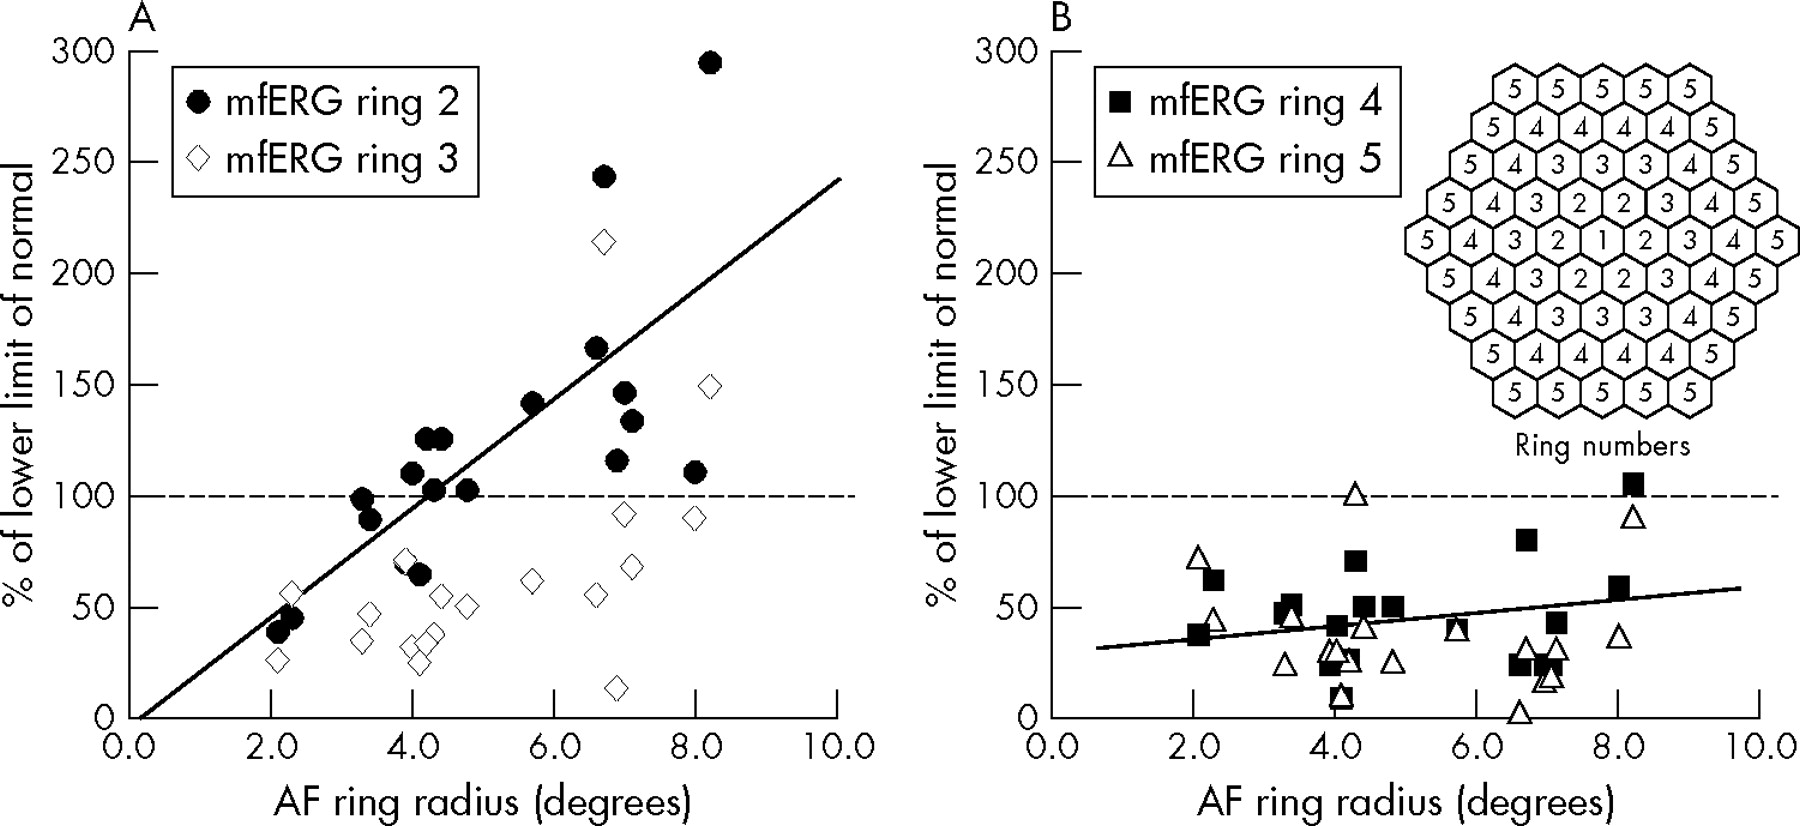
MfERGs associated with the central stimulus element are preserved in all 20 patients tested but show abnormal reduction over paracentral areas. Figure 2 shows multifocal ERGs and fundus AF images obtained from the same three representative patients shown in figure 1A–C and from a normal subject (fig 1D). The mean eccentricity at which significant mfERG reduction occurs varied between subjects. Figure 3 compares the internal radius of AF rings with the mean mf ERG P1 amplitude for each of stimulus rings 2, 3, 4, and 5. The hexagonal stimulus elements of ring 2 subtend a minimum and maximum angle (2–7 degrees) that encompasses the internal border of 18/20 high density AF arcs. Subnormal responses are associated with small AF rings; P1 amplitude correlated with AF ring radius (fig 3A, ring 2, r = 0.74). Responses associated with stimulus rings 3, 4, and 5 (figs 3A and B) show less correlation with abnormal AF (r = 0.55, 0.24, and 0.11, respectively) and greater reduction with eccentricity. Figure 4 summarises data from all 20 subjects by comparing AF ring size with the spatial extent of normal mfERGs. There is a positive relation between ring size and the maximum mean eccentricity of response preservation for both mfERG P1 (slope = 1.4, correlation coefficient r = 0.73) and N1 (slope = 1.4, r = 0.74) components. The slope of the linear regression is greatly influenced by a single datum point representing the spatial extent of mfERG P1 preservation in a subject with the largest ring (fig 4). This patient had the highest amplitude central mfERG, the most eccentric preserved response was only marginally within normal limits (<5%) and it is notable that if this were regarded as subnormal, the slope would be close to unity (r = 0.75, slope = 1.1).

Multifocal ERGs and corresponding AF images from three patients with retinitis pigmentosa (A–C) and from one normal subject (D). Corresponding full field ERGs and pattern ERGs are shown in figure 1 for the same patients.

Comparison of the internal radius of AF rings with the mean mf ERG P1 amplitude for each of stimulus rings 2 and 3 (A) and rings 4 and 5 (B). All but 2/20 AF rings had internal radii within the annular stimulus area of ring 2 (A). Inset in (B) shows the numbering and concentric arrangement of hexagonal rings; actual stimulus dimensions are shown in figure 4.

Dimensions of the mfERG stimulus array (A); mean eccentricity was measured horizontally to the centre of hexagonal stimulus elements arranged concentrically in one of four rings. Comparison of AF ring radius with the maximum mean eccentricity associated with normal mfERGs (B).
AF images, small field pattern ERGs, mfERGs, Humphrey visual fields, and photopic and scotopic fine matrix mapping are compared in two of six representative cases that were tested comprehensively (figs 5, 6, and 7C–F). Pattern ERGs to small diameter checkerboards are present but the expected enlargement seen in normal subjects does not occur when the stimulus diameter exceeds the size of the AF ring (figs 5B and 6B). The eccentricity at which this occurs is related to the area of central photopic visual field preservation, as shown by high spatial resolution fine matrix mapping (fig 7C and E) and Humphrey visual field testing (figs 5C and 6C). Scotopic sensitivity loss encroaches into areas within the high density rings (fig 7D and 7F). Multifocal ERGs corresponding to areas within the AF rings show relative preservation (figs 5D and 6D) and in one case show additional preservation over the most eccentric area corresponding with a crescent of visual field preservation (fig 6C).

Fundus autofluorescence (A), Humphrey visual fields (C) and multifocal ERGs (D) in a patient with rod-cone dystrophy and normal visual acuity. The graph shows PERG P50 amplitude to different sizes of circular checkerboard (B); mean normal values are shown for eight subjects. Error bars show 1 SD either side of the mean.

Fundus autofluorescence (A), Humphrey visual fields (C) and multifocal ERGs (D) in a patient with rod-cone dystrophy and normal visual acuity. The graph shows PERG P50 amplitude to different sizes of circular checkerboard (B); mean normal values are shown for eight subjects. Error bars show 1 SD either side of the mean.

Contour sensitivity plots obtained in one normal subject (column 1) and in the same three patients described in figures 5, 6, and 10 (columns 2, 3, and 4) under photopic (row 1) and scotopic (row 3) conditions. Three dimensional threshold plots represent values obtained at corresponding retinal locations under photopic (row 2) and scotopic (row 4) conditions. Labelling (x) shows correspondence between the orientation of contour and threshold plots. Abscissa shows retinal location (degrees), ordinate axes show threshold (log units). Three dimensional plots in column 1 show averaged data from 10 (photopic) and eight (scotopic) normal subjects.
Figure 8 compares PERG P50 amplitude in 20 patients with the summed amplitude of mfERG P1 components associated with the central 1, 7, 19, or 61 stimulus elements. Highest correlation is seen when the PERG P50 is compared with the sum of responses associated with the central 7 or 19 stimulus elements. Perhaps not surprisingly, correlation is lower when eccentric mfERGs are included in the comparison (see Discussion).
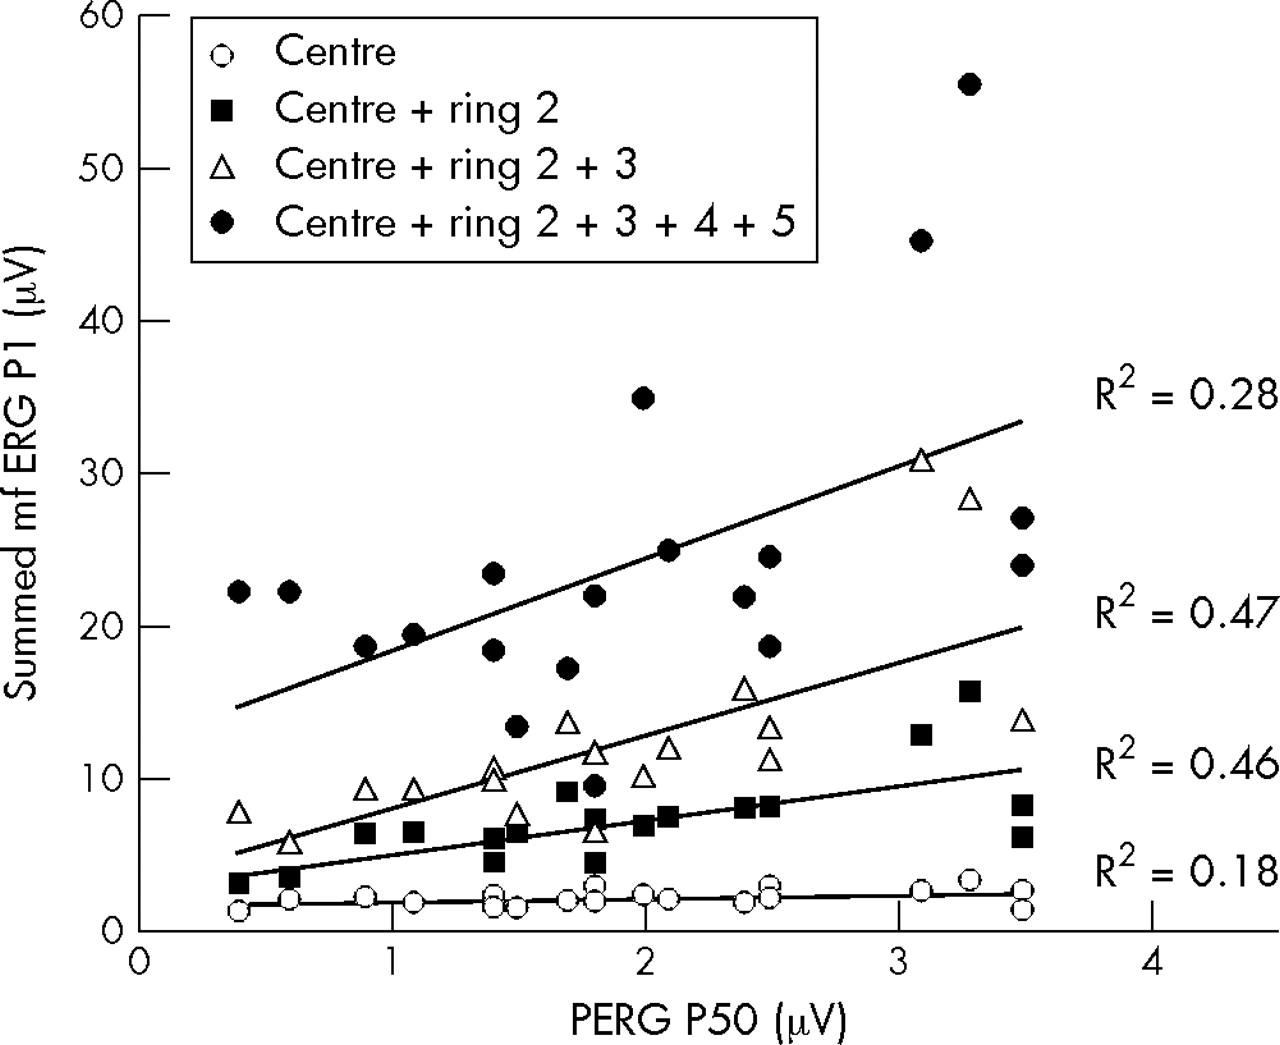
Comparison of PERG P50 amplitude with the sum of mfERG P1 components associated with the central 1, 7, 19, and 61 stimulus elements.
In nine of 12 patients the AF rings showed no detectable change over periods of between 2 years and 5 years. The pattern ERG P50 component amplitude in 6/6 of these cases remained stable (data not shown). However, 3/12 patients showed reduction in the size of the AF ring (fig 9). The internal radii of the high density rings show evidence of progressive constriction with time. In two cases with type 2 Usher syndrome (fig 9A and B) the ring also became progressively narrower. One of these patients (fig 9A, patient 6 in table 1) underwent serial visual field and pattern ERG testing. Small field pattern ERG recordings showed evidence of progressive functional loss over a 2 year period, congruous with AF ring and visual field constriction (fig 10). Standard pattern ERGs did not fall outside the normal range but were 20% smaller than those recorded 2 years earlier. The patient remained subjectively and clinically stable with normal visual acuity (6/6 bilaterally) over the same period. Baseline fine matrix mapping was not performed but recent testing revealed close correspondence between photopic sensitivity loss and areas outside the ring (fig 7G). Scotopic losses encroached upon more central areas (fig 7H).
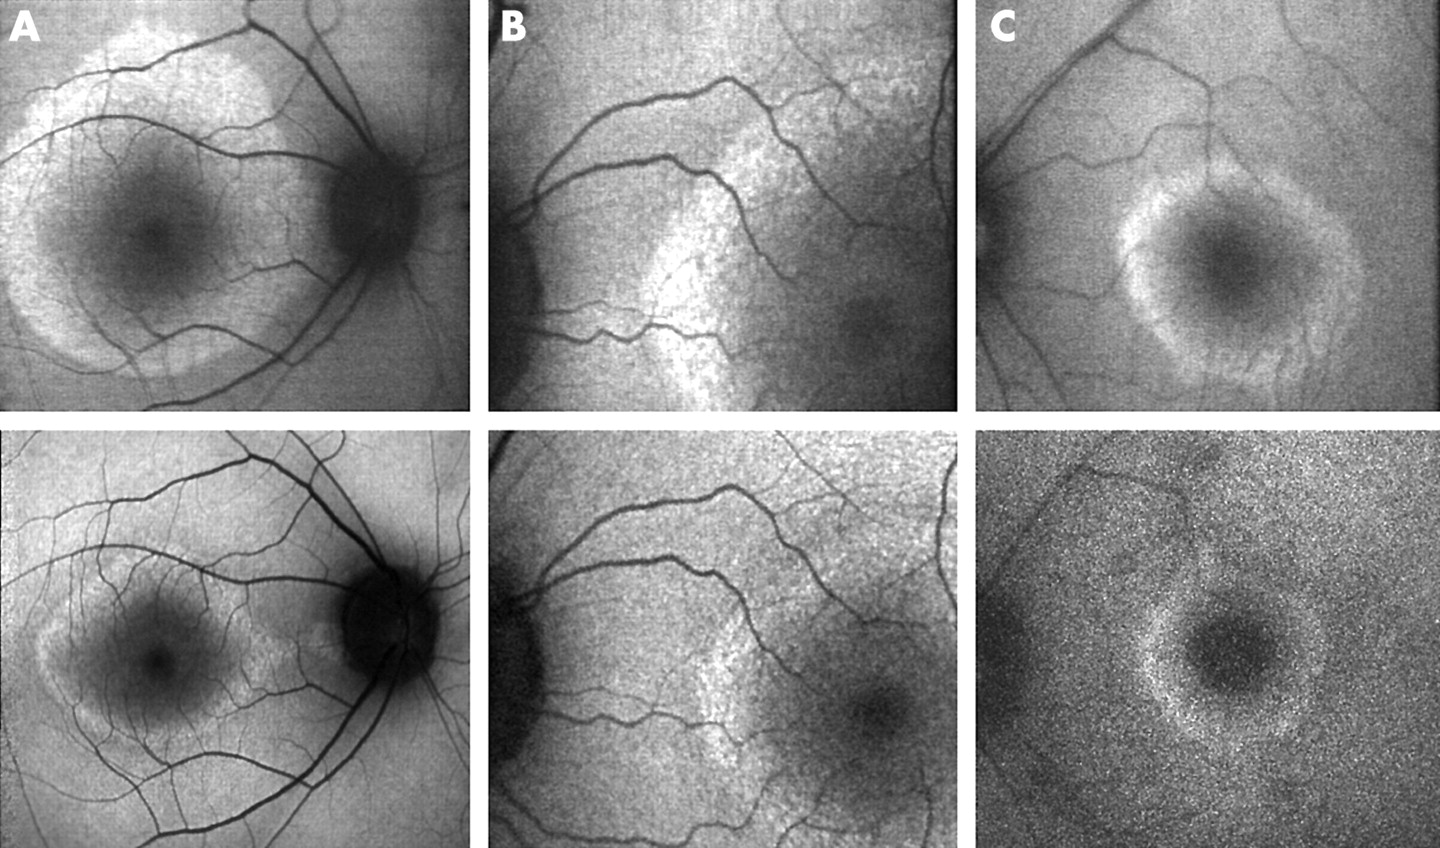
AF images in three patients with rod-cone dystrophy and normal visual acuity (columns A–C). AF images on the second row were obtained from the same patients after 2, 3, and 4 years respectively. Clinical details are given in the text and in table 1 (cases 6, 7, and 21).

Comparison of AF images, pattern ERGs and Humphrey visual fields in a patient with Usher syndrome (type 2). Pattern ERG and AF testing was repeated after 24 months. Error bars show 1 SD either side of the mean. Clinical details are described in table 1 (patient 6) and in the text. Photopic and scotopic fine matrix maps from the same patient are shown in figure 7G and H.
DISCUSSION
This study demonstrates correlation between the spatial extent of mfERG preservation and the radius of the paracentral AF ring that is present in some patients with RP and good visual acuity (figs 2–6). This correlation provides objective evidence that cone system function is preserved over central macular areas encircled by abnormal high density AF. Furthermore, the distribution of mfERG reduction is spatially concordant with underlying metabolic disturbance at the level of the RPE. The mfERG data are consistent with pattern ERG and psychophysical data (figs 5–7), and extend the findings of previous studies that have shown a relation between coarse measures of paracentral visual field loss and mfERG reduction in patients with RP,19–22 but which did not examine underlying AF.
Few studies have attempted to compare mfERGs with more established techniques. Correspondence between summed mfERGs associated with the central stimulus elements and ISCEV standard PERGs arising from similar central areas illustrates the utility of the technique in the assessment of macular cone system function (fig 8) and corroborates recent attempts to compare these parameters.12 Highest correlation is seen when the PERG P50 is compared with the sum of mfERGs associated with the central seven or 19 stimulus elements. Correlation is lower when more eccentric mfERGs (responses to 61 stimulus elements) are included in the comparison. This may be explained by eccentric areas of visual field preservation and spared retina, evident in some patients (fig 6C), that contribute to the mfERG (fig 6D) but not to the PERG. This is in keeping with previous studies that have shown no correlation between PERG P50, an established and widely used parameter of macular function,23 and the severity of full field ERG abnormalities in patients with RP and normal visual acuity.9 Scotopic sensitivity over central areas within the AF ring is abnormal (fig 7), but this has no detectable impact on PERG or mfERG measures of macular function.
MfERGs in the current study were obtained using a relatively coarse 61 stimulus element array that gives a high signal:noise ratio, allowing rapid recording. Despite the low spatial resolution, high correlation was found between mfERG and AF ring size (fig 4). It would be anticipated that the slope of this relation would be close to unity (see Results), in keeping with sharp demarcation between normal and markedly abnormal photopic function across the ring of high density. Errors may also arise from asymmetries in the shape of rings and correlation is likely to be higher if a finer mfERG stimulus array is employed. The spatial concordance between sensitivity loss and the ring is confirmed by high spatial resolution fine matrix mapping (fig 7).
It has been suggested that the ring of AF may be a relatively late manifestation of slowly advancing RP and that constriction of the ring may mirror progressive visual field loss, led by encroaching rod dysfunction and consequent cone dysfunction over more central macular areas.11,12 Evidence from single pedigrees also suggests a relation between age and ring size.9,24 The current longitudinal study establishes for the first time that rings of high density constrict progressively in some patients and that this constriction may be detectable after a relatively short period. In some cases the width of the ring arc also shows significant narrowing (fig 9). Additional quantification of AF intensity was not performed in the current study. Such measurements may have specific applications14,25,26 but are dependent upon accurate conversion and calibration of the AF image grey scale10,26 and on high quality fundus illumination that may be difficult to obtain in some patients.10,14,26 Preliminary investigations in patients with RP have outlined factors that confound accurate quantification of AF intensity10 and warrant further investigation. Such considerations do not lessen the diagnostic utility of the technique, as demonstrated in numerous other studies.
Progressive ring constriction is associated with worsening macular function (fig 10). Repeat mfERGs were not performed but serial PERG and VF testing indicates advancing dysfunction that encroaches over areas of central macula, as predicted by earlier psychophysical studies.11 As the ring becomes smaller there may be cone dysfunction over central areas eventually resulting in reduced central acuity. This is currently being investigated in other cases. The emission spectrum of AF is similar to that of lipofuscin and high density areas represent abnormal accumulation. It is possible that restoration of normal AF intensity over concentric areas outside the ring indicates continued but possibly impaired phagocytosis and removal of abnormal material, or could be explained by loss of photoreceptor cells. It is not known whether normal intensity is maintained, as in some adult patients with Leber congenital amaurosis with lifelong retinal dysfunction but with normal or near normal levels of AF.24 Prognosis for retention of central vision may be better in patients with large or slowly changing rings. The absence of detectable AF ring constriction in other patients with normal visual acuity may reflect milder or less progressive macular involvement. In patients with RP and normal visual acuity, the ring may be of prognostic value in predicting the retention of central visual function. In addition, changes in the ring might be a useful measure of therapeutic effects if treatment is initiated for RP. It is, however, not understood why such a ring is not found in all RP patients with clinical evidence of macular sparing.
CONCLUSION
MfERGs correlate with PERG and threshold measures of macular function in patients with RP and normal visual acuity and enable objective assessment of retinal areas responsible for visual field loss related to underlying metabolic disturbance. Serial testing establishes that these rings show marked progressive constriction in some patients that is associated with corresponding functional loss.
Acknowledgments
AGR is supported by The Foundation Fighting Blindness. We are grateful to Vy Luong, Magella Neveu, and to the electrophysiology technicians at Moorfields Eye Hospital. Roland Consult is thanked for mfERG facilities.