Article Text

Abstract
Introduction This longitudinal study aims to characterize distinct body mass index (BMI) trajectories during early to mid-life adulthood and to explore the association between BMI change from young adulthood to midlife and incident diabetes.
Research design and methods This study included 7289 adults who had repeatedly measured BMI 3–9 times during 1989–2011 and information on incident diabetes. Latent class growth mixed model (LCGMM) was used to identify different BMI trajectories. Cox proportional hazard models were used to investigate the association between the trajectory group membership and incident hyperglycemia, adjusting for covariates. The hyperglycemia group included individuals with prediabetes or diabetes. The model-estimated BMI levels and slopes were calculated at each age point in 1-year intervals according to the model parameters and their first derivatives, respectively. Logistic regression analyses were used to examine the association of model-estimated levels and slopes of BMI at each age point with incident hyperglycemia. The area under the curve (AUC) was computed from longitudinal growth curve models during the follow-up for each individual. Prior to the logistic regression analyses, quartiles of total, baseline, and incremental AUC values were calculated.
Results Three distinct trajectories were characterized by LCGMM, comprising of low-increasing group (n=5136), medium-increasing group (n=1914), and high-increasing group (n=239). Compared with the low-increasing group, adjusted HRs and 95% CIs were 1.21 (0.99 to 1.48) and 1.56 (1.06 to 2.30) for the medium-increasing and the high-increasing group, respectively. The adjusted standardized ORs of model-estimated BMI levels increased among 20–50 years, ranging from 0.98 (0.87 to 1.10) to 1.19 (1.08 to 1.32). The standardized ORs of level-adjusted linear slopes increased gradually from 1.30 (1.16 to 1.45) to 1.42 (1.21 to 1.67) during 20–29 years, then decreased from 1.41 (1.20 to 1.66) to 1.20 (1.08 to 1.33) during 30–43 years, and finally increased to 1.20 (1.04 to 1.38) until 50 years. The fourth quartile of incremental AUC (OR=1.31, 95% CI 1.03 to 1.66) was significant compared with the first quartile, after adjustment for covariates.
Conclusions These findings indicate that the BMI trajectories during early adulthood were significantly associated with later-life diabetes. Young adulthood is a crucial period for the development of diabetes, which has implications for early prevention.
- body mass index
- hyperglycemia
- weight change
- longitudinal studies
This is an open access article distributed in accordance with the Creative Commons Attribution Non Commercial (CC BY-NC 4.0) license, which permits others to distribute, remix, adapt, build upon this work non-commercially, and license their derivative works on different terms, provided the original work is properly cited, appropriate credit is given, any changes made indicated, and the use is non-commercial. See: http://creativecommons.org/licenses/by-nc/4.0/.
Statistics from Altmetric.com
Significance of this study
What is already known about this subject?
Previous studies have reported that different patterns of weight gain were associated with diabetes. Few studies have explicitly investigated the clinical significance of body weight change during young adulthood in developing strategies for the early prevention and intervention of diabetes.
What are the new findings?
We identified three distinct body mass index (BMI) trajectories associated with incident diabetes significantly. The velocity of body weight change during young adulthood significantly affects the development of later-life diabetes, independently of the BMI levels. Though baseline BMI level demonstrates good performance in indicating diabetes, the long-term trends of BMI cannot be ignored.
How might these results change the focus of research or clinical practice?
This current study proposed BMI trajectory parameters as an indicator of later-life diabetes. Young adulthood is a potentially critical period for weight control during early to mid-life adulthood. Public health interventions for controlling modifiable risk during young adulthood would reduce the future burden of diabetes among Chinese population.
Introduction
Because of the huge social and economic transformation, the prevalence of type 2 diabetes has increased substantially among Chinese population.1-3 Obesity is a well-known risk factor for insulin resistance and type 2 diabetes.4 A high body mass index (BMI) is the most important individual risk factor related to Chinese diabetes burden.5 Over the last few decades, longitudinal studies enhanced our understanding of the relationship between body weight change and diabetes.6–8 Despite evidence emphasized the critical nature of different patterns of weight gain in the development of diabetes, most of the previous studies were restricted in a few measurement occasions, ignoring dynamic trends in body weight gain over the life-course.
Six large community-based prospective cohorts identified that young adult exposures to major modifiable risk factors for cardiovascular disease (CVD) were associated with increased CVD risks in later life, independent of later adult exposures.9 Except for the absolute level of BMI, longitudinal BMI trajectory across the life-course also plays an important role in the development of diabetes.10–14 However, it is unclear whether the dynamic trends in body weight gain contribute to future diabetes risk, especially during young adulthood. We hypothesized that the velocity of body weight change during young adulthood was significantly associated with the development of diabetes in later life, independent of BMI absolute values. There is still a great deal to learn about the clinical significance of the BMI trajectory parameters in developing strategies for the early prevention and intervention of diabetes.
Using data from the China Health and Nutrition Survey (CHNS), we aim to identify distinct trajectories during early to mid-life adulthood (20–50 years), explore the association of BMI trajectories with incident diabetes, and determine the potential critical period for the development of diabetes related to rate of change in BMI.
Research design and methods
Study cohort
The CHNS is an ongoing longitudinal cohort implemented by national and local governments.15 16 It is designed to understand how the social and economic transformation of Chinese society affects the health and nutritional status of Chinese population. A multistage, random cluster process was used to collect data from Beijing, Chongqing, Guangxi, Guizhou, Heilongjiang, Henan, Hubei, Hunan, Jiangsu, Liaoning, Shaanxi, Shandong, Shanghai, Yunnan, and Zhejiang. Nine cross-sectional surveys have been completed during 1989–2011, covering 4400 households with 33 348 individuals.
In the longitudinal cohort, we excluded individuals with missing information in BMI (n=1826), prevalent diabetes and/or prediabetes at baseline (n=353), less than three follow-up visits (n=9230), and younger than 20 years old or older than 50 years old (n=14 650). After exclusion, 7289 adult subjects, who repeatedly visited 3–9 times, were included in this current study. The mean follow-up year was 11.35 years (range=3.6–22.0 years). BMI data after the onset of hyperglycemia (outcome) were excluded in analyses. Online supplementary figure S1 shows the study population selection process. Online supplementary table S1 presents excluded respondents (n=26 059) who were generally younger, with lower baseline BMI, lower proportion of smokers, and were alcohol consumers.
Supplemental material
General examinations
At each follow-up, standing height was measured without shoes to the nearest 0.2 cm using a portable SECA stadiometer (SECA, Hamburg, Germany). Weight in light clothing without shoes was measured to the nearest 0.1 kg on a dedicated scale that was routinely calibrated. BMI was calculated as weight in kilograms divided by height in meters squared. Smoking was defined as ever smoking cigarettes (including hand-rolled or device-rolled). Alcohol drinking was defined as alcohol consumption (including beer, liquor, or wine)≥25 g (for male) or ≥15 g (for female) per week.
Outcome measures
The biomarker data were only collected in 2009 CHNS survey. All adult subjects were required to collect 12 mL blood (in three 4 mL tubes) after overnight fasting. Serum glucose (the glucose oxidase method) and whole HbA1c were measured by an automatic clinical chemistry analyzer (model HLC-723G7; Tosoh, Tokyo, Japan). Diabetes was defined as self-report of diabetes and/or fasting blood glucose ≥7.0 mmol/L and/or HbA1c≥6.5% (48mmol/mol) and/or taking glucose-lowering medication including: (1) special diet; (2) weight control; (3) oral medicine; (4) injection of insulin; (5) Chinese traditional medicine; (6) home remedies; and (7) Qi Gong (spiritual method); prediabetes was defined as a fasting blood glucose level of 5.6–6.9 mmol/L and/or a HbA1c level of 5.7%–6.4% (39–46 mmol/mol).17 The hyperglycemia group included subjects with diabetes or prediabetes. Data for incidence of self-reported diabetes and glucose-lowering medication were first collected in 1997 and subsequently in 2000, 2004, 2006, 2009, and 2011 survey. Serum glucose and whole HbA1c were only measured in 2009 survey.
Statistical methods
Characteristics across different groups were assessed using Student’s t test or Wilcoxon rank sum test as appropriate for continuous variables and χ² test for categorical variables. Cox proportional hazard models were used to explore the association between the trajectory group membership and incident hyperglycemia, with unadjusted (Model 1), adjusted for baseline age, gender, and BMI (Model 2), and adjusted for baseline age, gender, BMI, smoking, and alcohol drinking (Model 3).
The latent class growth mixed model (LCGMM) was used to identify different trajectory patterns of BMI.18 The latent class trajectories of BMI were specified as a function of age (centered to 37 years, the mean age of the cohort). In the modeling process, we included sex as covariate to adjust the pattern difference between sex. Multiple LCGMMs with different trajectory shapes including linear and nonlinear parameters were tested using the strategy we previously described in the online supplementary material.19 The LCGMM computes estimation of the quadratic curve parameters, including fixed effect parameters (for a group) and random-effect parameters (individual specific). The random effect coefficients represent the difference between the fixed effect parameters and the observed values for each individual. The model-estimated BMI levels and linear slopes were calculated at each age point in 1-year intervals according to the model parameters and their first derivatives, respectively.
Logistic regression analyses were used to examine the association of model-estimated levels and linear slopes of BMI at each age point with incident hyperglycemia. Prior to logistic regression analyses, the model-estimated linear slope values of BMI at each age point were adjusted for their corresponding BMI levels and covariates mentioned above by regression residual analyses to avoid collinearity of levels and linear slopes in the same model. Standardized ORs of levels and level-adjusted slopes of BMI for incident hyperglycemia were estimated.
Long-term burden and trends of BMI were measured as the area under the growth curve. The area under the curves (AUCs) were calculated as the integral of the LCGMM curve parameters during the follow-up period in each subject. Since individuals had different follow-up periods, the AUC values were divided by the number of follow-up years. Total AUC can be considered a measure of a long-term cumulative burden. Incremental AUC, which represents a combination of linear and nonlinear longitudinal trends, was calculated by subtracting the estimated baseline AUC value of BMI from total AUC. We used these AUC measures in our previous studies.20–22 Logistic regression analyses were used to examine the association of baseline AUC and incremental AUC values with incident hyperglycemia. Prior to the logistic regression analyses, quartiles of total, baseline, and incremental AUC values were calculated.
Results
Table 1 summarizes baseline characteristics of study variables by incident hyperglycemia groups during follow-up. Incident hyperglycemic subjects (n=971) were more likely to be younger male with higher BMI, higher proportion of smokers, alcohol drinker, and longer follow-up years than normoglycemic subjects. Online supplementary table S1 summarizes baseline characteristics of participants included and excluded. Online supplementary table S2 presents follow-up characteristics of study variables by incident hyperglycemia at follow-up. Online supplementary table S3 presents the distribution of age of onset for the hyperglycemic group by sex.
Baseline characteristics by incident hyperglycemia at follow-up
Online supplementary table S4 presents LCGMM results of the model fitting process. We fitted models from one class to five classes of linear, quadratic, and cubic curves. According to statistical criteria above, a model of quadratic parameters with three classes was chosen as the best fit. Online supplementary table S5 presents parameter estimates for the best fitting 3-class quadratic latent class growth mixture model. Online supplementary table S6 shows model-estimated levels and linear slopes of BMI in means (SD) by incident hyperglycemia at follow-up.
Figure 1 shows the longitudinal trajectories of BMI during 20–50 years for 7289 individuals. Three distinct trajectories were characterized, labeled as low-increasing (70.46%, n=5136), medium-increasing (26.26%, n=1914), and high-increasing (3.28%, n=239). Compared with the low-increasing group, participants in the medium-increasing group had higher predicted BMI level at age 20 years and linear slopes from 20 years to 50 years. Participants in the high-increasing group had highest predicted BMI level at age 20 years and higher linear slopes from 20 years to 50 years. Online supplementary figure S2 shows predicted trajectories of BMI during young adulthood by sex.
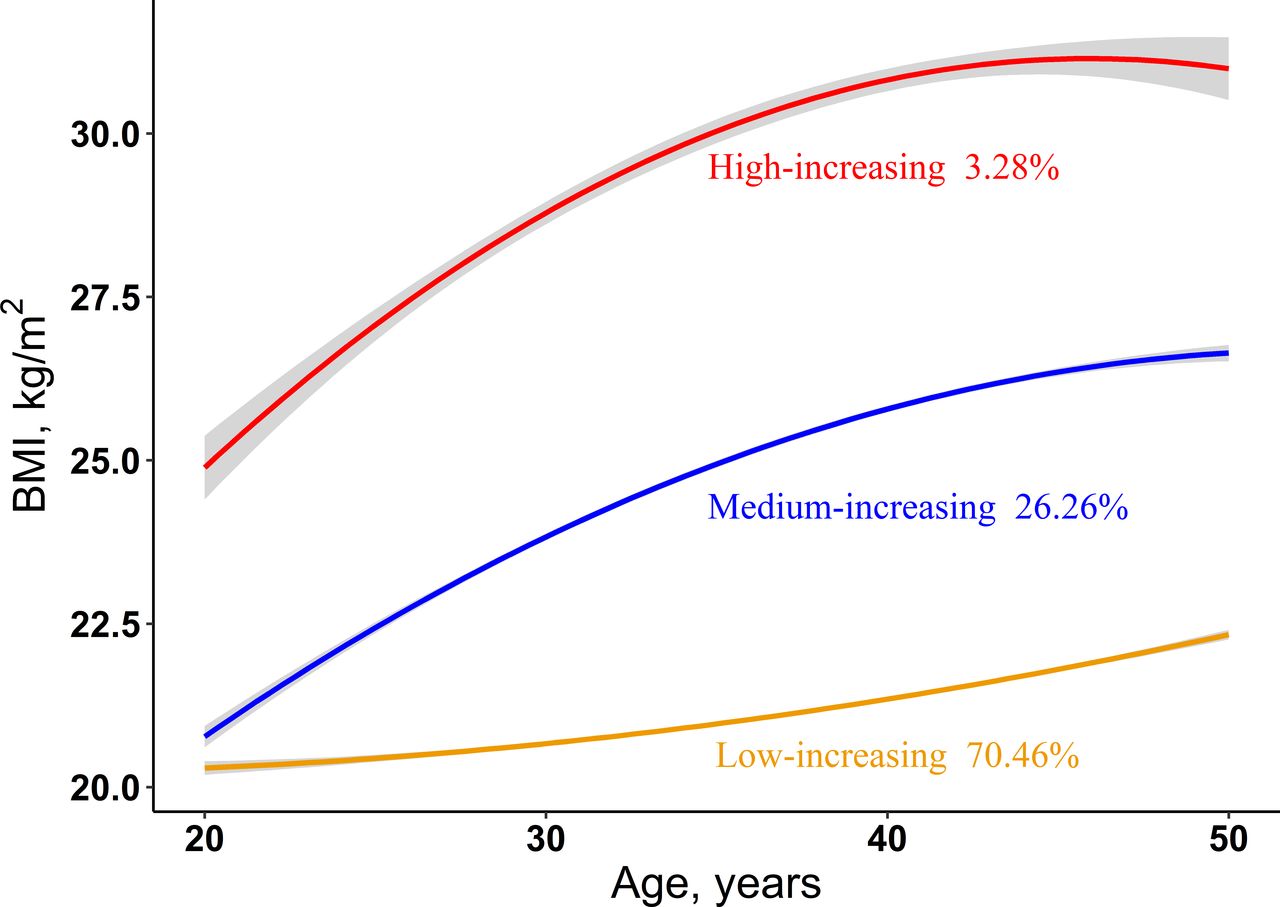
Predicted trajectories of BMI during young adulthood. The trajectories are shown in solid lines, and the 95% CIs were shown in shadow. The proportions in each trajectory are shown below solid lines. See detailed information on the curve parameters in supplemental table S4. BMI, body mass index.
Table 2 summarizes characteristics of study variables by the BMI trajectory classes. There were 971 hyperglycemic subjects, including 767 with prediabetes and 204 with diabetes. The incidence rates of hyperglycemia, prediabetes, and diabetes were significantly different among the three BMI trajectory groups (p<0.001). Compared with the low-increasing group, participants in the high-increasing group were younger, had higher baseline BMI levels, shorter follow-up years, lower proportion of smokers, and higher proportion of alcohol consumers (p<0.05). Online supplementary table S7 presents subgroup participants’ characteristics among three classes by hyperglycemia.
Characteristics of participants by the latent BMI pattern classes
Table 3 presents the association between the trajectory group membership and incident hyperglycemia among total, male, and female respondents. Compared with the low-increasing group, the unadjusted HRs (95% CI) for the medium-increasing group and the high-increasing group were 1.66 (1.45 to 1.89) and 3.74 (2.95 to 4.74), respectively. After adjusting for baseline age, sex, and BMI, the HRs (95% CI) for the medium-increasing group and the high-increasing group were 1.31 (1.13 to 1.52) and 1.97 (1.45 to 2.67), respectively. A significant relationship between the trajectory group membership and risk of incident hyperglycemia was found after adjusting for baseline age, sex, BMI, smoking, and alcohol drinking, with adjusted HRs of 1.21 (0.99 to 1.48) and 1.56 (1.06 to 2.30) in model 3. Model 1 showed a strong association of the trajectory group membership and incident hyperglycemia among male respondents, and the HRs were 1.94 (1.62 to 2.33) and 4.54 (3.20 to 6.45) for the medium-increasing group and the high-increasing group, respectively. The association remains significant after adjusting for baseline age and BMI, with HRs 1.42 (1.16 to 1.74) and 1.72 (1.09 to 2.74). But only model 1 showed significant association between the trajectory group membership and incident hyperglycemia among female respondents, with HRs 1.41 (1.16 to 1.70) and 3.14 (2.27 to 4.33) for the medium-increasing group and the high-increasing group, respectively.
HRs and 95% CIs of BMI trajectory groups for incident hyperglycemia
Online supplementary table S8 shows HRs of BMI trajectory groups for incident prediabetes (n=767) and diabetes (n=204). Compared with the low-increasing group, the medium-increasing group and the high-increasing group had higher risk of developing prediabetes (HR=1.55, 95% CI 1.33 to 1.79 and HR=2.91, 95% CI 2.15 to 3.95) and diabetes (HR=2.19, 95% CI 1.63 to 2.94 and HR=7.46, 95% CI 4.93 to 11.30). After adjusting for age, sex, and baseline BMI, the medium-increasing group and the high-increasing group were significantly associated with increased risk of prediabetes (HR=1.29, 95% CI 1.09 to 1.52 and HR=1.76, 95% CI 1.22 to 2.55) and diabetes (HR=1.40, 95% CI 1.00 to 1.97 and HR=2.45, 95% CI 1.32 to 4.56). Online supplementary table S9 presents linear correlation between model-estimated levels and linear slopes by age. Linear correlation coefficients between model-estimated BMI levels and slopes increased gradually from 0.64 to 0.82 during 20–30 years, then decreased from 0.81 to 0.13 during 31–41 years, and finally increased negatively to −0.68 until 50 years.
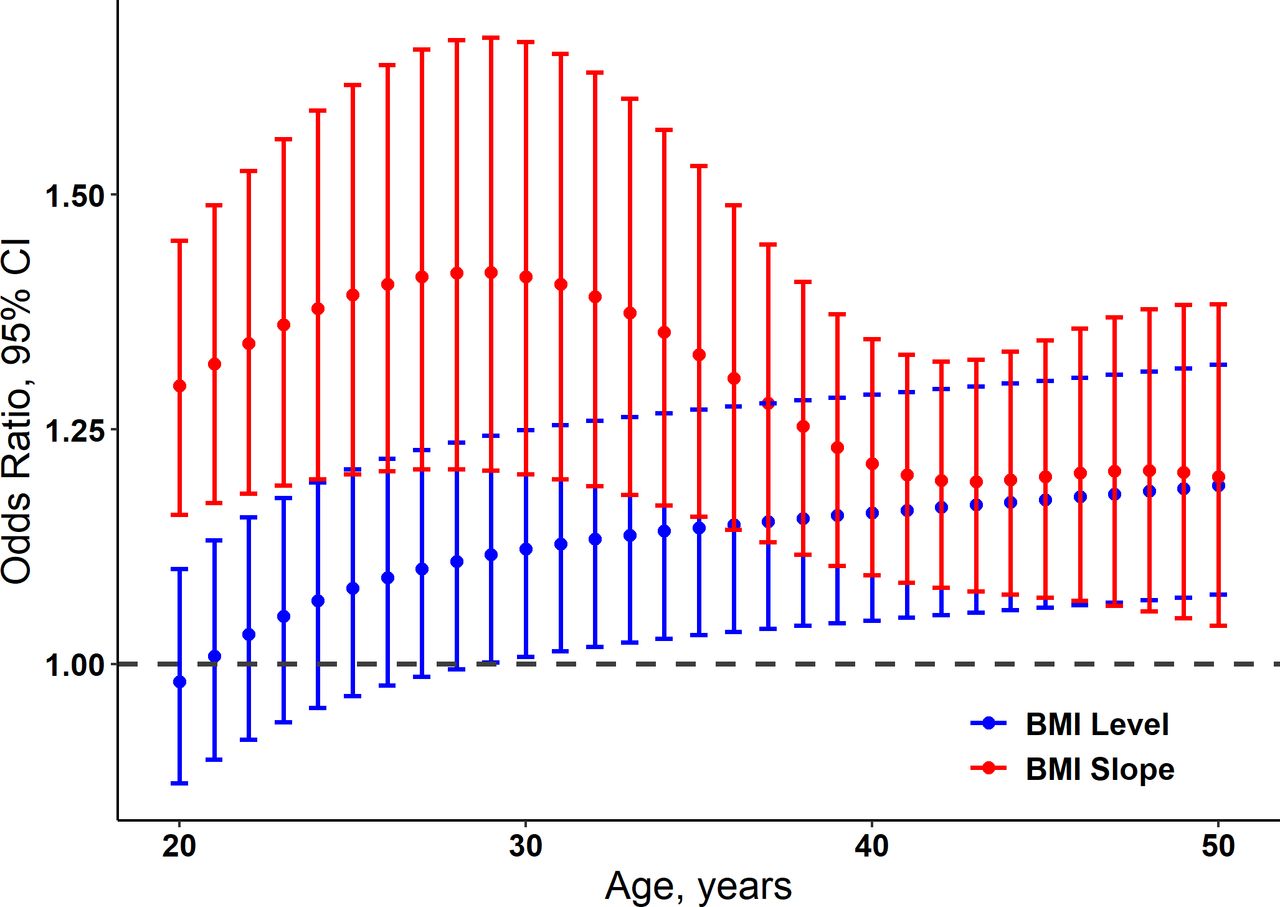
Figure 2 shows ORs and 95% CIs of model-estimated levels and level-adjusted linear slopes of BMI for incident hyperglycemia, with adjustment for baseline sex, smoking, and alcohol drinking. The standardized ORs of model-estimated BMI levels increased among 20–50 years, ranging from 0.98 (0.87 to 1.10) to 1.19 (1.08 to 1.32). The association between model-estimated BMI levels and incident hyperglycemia became positive at age 21 years or above. No significant association was found during 20–28 years. The standardized ORs of level-adjusted linear slopes increased gradually from 1.30 (1.16 to 1.45) to 1.42 (1.21 to 1.67) during 20–29 years, then decreased from 1.41 (1.20 to 1.66) to 1.20 (1.08 to 1.33) during 30–44 years, and finally increased to 1.20 (1.04 to 1.38) until 50 years. Significant association between level-adjusted linear slopes and hyperglycemia was found during 20–50 years. Online supplementary figure S3 shows standardized ORs and 95% CIs of model-estimated levels and level-adjusted linear slopes of BMI during young adulthood by age for incident hyperglycemia among males and females. Online supplementary figure S4 shows standardized ORs and 95% CIs of model-estimated slopes and levels of BMI during young adulthood by age for incident hyperglycemia.

Standardized ORs and 95% CIs of model-estimated levels and level-adjusted linear slopes of BMI during young adulthood by age for incident hyperglycemia, adjusted for sex, smoking, and alcohol drinking. BMI, body mass index.
Online supplementary table S10 shows the relationship between AUC quartiles of BMI growth curve and incident hyperglycemia. After adjusting for age, sex, smoking, and alcohol drinking, the adjusted ORs (95% CI) for the second, third, and fourth quartile of total AUC were 1.41 (1.05 to 1.89), 1.63 (1.23 to 2.17), and 2.25 (1.73 to 2.94), respectively. Compared with the first quartile, the ORs (95% CI) were 1.31 (0.98 to 1.74), 1.32 (0.99 to 1.77), and 2.10 (1.62 to 2.76) for the second, third, and fourth quartile of baseline AUC, respectively, adjusting for age, sex, smoking, and alcohol drinking. The fourth quartile of incremental AUC (OR=1.31, 95% CI 1.03 to 1.66) was significant compared with the first quartile, after additional adjustment for age, sex, smoking, alcohol drinking, and baseline AUC.
Discussion
In this community-based longitudinal study, we observed three distinct trajectories of BMI in early to mid-life adulthood that were significantly associated with increased risk of hyperglycemia throughout adulthood. Compared with low-increasing group, individuals with medium-increasing and high-increasing BMI trajectory have 1.21-fold and 1.56-fold risk of hyperglycemia, respectively. Further, a significant association between level-independent BMI slopes at 20–50 years and hyperglycemia was found. Observational studies have clarified the predictive value of weight change for the risk of diabetes.6 8 23–25 However, no previous studies have concurrently considered the importance of linear slopes and levels of BMI at different young adulthood age points for the prediction of diabetes. This study provides unique insights into origins of obesity-related diabetes in early adult life and emphasizes the importance of linear slopes and levels of BMI at different adulthood age points (20–50 years) for predicting diabetes risk in later life. Traditional obesity category may be insufficient to estimate the diabetes risk in this population. Even small changes produce a detrimental outcome in this population and thus researchers and clinicians need to pay attention on this. This observation was partially supported by the Bogalusa Heart Study which found that the associations between rate of change in childhood BMI and adult hyperglycemia were generally consistent across the four race-sex groups.26
The low-increasing group, taking the largest proportion, followed a stable increasing pattern which predicted that BMI remained within normal weight. Individuals in the medium-increasing group experienced an increasing pattern that led to overweight. The 3.28% adult subjects, labeled as high-increasing group, followed a rapidly increasing pattern that led to obesity. Our findings provide additional observation of life-course BMI trajectories during early to mid-life adulthood to previous studies. The Young Finns Study and the Bogalusa Heart Study identified five trajectories describing BMI trajectories from childhood to adulthood in the Cardiovascular Risk.26 27 De Rubeis V et al reported five BMI trajectories from adolescence to older adulthood.28 A longitudinal cohort in Chinese population characterized four distinct trajectory groups during adulthood associated with hypertension.19 To our knowledge, there are no studies that explored the relationship between longitudinal BMI profiles in early to mid-life adulthood and the development of diabetes among Asian population in later life.
The high-increasing group endured the largest risk of incident hyperglycemia in this study cohort. Individuals in the high-increasing group had the highest baseline BMI level and rate of weight gain. The unadjusted HR (95% CI) for the high-increasing group was 3.74 (2.95 to 4.74). After adjusting for age, sex, BMI, smoking, and alcohol drinking, the high-increasing group still was a well-established hyperglycemia risk factor. Consistent with previous study,26 the high rate of weight gain was associated with the high risk of diabetes, independent of confounding variables. The medium-increasing group showed higher risk of hyperglycemia compared with low-increasing group (HR=1.66 95% CI 1.45 to 1.89). The trends in HRs of trajectory group for prediabetes and diabetes were similar to these observations. The medium-increasing group and the high-increasing group had significant differences in risk of prediabetes (HR=1.55, 95% CI 1.33 to 1.79 and HR=2.91, 95% CI 2.15 to 3.95) and diabetes (HR=2.19, 95% CI 1.63 to 2.94 and HR=7.46, 95% CI 4.93 to 11.30).
The nearly double risk difference for hyperglycemia in three latent groups may be partly explained by long-term trends (incremental AUC) of BMI. The MELANY study reported that the incremental change in BMI unit was an additional independent predictor of diabetes (HR=1.083, 95% CI 1.063 to 1.105).14 Compared with the first quartile, the fourth quartile of incremental AUC (OR=1.31, 95% CI 1.03 to 1.66) was significantly associated with incident hyperglycemia. We found that baseline BMI level had higher OR than long-term trends of BMI, indicating that baseline BMI level predicts most of the risk of hyperglycemia. Though baseline BMI level is an indicator of incident diabetes, the long-term trends of BMI cannot be ignored.
In this study cohort, the standardized ORs of model-estimated BMI levels followed a persistent increasing pattern. After adjusting for age sex, smoking, and alcohol drinking, the standardized ORs increased among 20–50 years, ranging from 0.98 (0.87 to 1.10) to 1.19 (1.08 to 1.32). We found that the model-estimated and level-adjusted linear slopes of BMI among 20–50 years were significantly and positively associated with hyperglycemia, indicating that BMI slope remained a risk factor that was independent of model-estimated BMI level at the same age points. Though the association of rate of BMI growth and diabetes decreased with age between 30 and 43, our association analysis showed that the level-adjusted linear slopes had higher ORs than model-estimated BMI levels among 20–50 years. This phenomenon emphasized the clinical importance of taking BMI slopes into consideration when assessing the risk of diabetes in young adults. The downward trend during 30–43 was mainly due to the strong linear correlation between model-estimated levels and linear slopes. As the model-estimated BMI levels gradually increased to a certain level, the independent effects of slopes decreased in the development of later-life diabetes. BMI slope presents the velocity of body weight change. By analyzing level-adjusted BMI slopes, this current study captured a critical period at age 20–50 years, suggesting that individuals whose BMI increases rapidly during this period endure relatively higher risk of developing diabetes in later life. Thus, more attention should be paid on weight gain during young adulthood. Limited literature is available for comparison in this regard.
By using LCGMM for the trajectory analyses, long-term burden and trajectory parameters will be proposed, including slopes and the AUC, to identify the critical or sensitive periods during the development of diabetes. According to the life-course epidemiology theory, exposure at a specific period and cumulative exposure during life span can greatly affect the development of diseases later life. Our findings add to accumulating evidence that young adulthood is a critical period that when exposed to cardiovascular risk factors may eventually result in disease. Rapid body weight changes might lead to significant changes in other metabolic parameters,4 25 29 30 including glucose metabolism and lipid profiles. However, despite emphasis on early screening, little is known about awareness of these risk factors in young adulthood.31 As a consequence, a young adult experiencing rapid weight increase was more likely to develop diabetes.
This study has many strengths. We investigated this subject among Asian population with a relatively large cohort size and long follow-up years. Body weight and height were measured repeatedly at least three times, using a consistent study protocol. LCGMM allows us to characterize distinct trajectories and calculate BMI trajectory parameters to find a critical age period. Further, we estimated the association between different trajectory groups and diabetes. However, several limitations of this study need to be considered. First, outcome assessments were mainly according to self-report with only one biomarker data collected in 2009, leading to the incidence of diabetes being higher in the 2009 survey than other surveys, and the incidence of diabetes being underestimated throughout the CHNS, which may bias the logistic model and cox model results. This study did not distinguish adult subjects’ diabetes type. Second, healthy survivor bias may lead us to underestimate the magnitude of the excess diabetes risk attributable to BMI change. We only included adult subjects free of diabetes at baseline. Participants who experienced an event before entering into the cohort will be excluded from analysis, thereby underestimating the lifetime risk of diabetes events. Third, data were from Asian individuals, suggesting that our findings in this cohort may not be generalizable to other ethnic population.
Conclusion
The current study characterized three distinct trajectories during 20–50 years for 7289 individuals in the CHNS. A significant association between different trajectory groups and incident diabetes was found. Baseline BMI level and the long-term trends of BMI are indicators of incident diabetes. By analyses of the curve parameters, the velocity of body weight change during young adulthood affects the development of diabetes later life. More effective strategies in the prevention of diabetes should be emphasized among young adults. Public health intervention for controlling modifiable risk factors during young adulthood has the potential to reduce the future burden of diabetes.
Acknowledgments
The China Health and Nutrition Survey is a joint effort of many investigators and staff members whose contribution is gratefully acknowledged. We appreciate the CHNS participants and their families for the provision of data.
References
Footnotes
JL and BF are joint first authors.
Contributors JL, BF, TZ, and CS generated the hypothesis, directed implementation, and wrote the manuscript. AD contributed to analytic strategy and statistical analyses. MW, GZ, ZW, CS, and TZ supervised the field activities and data collection and edited the manuscript.
Funding This study was supported by grants from National Natural Science Foundation of China (81973147 and 81673271), Cheloo Young Scholars Program of Shandong University, and Shandong University multidisciplinary research and innovation team of young scholars (2020QNQT11 and IFYT18034).
Competing interests None declared.
Patient consent for publication Not required.
Ethics approval Study protocols were approved by the Institutional Review Committees of the University of North Carolina at Chapel Hill, NC, USA, and the China National Institute of Nutrition and Food Safety at the Chinese Center for Disease Control and Prevention, Beijing, China. Written informed consent was obtained from each study participants.
Provenance and peer review Not commissioned; externally peer reviewed.
Data availability statement Data are available in a public, open access repository.