Article Text

Abstract
Objective To examine the relationship between cycling injury severity and personal, trip, route and crash characteristics.
Methods Data from a previous study of injury risk, conducted in Toronto and Vancouver, Canada, were used to classify injury severity using four metrics: (1) did not continue trip by bike; (2) transported to hospital by ambulance; (3) admitted to hospital; and (4) Canadian Triage and Acuity Scale (CTAS). Multiple logistic regression was used to examine associations with personal, trip, route and crash characteristics.
Results Of 683 adults injured while cycling, 528 did not continue their trip by bike, 251 were transported by ambulance and 60 were admitted to hospital for further treatment. Treatment urgencies included 75 as CTAS=1 or 2 (most medically urgent), 284 as CTAS=3, and 320 as CTAS=4 or 5 (least medically urgent). Older age and collision with a motor vehicle were consistently associated with increased severity in all four metrics and statistically significant in three each (both variables with ambulance transport and CTAS; age with hospital admission; and motor vehicle collision with did not continue by bike). Other factors were consistently associated with more severe injuries, but statistically significant in one metric each: downhill grades; higher motor vehicle speeds; sidewalks (these significant for ambulance transport); multiuse paths and local streets (both significant for hospital admission).
Conclusions In two of Canada's largest cities, about one-third of the bicycle crashes were collisions with motor vehicles and the resulting injuries were more severe than in other crash circumstances, underscoring the importance of separating cyclists from motor vehicle traffic. Our results also suggest that bicycling injury severity and injury risk would be reduced on facilities that minimise slopes, have lower vehicle speeds, and that are designed for bicycling rather than shared with pedestrians.
- EPIDEMIOLOGY
- ACCIDENT & EMERGENCY MEDICINE
- PUBLIC HEALTH
This is an Open Access article distributed in accordance with the Creative Commons Attribution Non Commercial (CC BY-NC 4.0) license, which permits others to distribute, remix, adapt, build upon this work non-commercially, and license their derivative works on different terms, provided the original work is properly cited and the use is non-commercial. See: http://creativecommons.org/licenses/by-nc/4.0/
Statistics from Altmetric.com
Strengths and limitations of this study
This study is one of few to examine the relationship between route characteristics and severity of bicycling injuries. Its major strength was use of data from a study of bicycling injury risk. This made it possible to consider whether route characteristics that increased injury risk were similar to or different from those that increased bicycling injury severity.
The results show that facilities that separate cyclists from motor vehicle traffic and pedestrians, minimise slopes, and lower motor vehicle speeds would reduce injury severity after a crash and reduce injury risk.
The analyses examined four metrics covering different aspects of injury severity (not able to continue the trip by bike, transport to hospital by ambulance, admission to hospital and treatment urgency) and identified factors that were consistently associated with increased severity: increased age and collision with a motor vehicle.
The study included a range of injury severities resulting in emergency treatment at a hospital but did not include those so severely injured they could not remember their trip, nor those with such minor injuries that emergency treatment was not required.
The influence of route characteristics on severity was adjusted for potential confounding by personal and trip characteristics in the regression models, but the potential for uncontrolled confounding by unmeasured characteristics remains.
Introduction
Cycling is used for transportation and is a popular recreational activity. Its health benefits are clear,1 ,2 in contrast to motor vehicle travel. Transportation cycling has risks in the same order of magnitude as driving and walking in the USA and Canada.3 ,4 However, injury and death risks are higher than in some European countries where cycling participation is much higher.5–8
In 2010, there were 618 cyclist traffic deaths in the USA and 60 in Canada.9 ,10 Broader data (including bicycling sports such as mountain biking) indicate that about 27 800 Americans and 4300 Canadians were hospitalised for cycling injuries in 2009.11 ,12 Although bicycling injuries are a small proportion of all traffic injuries and deaths in North America (∼2–4%),9 ,10 reducing their incidence is important because of the direct harm that they do and because they deter potential cyclists.13–15
The reason postulated for the inversion of cycling activity and injury risk between North America and Europe is the well-designed bicycle-specific infrastructure in Europe versus its relative paucity in North America. We reviewed published studies and found that bicycle-specific infrastructure was associated with decreased injury risk, but a small range of infrastructure had been studied, often with uncertain control of exposure.16 We subsequently conducted a case-crossover study of the association between route infrastructure and injury risk.17 ,18 It found that infrastructure that was bicycle-specific (eg, cycle tracks separated from traffic, bike lanes) or ‘bicycle-friendly’ (eg, local streets with traffic diversion) had considerably lower injury risk. Other features were found to increase injury risk: streetcar or train tracks, downhill grades, construction, major street intersections and traffic circles at local street intersections. This work was designed to estimate associations with injury risk, with a no-injury control.
An alternative line of inquiry is what factors are associated with injury severity, among those who have been injured. Many studies have found that collisions with motor vehicles increase cyclist injury severity.11 ,19–22 However, few authors have examined severity with respect to route infrastructure.23–25 Higher severity has been found with grades, higher speed roads and crashes in traffic or on shared paths.23–25 Although these results suggest that predictors of cycling injury risk may be similar to predictors of injury severity, this is not established, and our study offers the opportunity to examine both sets of outcomes, adding a level of context requested by policymakers, infrastructure designers and other stakeholders. In our opinion, injury severity, not just the fact of an injury, is a second and equally important criterion used by the lay public to evaluate the apparent safety of cycling.
Therefore, we conducted additional analyses of data from our previous case-crossover study17 ,18 to examine the relationship between injury severity and personal, trip, route and crash characteristics.
Methods
Details about overall study conduct and reliability testing are described elsewhere;17 ,26 methods related to the analyses presented are described below. The study population consisted of adult (≥19 years) residents of Toronto and Vancouver who were injured while riding a bicycle in the city and treated within 24 h in the emergency departments of the following hospitals between 18 May 2008 and 30 November 2009: St. Paul's or Vancouver General in Vancouver; St. Michael's, Toronto General or Toronto Western in Toronto. Injured cyclists were identified by research staff at each hospital who relayed contact information to the study coordinators. Introductory letters were sent to all potential participants, followed by a phone call from the study coordinator to invite participation and screen for eligibility. Those who were fatally injured or so severely injured that they were unable to remember their trip were not included, nor were those injured during mountain biking, trick riding or racing.
Data on characteristics related to severity were abstracted from emergency department records. In addition, eligible participants were interviewed in person by trained interviewers about personal characteristics, trip characteristics, and crash circumstances, using a structured questionnaire (http://cyclingincities.spph.ubc.ca/files/2011/10/InterviewFormFinal.pdf).
The study was not designed to focus on severity, so the data did not include classical severity scoring using the Abbreviated Injury Scale. However, we did have access to four indicators of severity:
Whether the participant continued their trip by bicycle (self-reported in the interview), no versus yes
Whether the participant was transported by ambulance (hospital data), yes versus no
Whether the participant was admitted to hospital (hospital data), yes versus no
Canadian Triage and Acuity Scale (CTAS) (hospital data), levels 1–5, defined as follows:27 ,28
Resuscitation; need to be seen immediately
Emergent; need to be seen within 15 min
Urgent; need to be seen within 30 min
Less urgent; need to be seen within 60 min
Non urgent, need to be seen within 120 min
The relationship between these severity metrics was examined descriptively using cross-tabulations and Pearson correlation coefficients.
Site observations were made to document characteristics of injury and control sites, and allow route infrastructure classification.17 ,18 The observations were made blind to whether an injury took place at the site or not. In the current analyses, only the injury site data was used.
Unconditional logistic regression was used to examine associations of each of the following independent variables with each severity outcome metric:
Personal characteristics: sex; age; how frequently he/she cycled; whether the cyclist considered himself/herself experienced, had taken a cycling training course, had a driver's license.
Trip characteristics: time of day; weather; helmet use; use of visible clothing on the trunk; whether bike lights were turned on; alcohol and drug use in the 6 h prior.
Route characteristics at the injury site: type of route; intersection location; presence of bike signage; junctions; construction; streetcar tracks; grade; average vehicle speed; distance visible along route.
Crash circumstances: collision (with a motor vehicle, obstacle, surface feature, cyclist, pedestrian or animal) versus fall; collision with a motor vehicle versus not; motor vehicle ‘involvement’ (ie, both direct collisions with vehicles and crashes resulting from motor vehicle avoidance manoeuvres) versus not. No data on fault in the crash was collected.
All independent variables significant at p<0.05 in simple logistic regression (unadjusted analysis) of any severity metric were included in multiple regression models for all four severity metrics. The rationale for this broad inclusion of variables in the final models was to maximise control of potential confounding by personal and trip characteristics, to allow comparison of results across severity metrics, and to ensure that characteristics previously shown to be consistently related to injury severity were included in all the models (ie, age, crash circumstance).
For dichotomous severity metrics (did not continue by bike vs did, ambulance transport vs not, admitted to hospital vs not), traditional logistic regression was used. For CTAS, ordinal logistic regression modelled the odds of a more urgent CTAS group, after verifying that the proportional odds assumption was valid. CTAS categories were grouped as follows: most urgent, levels 1 or 2; moderate urgency, 3; least urgency, 4 or 5.
Additional analyses were conducted to evaluate the models. Analyses were run without the motor vehicle collision variable and, separately, without the route type variable to determine whether either changed the relationship of the other to severity in the full models. Separate analyses were conducted for motor vehicle collisions and other collisions to determine whether there was interaction between the motor vehicle collision and route type variables.
Results
The study included 690 injured cyclists (414 in Vancouver, 276 in Toronto). Seven were unable to recall their crash circumstances, so were removed from analyses; none of these continued by bike, six were transported by ambulance, their CTAS scores were either 1 or 2, and one was admitted to hospital. After these participants were excluded, 683 participants remained for most analyses, though four additional participants did not have information on CTAS or ambulance transport.
Descriptive data about the study participants, the trips when their injuries occurred, the characteristics of the route at the injury site and the crash circumstances are presented in table 1. Most participants were men, young, and regular cyclists. Most wore a helmet, but few wore bright clothing or used bike lights. Most of the injury sites were on major or local streets with little or no cycling infrastructure and most were at non-intersection locations. A minority of injuries occurred at sites with bike-specific infrastructure.
Personal characteristics of the cyclists, characteristics of the trip when the injury occurred, characteristics of the route at the site where the injury occurred, and crash circumstances (N=683)
Most of the crashes were collisions (74%, n=506) rather than falls. Direct collisions with motor vehicles (34%, n=231) were the most frequent collision type. Crashes ‘involving’ motor vehicles (48%, n=330) included direct collisions, as well as crashes to avoid motor vehicle collisions (14%, n=99). Few collisions involved other cyclists (3%, n=22), pedestrians (2%, n=12) or animals (1%, n=6).
Figure 1 shows the distribution of participants by the severity metrics, stratified by CTAS. The most urgent CTAS scores (1 or 2, n=75) were assigned to 11% of all participants, 14% of those who did not continue by bike, 25% of those transported by ambulance and 28% of those who were admitted to hospital. Table 2 provides additional detail on the relationship between the metrics. Of the 251 participants transported to hospital by ambulance, 99% did not continue by bike. Of the 60 participants admitted to hospital, 100% did not continue by bike, and 75% were transported by ambulance. Pearson correlations show associations in the expected directions, but the correlations were not strong. Thus the four metrics had logical relationships to each other, but did not measure identical constructs.
Relationship between the four metrics of severity: Pearson correlation coefficients above the diagonal; numbers of participants below the diagonal

Metrics of severity of cycling injuries to 683 study participants, stratified by Canadian Triage and Acuity Scale (CTAS), where 5 is the least medically urgent and 1 is the most.
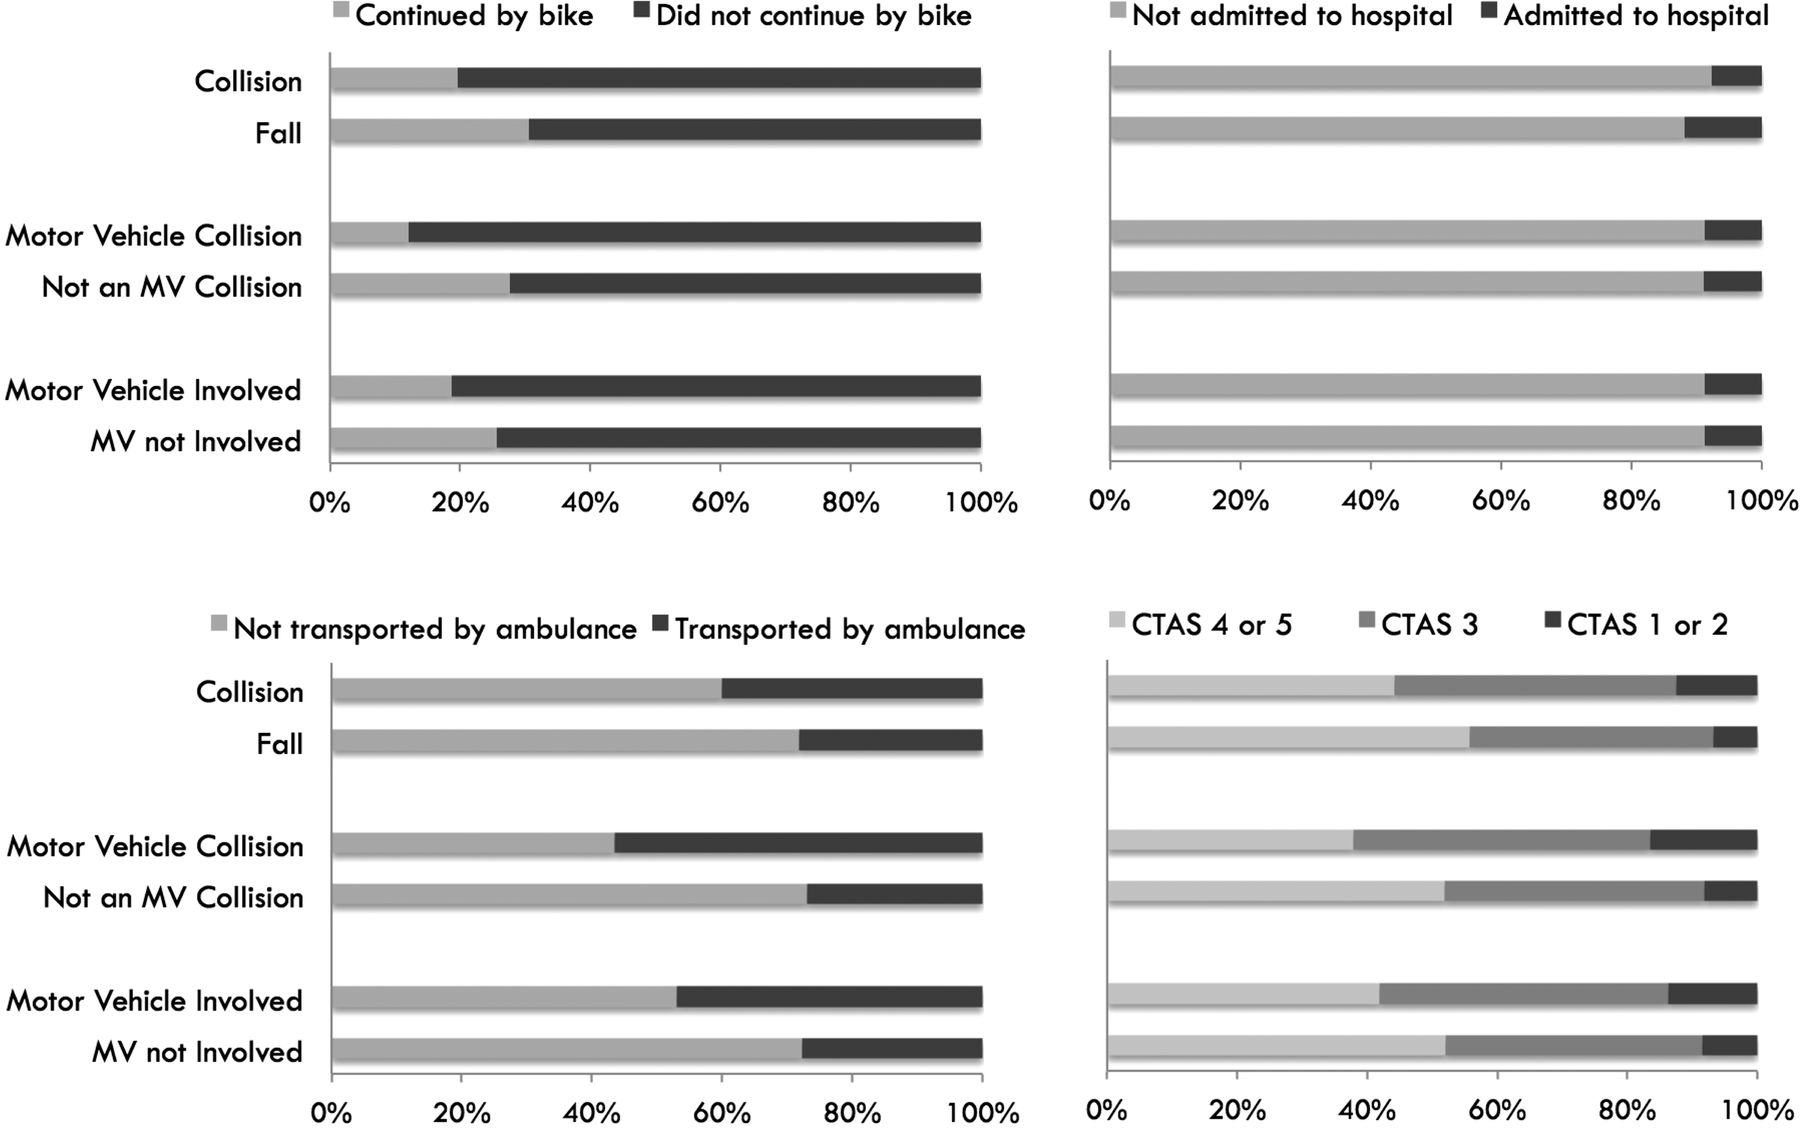
Figure 2 shows the severity metrics against crash circumstances, classified three ways. Collisions tended to be more severe than falls, and crashes ‘involving’ motor vehicles tended to be more severe than those not. Direct collisions with motor vehicles had the highest proportion in the more severe category of every metric except admitted to hospital. In unadjusted analyses, collision (of any type) and motor vehicle ‘involvement’ had elevated ORs for the same severity metrics as motor vehicle collision (data not shown), but the ORs were lower, indicating that it was direct collision with a motor vehicle that led to increased severity. Only the motor vehicle collision variable was included in multiple regression models.
Crash circumstances versus metrics of severity. Collisions could be with a motor vehicle, obstacle, surface feature, cyclist, pedestrian, or animal. Motor vehicle ‘involved’ includes both direct collisions with vehicles and crashes resulting from manoeuvres to avoid a motor vehicle. CTAS, Canadian Triage and Acuity Scale.
Table 3 shows the results of the multiple logistic regression models for each severity metric, including all independent variables statistically significant in at least one unadjusted analysis. Four personal characteristic variables were included: age, sex, cycling experience and cycling frequency. Age showed consistent associations across all severity metrics; older age groups had more severe injuries, significantly so for ambulance transport, admission to hospital and CTAS. Women were significantly more likely to stop their trip by bike than men. There was a tendency for more experienced and more regular cyclists to have higher injury severity, though only one association was statistically significant in multiple regression.
OR and 95% CI for associations between metrics of injury severity and personal, trip, crash circumstance and route characteristics (N=683)
Cyclists whose crash was a direct collision with a motor vehicle had elevated ORs for all severity metrics, statistically significant for not continuing by bike, being transported by ambulance and more urgent triage score (CTAS). Those whose crashes were on multiuse paths, sidewalks and local streets tended to have more severe injuries than those who crashed on major streets; significant associations were observed for certain associations with ambulance transport and hospital admission. Crashes at intersections had inconsistent results; the only significant OR indicated that those injured at an intersection were less likely to stop their trip by bike. Downhill grades were consistently related to greater injury severity, significantly so for transportation by ambulance. The same pattern was observed for higher average motor vehicle speeds at the crash location. Time of day and presence of streetcar tracks were significant in some unadjusted analyses, but did not remain so in multiple regression.
The following independent variables were not associated with any of the injury severity metrics in unadjusted analyses and were not included in multiple regression: whether the participant had taken a cycling training course or had a driver's license; weather; use of a helmet, visible clothing on the trunk, or bike lights; alcohol or drug use in the 6 h prior to the trip; presence of bike signage, junctions, or construction; and distance visible along the route.
Discussion
In this study, using four severity metrics that spanned rider self-evaluation (unable to continue by bike) to clinical-practitioner evaluation (CTAS), we found that the following characteristics were associated with more severe injuries: older age; female sex; more experience and frequency of cycling; collision with a motor vehicle; crash on a multiuse path, sidewalk or local street, at non-intersection location, on a downhill grade and at locations with higher motor vehicle speeds.
Personal characteristics
Older age has frequently been associated with more severe injuries in bicycling crashes.19–22 ,29–33 We observed the same for all metrics, though the OR was not always statistically significant. This pattern is attributed to increasing frailty with age and has been observed for all vulnerable road users.32
Although sex has frequently been associated with bicycling injury severity, the evidence does not show a clear pattern. We found that women were less likely to continue their trip by bicycle and had a non-significant increased chance of ambulance transport. Moore et al31 found women to have more severe injuries, but others have found higher severities in men.19 ,22 ,32 Theories for each of these results are available. The smaller average size of women may make them more vulnerable and men may be more comfortable handling minor injuries without help. A greater propensity for risk-taking and speed may provide opportunities for men to have higher impact crashes.34–36
We found that experienced cyclists and those who cycled more frequently had greater injury severity (more likely to need ambulance transport, or to have a more urgent triage score, respectively). Similarly Heesch et al21 found that frequent and experienced cyclists had more severe injuries. These cyclists may travel at higher speeds and incur higher impact forces in a crash.
Crash circumstances
About a third of the injuries were collisions with motor vehicles. These were strongly associated with three of our four injury severity metrics. In other research, collisions with motor vehicles have consistently been associated with increased severity.11 ,19–22 Collisions with larger vehicles have resulted in more severe injuries and deaths.29 ,31 ,33 ,37
Previous analyses of our study data showed that collisions with motor vehicles were associated with route type.38 They never occurred on off-street bike paths or on cycle tracks (separated bike lanes), and were over-represented on major streets with parked cars and no bike infrastructure. Therefore, for the severity analyses presented here, we considered whether route type confounded the association between collision with a motor vehicle and severity (and vice versa), but this was not the case, nor was there interaction between the two variables (data not shown).
The severity of direct collisions with motor vehicles provides a clear rationale for transportation planners to minimise interactions between cyclists and vehicles. This planning approach is supported by the results of our earlier analyses of injury risk: cycle tracks (bike lanes that physically separate cyclists and motor vehicle traffic) were associated with 1/9th the risk compared to streets with no bicycle infrastructure.17 Separating modes of traffic with large differences in speed and mass is a principle used by countries such as Sweden, Germany, Denmark and the Netherlands where bicycling injury risk is much lower than in North America.6 ,8 A rationale for this approach is that human error is inevitable, so it is important to minimise the consequences of such errors. Bicycling facilities separated from motor vehicles minimise the likelihood of a collision and the potential for severe injury when either a driver or a cyclist makes an error.
Route characteristics
Our main interest in this analysis was to determine whether route characteristics were associated with increased or reduced injury severity. Route type, presence of an intersection, grade and average motor vehicle speed at the crash location were all associated with injury severity.
In comparison to crashes on major streets without cycling infrastructure, crashes on sidewalks and multiuse paths had considerably higher odds of ambulance transport (OR for multiuse paths not significant). Crashes on sidewalks and multiuse paths also had considerably higher odds of hospital admission (OR for sidewalks not significant). In our earlier analyses of injury risk, multiuse paths and sidewalks had among the highest risks, despite being off-street.17 ,18 The increased severity after a crash adds to concern about these route types. Local streets (mainly residential streets) were found to be a safe route type in our earlier analyses, with only about half the injury risk.17 The current analysis indicates that if a crash did occur, there was an increased odds of one severity measure—hospitalisation.
Few studies have examined route type and injury severity. De Rome et al25 found that more severe injuries were associated with crashes in traffic and on multiuse paths, and less severe with crashes in bike lanes and on sidewalks. Slaughter et al39 found lower severity in bike lane crashes. In earlier analyses of our study, bicycle-specific infrastructure was found to have lower injury crash risk than major streets without such infrastructure,17 but the current analysis indicates that if a crash did occur, injury severity was similar. This may in part be because most of the injury sites with bicycle-specific infrastructure in our study were bike lanes without physical separation from motor vehicles.
Intersection versus non-intersection crash locations did not present a clear pattern of association with severity in this study. Moore et al31 found differing patterns of injury severity at intersections and non-intersections.
Downhill grade was significantly associated with increased severity for all metrics in unadjusted analyses, and remained significant in the final model for ambulance transport. Three previous studies have shown that injury severity is greater with grades.23 ,24 ,31 Downhill grade is likely to be associated with increased cyclist (and motor vehicle) speed, and therefore increased force of impact. Our earlier analyses found that downhill slopes were associated with higher injury risk, and that uphill grades deter cycling.15 ,17 ,18 This suggests that, wherever possible, routing bicycle facilities where slopes are gentle is a good strategy for reducing injuries and motivating cycling.
Higher average motor vehicle speed was associated with increased severity for all metrics, and remained significant in the final model for ambulance transport. Other studies found higher speed roads to be associated with greater injury severity to cyclists.23 ,24 ,37 Our earlier analyses found that injury risk was higher at intersections where motor vehicle speeds were greater than 30 km/h and that routes with high vehicle speeds deter cycling.15 ,18 This supports recent changes in some European and North American cities to lower urban speed limits.
Trip characteristics
Only one trip characteristic was associated with injury severity. Time of day (night riding) was associated with a higher odds of hospital admission in unadjusted analyses and was elevated but not significant in multiple regression. Night-time riding has been associated with increased injury severity in other studies, especially where roadways were not lit.24 ,29 ,32 ,33
Although much of the bicycle safety literature focuses on helmets and head injury mitigation,22 ,37 ,40–42 helmet use was not associated with any of the severity metrics in this study. Biomechanical studies42 and epidemiological studies22 ,37 ,40 ,41 have demonstrated that helmets can prevent serious skull and brain injuries. This study was not limited to head injuries, likely contributing to our result that helmet use was not associated with injury severity. In one of the largest studies to examine helmets, their use was found to significantly reduce head injuries, but was not associated with serious injury mitigation across all body regions.22 ,41 In this context, it is important to recognise that cyclists may sustain injuries, including serious trauma, to any body part, including their thorax, abdomen, neck and extremities.22 A helmet can do nothing to prevent non-head injuries. Our earlier analyses of injury risk show the potential for all injuries to be significantly decreased for cyclists separated from motor vehicle traffic in a cycle track or a local street with traffic diversion17 ,18 and the present results show that injury severity significantly increases in a collision with a motor vehicle. Together these results point to bicycle infrastructure that physically separates cyclists from motor vehicle traffic to prevent trauma to any area of the body.
Strengths and limitations
Strengths of the study include two study cities with differing climates, terrain, cycling mode shares and cycling infrastructure, an urban-only cycling sample, the prospective accrual of participants, observation of route characteristics blinded to whether the site was an injury site, and the number of clinical and cyclist self-report severity metrics.
Study limitations include a relatively small sample of injured cyclists, restriction to Canadian cities and lack of data on the anatomical location of the injury. As in all injury studies, only a portion of injured cyclists were included; here, those whose injuries were serious enough to be treated at a hospital emergency department, but not to cause death or a head injury so severe that the trip could not be recalled. This reduced the pool of the most severely injured cases: 2 potential participants were fatally injured, 26 of those contacted could not remember their route, and 7 could not recall their crash circumstances. An unknown number of cyclists had injuries so minor that no emergency department visit was made.
Our overall study had a case-crossover design that compared injury sites to control sites within a person-trip, fully controlling for differences between individuals and trips that might confound the relationship between injury risk and infrastructure (the primary focus of the study). To examine severity of injuries in the current analysis, the analysis was restricted to cases only, comparing participants with more severe injuries to those with less severe injuries, introducing the potential for confounding by personal and trip characteristics. We addressed this via adjustment in our regression models, but the potential for uncontrolled confounding by unmeasured characteristics remains.
Given that we did not have data on more traditional measures of severity, the Abbreviated Injury Scale and Injury Severity Score, it is important to consider our outcome metrics, their relationship to each other and their potential reliability and validity as measures of severity. The four metrics measured different aspects of severity, as described above (figure 1 and table 2).
Hospital admission is based on an in depth medical assessment and should reflect the most severe injuries. There are no standardised decision criteria, and physicians’ decisions to admit emergency department patients to hospital have been found to differ substantially.43 Data from Rivara et al22 were available to compare hospitalisation to Injury Severity Scores above versus below 9. They found that those with higher scores were 43 times more likely to be admitted to hospital. Hospitalisation had high specificity (0.94) but lower sensitivity (0.72), suggesting that few patients with minor injuries are admitted to hospital, but some who are severely injured are not admitted. This could be because some patients with severe injuries (eg, some extremity fractures, intra-abdominal trauma) may be treated and stabilised in an emergency department then discharged home, but scheduled for later surgical repair. This may have contributed to our somewhat different results for hospital admission and its lower correlations with the other metrics.
Ambulance transport is based, in part, on whether or not someone at the scene called an ambulance. It had the strongest correlations with all other outcome metrics. Data from Lang et al44 were available to compare ambulance transport to Injury Severity Scores above versus below 12. Ambulance transfer had low specificity (0.26) but high sensitivity (0.95), opposite to the pattern for hospitalisation. This suggests that most severely injured patients are transported by ambulance, but so are many who are not severely injured.
The CTAS scale is based on assessment by a triage nurse of a standardised list of presenting symptoms, vital sign modifiers and pain severity.27 Certain injury mechanisms, for example, being hit by a motor vehicle, may be assigned a greater urgency score. CTAS has been frequently tested for reliability, with κ for agreement beyond chance spanning a broad range from 0.25 to 0.89.28 We found no comparison of CTAS to Injury Severity Scores. We found no validity or reliability data for continuing to cycle.
Conclusions
In two of Canada's largest cities, approximately one-third of the bicycle crashes were collisions with a motor vehicle and the resulting injuries were more severe than in other crash circumstances. Certain route types (in particular multiuse paths and sidewalks), downhill grades and higher motor vehicle speeds were also associated with increased injury severity. These results suggest an urgent need to provide bike facilities that separate cyclists from motor vehicle traffic, that minimise slopes and have lower motor vehicle speeds, and that are designed specifically for bicycling rather than for sharing with pedestrians. These bicycle infrastructure modifications would reduce crashes and injury severity after a crash.
Acknowledgments
The authors would like to thank all the study participants for generously contributing their time. The authors appreciate the work of study staff, hospital personnel and our city and community collaborators. This study evolved from work conducted in the University of British Columbia's Bridge Program Grant Development course (2005–2006) and benefitted from input from the participants of that class.
References
Footnotes
Contributors KT, MAH, CCOR, and PAC were responsible for initial conception and design of the study. KT, MAH, CCOR, PAC, MW, SB, MC, MDC, JRB, SMF, Garth Hunte and Kishore Mulpuri were responsible for the funding proposal. CCOR, MAH, MW, MDC, KT, Melody Monro and Lee Vernich designed and tested data collection instruments. MW, HS and KT developed algorithms for defining route infrastructure. HS was responsible for data analyses. All authors had full access to the results of all analyses. PAC, HS and KT drafted the article. All authors contributed to study design and implementation, analysis decisions, interpretation of results and critical revision of the article. Evan Beaupré, Niki Blakely, Jill Dalton, Martin Kang, Kevin McCurley, and Andrew Thomas were responsible for interviews or site observations. Vartouji Jazmaji, Melody Monro and Lee Vernich were responsible for supervision and training of study staff, and recruitment of participants. Barb Boychuk, Jan Buchanan, Doug Chisholm, Nada Elfeki, Garth Hunte, JRB, SMF, and MDC contributed to identification of injured cyclists at the study hospitals. Jack Becker, Bonnie Fenton, David Hay, Nancy Smith Lea, Peter Stary, Fred Sztabinski, David Tomlinson, and Barbara Wentworth reviewed the study protocol, data collection forms, and infrastructure definitions from the perspective of professionals or advocates involved in cycling transportation. Data were double entered by Express Data Ltd.
Funding This work was supported by a grant from the Heart and Stroke Foundation of Canada and the Canadian Institutes of Health Research (Institute of Musculoskeletal Health and Arthritis and Institute of Nutrition, Metabolism and Diabetes) (Grant number: BEO-85863). JRB, MAH, and MW were supported by salary awards from the Michael Smith Foundation for Health Research. MAH, CCOR, and MW were supported by salary awards from the Canadian Institutes of Health Research.
Competing interests None.
Patient consent Obtained.
Ethics approval The study methods were reviewed and approved by the human subjects ethics review boards of the University of British Columbia (BREB REB H06-03833), the University of Toronto (#22628), St. Paul's Hospital (BREB REB H06-03833), Vancouver General Hospital (#V07-0275), St. Michael's Hospital (REB 08-046C), and the University Health Network (Toronto General Hospital and Toronto Western Hospital; REB 07-0839-AE). All participants gave informed consent before taking part in the study.
Provenance and peer review Not commissioned; externally peer reviewed.
Data sharing statement The study database was compiled from interviews with study participants and site observations by study personnel. It cannot be shared by the authors with anyone without approval from the University and Hospital human subjects review boards.