Article Text

Abstract
Objective To determine the prevalence of obesity and its related comorbidities among patients being actively managed at a US academic medical centre, and to examine the frequency of a formal diagnosis of obesity, via International Classification of Diseases, Ninth Revision (ICD-9) documentation among patients with body mass index (BMI) ≥30 kg/m2.
Design The electronic health record system at Cleveland Clinic was used to create a cross-sectional summary of actively managed patients meeting minimum primary care physician visit frequency requirements. Eligible patients were stratified by BMI categories, based on most recent weight and median of all recorded heights obtained on or before the index date of 1July 2015. Relationships between patient characteristics and BMI categories were tested.
Setting A large US integrated health system.
Results A total of 324 199 active patients with a recorded BMI were identified. There were 121 287 (37.4%) patients found to be overweight (BMI ≥25 and <29.9), 75 199 (23.2%) had BMI 30–34.9, 34 152 (10.5%) had BMI 35–39.9 and 25 137 (7.8%) had BMI ≥40. There was a higher prevalence of type 2 diabetes, pre-diabetes, hypertension and cardiovascular disease (P value<0.0001) within higher BMI compared with lower BMI categories. In patients with a BMI >30 (n=134 488), only 48% (64 056) had documentation of an obesity ICD-9 code. In those patients with a BMI >40, only 75% had an obesity ICD-9 code.
Conclusions This cross-sectional summary from a large US integrated health system found that three out of every four patients had overweight or obesity based on BMI. Patients within higher BMI categories had a higher prevalence of comorbidities. Less than half of patients who were identified as having obesity according to BMI received a formal diagnosis via ICD-9 documentation. The disease of obesity is very prevalent yet underdiagnosed in our clinics. The under diagnosing of obesity may serve as an important barrier to treatment initiation.
- obesity
- body mass index
- diagnosis
- integrated delivery system
- electronic health records
This is an Open Access article distributed in accordance with the Creative Commons Attribution Non Commercial (CC BY-NC 4.0) license, which permits others to distribute, remix, adapt, build upon this work non-commercially, and license their derivative works on different terms, provided the original work is properly cited and the use is non-commercial. See: http://creativecommons.org/licenses/by-nc/4.0/
Statistics from Altmetric.com
Strengths and limitations of this study
The analysis included a very large sample of 324 199 patients with recorded body mass index (BMI) values.
The electronic health records (EHRs) used for the study (Cleveland Clinic) provide a rich source of demographic, clinical, laboratory and prescription data on patients.
Overweight and obesity categorisations were based on actual BMI calculations, not International Classification of Diseases coding.
As a potential limitation, all patients were identified from a single institution’s EHR, although one of the largest in the world (Cleveland Clinic).
Another limitation is that all subjects were individuals seeking healthcare services, thus possibly not representative of the broader US population.
Introduction
Obesity represents a major public health problem in the USA from the dual aspects of prevalence and consequence. The prevalence of obesity in the USA has nearly tripled over past decades, increasing from 13% in 1960–1962 to 36.5% during 2011–2014,1 thus affecting an estimated 60 million American adults. Obesity is associated with a number of important chronic diseases such as type 2 diabetes (T2D), hypertension (HTN), dyslipidemia, coronary heart disease, stroke, several cancers, disability and increased mortality.2–7
The US Preventive Services Task Force (USPSTF) recommends screening all adults for obesity,8 recognising that healthcare providers have an important role in preventing, identifying and managing this chronic disease. The USPSTF also recommends that once a diagnosis of obesity has been established physicians should offer or refer patients with a body mass index (BMI) ≥30 kg/m2 to an intensive, interdisciplinary lifestyle intervention programme.8
Despite these recommendations and formal recognition by the American Medical Association as a disease,9 obesity continues to be underdiagnosed in clinical practice.10 It is estimated that <30% of adults with obesity receive this diagnosis during their primary care physician (PCP) visit.10 Furthermore, some data suggest that weight counselling as a component of primary healthcare services in the USA has been declining significantly over the past decade.11 12 Yet, obesity screening and recognition of obesity as a complex, chronic diagnosis are among the first steps leading to effective treatment.13 Obesity-related electronic health records (EHRs) have been highlighted as a useful tool to assist healthcare providers in the screening and management of obesity.14–17
The primary objective of the present study was to determine the true prevalence of obesity and related comorbidities among patients being actively managed at the Cleveland Clinic using EHR data. A secondary goal was to evaluate how frequently a formal diagnosis of obesity, via International Classification of Diseases, Ninth Revision (ICD-9) coding, was documented among patients with a BMI>30 kg/m2.
Methods
The enterprise-wide EHR system at Cleveland Clinic was used to create a cross-sectional summary of actively managed patients, stratified by BMI categories, as of 1 July 2015. All Cleveland Clinic facilities use the MyPractice EHR system, composed of an integrated suite of software modules created by Epic Systems (Verona, Wisconsin, USA), and which was first installed in 1998. The EHR includes patient demographics, social, medical, family and surgical history, vital signs, imaging data and pathology reports, and rich longitudinal clinical data (diagnosis, procedures) from both the inpatient and outpatient records. It contains discrete data linkage with Cleveland Clinic laboratory records, as well as detailed medication usage information. In 2014, Cleveland Clinic set a new annual record for outpatient visits (almost 6 million) and has >1 million active patients (two or more encounters within the past 12 months).
Patients were included if they were ≥20 years of age on the index date (as they may not have reached their full height by 18 years of age). Patients were considered ‘actively managed’ and included in the analysis if they had been seen by a PCP at least three times prior to the index date, with at least one of the visits having occurred within the immediate 18 months preceding the index date. Patients were excluded for any of the following reasons: median height <4′6′ or >7′6′; weight >750 lbs (340 kg); pregnant or having recently given birth; amputees; diagnosis of HIV prior to the index date; diagnosis of hyperthyroidism, hypothyroidism, heart failure, radiation or chemotherapy treatment, or metastatic cancer between 1 July 2013 and the index date (1 July 2015).
BMI calculations were determined using the most recent weight and median of all recorded heights obtained on or before the index date (1 July 2015). The weight recorded closest to the index date was recorded as the study weight. Height and weight measures were obtained from outpatient encounters excluding ophthalmology, orthopaedic and psychiatry specialty visits because of a lack of precision of height and weight measurements obtained at these encounters. Income was defined as the 5-year estimates (2008–2012) of median household income at the block group level obtained from the American Community Survey conducted by the U.S. Census Bureau.18 The census block group was obtained by geocoding the patient address that was on file closest to baseline. BMI, weight and smoking status were defined as the value recorded in the EHR closest to baseline (but without any time restrictions). Demographic and laboratory/vital sign data were recorded based on the most recent values available in the EHR on or before the index date. Comorbidities were identified in the EHR any time up until the index date. Obesity diagnosis was based on ICD-9 code 278.0x and V-codes V85.3x and V85.4x.
Relationships between patient characteristics and weight classifications (BMI categories) were tested using univariate analysis, where χ2 was used for testing the association between the weight classifications and a categorical characteristic. The non-parametric Kruskal-Wallis test was used for continuous characteristics.
Results
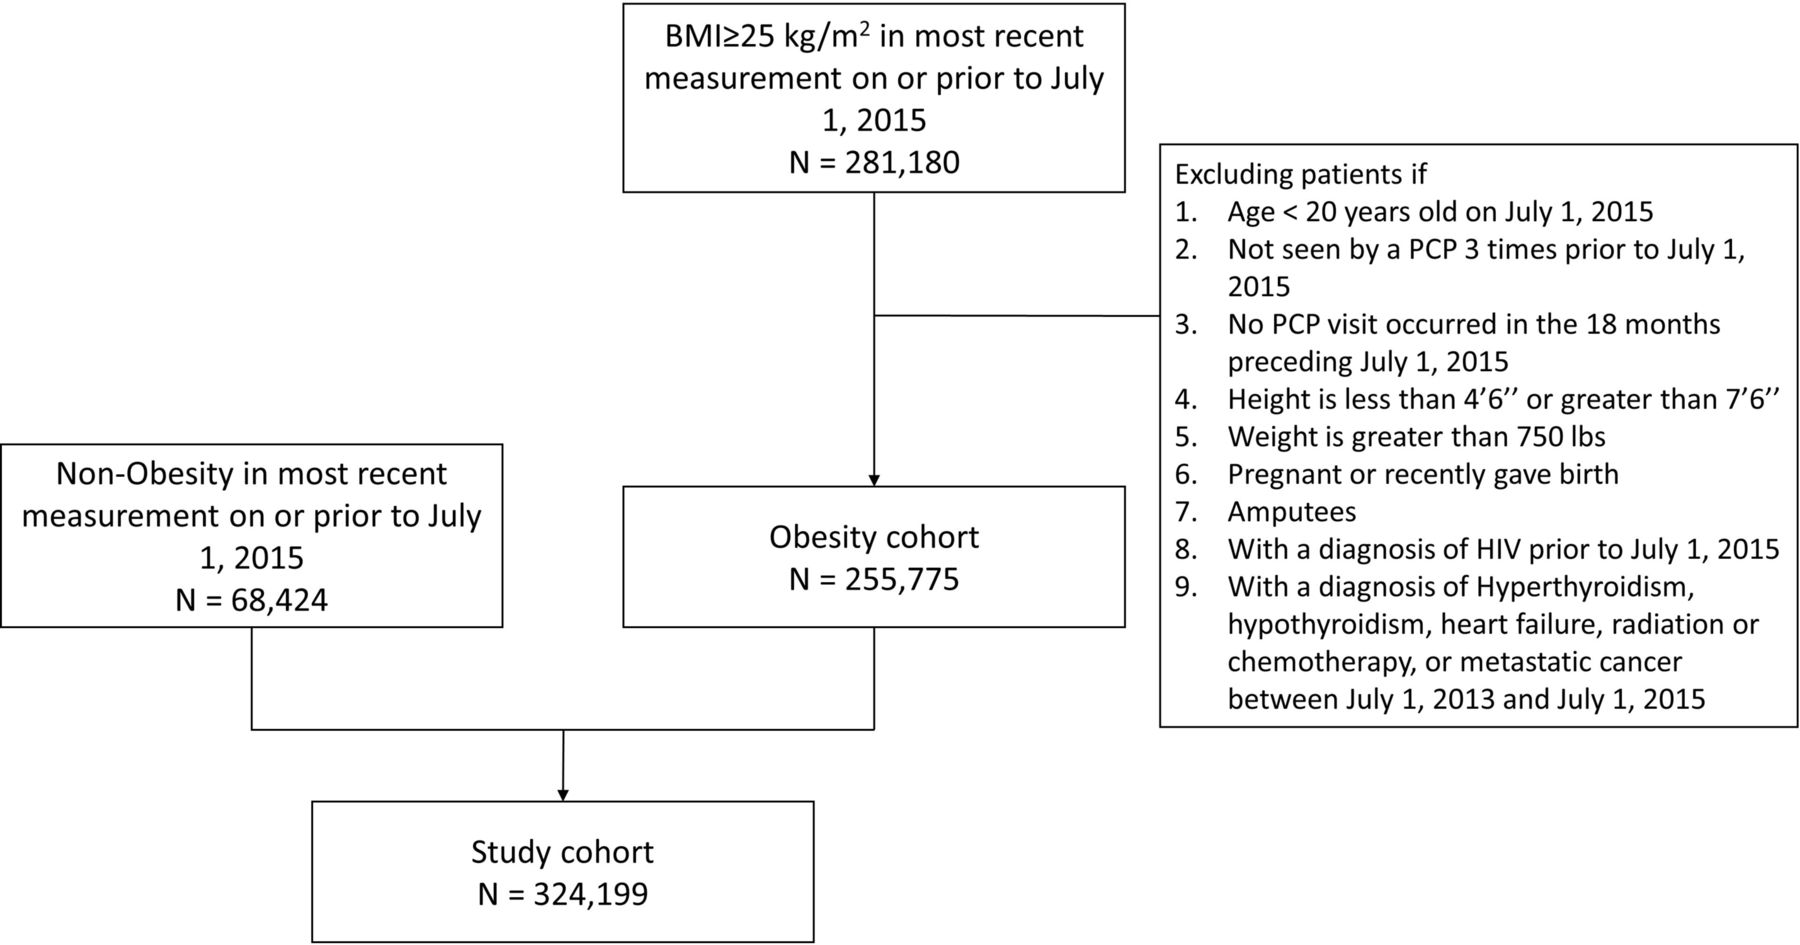
As of 1 July 2015, a total of 324 199 active patients with a recorded BMI were identified to meet the inclusion/exclusion criteria (figure 1). Of these, 255 775 (78.9%) patients met criteria for overweight or obesity according to their recorded BMI: 121 287 (37.4%) were found to be overweight, 75 199 (23.2%) had obesity class I (BMI 30–34.9), 34 152 (10.5%) had obesity class II (BMI 35–39.9) and 25 137 (7.8%) had obesity class III (BMI ≥40). The median time from 1 July 2015 until the closest measurement of BMI was 4.7 months (IQR 1.9–13.2 months) for all 324 199 patients. The median time from 1 July 2015 until the closest measurement of BMI for those with a BMI ≥25 (n=255 775) and for BMI <25 (68 424) was 4.4 months (IQR 1.8–9.4) and 6 months (IQR 2.3–11.9), respectively.

Strengthening The Reporting of Observational Studies in Epidemiology flow diagram of study population. BMI, body mass index; PCP, primary care physician.
All measured associations between the weight classifications and the patient characteristics were statistically significant (P<0.0001).
Study population
Table 1 provides study population characteristics and demographics. The median (IQR) age for the entire population was 52 years (40–63) and the slight majority of patients were female (54%). The population included Caucasians (77.4%), African-Americans (12.9%), Hispanics (3.6%) and Asian/Pacific Islanders (1.4%).
Study population characteristics
Based on height and weight measurements, 78.9% of the patients had BMI values classified as overweight or obesity. For obesity class I (BMI 30–34.9), a higher percentage were males (53%), unlike patients with BMI <25 (30%) or obesity class II and III (44% and 35%, respectively). There was a significantly smaller percentage of males than females within the obesity class III category (35% males vs 65% females, respectively).
The proportion of African-American individuals in increased as BMI category increased, while this pattern was not observed for other races.
The prevalence of smoking was similar among the various BMI categories compared with individuals with normal BMI.
As BMI category increased, median household income decreased, as determined by census block group of residence. The median household income (in US$) stratified by BMI category was $62 210 (BMI <25); $62 500 (BMI 25–29.9); $58 300 (BMI 30–34.9); $53 890 (BMI 35–39.9) and $49 940 (BMI ≥40).
Documentation of an ICD-9 code for obesity
Out of 134 488 patients with a BMI≥30, 48% (n=64 056) had a documented ICD-9 code for a diagnosis of obesity (ICD-9: 278.0x, V85.3x, V85.4x). Among patients with a BMI≥40 (n=25 137), 75% (n=18 937) had an ICD-9 code for a diagnosis of obesity. In all three obesity classes, only a minority had a V85.x code for obesity class.
Comorbidities
Table 2 presents data on comorbidity patterns in the study population, stratified by BMI category. The proportion of patients with diabetes or pre-diabetes rose with increasing BMI category. The prevalence of T2D and pre-diabetes within BMI categories increased from 4.5% and 0.9%, respectively, of the BMI<25 category to 30.9% and 16.9%, respectively, in the BMI≥40 category. The rate of accurate ICD-9 coding for obesity among patients with T2D and BMI≥30 was 59.3% (18 436/31 087), notably higher than among patients without T2D and having a BMI≥30 (44.1%; 45 620/103 401).
Comorbidities, vital statistics and laboratory measurements among patients, stratified by body mass index (BMI) category
The proportions of patients with HTN was also observed to rise with increasing BMI category, and both median systolic and diastolic blood pressures (mm Hg) increased with escalating BMI category.
There was no clinically meaningful difference in the median levels of low-density lipoprotein cholesterol (mg/dL) among the different BMI categories. Median high-density lipoprotein cholesterol levels were observed to decline with increasing BMI category. Median triglyceride levels increased from 74 mg/dL in the BMI<25 category to 119 mg/dL in the BMI 35–39.9 category, then appeared to plateau.
Patients with BMI≥25 had a slightly higher prevalence of coronary artery disease compared with individuals with BMI<25, but no clinically meaningful differences in the prevalence of heart failure were observed between the BMI categories. There were no significant differences in the prevalence of cerebrovascular disease or glomerular filtration rate (calculated via Chronic Kidney Disease Epidemiology Collaboration) among the different groups of patients with obesity compared with lean subjects.
Glycaemic control
The median fasting blood glucose values in individuals classified as overweight and obese were higher compared with patients with BMI<25 (table 2). Median HbA1c values and random blood glucose measures for patients with overweight and obesity were marginally higher than in patients with BMI<25.
Medications
As shown in table 3, HTN medication use rose with increasing BMI categories from 19.5% in the lowest BMI category (<25) to 54.3% in the highest BMI category (≥40). Also, 30.8% of patients with obesity (BMI>30) were using a medication to control their cholesterol, whereas only 12.1% of lean subjects (BMI<25) were taking lipid-lowering medications (all P<0.0001). Patients with obesity were also more likely to be using a second lipid-lowering medication in addition to a statin.
Hypertension and hyperlipidaemia medication usage among patients, stratified by body mass index (BMI) category
Discussion
In this robust analysis of EHR data from the Cleveland Clinic, BMI values for almost 80% of patients fell within categories of overweight (37.4%) or obesity (41.5%). Thus, only about one in five patients had a BMI that was not indicative of overweight or obesity. The prevalence of overweight/obesity in this population (78%) is somewhat higher than estimated recently for the general US population; just over two-thirds (69%) of adults were estimated to be overweight or obese in the USA between 2009 and 2012.19 20 This observation could be, in part, because the population seeking medical care at our institution may be sicker, whereas the number reported through National Center for Health Statistics is self-reported/survey based.
Data from the National Health and Nutrition Examination Survey1 demonstrated that the prevalence of obesity was 36.5% among US adults during 2011–2014. The prevalence of obesity was noted to be higher in women and among non-Hispanic black and Hispanics. Consistent with these data, we identified a higher percentage of females compared with males among obesity classes II and III in our patient population. Higher rates of obesity diagnosis in female patients have been theoretically attributed to more frequent healthcare use by women in general or sex bias on the part of providers.21 However, the current study was based on objective BMI data, thus sex bias was clearly not a factor. While the percentage of female patients was slightly higher than that of male patients in the overall study population, the ratio of female to male subjects in the highest BMI categories was greater. We also identified a higher prevalence of African-Americans and a lower median household income within the higher BMI categories. While the median age appeared to be relatively constant across BMI categories, when BMI classifications were stratified by categorical age groupings (data not shown), higher rates of BMI>25 and >30 were observed with increasing age category.
Diabetes is another global health epidemic that is driven largely by rising obesity rates.22 Excess body fat increases the risk for pre-diabetes; men and women with obesity, respectively, have a 7-fold and 12-fold higher risk of developing T2D.23 In the current dataset, 15% of the entire study population had a diagnosis of T2D. This finding corroborates those of a recent report which estimated the prevalence of diabetes among US adults in 2011–2012 to be 12%–14%.24 However, the prevalence of pre-diabetes in the current study population (10%) was markedly lower than reported previously (38%).24 In this report, the authors employed a strict criteria for a diagnosis of pre-diabetes, which may partly explain the discrepancy (see table 2). We also noticed that patients with higher BMI had higher prevalences of T2D and pre-diabetes compared with leaner subjects.
Patients with obesity and T2D often have an increased incidence of cardiovascular disease risk factors, such as HTN and dyslipidemia,25 26 which is not surprising given that both obesity and T2D are independent risk factors for cardiovascular disease.25 27 In agreement with these observations, our study found higher prevalences of HTN and dyslipidemia (per cholesterol-lowering medication use) among patients with obesity compared with leaner subjects. We also noted an increased prevalence of coronary artery disease and congestive heart failure in our patients with obesity compared with lean subjects.
The USPSTF recommends screening all adults for obesity,8 yet the US healthcare system still faces challenges in this area. The continued lack of recognition of obesity as a disease and underdiagnosis by clinicians postpones the initiation of treatment and increases the risk of developing complications. Bodyweight is a modifiable risk factor, and weight loss of 5%–10% has been shown to improve multiple health outcomes, including cardiovascular risk factors.28 In patients with obesity and T2D, benefits of weight loss may include improvements in insulin sensitivity, sleep apnoea, less depression, less urinary incontinence, reduced need of diabetes medications, improved quality of life and even lower costs.28 29 Significant weight loss has even been associated with remission of T2D.30 Several reasons have been suggested as responsible for why providers are reluctant to include obesity in the list of diagnoses in patients with BMI>30. These include perception by healthcare providers that obesity is not a disease, low expectations for patient success, lack of time or knowledge to provide appropriate advice regarding nutrition, societal stigma, concerns with denials of payment for services and limited therapeutic tools to treat patients with obesity.12 15 31 32
Identifying obesity is the first step leading to optimal interdisciplinary intervention ideally involving lifestyle modifications relating to nutrition and physical activity, as well as medications where necessary to reduce appetite. Optimal obesity-related EHR functions should help to carry out this important task. We took advantage of our institution’s EHR functions to document what is probably the most relevant finding of our study. In addition to identifying BMI-defined obesity in >40% of our patients, we observed that only half of such patients received a formal diagnosis of obesity via ICD-9 coding (278.00). We did observe that among patients with BMI-defined obesity the percentage of patients that received a formal obesity diagnosis via ICD-9 documentation was 15% higher among patients with a diagnosis of diabetes compared with those not having a diagnosis of diabetes. This highlights that patients with obesity-related comorbidities like diabetes may be more likely to receive a formal diagnosis of obesity. This observation may be, in part, because patients with diabetes are sicker and are seen more frequently, affording more opportunities for a formal diagnosis of obesity to occur. It is also reasonable to surmise that patients who are diagnosed as having obesity may be more likely to undergo additional evaluation for comorbid conditions like diabetes.
Several studies have demonstrated the usefulness of EHR functions for screening and treating obesity, specifically with regard to assessing BMI, diagnosing obesity and facilitating obesity counselling and treatment services.16 17 33 In compliance with meaningful use standards, EHRs are required to calculate BMI for all patients, as well as plot and display weight and BMI charts. Unfortunately, few EHRs support physicians’ obesity-related care and there is low level of obesity-related sophistication in EHRs as recently published.33 It should be noted that, while BMI categorisation is a clinically practical and generally useful means of identifying obesity, BMI is an indirect measure of body fat and has been shown to have high specificity but low sensitivity to identify adiposity.34 In addition, BMI measurements do not factor in age-related changes in body composition such as increased body fat and decreased muscle mass.35
It is also concerning that rates of weight counselling in primary care have significantly declined despite increased rates of overweight and obesity.11 12 15 Given that physicians’ advice about health risk interventions has been shown to have positive effects on patient risk status, it is important that PCPs do not overlook this rapidly increasing health problem. However, it remains unclear whether an increased recognition of obesity as a disease across the spectrum of providers (including both PCPs and specialists), and appropriate documentation within the EHR of this condition, will translate into an earlier referral to an obesity specialist so that appropriate obesity therapy could be initiated. Further investigation is ongoing to address this important issue, which hopefully will facilitate the initiation of obesity therapy in our patients who suffer this condition.
Certain limitations of the current study should be noted. First, it was a cross-sectional study, although it used one of the largest EHR data repositories in the world. Cross-sectional data can identify associations but are unable to determine causality. Further research will be needed to clarify true associations between obesity status and comorbid medical conditions, or whether appropriate obesity diagnosis is triggering a higher rate of intentional work-up for such comorbidities in these individuals compared with those not diagnosed with obesity. Second, the prevalence of overweight and obesity noted in our patient population was higher than those estimated in the general US population.19 20 This circumstance might reflect some population bias because the dataset was limited to individuals seeking healthcare at the Cleveland Clinic. Third, although the dataset included a very large number of active patients (324 199), they all are part of a single institution, thus possibly limiting the generalisability of the findings. Finally, diagnostic coding procedures are subject to error, although the sheer volume of the dataset should have minimised the potential influence of occasional coding inaccuracies.
Conclusions
The results of this report highlight the sobering reality of obesity prevalence and associated comorbidities in the USA. Yet despite the high prevalence, underdiagnosis continues to be a significant problem. More than three-quarters of the study population had a BMI consistent with overweight or obesity, but less than half received a formal diagnosis of such via ICD-9 documentation. This cross-sectional analysis was designed to evaluate the scope of the problem, and in doing so, has raised additional questions worthy of pursuit. Further analysis and research will be needed to fully decipher the likely complex factors contributing to the medical under-recognition of obesity.
Underdiagnosis and failing to recognise obesity as a treatable, chronic disease with serious health consequences are important barriers to effective management. Over coming years, we anticipate continued improvements in the documentation of obesity due to increasing therapy coverage by insurance companies, existing reimbursement incentives through the Centers for Medicare and Medicaid Services and the effective use of obesity-related EHR functions. We believe that including obesity in the chronic problem lists of patients with a BMI>30 may be helpful in prompting discussions related to weight-related issues in appropriate individuals. Physicians have a tremendous opportunity to positively impact the health and general well-being of their patients with obesity if they commit to proactive strategies for diagnosis and intervention.
References
Footnotes
The Obesity Society Annual meeting at Obesity Week, New Orleans Louisiana, 2016
Contributors KMP researched and analysed the data and wrote the manuscript. BB and JB were involved in the concept and study design, data acquisition, data analysis and interpretation, drafting of initial manuscript, review and revision of the final manuscript, and gave final approval on the manuscript. TMH and RSZ contributed to the discussion and reviewed/edited the article. BJW and ADM researched and analysed the data, designed the analysis and contributed to the discussion. SXK and WW were involved in concept and study design, data analysis and interpretation, review and revision, and gave final approval on the manuscript. KMC researched and analyzed the data. AM extracted, researched and analysed the data. BS and MWK were involved in concept and study design, data analysis and interpretation, drafting of the manuscript, review and revision of manuscript, and final approval. JMB was involved in the concept and study design, drafting of the manuscript and project management.
Funding This study was funded by Novo Nordisk.
Competing interests KMP reports receiving research funding from Novo Nordisk and Merck, receiving consulting fees from Novo Nordisk, and Merck, and receiving honoraria from Merck, AstraZeneca, Sanofi and Novo Nordisk for speaking/educational activities within the past 12 months. RSZ reports receiving research funding from Novo Nordisk and Merck, and receiving speaker honoraria from Merck, and received consulting fees from Novo Nordisk and Merck within the past 12 months. BJW, MWK, AM, KMC and JMB. report receiving research funding from Novo Nordisk and Merck within the past 12 months. ADM received research support from the Merck Investigator Studies Program and the Agency for Healthcare Research and Quality K08 HS024128. JB and BS were employees at Novo Nordisk and owned company stock while the research was being conducted. TMH, SXK and WW are employees of Novo Nordisk and own company stock. BB reports receiving consulting fees and research support from Novo Nordisk in the past 12 months.
Ethics approval Cleveland Clinics Institutional Review Board.
Provenance and peer review Not commissioned; externally peer reviewed.
Data sharing statement No additional data are available.