Article Text

Abstract
Introduction The geographical inequity of physicians is a serious problem in Japan. However, there is little evidence of inequity in the future geographical distribution of physicians, even though the future physician supply at the national level has been estimated. In addition, possible changes in the age and sex distribution of future physicians are unclear. Thus, the purpose of this study is to project the future geographical distribution of physicians and their demographics.
Methods We used a cohort-component model with the following assumptions: basic population, future mortality rate, future new registration rate, and future in-migration and out-migration rates. We examined changes in the number of physicians from 2005 to 2035 in secondary medical areas (SMAs) in Japan. To clarify the trends by regional characteristics, SMAs were divided into four groups based on urban or rural status and initial physician supply (lower/higher). The number of physicians was calculated separately by sex and age strata.
Results From 2005 to 2035, the absolute number of physicians aged 25–64 will decline by 6.1% in rural areas with an initially lower physician supply, but it will increase by 37.0% in urban areas with an initially lower supply. The proportion of aged physicians will increase in all areas, especially in rural ones with an initially lower supply, where it will change from 14.4% to 31.3%. The inequity in the geographical distribution of physicians will expand despite an increase in the number of physicians in rural areas.
Conclusions We found that the geographical disparity of physicians will worsen from 2005 to 2035. Furthermore, physicians aged 25–64 will be more concentrated in urban areas, and physicians will age more rapidly in rural places than urban ones. The regional disparity in the physician supply will worsen in the future if new and drastic measures are not taken.
- future projection
- geographic distribution
- female physician
- aged physician
- Japan
This is an open access article distributed in accordance with the Creative Commons Attribution Non Commercial (CC BY-NC 4.0) license, which permits others to distribute, remix, adapt, build upon this work non-commercially, and license their derivative works on different terms, provided the original work is properly cited, appropriate credit is given, any changes made indicated, and the use is non-commercial. See: http://creativecommons.org/licenses/by-nc/4.0/.
Statistics from Altmetric.com
Strengths and limitations of this study
We projected the geographical distribution of physicians in Japan in the future.
A cohort-component model is widely used for making population projections, and provides a flexible and powerful approach.
In order to increase the accuracy of the future projection and make it easier to understand, we divided 342 areas into 4 area groups based on urban/rural status and lower/higher physician supply, based on earlier studies.
We could not calculate an accurate full-time equivalent of physician, because the database used in the study did not include their work hours.
There is the possibility that the trends used in our future projection will change significantly due to developments in policy and environment.
Introduction
Inequity in the geographical distribution of physicians is a major issue in many countries.1–6 In Japan, concern over this problem has grown in recent years because of a discussion on whether to maintain or reduce the number of enrolments in medical schools.7 Although Japan’s total population is expected to decrease from 128.06 million in 2010 to 116.62 million in 2030,8 the number of physicians has consistently increased because the current number of enrolments in medical schools has been maintained. Thus, this situation may lead to an oversupply of physicians in the future. In fact, according to the Ministry of Health, Labour and Welfare (MHLW), healthcare demand and physician supply will become balanced in 2024.9 On the other hand, the inequitable geographical distribution of physicians has remained and worsened.2 10 11 Only certain areas may receive the benefits of the increasing number of physicians. Consequently, in order to judge the future supply–demand balance of physicians, it is important to produce a clear future projection of the number of physicians by region.
In addition, physicians’ sex–age structure has been changing because of an increase in the number of female physicians and physicians aged 65 and over. After the rate of female enrolment in medical schools gradually raised from 18% in 1982 to 30% in 1993, it then stayed at about 30% until 2016.12 The percentage of female physicians increased from 12.7% in 1994 to 20.4% in 2014. Researchers have reported differences in workplace and specialty preferences between male and female physicians.13 14
Similarly, the number of physicians aged 65 and over is expected to increase in the future. The Japanese government implemented a plan intended to ensure ‘at least one medical school for each prefecture’ in 1973, which established new medical faculties in prefectures that lacked them, to resolve a physician shortage. As a result, the number of enrolments in medical programmes increased quickly from 4000 in 1969 to 8280 in 1981. Since then, the number gradually increased to 9262 by 2015. Physicians who graduated in 1981 will reach the age of 65 in around 2030. According to The Japan Institute for Labour Policy and Training,15 physicians over 60 tend to work three-quarters as long as those in their 30s. In addition, older physicians are more likely to retire from practice and go on to have a central role in education and management. In Japan, it has reported that the age of hospital physicians in rural areas is higher than in urban, and the difference in average age has been increasing between 1994 and 2014.16 Thus, when discussing the physician supply, the number of physicians should be separated into younger physicians and older physicians.
Some studies have predicted the number of physicians at the national level and reported that the total number is expected to increase.17–19 However, in discussing the future physician supply, it is also important to estimate different trends in the geographical distribution of physicians. Consequently, the purpose of this study is to project the future geographical distribution of physicians and their demographics.
Methods
Data source
This study obtained data on physicians for every year between 2005 and 2015 from the Medical Database supplied by Nihon Ultmarc (Tokyo). It was constructed and operated under the system of ‘shared use and joint maintenance’ by companies and organisations that were limited to the medical, welfare and health field. It was compiled by the companies and organisation using institutions’ websites, direct inquiries and interviews with physicians. Personal information listed in the database was handled appropriately according to the personal information protection law (specified at Ultmarc’s website in Japanese: https://www.ultmarc.co.jp/privacy/shared_use/). We were offered the database excluding personal information such as names or addresses. The use of this database in medical science studies is permitted. Recently, several studies were conducted using the database.20 21 The database lists each physician’s sex, birth year, graduation year and the municipality where they practise. Although some physicians had missing values for birth year, we estimated their age using their graduation year. We excluded physicians who had missing values for both birth year and year of medical school graduation, who accounted for about 2%–3% of the total number of physicians each year.
Population data were collected from the National Basic Resident Register, which is published annually by the Ministry of Internal Affairs and Communications. Population density was calculated by dividing the number of people residing in each secondary medical area (SMA) by area (km2). The area (km2) of each SMA was obtained from statistical reports on land areas of prefectures and municipalities by the Geospatial Information Authority of Japan. Estimated populations for 2020–2035 were obtained from the Population Projections for Japan (January 2012) by the National Institute of Population and Social Security Research.
Physicians
The Medical Database includes physicians who work at hospitals and clinics, and those who work at research institutions, educational institutions and welfare facilities, and physicians whose workplace is not registered. In this study, physicians whose workplace was not registered are defined as physicians not working. Physicians not working includes both temporary leave and retirement. However, it is unnecessary to identify these statuses in the model. In the future projection, we used all physicians in the database. In the results, however, we showed only the results for physicians working in hospitals or clinics.
There were physicians who had more than two workplaces registered but did not include information on working hours for each workplace in the database. Thus, we assumed that they worked the same hours at each workplace. For example, when a physician worked at two places, he/she was counted as 0.5 people in each area in which the workplaces were cited. Note that if a physician worked at an uneven number of places, we would round the number so that the total number would not be an integer.
In addition, our model assumed that all physicians retire at least by the age of 80, based on previous research,22 although there is no compulsory retirement age for physicians in Japan. In the subanalysis, the number of physicians under 65 years old was also calculated. In the Medical Database, a person’s record is removed if they die. Thus, if a physician was removed from the database before reaching 80 years old, we defined them as death.
The geographical unit
The geographical unit for this analysis was SMAs. In Japan, there are three levels of medical area: primary, secondary and tertiary. A primary medical area is set by the municipal boundary and generally provides basic primary care. A tertiary medical area is set by the prefectural boundary and provides the most advanced and specialised medical treatment. An SMA falls between primary and tertiary and is established by each prefectural government. An SMA is set according to medical resources and geographical factors, and mainly covers general inpatient medical care. All SMAs expect to offer sufficient healthcare, but the inequity in the physician supply has not yet been resolved.10 11 23 We analysed the 342 designated SMAs from 2012 in our study. Note that we excluded seven SMAs in Fukushima prefecture in our analysis because the estimated population data in these areas were lacking due to the large earthquake in 2011.
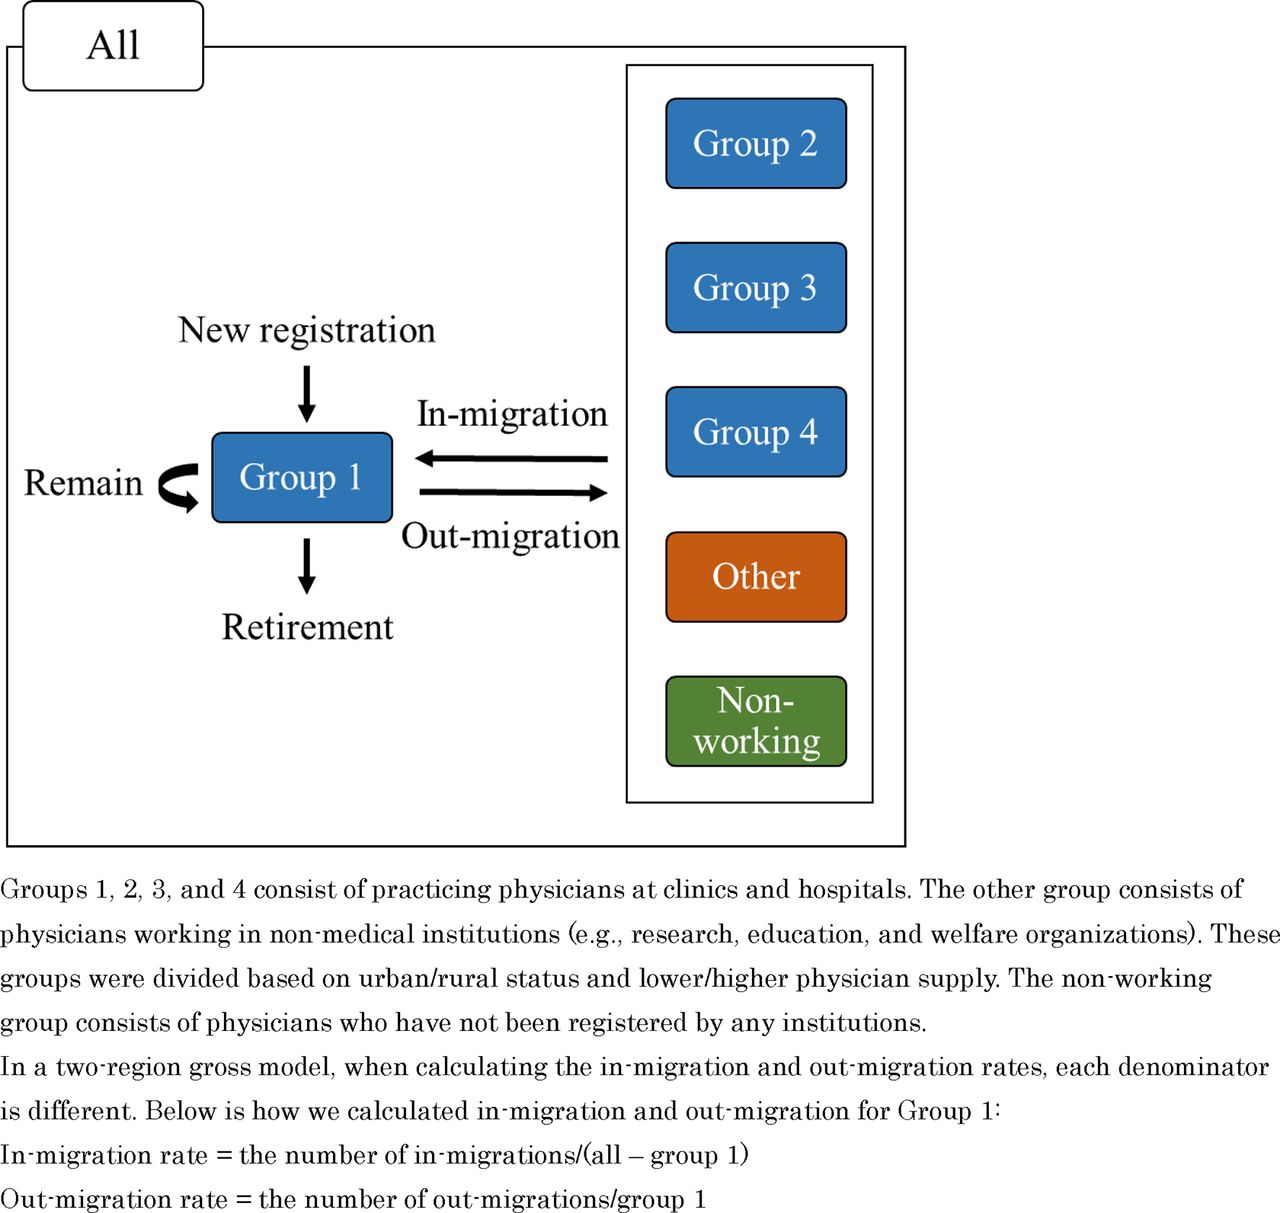
In order to increase the accuracy of the future projection and make it easier to understand, we divided the 342 SMAs into 4 area groups based on urban/rural status and lower/higher physician supply, based on earlier studies.11 21 23 Therefore, each group cuts across multiple SMAs and prefectures. The degree of urbanisation was defined as the median value of population density in 2005 as a proxy variable, and the degree of the initial physician supply was defined as the median value of number of physicians per 100 000 population in 2005. Through the combination of these two criteria, SMAs were divided into four groups: group 1 was composed of urban SMAs with a higher initial physician supply, group 2 of rural SMAs with a higher supply, group 3 of rural SMAs with a lower supply and group 4 of urban SMAs with a lower supply. In this study, these four groups were used to resemble four areas. Thus, a migrant physician was defined as a physician who changed their workplace from one group to another during the study period.
As previously mentioned, some physicians work for research, education and welfare organisations, and they were categorised into the ‘other’ group. In addition, some physicians were not registered with any institutions, and they were classified as the ‘non-working’ group. Therefore, in our calculation, there were six groups—group 1, group 2, group 3, group 4, other and non-working—but the results for the other and non-working groups are not shown.
The model
We projected the future supply of physicians using a cohort-component model, which is widely used for making population projections.17 24–28 This model provides a flexible and powerful approach.29
Our model treated each component of change in the physician workforce: mortality, new registrations, out-migration and in-migration. The physician workforce was divided into cohorts by age and sex. There were 11 5-year age cohorts, including one for 25–29 years old and continuing on to 30–34, 35–39 and so on up to 75–79. After separating males and females, there were 22 cohorts.
This model required the following assumptions to be set for each sex and age group: (1) basic physician workforce, (2) future mortality rate, (3) future new registrations rate, (4) future in-migration rate and (5) future out-migration rate. For the basic physician workforce, which served as the starting point for the projections, we used data on the physician workforce by age and sex as in the year 2015. About 16% of physicians from 25 to 29 years old are unknown in any workplace, because they are residents and often move around various medical institutions and departments. Therefore, it was difficult to capture their workplaces. In order to avoid underestimation, for physicians aged 25–29, we allocated physicians whose workplaces were unknown according to the percentage composition of physicians aged 25–29 in their workplaces that were known.
We calculated the mortality rate, new registrations rate, in-migration rate and out-migration rate of each group using the Medical Database during the 5 years from 2011 to 2015 and assumed that the rate would remain constant until 2035. As shown in figure 1, for the migration rate, we adopted a two-region model that was developed by focusing on two regions, one representing the area group to be projected and the other representing the rest of the area groups.29 The two-region model is more accurate than the net migration model, which is widely used, while the former model has more computational complexity than the latter.29 The difference between the two methods is that when calculating the migration rate, the former distinguishes between in-migration and out-migration, while the latter calculates them collectively. Then, when calculating the out-migration rate, the denominator is the number of physicians in the group to be projected, whereas when calculating the in-migration rate, the denominator is the number of physicians in the group to be projected subtracted from the number of physicians in all groups (eg, all groups—group 1). All analyses were performed using R statistical software (V.3.4.3).

The concept of the two-region gross migration model for group 1.
Patient and public involvement
Patients and public were not involved.
Results
Table 1 summarises the descriptive statistics for the four area groups composed of SMAs in 2015. There were 102 SMAs in group 1, 69 in group 2, 102 in group 3 and 69 in group 4.
Descriptive statistics for the four groups of SMA
Table 2 presents the changes in population, the absolute number of physicians and female physicians, and physicians aged 25–64 in groups 1–4 between 2005 and 2035. The total populations of the rural groups (groups 2 and 3) will decrease 3–5 times compared with those of the urban groups (groups 1 and 4). On the other hand, the number of physicians will increase in all groups, especially in group 4, which will increase by 25.7%. The number of female physicians will increase by more than 50% in all groups, with group 4 seeing a particularly large increase of 74.8%. Note that the number of physicians aged 25–64 will increase only in urban groups, and the number will decrease in rural groups.
Temporal estimate changes in population and physician number for the four groups of SMAs
Figure 2 shows the physician workforce pyramid for each group between 2005 and 2035. From the pyramid for 2015, male physicians in their 50s accounted for the largest proportion in all groups. In the case of female physicians, there was a peak in their 30s to early 40s. In 2035, in group 1, the age-specific distribution of male physicians will be close to flat, and the proportion of female physicians will increase. In group 3, the peak for male physicians will come from the late 60s to the early 70s, and the proportion of female physicians will not increase as much. Remarkably, the ageing rate of physicians will increase year by year in all groups. From 2005 to 2035, the proportion of aged physicians will change from 13.1% to 24.9% in all groups, 12.5% to 23.2% in group 1, 12.3% to 25.1% in group 2, 14.4% to 31.1% in group 3 and 15.2% to 27.0% in group 4. The ageing rates of physicians will accelerate more rapidly in group 3 than in other groups.
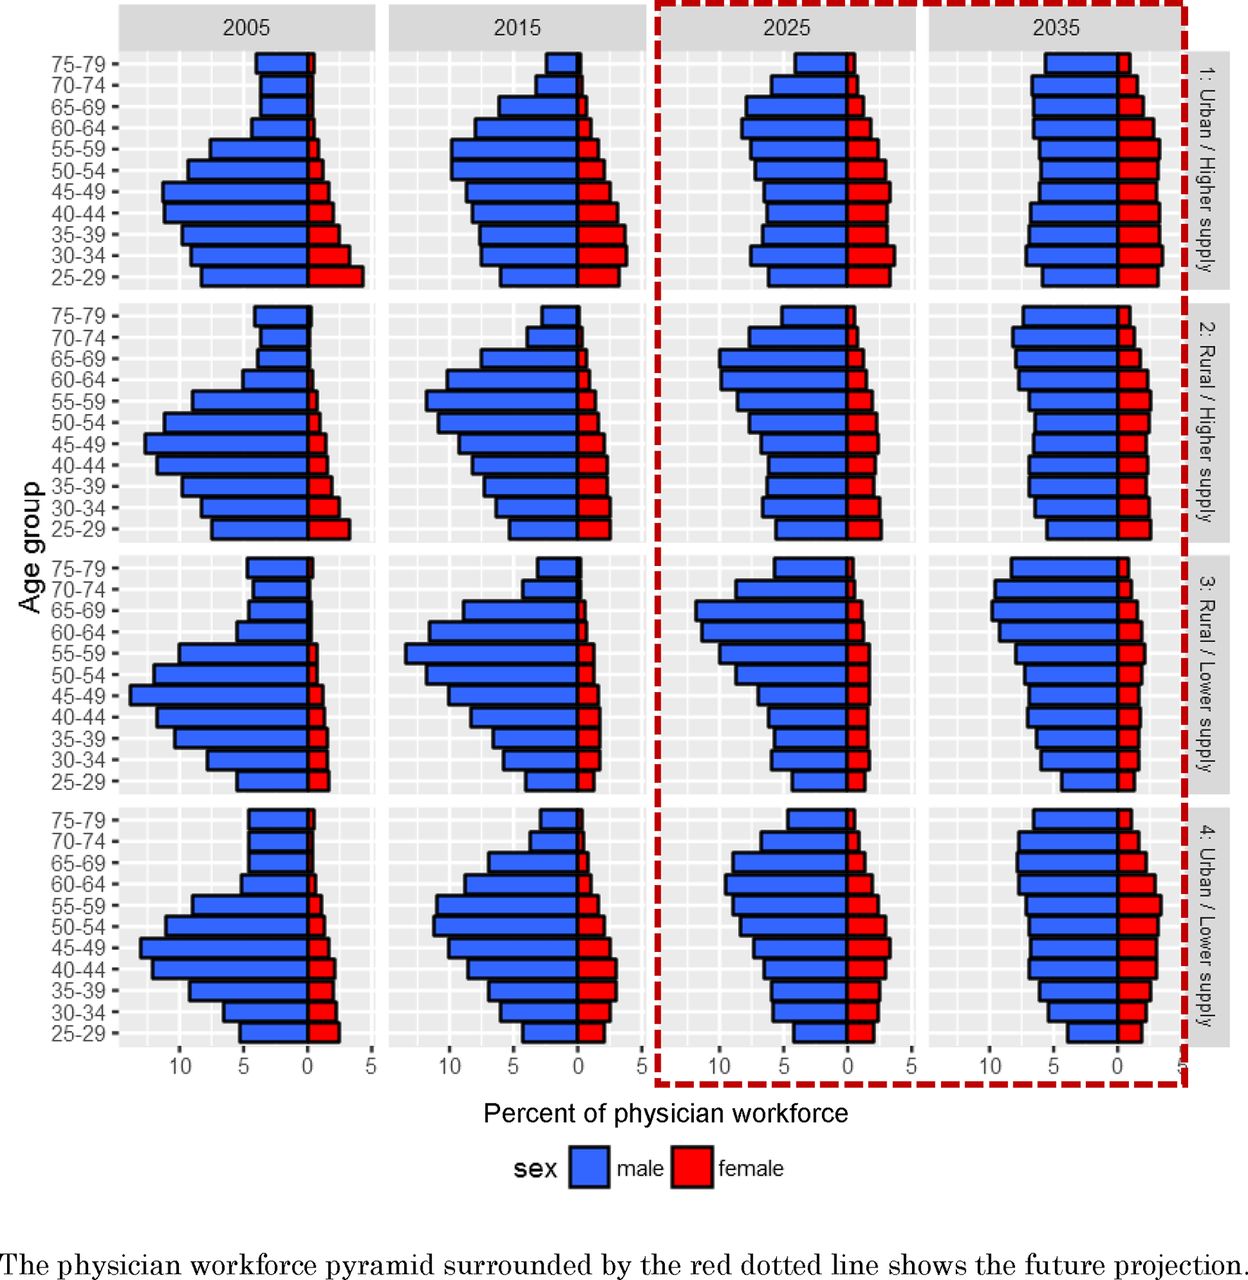
Physician workforce pyramids for the four area groups in 2005, 2015, 2025 and 2035.
Figure 3 presents the changes in the number of physicians of all ages, physicians aged 25–64, physicians aged 65 and over, and female physicians of all ages in each group from 2005 to 2035, when the number of physicians as of 2005 is set to 100 (online supplementary appendix figure 1A–D present the results in the case of physicians aged 25–34, 35–44, 45–54 and 55–64). As shown in figure 3A, in group 4, there will be a significant increase in the number of physicians of all ages. In groups 2 and 3, the number will be on an upward trend until 2025, but there will be little increase after that. As shown in figure 3B, in groups 2 and 3, the number of physicians aged 25–64 will show a rather decreasing trend; it is expected to be lower in 2035 than in 2005. Figure 3C shows that the number of physicians aged 65 years and older will increase by 250% at the national level and at almost the same speed in all groups. On the other hand, as shown in figure 3D, the number of female physicians will increase more in group 4 than in the other groups.
Supplemental material

Estimated trends in the number of physicians from 2005 to 2035.
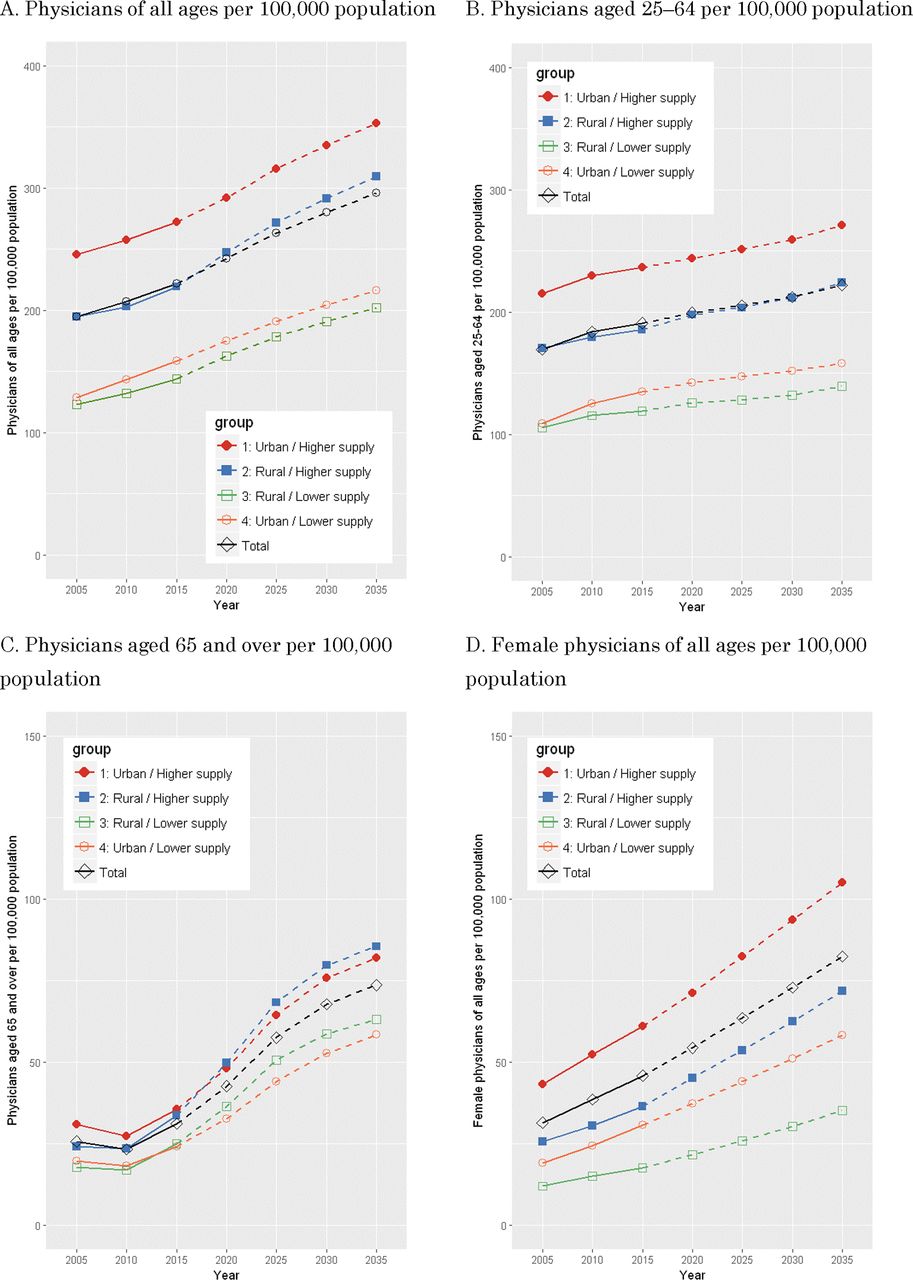
Figure 4 presents the changes in the number of physicians of all ages, physicians aged 25–64, physicians aged 65 and over, and female physicians of all ages per 100 000 population in each group from 2005 to 2035 (online supplementary appendix figure 2A–D present the results in the case of physicians aged 25–34, 35–44, 45–54 and 55–64). In all groups, the number of physicians of all ages per 100 000 population will increase. However, the gap between the group with the most physicians (group 1) and that with the least (group 3) will not be filled regardless of the large population decline in group 3. The absolute disparity in the number of physicians of all ages per 100 000 population will increase from 122.9 to 150.5 between 2005 and 2035 (group 1: 245.9 vs group 3: 123.0 in 2005; group 1: 352.9 vs group 3: 202.4 in 2035). Similarly, the absolute disparity in the number of physicians aged 25–64 per 100 000 population will increase from 109.8 to 131.5 between 2005 and 2035 (group 1: 215.1 vs group 3: 105.3 in 2005; group 1: 270.9 vs group 3: 139.9 in 2035). Furthermore, the absolute disparity in the number of female physicians of all ages per 100 000 population will increase from 31.3 to 69.9 between 2005 and 2035 (group 1: 43.2 vs group 3: 11.9 in 2005; group 1: 105.0 vs group 3: 35.1 in 2035).
Supplemental material

![[bmjopen-2018-023696-SP1.jpg]](https://bmjopen.bmj.com/content/bmjopen/8/9/e023696/DC1/embed/inline-supplementary-material-1.jpg?download=true)
![[bmjopen-2018-023696-SP2.jpg]](https://bmjopen.bmj.com/content/bmjopen/8/9/e023696/DC2/embed/inline-supplementary-material-2.jpg?download=true)
Estimated trends in the number of physicians per 100 000 population from 2005 to 2035.
Discussion
Main findings
Our study revealed that the inequity of the geographical distribution of physicians will increase from 2005 to 2035. Notably, our future projection found that the number of physicians aged 25–64 will decline by 6.1% in the rural group with an initially lower physician supply (group 3), although it will increase by 37.0% in the urban group with an initially lower supply (group 4). The proportion of aged physicians will increase in all groups, especially in group 3, where it will change from 17.3% to 31.3%. The number of female physicians will increase more in group 4 than in the other groups. The gap in the physician supply between groups 1 and 3 will continue to expand for physicians of all ages, those aged 25–64 and female physicians.
The inequity of the physician supply
Our results showed that the regional disparity in the physician supply will not be resolved even if the number of physicians continues to increase at the same pace as at present. Similarly, a previous study, which used a physician survey by the MHLW, reported that the geographical disparity in the physician supply at the prefecture level will continue until 2035 in Japan.17 The disparity in the physician supply will expand if new and drastic measures are not adopted. Currently, the number of enrolments in medical schools is at an all-time high, although a reduction in the number has been discussed in relation to Japan’s shrinking population.7 30 On the other hand, there is concern that reducing the number of enrolments may cause the inequity in the geographical distribution of physicians to become more serious. In fact, our results showed that in 2035, the number of physicians per 100 000 population in group 3 will be less than 60% of group 1, and will be below the OECD average number in 2015.31 Thus, reducing the number of enrolments while maintaining the current physician supply system may result in a serious physician shortage in rural areas, especially for those in group 3.
Female physicians
Internationally, more women are becoming involved in medicine.32 33 Some studies reported that female physicians are less likely to work in rural areas than in urban ones.13 14 In fact, our results indicated that female physicians will increase more in group 4 and the gap in the female physician supply between groups 1 and 3 will expand greatly. Female physicians are often prevented from working in rural, remote areas by cultural and social factors.34 In particular, the gender gap in Japan, which is composed of gender gaps in economic, political, educational and health criteria, was ranked 101 out of 145 countries.35 Kaneto et al 13 reported that the pattern of workforce participation by female physicians was the same as that of women working in other industries in Japan. That is, they were affected by family issues, particularly with their children. In addition, although the number of female physicians has increased in Japan, the proportion of female physicians is the lowest (20%) among the OECD countries (OECD average: 45%).36 Thus, the government and workforce planners should continue to take measures to overcome the obstacles to work in rural areas for female physicians and change the male-dominated workforce.
Younger and older physicians
Physician ageing has been of concern in developed countries. Figure 3C shows that the number of physicians aged 65 and over will increase rapidly in all groups. The correlation between physician ageing and clinical performance is controversial.37 Further, regarding the supply of physicians, it is possible that physician ageing exacerbates physician shortage because older physicians are likely to retire and have shorter working hours than young physicians. Hence, in order to secure the physician supply, it is important to increase the number of younger physicians. However, figure 3B shows that physicians aged 25–64 in groups 2 and 3 which are the rural groups, will not increase but rather decrease.
This trend may be affected by the fact that young physicians are not gathering at university hospitals because of the new clinical training system for residents established in 2004. Before that, the university hospitals took responsibility for dispatching physicians to rural areas. Many residents belonged to university hospitals and received training. However, since the new system was started, residents have had many options for training hospitals, and the number of residents choosing university hospitals has decreased. As a result, the number of physicians at university hospitals became insufficient, making it difficult to dispatch physicians to rural areas. Some researchers have reported that the new system exacerbated the regional disparity in the physician supply.2 38 In addition, this may also be related to changes in physicians’ specialist orientations in Japan.23 39 40 This may lead to a concentration of physicians in urban areas because physicians with high expertise (or physicians trying to become such physicians) are likely to be concentrated in urban areas due to the facilities, environment and number of cases.
Note that the number of physicians aged 65 and over decreased a little from 2005 to 2010, but only temporarily. The main reason for this decrease was that the number of physicians aged 75–79 was higher than that of other older physicians as of 2005. They became physicians around the end of the Second World War; therefore, there is the possibility that the number of physicians temporarily increased at that time. As of 2010, they became 80 years old and older and were left out of the study. Thus, our results showed a temporary decrease from 2005 to 2010. We also confirmed the same trend in a different physician database in 2004: the physician survey by the MHLW.
Physician supply policies
WHO published guidelines for securing healthcare providers in remote and rural areas, and it strongly encouraged students from rural backgrounds to enrol in medical departments.41 This solution was clarified in previous studies,42 43 and such a policy has recently been strengthened in Japan. A regional quota admission system for medical schools has been introduced: it is called the chiikiwaku system.44 This system has been implemented by each university by combining the following elements: (1) scholarship, (2) time of selection (prior to or after enrolment), (3) obligation to work in a rural area or a specific department for a certain period after graduation (approximately 9 years) and (4) designation of home town. Because the regional quota started to increase in around 2008, it will be necessary to verify the effect in the future. The effect of this system is barely reflected in our future projection using data up to 2015.
On the other hand, WHO guidelines also recommended regulation, financial incentives, and personal and professional support. In terms of financial incentive, scholarships are being offered from local governments to medical students other than regional quota students, subject to working in rural areas or in a specific clinical department. Besides this, rural physicians tend to have higher salaries than urban physicians because of a lack of physicians in rural areas and financial support to regional hospitals from the public sector. In terms of professional support, telemedicine in image diagnosis, as well as advice and education using video conference, are widespread. Moreover, the national and prefecture governments support rural physicians by dispatching locums from rural health-supporting hospitals (hekichi-iryo-kyoten-byouin) and providing educational opportunities based on regional health plans (chiiki-iryo-keikaku). Although these efforts have been made, the inequity in geographical distribution of numbers of physicians has been expanding.
For physicians working in rural areas, it is becoming a big concern as to whether or not they can acquire expertise. To eliminate such anxiety, it is important to concretely prepare career paths for such physicians to gain expertise. One possibility is to create opportunities to acquire expertise at a hospital that can provide good training. Furthermore, further strengthening of remote support for diagnosis, planning, treatment and professional education is also considered necessary. With this support, it may be better to develop the system collectively at the national level, rather than within each local government. In addition, based on the hub-and-spoke model taken from logistics, it may be better to establish and strengthen hub hospitals in rural areas, which can be responsible for the educational and training functions that are likely to be lacking in rural areas.
Limitations
This study had several limitations. First of all, the database did not include work hours. Thus, we could not calculate an accurate full-time equivalent. Second, the physician database that we used was collected by medical representatives of pharmaceutical companies. Thus, some physicians may not have been registered because they did not come into contact with a medical representative. In addition, we excluded physicians who were missing data for both birth year and graduation year. This may have caused some bias. However, when compared with the database and the physician survey conducted by the MHLW, there was almost no difference in the number of physicians per age group (data not shown). Because the database we used updates the data on a daily basis, it may be more accurate than the physician survey, which is conducted every 2 years. Third, our future projection was based on trends from 2011 to 2015, and there is the possibility that these trends will change significantly due to developments in policy and environment.
Conclusions
Using the cohort-component method, our study revealed that the geographical distribution of physicians will worsen, although the number of physicians per 100 000 population in rural areas will increase. Furthermore, physicians aged 25–64 will be concentrated in urban areas, and the ageing rate of physicians will accelerate more rapidly in rural areas than urban ones. The regional disparity in the physician supply will worsen in the future if new and drastic measures are not put in place.
References
Footnotes
Contributors KH contributed to the study conception and design, data collection, analysis, interpretation and drafting the manuscript. SK and NS contributed to the data collection and data management. YI contributed to the study design, data acquisition and interpretation. All authors critically revised the manuscript and approved the final version.
Funding This work was supported in part by a Health Sciences Research Grant from the Ministry of Health, Labour and Welfare of Japan (Grant number: H27-iryo-ippan-001), a Grant-in-Aid for Scientific Research from the Japan Society for the Promotion of Science (Grant number: A16H02634) and RISTEX, Japan Science and Technology Agency.
Competing interests None declared.
Patient consent Not required.
Ethics approval The study was approved by the Ethical Committee, Kyoto University Graduate School of Medicine, Japan (number R0438).
Provenance and peer review Not commissioned; externally peer reviewed.
Data sharing statement No additional data are available.