Article Text

Abstract
Objective To identify the extent that sex, age and body mass index (BMI) is associated with medical and pharmacy costs.
Design Retrospective cohort.
Setting A school district in the Western USA involving 2531 workers continuously employed during 2011–2014.
Main outcome measures Medical and pharmacy costs and BMI.
Results Approximately 84% of employees participated in wellness screening. Participants were 1.03 (95% CI 1.01 to 1.06) times more likely to be women and younger (M=47.8 vs 49.8, p<0.001). Median medical and pharmacy costs were higher for women than men, increased with age, and were greater in morbidly obese individuals (p<0.001). Annual pharmacy claims were 18% more likely to be filed by women than men, 23% more likely filed by those aged ≥60 versus <40 years, and 6% more likely filed by morbidly obese individuals than of normal weight (p<0.001) individuals. Greater medical and pharmacy costs in older age were most pronounced in underweight and morbidly obese groups. Higher use of medication among women than men was primarily because of drugs involving birth control, osteoporosis, thyroid disease and urinary tract infection. Higher medication use in older age was primarily related to medications used to treat gastrointestinal problems. Medication use was positively associated with BMI weight classifications for most of the 33 drug types considered, with exceptions involving birth control, herpes and osteoporosis. A J-shape relationship was observed between BMI and medication use for acne, antibiotic, cold/influenza/allergy, eye infection, oedema, muscle spasms, pain and ulcers.
Conclusions Medications associated with higher medical and pharmacy costs among women, older age and underweight or obese individuals are identified. Lowering medical and pharmacy costs requires weight management in older ages, particularly for underweight and obese. Higher pharmacy costs for certain drugs among underweight individuals may be associated with poorer nutrition.
- body mass index
- obesity
- prevention
- pharmaceuticals
- screening
This is an open access article distributed in accordance with the Creative Commons Attribution Non Commercial (CC BY-NC 4.0) license, which permits others to distribute, remix, adapt, build upon this work non-commercially, and license their derivative works on different terms, provided the original work is properly cited, appropriate credit is given, any changes made indicated, and the use is non-commercial. See: http://creativecommons.org/licenses/by-nc/4.0/.
Statistics from Altmetric.com
Strengths and limitations of this study
A large cohort of employees was available for retrospective assessment of the association between sex, age and body mass index with medical and pharmacy costs.
The association between sex, age and 33 specific types of medication were assessed, some of which have not been previously considered.
All active employees received employer-sponsored medical and pharmacy coverage, and 84% had information that allowed us to determine body mass.
A few medications may have contributed to weight gain, which we were unable to adjust for in the current study.
The study population and patterns of prescription drug use may limit generalisation of the results.
Introduction
Many companies offer wellness-screening programmes consisting of health risk assessment (HRA) and biometric screening. The 2016 Employer Health Benefits Survey found that among large firms (200 or more employees) in the USA, 59% offered HRA (of which 32% had an incentive component) and 53% offered biometric screening (of which 31% included an incentive component).1 These programmes are intended to promote a greater sense of personal responsibility for lifestyle choices, identify the need for health behaviour change, reduce future health problems, encourage patient management of existing health problems, decrease worker absenteeism and improve job satisfaction and worker productivity.2–7
Larger companies are also required to offer employer-sponsored medical and pharmacy coverage for their employees. Hence, information obtained on the HRA and screenings can be compared with the medical and pharmacy costs.
Medical and pharmacy costs are influenced by a number of factors, including sex, age and body mass index (BMI).8–10 Although medical costs are often a response to acute and chronic health conditions, pharmacy costs are often incurred to prevent more serious health problems. For example, antihypertensive medication or statins are useful in preventing cardiovascular disease11–13; multivitamins or folic acid for preventing congenital abnormalities14; aspirin and non-steroidal anti-inflammatory for preventing colorectal cancer15; bronchodilators, steroids and anti-inflammatories for managing asthma16 and non-steroidal anti-inflammatory drugs, steroids, analgesics and immunosuppressive drugs for managing arthritis.17 Consequently, wellness screening may actually increase the use of prescription medication.18
Although a person’s body weight may be associated with increased risk for various chronic health conditions and poorer health-related quality of life,19 20 only in the last 15 years or so has its impact on healthcare expenditures been assessed.10 Further, only a small number of studies have explored the association between body weight and prescription drug use. A study conducted in England found that overweight and obese individuals were more likely to receive medication for the cardiovascular system; gastrointestinal system; respiratory system; central nervous system; endocrine system; gynaecology/urinary disorders; musculoskeletal and joint disorders; infections; eye, ear and oropharynx problems and skin disorders.21 A study in Sweden showed that the use and cost of medication in general are significantly greater in obese individuals.22 A study in the USA found that obesity was responsible for $7 billion in Medicare prescription drug costs in 2006.23 Another study conducted in the USA identified increased medication use during 1988 through 2012, with the increase most prominent among obese individuals.24 A large cross-sectional study of 9789 adults in the National Health and Nutrition Examination Survey (NHANES) found that obese individuals use several prescription drugs (eg, hypertension, lipid-lowering and diabetes medications) more frequently than normal weight individuals.25 Another study based on NHANES data found that while medication use increased over time for obese individuals compared with normal weight individuals ages 40 years and older, the increase was only marginal for those aged 25–39 years.26 One study found that obese individuals used more analgesic, asthma, cardiovascular, diabetes, intranasal allergic rhinitis, thyroid and ulcer medications.27
The purpose of the current study was to identify the extent to which sex, age and BMI weight classifications are associated with medical and pharmacy costs among a large group of teachers, administrators and other school staff. These associations are also evaluated for 33 more commonly prescribed medications.28 Although studies have previously looked at the association between BMI and prescription medications, we evaluated some drugs that have not been formerly considered, and the breadth of drugs covered is greater than in past studies. In addition, evaluating the effect of being underweight on medical and pharmacy costs, and on specific drug types, is unique to this study.
Methods
Patient and public involvement
A retrospective cohort study was conducted that associated sex, age and BMI with medical and pharmacy cost data for employees of a large school district in the western USA. Specific patients and or the general public was not involved in this study. BMI was obtained from those employees who participated in wellness screening. Employer-sponsored insurance was available to all employees. The school district comprised of six high schools, eight junior high schools and 31 elementary schools. Employees consisted of approximately three teachers to every one staff member (cooks, bus drivers, ground keepers, maintenance workers, administrators and clerical workers). We were not provided specific job type and salary for each employee. However, we can assume that the teachers, administrators, counsellors and nurses, who represent almost all of the employees, had at least a college degree, that their salaries are commensurate with other school districts, and that the employer-sponsored insurance coverage was not strongly impacted by the employee’s income or education.
The study involved the academic years 2010–2011, 2011–2012, 2012–2013 and 2013–2014. Employees were offered wellness screenings (personal HRA and biometric evaluation) each fall. Medical and pharmacy claims data were also obtained for the employees in each academic year. Wellness screening and claims data were combined with a file of eligible employees and assessed within each academic year. The eligibility file contained information on current employment, sex, age and year.
Wellness screening
All employees were offered wellness screening. Although participation was voluntary, it was promoted through incentives. The HRA involved 36 questions. Biometric screenings involved measurements of BMI (kg/m2), blood pressure (mm Hg), cholesterol (mg/dL) and glucose (mg/dL). The HRA and biometric screenings were provided at no cost to the employees, and were made available on location or with a personal physician. A health nurse or physician assisted the employee in interpreting their HRA and screening results, in order to help guide their need for lifestyle changes and control measures. The current study only considers BMI. Weight classifications are based on commonly accepted ranges of BMI, as follows: underweight (BMI: <18.5), normal weight (BMI: 18.5–24), overweight (BMI: 25–29), obese (BMI: 30–39) and morbidly obese (BMI: 40+).
Medical and pharmacy claims data
All active employees received employer-sponsored medical and pharmacy coverage, for themselves and their families. The school district is fully insured with a retained-retention agreement that makes the plan act very much like a self-funded health plan. Each month, the district pays a health insurance premium for the cost of healthcare and a small premium for reinsurance of catastrophic claims. Catastrophic claims greater than $250 000 are reinsured by a stop loss policy and are not paid for by the school district. Employee pharmacy data do not include over-the-counter drugs, but only those medications requiring a prescription. In the USA, a drug is sold over-the-counter if the Food and Drug Administration deems it as sufficiently safe and effective. These medications are not included in the current study. Further, medical and pharmacy cost represents the amount paid by the insurance company as well as copays by the employee.
Statistical techniques
Counts, means, SD, medians and percentages were used to describe the study population. Pair-wise comparisons of means were evaluated for statistical significance using the Student-Newman-Keuls Test. Risk ratios compare having a medical and pharmacy cost above the 50th percentile (vs below), 75th percentile (vs below) and 90th percentile (vs below). Statistical significance was determined by the corresponding 95% CI. For selected medications, the risk of medication use was compared using risk ratios and attributable fraction percentages across the levels of sex, age and BMI weight classifications. Statistical significance of differences in per cent use of selected medications across sex, age and BMI categories was based on two-sided tests of significance using the 0.05 level against a null hypothesis of no association. Data were evaluated using the statistical software package PC-SAS V.9.4.
Results
In 2010–2011, there were 3023 eligible employees, of which 2531 (83.7%) remained employed through the academic year 2013–2014. Those more likely to remain employed over the study period were 40–59 years of age and had lower medical and pharmacy costs (table 1). In 2010–2011, ages ranged from 18 to 76, with mean age significantly younger for those who remained employed (46.9 vs 49.2, p<0.0001). Those who stayed with the school district had significantly lower mean medical costs ($3056 vs $7887, p<0.0001) and mean pharmacy costs ($859 vs $1105, p=0.0387). The results of this study are based on those continuously employed over the four academic years.
Characterisation of the study group according to sex, age, medical and pharmacy costs
Most employees participated in annual wellness screening (84.1% in 2010–2011, 84.4% in 2011–2012, 87.6% in 2012–2013 and 80.7% in 2013–2014). In 2010–2011, there was no significant difference in mean medical cost between those who participated in wellness screening and those who did not ($3148 vs $2571, p=0.2900). However, median medical cost was significantly greater for those who participated in wellness screening ($588 vs $470, p=0.0454). For all academic years, women were 1.03 (95% CI 1.01 to 1.06) times more likely than men to complete annual wellness screenings, after adjusting for age and academic year. Participants in wellness screening were significantly younger (M=47.8 vs 49.8, p<0.0001), after adjusting for sex and year. Those participating in wellness screening had significantly lower annual mean medical cost ($3093 vs $4181, p=0.0013), but experienced no significant difference in annual mean pharmacy costs, after adjusting for age, sex and year.
Among participants in annual wellness screening, mean BMI remained constant across the academic years (table 2). Mean BMI was greater for men than women and in ages 40 years and older. Medical and pharmacy costs were highly positively skewed, with considerable variability. Hence, identifying significant differences in the mean costs across the levels of sex, age and year was less likely to occur than to find significant differences in the median costs across the levels of these variables. Medical costs were higher for women than men, increased with age, and were greater in morbidly obese individuals. Pharmacy costs were higher in women than men, increased with age and were lowest in those of normal weight.
Medical and pharmacy costs according to sex, age, year and body mass index (BMI)
The risk of medical and pharmacy costs above the 50th, 75th and 90th percentiles according to sex, age and BMI weight classification is shown in table 3. Higher BMI has a greater impact on higher percentiles of medical and pharmacy costs. For example, morbidly obese compared with normal weight are 1.13 (13%), 1.30 (30%) and 1.93 (93%) more likely to have pharmacy costs above the 50th, 75th and 90th percentiles, respectively. Medical and pharmacy costs above these percentiles are greater in women than men and increase with age.
Risk of medical and pharmacy costs (US$) above the 50th, 75th and 90th percentiles according to BMI weight classification, sex and age
Associations between selected percentiles of medical and pharmacy costs and BMI weight classifications varied according to age (figure 1), but not sex (data not shown). Greater medical and pharmacy costs with older age groups are seen in the graph. However, the increasing costs with higher age are most pronounced in the underweight and morbidly obese groups.

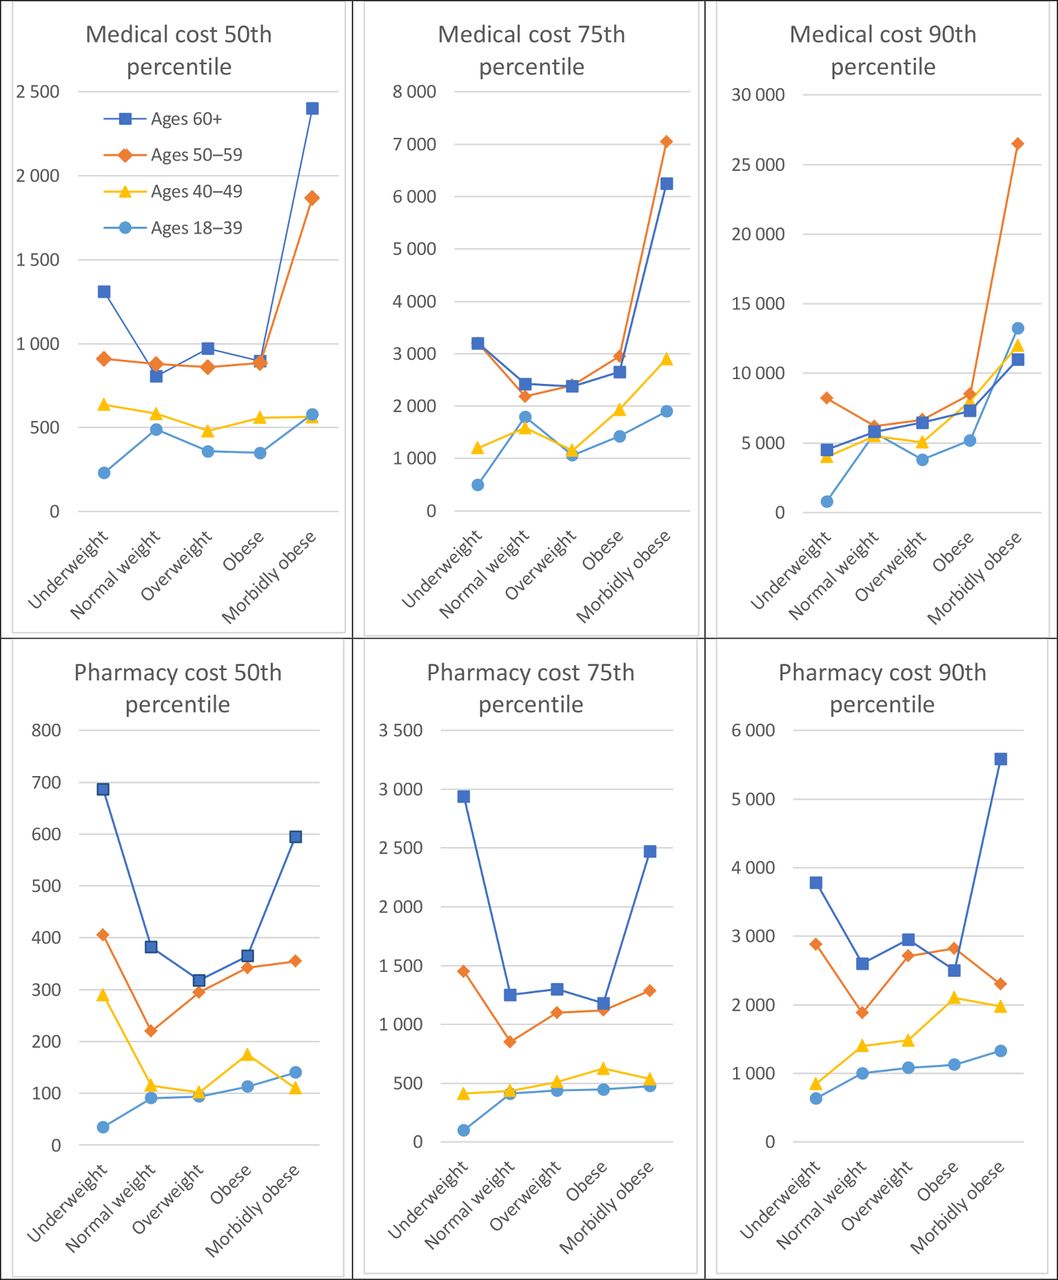
Median medical and pharmacy cost (US$) according to body mass index weight classifications and age.
Medication use is shown across sex, age and BMI groups in table 4. For any medication, women were 18% more likely to file a claim than men, employees 60 years of age or older were 23% more likely to file a claim than those less than 40 years and morbidly obese were 6% more likely to file a claim than those of normal weight. For 22 of the 33 medications considered, the percentage of annual claims was higher for women than men. For high blood pressure and statins, the percentage of claims was greater for men than women. For 25 of the medications, the percentage of annual claims increased with age. For 24 of the medications, the percentage of annual claims was associated with BMI (20 positively and 4 negatively). The strongest positive associations involved diabetes, high cholesterol (statins), blood thinners, high blood pressure and oedema. Negative associations involved acne, birth control, herpes and osteoporosis. The highest annual per cent of acne, antibiotic, cold/influenza/allergy and eye infection medications occurred in underweight individuals. For oedema, muscle spasms, pain and ulcers, medication use was comparatively high in underweight individuals, dropped for normal weight and then increased in higher weight classifications.
Medication use according to sex, age and BMI weight classification
We also report the attributable fraction in the population. For example, this statistic says that 8.82% of diabetes medication is attributed to being overweight, 20.34% is attributed to being obese and 30.43% is attributed to being morbidly obese. Where the risk ratio is less than 1, the preventive fraction can be estimated. For example, the risk of requiring osteoporosis medication is lower for obese compared with normal weight employees (ie, risk ratio=0.54). The corresponding preventive fraction is 66%, meaning in the absence of obesity, there would be 66% fewer claims for osteoporosis medication. The attributable fraction in the population and the preventive fraction both assume a cause-and-effect association between exposure and disease.
Discussion
The current study identified the degree to which sex, age and BMI are associated with medical and pharmacy costs among employees in a large school district. Associations were also evaluated for 33 commonly prescribed medications.28 The study extends previous research by including certain medications not previously evaluated and considering associations for all BMI weight classifications.
Higher medical and pharmacy costs among women, in older age, and among those not of normal weight is consistent with previous research.8–10 Greater medical and pharmacy costs with older age are most pronounced in the underweight and morbidly obese groups. Hence, weight management at older ages appears particularly important in terms of lowering medical and pharmacy costs.
Higher medication use in women than men was primarily because of drugs involving birth control, osteoporosis, thyroid disease and urinary tract infection. Prescription costs for vitamins/minerals were also noticeably higher in women than men. Family planning and prenatal care may explain the greater use of birth control medications and vitamins/minerals among women. Loss of oestrogen in women at older ages and female reproductive hormones may contribute to the higher level of osteoporosis and thyroid disease in women.29 30
Medication use was higher in those aged 60 years and older compared with those younger than 40, primarily because of diabetes, oedema, high blood pressure, high cholesterol (statins) and thyroid disease. Previous research has shown that the risk of these diseases increase with age.31–35 Medication use also noticeably increased with age for acid reflux, bowel/rectum, inflammation and stomach acid. This is consistent with older age tending to be associated with more gastrointestinal problems.36
Medication use was highest in those who were morbidly obese. We found positive associations between body weight and higher use of medications for treating acid reflux, fungus, bacterial infections, arthritis, asthma, cold, influenza, allergies, depression, diabetes, oedema, high blood pressure, muscle spasms, nausea/vomiting, pain, high cholesterol, stomach acid, thyroid and ulcers. Other studies have identified similar associations.21 24 25 27 Morbidly obese individuals were also more likely to be prescribed vitamins and minerals than normal weight individuals. We did not find an association between body weight and increased use of medication for the bowel/rectum, skin or urinary tract, which was counter to that found in other studies.21 37–39 We also assessed but did not find a significant association for medications used to treat anxiety, insomnia, convulsions or teeth and gums. The insignificant finding for anticonvulsants and teeth and gums may be because of insufficient power (ie, small numbers). Finally, we assessed the association between body weight and medications for birth control, herpes and osteoporosis, where significant negative associations were found. We are not aware of other studies that have looked at the association between body weight and medications used for cold, influenza, depression, oedema, birth control, herpes or osteoporosis.
Greater use of medication to treat acid reflux or stomach acid among individuals with higher BMI is consistent with previous research showing hospitalisation rates for reflux disease to be positively associated with BMI.40 41 Another study found that higher BMI was associated with increased gastro-oesophageal reflux in both normal and overweight individuals.42 Heavier body weight can add pressure to the stomach and diaphragm, thereby resulting in reflux. Further, increased use of medication for nausea/vomiting among individuals with higher BMI weight classifications is consistent with other research.43
The positive association between higher BMI and increased use of medication for ulcers is consistent with other research, particularly peptic (gastric and duodenal) ulcers.44 45 The mechanism to explain the association between obesity and peptic ulcer disease remains unclear. Obesity is also associated with Helicobacter pylori, which has been linked with gastric ulcers.46
Previous research has shown that overweight and obese individuals are at greater risk for infections.37–49 This is consistent with our findings that show increased use of antibiotics and medication for acne, cold/influenza/allergy and eye infections among obese individuals. However, it has been shown previously that antibiotics can also weaken the immune system,50 as well as lead to obesity.51 Some inflammatory diseases known to be associated with obesity in which we found a positive association between obesity and medication included influenza,52 53heart disease,54 diabetes,55 allergies,56–59 asthma,60oedema61–63 and arthritis.64–67 A compromised immune system may also trigger autoimmune diseases, including rheumatoid arthritis and thyroid disease,68 as indicated in the current study.
Overweight and obese individuals were more likely to receive cold, influenza or allergy medication. Obesity is associated with impaired immune response to influenza vaccination in humans.69 Because vaccination is less successful for obese individuals,70 71 a greater level of medication may be sought for treating cold, influenza and allergies.
Overweight and obese individuals received higher levels of pain medication. Research indicates that the nature of the relationship between higher BMI and pain is likely indirect.72 For example, greater body weight is associated with osteoarthritis, which, in turn, leads to pain.73 Being overweight or obese may result in greater risk for back pain, joint pain and muscle spasms.74 One study also found that obese individuals were more sensitive than those of normal weight to pressure pain.75
We found that higher BMI was associated with depression medication, as consistent with previous research.76–79 In one study, the age-adjusted level of depression among adults (ages 20 and older) in the USA was 43.2% for those with depression compared with 33.0% for those without depression.80 It may be that higher use of prescription medication for depression among those with greater BMI is partly because these people are more likely to experience other conditions related to depression, such as heart disease and diabetes.81–83
There was more use of vitamins/minerals among morbidly obese employees. Of the prescribed vitamins/minerals, only 8.0% involved vitamin B and 57.3% involved vitamin D. A previous study showed an association between low vitamin B12 and being obese.84 Another study found that the prevalence of vitamin D deficiency was 35% greater in obese individuals.85
Acne, antibiotic, cold/influenza/allergy and eye infection medications were prescribed more often for underweight individuals. This is consistent with underweight individuals having poorer nutrition and, consequently, a weakened immune system.86 For oedema, muscle spasms, pain and ulcers, medication use showed a J-shape relationship with BMI weight classification. Poor nutrition may also explain the higher levels of medication use among underweight individuals for these medications. Despite mean medical costs being similar for those who participated in wellness screening during the first year of the study, over the four academic years, participants in wellness screening ended up having significantly lower mean medical costs. However, pharmacy costs did not go down. It has been shown that wellness screening can cause the number and cost of pharmaceuticals to go up, at least initially, as the need for treatment is identified.87 Identified treatment needs can then, in turn, help prevent more costly health problems in the future. For example, medications used to treat high blood pressure can result in lowering the risk of diabetes, heart disease, stroke and kidney disease; treatment of insomnia can help lower the risk of irritability, depression or anxiety, difficulty in paying attention and accidents due to increased errors; treatment of high cholesterol with statins can help lower the risk of cardiovascular disease; treatment of oral infections can help reduce the risk of diabetes, cardiovascular disease and preterm birth and vitamins/minerals can help prevent a host of diseases (scurvy, rickets, anaemia, neural tube defects and pellagra). High blood pressure and statin medications were among the highest prescribed in our study.
A limitation of this study involves external validity (generalisability). Specifically, the study only considered those individuals who remained employed over all four academic years. These people were generally healthier and in the age range 40–59. The study also focused on those who completed wellness screening because they contained BMI information. These employees were more likely women and younger. In addition, the causal direction between medication use and BMI could not be determined. That is, some medications may have contributed to body mass, whereas others were in response to body mass. Finally, the current study did not have information on the use of vitamins or minerals obtained over the counter and small numbers made it impossible to evaluate the relationship between specific types of vitamins/minerals and sex, age and BMI.
Conclusion
Weight management at older ages, particularly in underweight and morbidly obese individuals, is most important for lowering medical and pharmacy costs. Medical costs decreased, possibly because of effective drug treatment and prevention. Pharmacy costs remained constant, possibly because screening identified a need for certain medications. Greater use of medication among women than men is primarily because of drugs involving birth control, osteoporosis, thyroid disease and urinary tract infection. Greater medication use in older age is primarily related to medications used to treat gastrointestinal problems. Medication use was positively associated with BMI for most of the conditions being treated, with exceptions involving birth control, herpes and osteoporosis. A J-shape relationship between BMI weight classification and medication use for acne, antibiotic, cold/influenza/allergy, eye infection, oedema, muscle spasms, pain and ulcers may be because of poorer nutrition in underweight individuals.
References
- 1.↵
- 2.↵
- 3.↵
- 4.↵
- 5.↵
- 6.↵
- 7.↵
- 8.↵
- 9.↵
- 10.↵
- 11.↵
- 12.↵
- 13.↵
- 14.↵
- 15.↵
- 16.↵
- 17.↵
- 18.↵
- 19.↵
- 20.↵
- 21.↵
- 22.↵
- 23.↵
- 24.↵
- 25.↵
- 26.↵
- 27.↵
- 28.↵
- 29.↵
- 30.↵
- 31.↵
- 32.↵
- 33.↵
- 34.↵
- 35.↵
- 36.↵
- 37.↵
- 38.↵
- 39.↵
- 40.↵
- 41.↵
- 42.↵
- 43.↵
- 44.↵
- 45.↵
- 46.↵
- 47.↵
- 48.↵
- 49.↵
- 50.↵
- 51.↵
- 52.↵
- 53.↵
- 54.↵
- 55.↵
- 56.↵
- 57.↵
- 58.↵
- 59.↵
- 60.↵
- 61.↵
- 62.↵
- 63.↵
- 64.↵
- 65.↵
- 66.↵
- 67.↵
- 68.↵
- 69.↵
- 70.↵
- 71.↵
- 72.↵
- 73.↵
- 74.↵
- 75.↵
- 76.↵
- 77.↵
- 78.↵
- 79.↵
- 80.↵
- 81.↵
- 82.↵
- 83.↵
- 84.↵
- 85.↵
- 86.↵
- 87.↵
Footnotes
Contributors RM conceived and designed the epidemiological study, contributed to acquisition of data, analysed and interpreted the data, and drafted the manuscript. RF interpreted the data, provided a literature review and revised the manuscript. Both authors critically revised the manuscript for important intellectual content. The manuscript has been read and approved by both authors.
Funding The authors have not declared a specific grant for this research from any funding agency in the public, commercial or not-for-profit sectors.
Competing interests None declared.
Ethics approval Study approval was obtained from the institutional review board at Brigham Young University (IRB E1 5259).
Provenance and peer review Not commissioned; externally peer reviewed.
Data sharing statement The data sets used and analysed in this study are available from the corresponding author on reasonable request.
Patient consent for publication Employee data consisted of sex, age, and BMI, which was linked to medical and pharmacy claims data. No personal identifying information was retained in the linked data set.