General mortality consistently declined in the United States (US) from 1969 to 2013. During the same period a decrease in the percentage of deaths attributed to the main Non-Communicable Diseases (NCD) including heart disease, cancer, chronic obstructive pulmonary disease (COPD), cerebrovascular diseases and diabetes1 has been described. In 2015, however, an increase in all cause premature mortality was reported among specific US races. Thus, premature mortality increased among Non-Hispanic Whites (NHW) mainly due to external causes such as drug use, suicide and poisoning. Conversely premature mortality was reported to decline among Non-Hispanic Blacks (NHB); this decrease was explained by a similar decrease in tobacco use and improvement in HIV prevention.2
In the US, addressing health disparities remain an overarching goal.3,4 Life expectancy (LE) has increased mainly due to a reduction in the leading causes of death among the most educated.5 During the nineties, however, an increasing and widening mortality gap was observed between the least and the most educated NHB5,6 largely due to decreasing mortality rates among the most educated and an increasing mortality trend among the least educated.7
While social determinants of heath, such as socio-economic status, education, and ethnicity are considered strong predictors of morbidity and premature mortality worldwide, global prevention strategies for the prevention and control of NCD do not include them as major risk factors (5). The World Health Organization (WHO) Global Action Plan for the Prevention and Control of NCD8 targets seven major health risk factors for reducing premature mortality from non-communicable diseases by 25% by 2025. Although socioeconomic status and low education are mentioned in the strategy, they are not included among the seven risk factors of the 25 × 25 plan. There is also a lack of consideration between the interrelations of social circumstances and health, in the United Nations (UN) 2015 Agenda for Sustainable Development Goals (SDGs).9 The UN agenda aims to reduce premature mortality due to the leading causes of mortality by one third through prevention of risk factors and promotion of mental health and well-being. Given current evidence highlighting the important influence of social determinants, such as lack of education and low income, on NCD mortality, it is unclear how the US would be able to achieve this goal by 2030 as established by the UN resolution.
Amenable mortality is an indicator created in 1976 by Rutstein10 to define deaths that could be avoided by existing appropriate medical care. Rutstein developed a list of causes of deaths that were amenable to appropriate health care. The concept was used later by Nolte and Mckee11,12 to evaluate healthcare across countries. It has been proposed that amenable mortality trend and pace is a good indicator of health care performance.13
The objective of this study was to measure the impact of attained education and ethnicity on amenable mortality caused by five of the leading NCD causes of death, namely cancer, CVD, cerebrovascular disease, COPD and diabetes among NHW and NHB in the United States from 1990 to 2015.
METHODS
We analyzed data from 15,275,365 death certificates for NHW and NHB men and women, dying between 1990 and 2015. We downloaded death certificate data from the US National Center for Health Statistics. Our analysis was restricted to NHW and NHB because of problems with reporting other racial and ethnic subgroups, in particular Hispanics, which are heavily influenced by migration issues14 Asian Americans, because of small number of deaths, and Native Americans because of the recognized difficulties in race classification.15 The US Population estimates (1990 to 2015) by age, gender and ethnicity came from the US Census Bureau.16
We used a modified version of Nolte’s list of causes of death (Table 1) amenable to appropriate health care.11
Data on attained education and ethnicity were extracted from the death certificate databases.
Cause of death counts and age-adjusted mortality rates from 1990 to 2015 were calculated by year, sex, attained education (less than grade 12 or grade 12 and more) and race/ethnicity (NHW and NHB). We used the 34-cause of death list from data files 1990 to 1999, and the 39-cause of death list from 2000 to 2015.17 The mortality rates for 2015 was the latest year available at the time we downloaded the data.
We dichotomized the specific education variable in less than 12 and 12 or more years of schooling. We decided to do so, because Rogers et al,3 reported the highest mortality among those with less than 12 years of schooling, suggesting that not completing a high school education was a critical threshold for the risk of amenable mortality in the US.
Age-and-sex standardized rates were calculated using the US 2000 population as a standard.
All analyses were restricted to individuals aged 25 to 74 years dying from cancer, cardiovascular disease, COPD, and cerebrovascular diseases, however, an age range of 25 to 59 years was used for those dying from diabetes. Nolte and colleagues limited the age of diabetes deaths to 49 years of age in their analyses due to the controversy regarding the preventability of diabetes deaths at older ages18 but because of the reported reduction of mortality among people with diabetes in recent years in the US, we extended the age of diabetes deaths studied to 59 years.19
We examined 5-year intervals and calendar period intervals using the age-period- cohort models (APCM) approach, similar to recent published studies.2 Technical information on modeling can be found elsewhere.20 In addition to the annual percentage changes (ACP), frequently used to produce mortality estimates by jointpoint regression, the APCM provides age-adjusted effects for period (year of death) and cohort (year of birth) capturing the differential risk over time and facilitating the interpretation of ACP. Period and cohort effects are expressed as relative rates (risks) for a specific year, usually the midpoint among all observed periods/birth ages. We selected 2002 as a reference year for period effect and 1955 for cohort effect for cancer, CVD, cerebrovascular disease and COPD. For Diabetes we selected 1960 as a reference year for cohort effect since the cut-off age was 59 years.
Beginning in 1990, we used 5-year ranges for effect estimates, except for the last period that accounted for 6 years (to include 2015 data). Since period effects are estimated on the average number of deaths per year within each range, the impact of this additional year would not result in bias to comparability with the previous periods. Data were analyzed using intervals of calendar periods (1990 – 2015), which included 80 cohorts of birth, partially overlapped between 1910 and 1990.
APCM were adjusted for each combination of sex, educational level and race categories (6 models), to separate the general trend in the effects of age. APCM analyses were carried out with APC Web Tool developed by the National Institute of Cancer (https://analysistools.nci.nih.gov/apc/). Tables and graphs were generated using R from APC Web Tool outputs. Only cohort relative risks are presented without 95% confidence intervals (95%-CI) for the sake of proper visualization, since values on upper limits are too big relative to the point estimates given smaller sample sizes to account for the age intervals used to provide 14 birth periods.
RESULTS
Our study included the analysis of more than 16 million deaths (Table 2) due to NCDs (Cancer, CVD, Cerebrovascular Disease, COPD and Diabetes) among NHW and NHB, during the period of 1990 and 2015. The number of deaths increased with age during the whole study period.
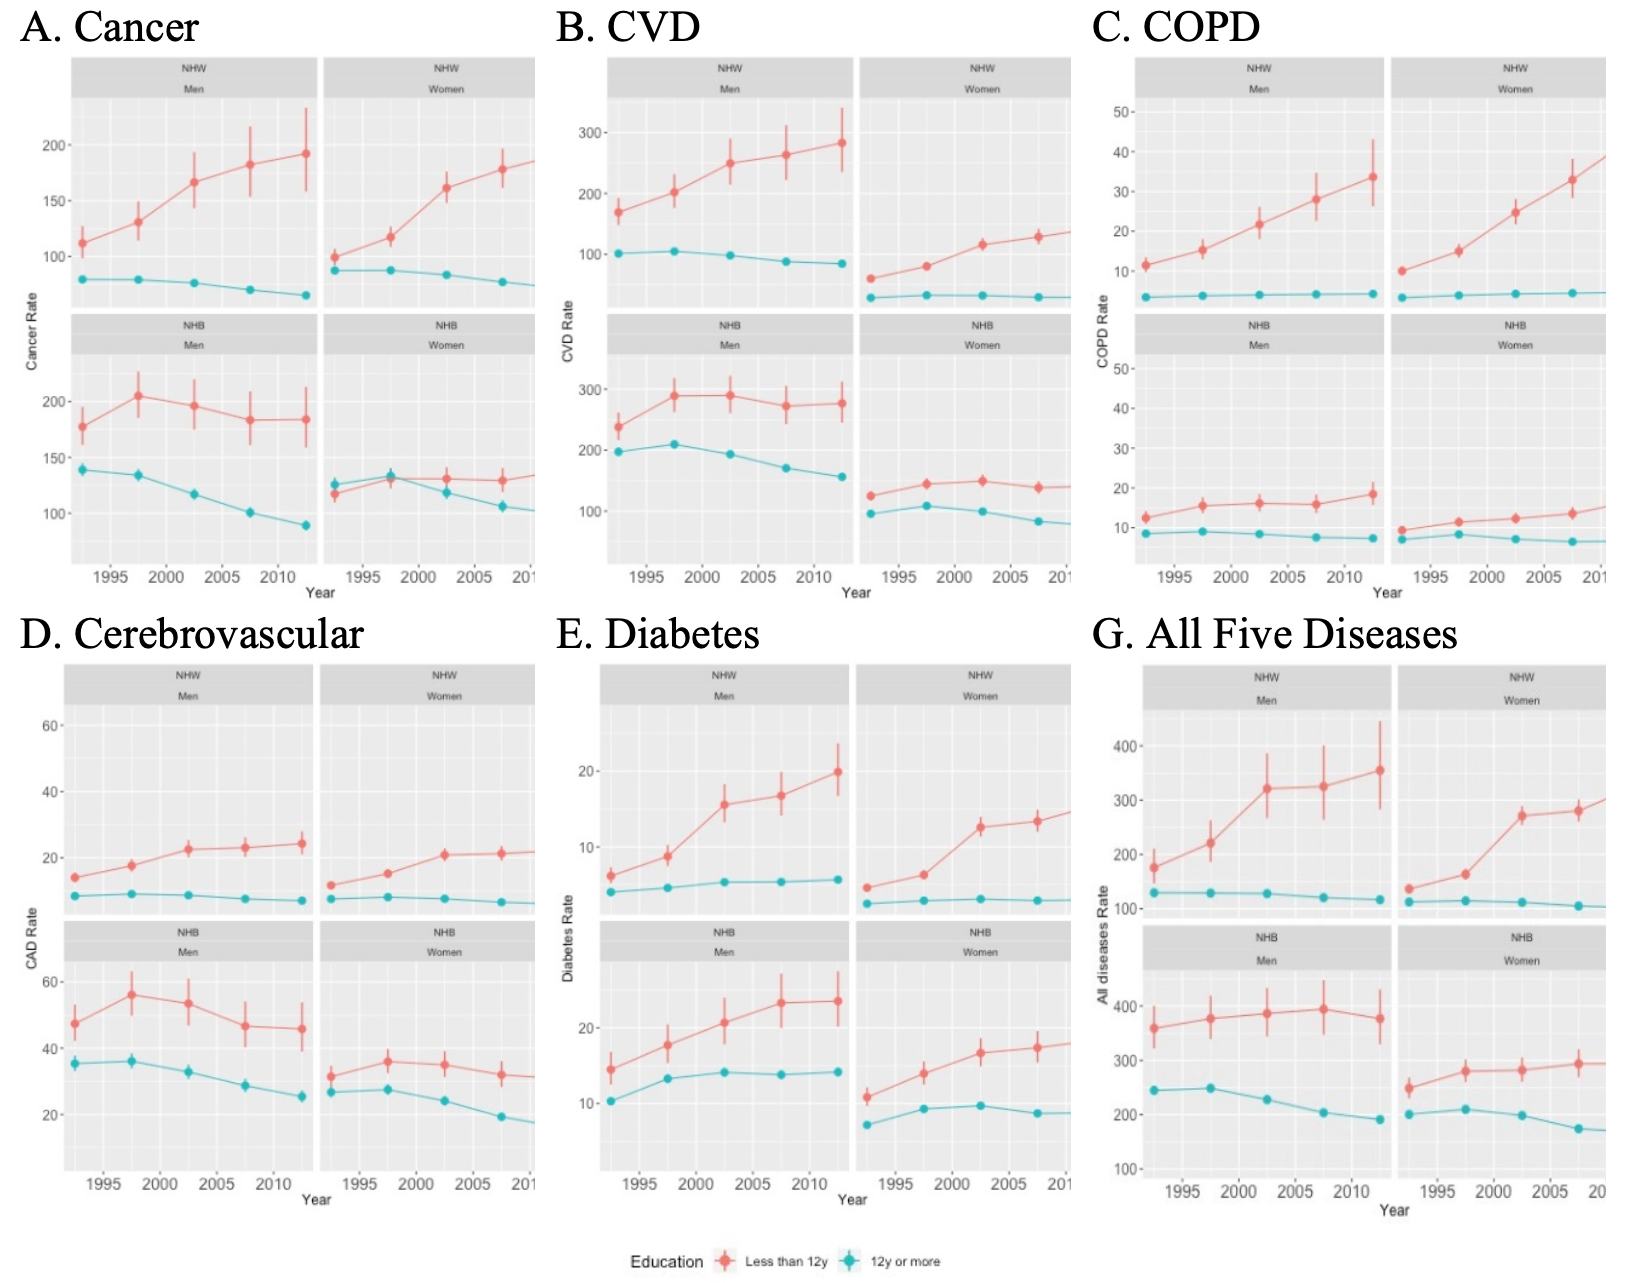
Between 1990 and 2015, age-adjusted amenable mortality rates increased among the uneducated for all-five diseases, while it decreased among the most educated in both sexes and races. Between the periods 1990-1995 and 2010-2015 (Online Supplementary Document, Table S8), among NHW males, the combined adjusted NCD amenable mortality rate doubled, from 175.6 (146.4-210.3) to 354.9 (282.8-445.4) among those with less than 12 grade education, while it decreased from 129.5 (125.2-134.0) to 116.5 (112.0-121.2) among those 12 and more grade education; among NHW females it increased from 359.0 (321.9-400.3) to 376.8 (329.5-430.8) among those with less than 12 grade education and decreased from 244.7 (236.8-252.8) to 191.1 (184.7-197.7) among those with 12 grade or more education. During the same period, among NHB males the combined adjusted NCD amenable mortality rate remained almost unchanged from 91.5 (86.2-97.2) to 88.6 (83.9- 93.5) among those with less than 12 grade education, while it markedly decreased from 96.3 (90.3-102.5) to 76.8 (72.8-81.1)among those 12 and more grade education respectively; among NHW females it increased by 2.4 times, from 136.4 (128.0-145.4) to 324.8 (300.5-351.0) among those with less than 12 grade education, and decreased from 112.5 (111.0-113.9) to 101.5 (100.0-103.1) among those with 12 grade or more education.
During the whole period 1990-2015, age-standardized amenable mortality rates were higher among the least educated NHB and NHW males for all-five diseases, compared to NHB and NHW females respectively (Figure 1, Panels A-G). Among the least educated NHB males, age-adjusted amenable mortality rates were the highest for all diseases except for COPD. NHW women exhibited the highest COPD mortality as compared to men from both races and NHB women.
The gap in NCD amenable mortality among men and women due to cancer (men=2.2 times/ women=1.9 times), cardiovascular disease (2.5/3.5), cerebrovascular disease (2.5 /2.6), COPD (6.0 /5.9), and diabetes (2.6 /3.6) between the least and the most educated was wider among NHW than NHB. The gap between the most and the least educated among male and female NHB was also considerable: cancer (1.7/1.1), cardiovascular (1.5/1.5), cerebrovascular disease (1.5/1.6), COPD (1.9/1.8), and diabetes (1.5/1.8). During the period 1990-2015, the gap in amenable mortality due to all the five studied diseases, between the most and the least educated, increased for both races. The greatest average gap between the most and the least educated was observed for COPD among NHW women (5.9) followed by NHW men (5.4), whereas the smallest average gap was seen for cancer mortality among NHB women.

The increased gap between the most and the least educated among NHW and NHB was driven by a sustained decrease of mortality among the most educated, while amenable mortality for the least educated NHW and NHB increased or did not vary across time and most causes of death.
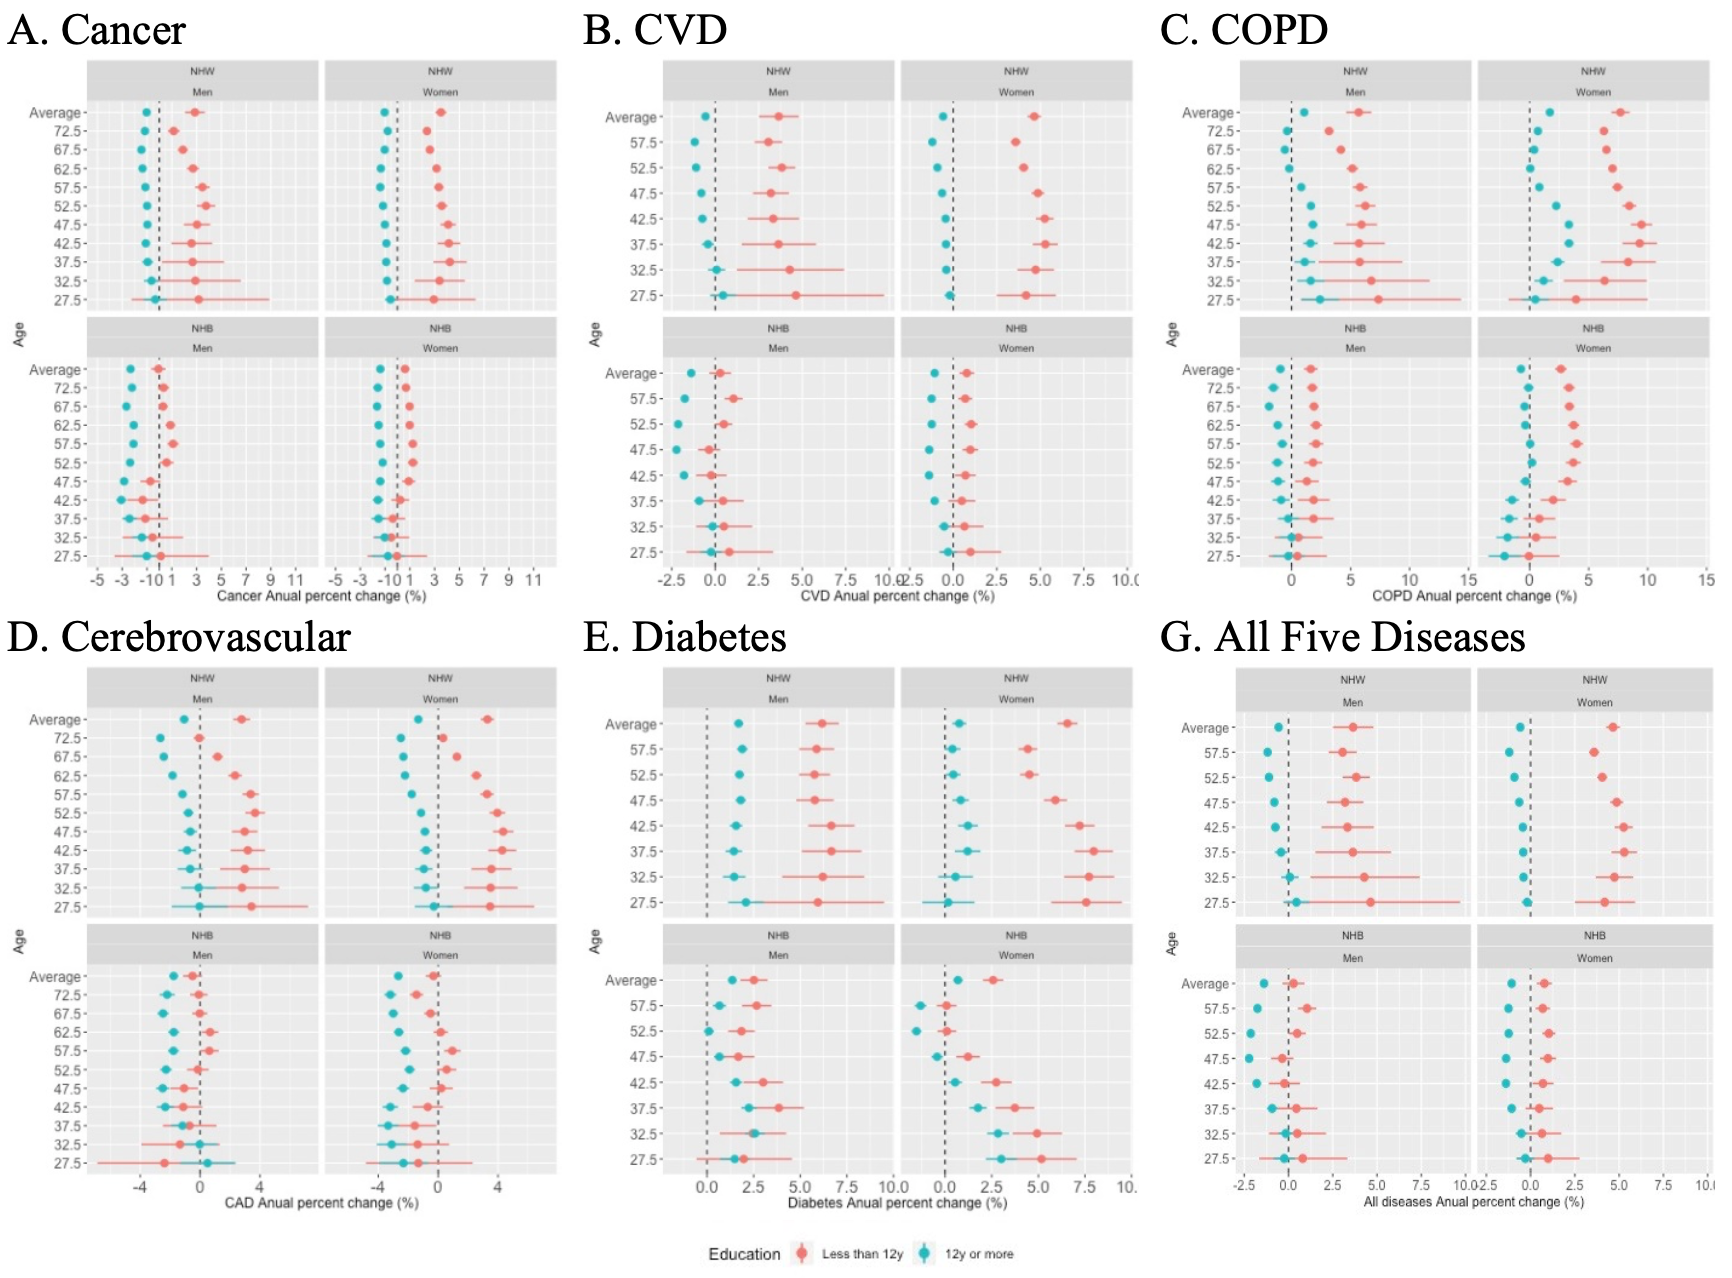
The NCD amenable mortality annual percent change between 1990 and 2015 (Figure 2, Panels A-G) declined among the most educated, while it increased among the least educated NHW and NHB population. This difference was evident for most age groups and diseases. The largest increase in amenable mortality was observed for the least educated NHW men and women dying of COPD. NHW women showed the largest increase in mortality due to diabetes and cardiovascular disease.

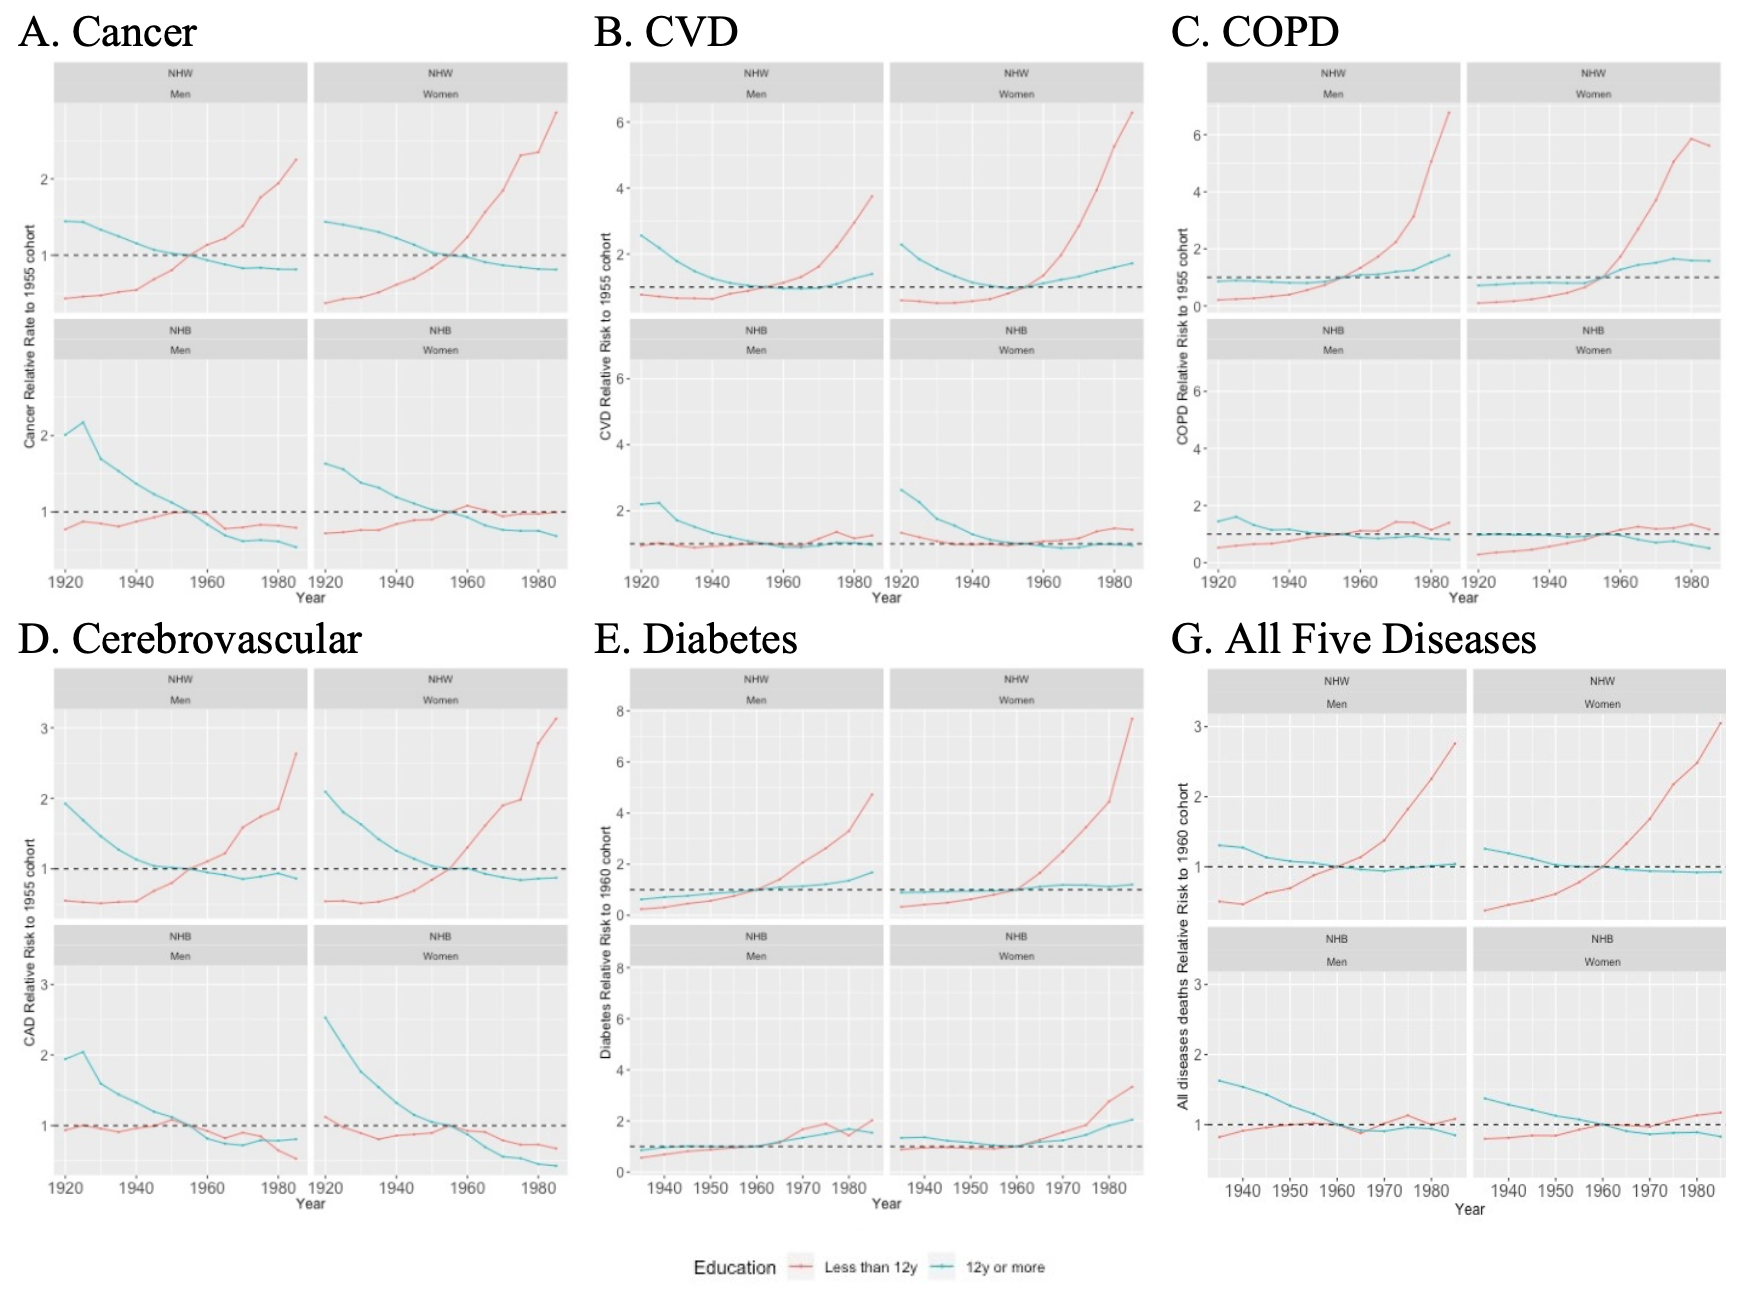
Using 1955 as a reference year to analyze cohort effect, amenable mortality for all studied five diseases show a similar pattern, with the most educated individuals demonstrating a decreasing or stable amenable mortality relative risk, compared to the least educated individuals who exhibited a relative risk linear growth (Figure 3, Panels A-G). For instance, among cancer deaths, the least educated NHW born in the 80’s presented amenable mortality rates almost 3 times higher than those NHW men and women born in 1955; however, among the most educated NHW individuals, there was no significant differences in amenable mortality across birth cohorts during the same period. There was no observed significant variation comparing those born before or after 1955 among NHB; this was the case for the five studied diseases as well as the combined adjusted-amenable mortality rate.

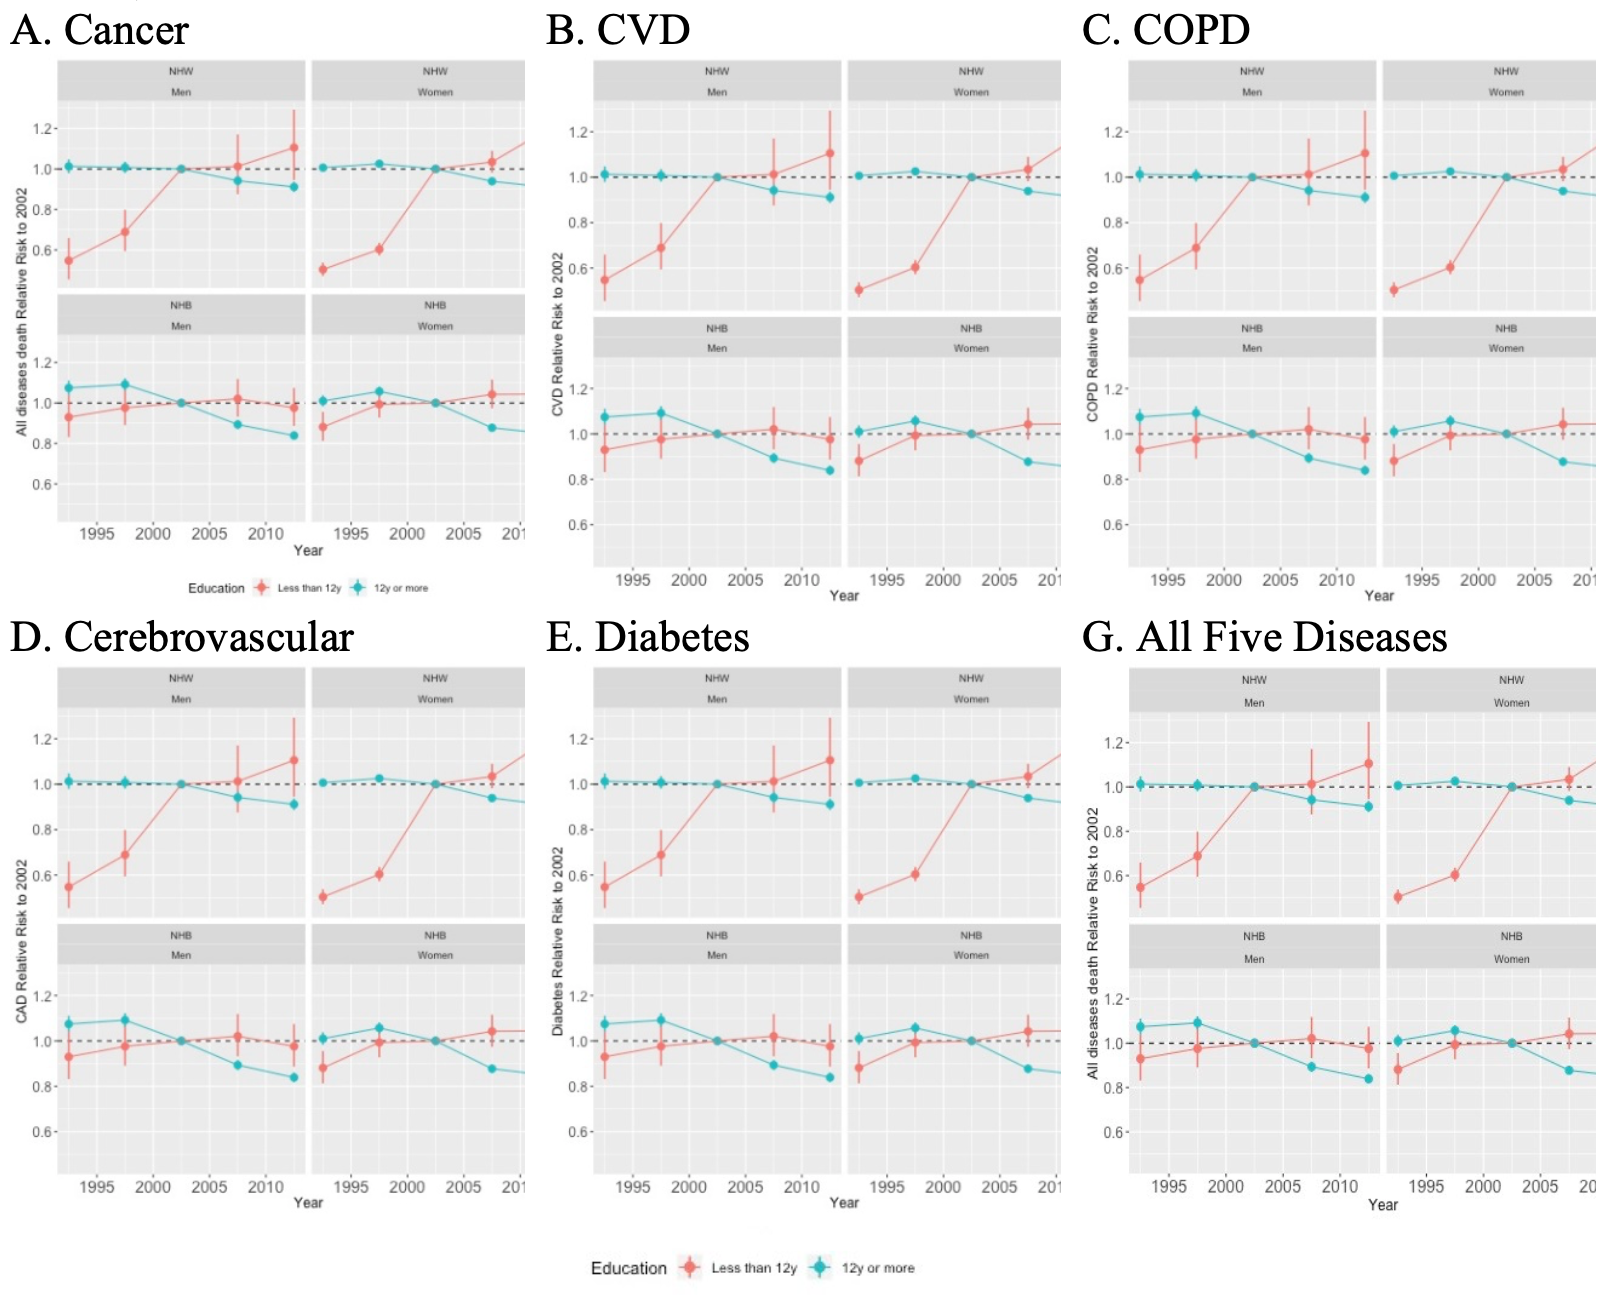
Amenable mortality risk steadily decreased for the most educated NHW (men and women) dying after 2002 (Figure 4, Panels A-G), while it increased for the least educated among NHW and NHB of both genders.

Specific disease number of deaths as well as detailed amenable mortality rates by year of death, gender, race and cause appear in Online Supplementary Document, Table S2-S8, in the same way percent changes in age-adjusted amenable mortality (1990-2015) appears in the Online Supplementary Document, Figure S1, Panels A-G.
DISCUSSION
The present study includes information from 16.3 million death certificates pertaining to NHW and NHB individuals of both genders, ages 25 to 74 years, selected from a total of more than16 million deaths due to the 5 leading NCDs, in the United States between 1990 and 2015. This study results showed a steady increasing gap in amenable mortality from five major NCD between people with less than grade 12 education and those achieving a high school diploma (more than 12 years of education) between 1990 and 2015. This gap is caused by a consistent decrease in amenable mortality rates among the most educated and a sustained increase in amenable deaths among the least educated of both genders and races. Overall, amenable mortality due to NCDs was higher among members of younger cohorts than among the older. A year of death effect was also observed with the most recent years showing higher rates, as compared to those deaths occurring before 1995. Disparity among the least and the most educated amenable mortality accounted for 1.9 million excess deaths during the period 1990-2015.
Rogers et al reported a mortality gradient demonstrating that those with less than grade 12 education had the greatest death rates.3 Although having additional degrees of education after high school graduation has been linked to extended longevity,3,21 those not achieving a high-school diploma have shown the greatest disadvantage in LE. Furthermore, Montez et al demonstrated that attaining a high school diploma was an important step in decreasing de yearly odds of mortality among adults in the US.22 Thus, comparing NCD mortality by stratifying the population in these two large groups (least and the most educated) demonstrated the largest, and still meaningful, effect size when analyzing trends among NHW and NHB.
The scope of this analysis was limited by the exclusion of other important races or ethnic groups such as Hispanics, Native Americans and Asian Americans, making this picture of the amenable mortality incomplete. The decision to exclude these groups was based on the heterogenicity of migration patterns of the Hispanic population,14 the small number of deaths among Asian Americans and the reported risk of race misclassification among Native Americans.15 In addition, we used an upper limit of 74 years of age for both men and women, previously established by other researchers.12,23 That limit, however, does not account for the difference in LE among men and women.18,23 Using different upper limit for men and women has not been well-defined by previous research. For diabetes deaths, we selected those dying before the age of 59 years to reflect the uncertainty of preventing deaths at older ages for those with diabetes, an issue previously addressed in this paper. Another limitation of our study was the variability in the number of death certificates with missing information about level of education. In some cases, the level of education variable was missing due to variability in the incorporation of this item into some US state death certificate databases at the beginning of our study period. The proportion of death certificates with unknow level of education was 20% in 1990, dropping dramatically to 9% in 1994. The proportion of death certificates with unknow level of education progressively decreased to a low of 1.7 % in 2015. Overall, only 6.7% of deaths were excluded due to lack of level of education information. As demonstrated in the results, however, this missing information did not have a significant impact on the results presented here. The methodology used for our analysis was specifically selected to minimize the effects of individual year variability of some of the indicators we used for trend analysis, such as the degree of education. Sasson et al24,25 demonstrated similarities when comparing the gap between the most and the least educated NHB and NHW, combining vital statistics to census data (as we did) to the use of nationally representative survey data linked to mortality vital statistics data. As they concluded that both sources were equally valid, this validation supports our data source selection.
Another limitation of this study is that we did not differentiate mortality due to types of cancer as it was done by others.23 Some types of cancers are known to be more likely to be amenable than others; however, the study of the effect of education in different types of cancer is beyond the scope of this analysis.
LE has reportedly declined for uneducated NHW26 in recent years in the US. This effect has been seen more markedly among women than among men. Differences in the risk of dying between the least and the most educated NHW population was first reported during the period 1971-1984. The increased mortality among the least educated, as compared to the most educated, was seen mainly among men and was attributed to a similar increase of the risk of cardiovascular disease death among uneducated men.27–29 More recently, however, the decline in LE observed among the least educated NHW has been attributed to diverse causes such as the ongoing opioid epidemic26 or directly linked to disease and risk factor disparities such as tobacco use, hypertension, diabetes, obesity30 and external causes.31
In a related paper, Geronimus et al25 reported on the role of deaths caused by suicide related to alcoholic liver disease, the so called Death of Despair (DOD), on the decrease in LE among NHB and NHW in the US. The paper by Geronimus and colleagues25 included some causes of death similar to our analysis. In contrast, however, we focused on the proportion of deaths from all major NCD likely to be prevented by improving access to quality health care, as well as the disparity mortality gap among the most and the least educated. The popularization of the DOD epidemic should not divert us from studying the increasing role of internal mortality causes in the growing disparities among specific segments of the US population, as discussed in this paper.25
Although our analysis did not focus on the widely demonstrated differences in NCD frequencies by race, socio-economic status and other characteristics, we cannot ignore previous research on these issues. The strong influence of socioeconomic factors on health, morbidity and mortality has been well established in other studies showing a widening inequality in mortality.32,33 The relationship between education and mortality is highly complex and multi-factorial. In recent years, this relationship has been the subject of considerable attention given the dramatic increase of well-educated adult individuals in the United States. In fact, the proportion of high school graduates in the US increased by 10 percentage points, from 77% in 1990 to 88% in 2015, with a notably less educated proportion among NHB during the early nineties. By 2015, the proportion of high school graduates was almost equal among NHW (89%) and NHB (87%).16 The association between attained education and mortality looks to be driven by exposure to disease specific risk factors34–37 that may be conditioned by early life conditions such as parental education and income, individual endowments (e.g., genetics and intelligence), as well as childhood physical, mental health and social context.38 Hummer and Hernandez estimated that health behavior may account for up to 30% of the difference in mortality between the least and the most educated.37
Socio-economic inequality in all-cause mortality in the US is driven by increasing mortality among the least educated coupled with a sustained decrease in mortality among the most educated.7 As suggested by Hayward, it appears that very high education is strongly associated with living a (very) long life while not having a basic high school degree appears to increasingly be a ticket toward a short and unhealthy life.38 At the international level, Cutler et al36 suggested that education is protective for factors that are known to be bad for health. Research demonstrated that individuals with education lower than a high school diploma are disproportionally affected by chronic conditions.39–41 It is also a well demonstrated fact that individuals with higher education levels, benefit the most through advanced knowledge of disease prevention activities. For example, during the 60s, following the discovery that tobacco was a health risk, there was an observed decline in smoking among the most educated; however, this effect was absent among the least educated individuals.42
Education, coupled with income and occupation, are the main components of socio-economic status (SES) affecting health and access to care.38,42–44 But some research, however, demonstrated that health disparities between NHB and NHW goes beyond SES,45 with Black individuals exhibiting poorer health than White individuals from the same SES. This suggests that education did not translate in similar health gains for Black and Whites,43,44 which has been called the hypothesis of “diminishing return”.45,46 The relation of race and education looks to be complex, multifactorial, and conditioned to multiple cultural, biological, social, and economic factors.47 Similar inequalities in the control of chronic diseases have been demonstrated at the international level,48 as it is underscored between segments of the US population in our study.
Our data suggest that even a notable effort has been made in the US to improve access to healthcare for those with low SES,34 they have been insufficient in achieving equal access to care for all Americans with NCD. Due to the implementation of the Affordable Care Act (ACA), the proportion of uninsured among those that were poor (or near poor) steadily decreased between 2010 and 2015, reaching a plateau, or slightly increasing, between 2015 and 2018. In 2018, those considered to be poor (or near poor) were more than three times less likely to have health insurance49 than their not poor counterpart, suggesting that health disparities are likely to continue in the near future as a consequence of the widening gap coverage between those with high and low SES. While it is still too soon to study the impact of the ACA on amenable mortality, research on this issue should be developed, if the ACA (or similar broader healthcare coverage) continues to be implemented in the future.
A project derived from the Global Burden of Disease (GBD) combined different indicators and national statistics, including amenable mortality, from 195 countries to produce the Healthcare Access Quality (HAQ) index. The 2015 HAQ index for both the US and the United Kingdom (UK) were classified at the nine decile respectively.50 Notably a 2014 study from the Commonwealth Fund, measuring healthcare performance in 11 developed countries, ranked the UK and the US first and last respectively. National Health Expenditures (NHE) in 2011 for the UK was reportedly, less than a half ($3,405) of what the US spent on the same ($8,508)51 (figures are in US$ Purchasing Power Parity). In the Commonwealth Fund study, the main difference between the US and other developed countries was the absence of universal healthcare coverage.51
Although increasing the proportion of the well educated in the US population should be maintained as a long-term goal, prevention and control NCD policies and programs targeting individuals with low education seems to be crucial in reducing the mortality gap between segments of the population. Both the UN agenda9 and WHO plan8 identified inequalities as determinants of health, however, they should provide guidance on how to reduce the gap between those with high and low SES. This would bolster the use of preventive and control programs among those in need.
Conclusions
We observed an increasing trend in amenable mortality due to cancer, CVD, cerebrovascular disease, COPD and diabetes among the least educated NHB and NHW in the US. Age-adjusted amenable mortality rates related to most of the investigated causes, were the highest among the least educated NHB men and women. However, NHW men and women showed the greatest gap between the most and the least educated. Findings also demonstrated that a disparate cohort and year of death effect between the most and the least educated groups widened the gap in cause specific amenable mortality risk and ratio among NHW. Our analysis showed a strong effect of attained education as a key factor for higher amenable NCD mortality. Increasing the level of education of the population as the only answer to the growing mortality gap between the least and the most educated, would be a simplistic response to the issues reported here. Historically, similar strategies have consistently failed in reverting the divergent mortality trend between the least and the most educated, as shown in these series. Using amenable mortality as an indicator of deaths likely to be prevented by adequate healthcare, this research underscored the urgent need for solutions to address the lack of access to care for a sizeable segment of the US population. Poor access to health care, punctuated by inequities and inefficiencies,51 among others failures, may be responsible for the divergent trend in NCD mortality rates, particularly among disadvantaged groups. The current challenge in the US is developing an equitable system of health care delivery, that effectively reduces mortality among all segments of the population, rather than just as a privilege of the most educated. This reality calls for interventions targeting disadvantaged groups, to remove barriers to quality healthcare, and a healthy longer life. Assertive policy efforts should be made in the US to implement universal healthcare that includes quality curative medicine and innovative preventive services for all, thereby reducing the growing disparities in segments of the population and leading to a more efficient use of available resources.
Acknowledgments: The authors thank Brazilian visiting students Paola Romani and Fernanda Mori, from the University Miguel Hernandez, who conducted the preliminary literature review for this research. We gratefully acknowledge Ms. Susan McKinley, RN, BN, M.Ed, MBA and Dr. Linda Duffett-Leger RN PhD Associate Professor, Faculty of Nursing, University of Calgary, for editing our manuscript.
Funding: The Federal University of Juiz de Fora (UFJF) provided financial support on publication fees and the use of its research facilities. Dr. Barcelo received a scholarship as a visiting professor at the Department of Public Health, Universidad Miguel Hernandez of Elche, supported by the UMH Research and Development Grant 2017. Paola Romani and Fernanda Mori, received support from the exchange program, of the International Federation of Medical Students’ Associations (IFMSA).
Authorship contributions: AB: Conceptualization, literature search data curation, data analysis, data interpretation and analysis, original drafting, review, editing and discussion. MPV: Literature search, data analysis, interpretation, analysis and discussion. FABC: Data modeling, statistical analysis, interpretation and discussion. Data visualization, manuscript writing, review and editing.
Competing interests. We declare no competing interests.
Correspondence to:
Dr. Alberto Barcelo
Department of Medical Clinic, School of Medicine
Universidade Federal de Juiz de Fora
Minas Gerais Brasil
[email protected] , [email protected]