Article

Streptomyces sp. MUM256: A Source for Apoptosis Inducing and Cell Cycle-Arresting Bioactive Compounds against Colon Cancer Cells

Novel Bacteria and Drug Discovery (NBDD) Research Group, Microbiome and Bioresource Research Strength, Jeffrey Cheah School of Medicine and Health Sciences, Monash University Malaysia, Bandar Sunway 47500, Selangor Darul Ehsan, Malaysia
*
Authors to whom correspondence should be addressed.
Cancers 2019, 11(11), 1742; https://doi.org/10.3390/cancers11111742
Submission received: 23 October 2019 / Revised: 25 October 2019 / Accepted: 25 October 2019 / Published: 6 November 2019
(This article belongs to the Special Issue Role of Natural Bioactive Compounds in the Rise and Fall of Cancers)

Abstract

:
New and effective anticancer compounds are much needed as the incidence of cancer continues to rise. Microorganisms from a variety of environments are promising sources of new drugs; Streptomyces sp. MUM256, which was isolated from mangrove soil in Malaysia as part of our ongoing efforts to study mangrove resources, was shown to produce bioactive metabolites with chemopreventive potential. This present study is a continuation of our previous efforts and aimed to investigate the underlying mechanisms of the ethyl acetate fraction of MUM256 crude extract (MUM256 EA) in inhibiting the proliferation of HCT116 cells. Our data showed that MUM256 EA reduced proliferation of HCT116 cells via induction of cell-cycle arrest. Molecular studies revealed that MUM256 EA regulated the expression level of several important cell-cycle regulatory proteins. The results also demonstrated that MUM256 EA induced apoptosis in HCT116 cells mediated through the intrinsic pathway. Gas chromatography-mass spectrometry (GC-MS) analysis detected several chemical compounds present in MUM256 EA, including cyclic dipeptides which previous literature has reported to demonstrate various pharmacological properties. The cyclic dipeptides were further shown to inhibit HCT116 cells while exerting little to no toxicity on normal colon cells in this study. Taken together, the findings of this project highlight the important role of exploring the mangrove microorganisms as a bioresource which hold tremendous promise for the development of chemopreventive drugs against colorectal cancer.

1. Introduction

Colorectal cancer (CRC) constitutes the third most common cancer diagnosed and the fourth leading cause of cancer mortality globally [1]. According to Arnold et al. [2], CRC incidence and mortality is correlated well to human development levels. The study described that the rate of CRC cases is increasing rapidly in many low-income and middle-income countries while stable or decreasing trends are seen in highly developed countries [2]. Treatment of CRC usually involves surgical removal alone when detected early whereas late stage of advanced or metastasized CRC requires radiotherapy or chemotherapy [3]. However, chemotherapy suffers from significant limitations including insufficient selectivity for tumor cells, leading to many adverse side effects [4,5]. Although targeted therapies have been regarded as the most successful treatments of cancer for the past few decades, genetic mutations greatly affect the efficacy of various targeted drug therapies and leading to mutation-driven resistance of targeted therapy [6,7,8]. Thus, there is an urgent need to search for alternative chemotherapeutic/chemoprevention agents which may overcome the limitations of chemotherapy, and natural products are an excellent resource to explore [9].
Natural products have provided the inspiration for the development of alternative agents for the prevention or therapy of cancer, and using natural products to reduce cancer prevalence has received substantial attention [10,11,12,13,14]. The natural products of interest can be found in fruits, vegetables, herbs and medicinal plants [15,16,17,18,19]. Aside from plant-based natural products, microorganisms are also reported to be a useful source of bioactive compounds, including chemotherapeutic agents [20,21,22,23]. For instance, actinomycin was discovered as the first microbial metabolite isolated from the bacterium Streptomyces antibioticus in 1940 [24] to be used in cancer therapy. Since then, many more microbial metabolites with antitumor properties were discovered including anthracyclines, bleomycin, mitosanes, mithramycin, pentostatin and calicheamicins [25]. Currently, there is evidence demonstrating that the mangrove derived microbial metabolites could be the next bioresources for potential cancer therapeutic agents [26,27,28,29]. Thus, we explored the potential of Streptomyces isolated from Malaysian mangrove soil with a focus on its ability to produce metabolites exhibiting chemopreventive activity.
This work represents part of an ongoing project to discover anticancer compounds from mangrove resources, and our screening of the various isolated Streptomyces strains led to the discovery of Streptomyces sp. MUM256 which possesses the potential to produce active metabolites that induced cell-cycle arrest and apoptosis. In the earlier study [30], we demonstrated that the methanol extract of Streptomyces sp. MUM256 exhibited antioxidant and cytotoxic properties. The present study is a continuation of this work aiming to investigate the underlying mechanisms of the cytotoxic and antiproliferative effects of the ethyl acetate fraction of Streptomyces sp. MUM256 crude extract (MUM256 EA) against the HCT116 cell line. We demonstrated that the MUM256 EA induced cell-cycle arrest by downregulating several important cell-cycle regulatory proteins and induced apoptosis via interactions with the intrinsic pathway in colon cancer cells (Figure 1). Thus, we believe these results provide new insight into the development of mangrove-derived Streptomyces metabolites against CRC.

2. Results

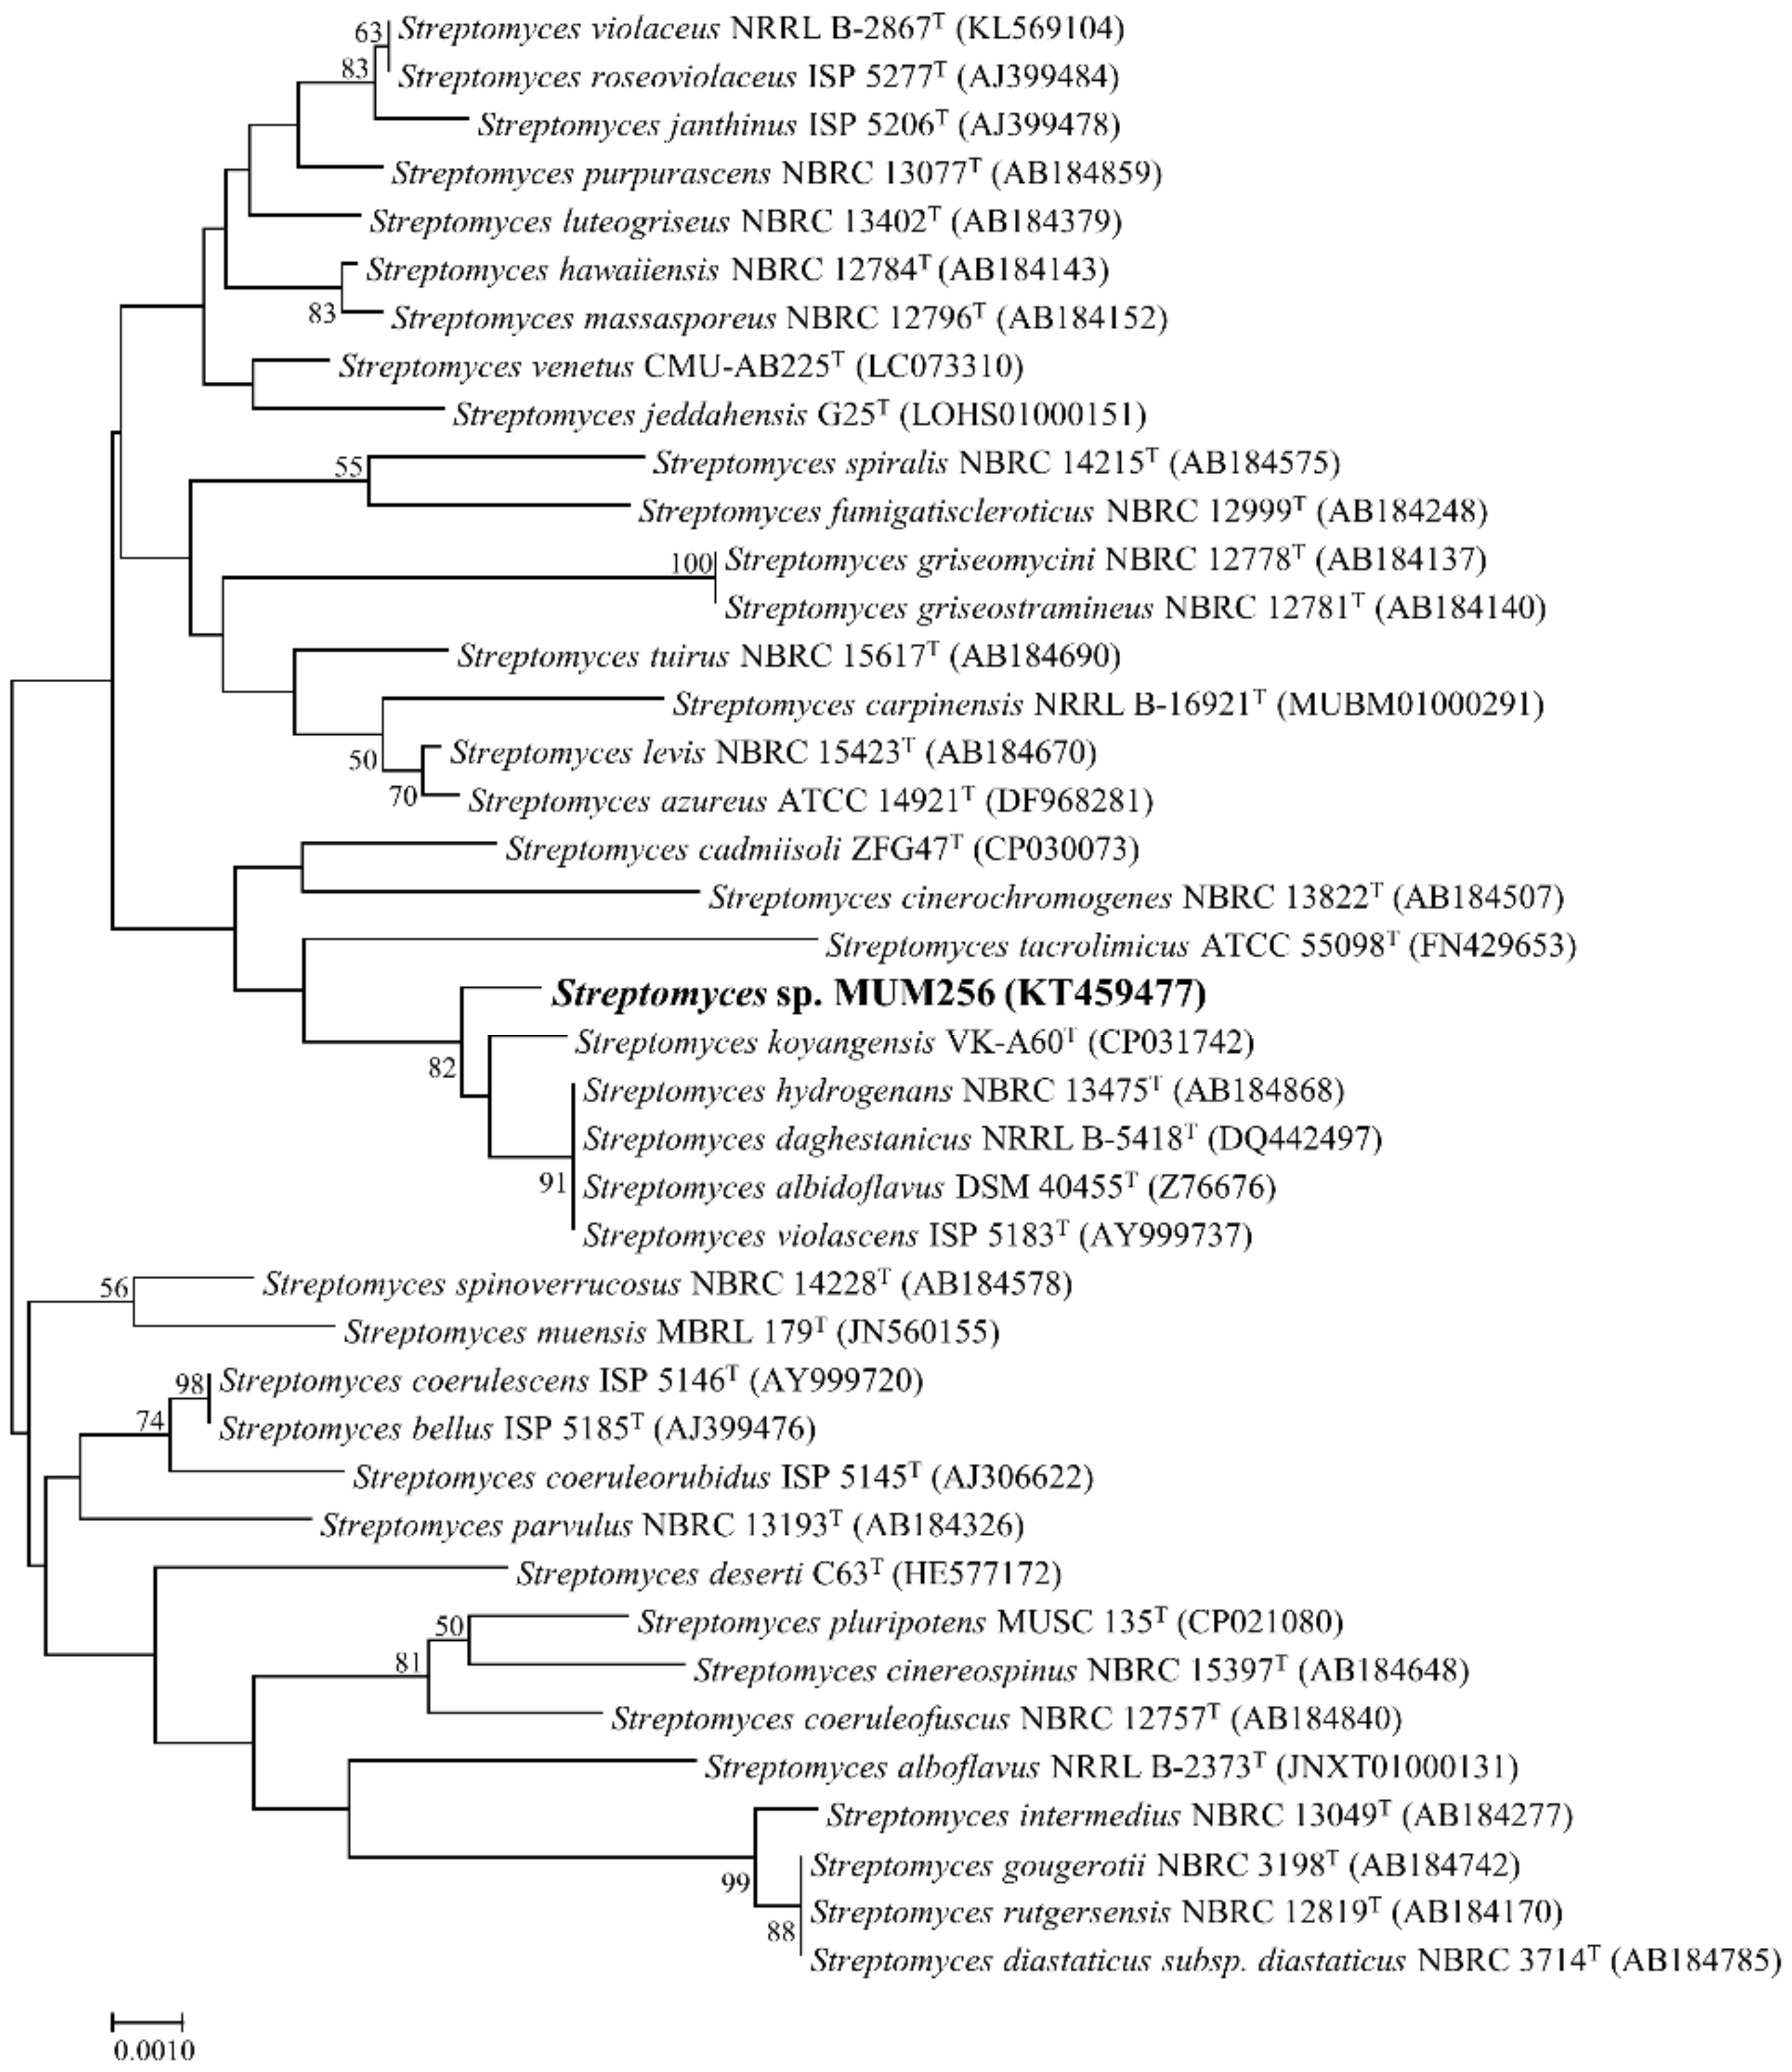
2.1. Phylogenetic Analysis of Streptomyces sp. MUM256

Given that the publicly available database for 16S rRNA gene sequence, such as Ezbiocloud, is regularly updated by adding new bacteria species with validly published names, a new phylogenetic tree was constructed for strain MUM256 based on its 16S rRNA gene sequence (GenBank accession number KT459477) (Figure 2). Based on the blast result of the Ezbiocloud database, the 16S rRNA gene sequence of strain MUM256 demonstrated highest similarity to S. hydrogenans NBRC13475T (99.70%), S. daghestanicus NRRL B-5418T (99.70%), S. albidoflavus DSM40455T (99.70%), S. violascens ISP5183T (99.70%) followed by S. koyangensis VK-A60T (99.48%). According to Figure 2, the 16S rRNA sequence of strain MUM256 formed a distinct clade with strains S. koyangensis VK-A60T, S. hydrogenans NBRC13475T, S. daghestanicus NRRL B-5418T, S. albidoflavus DSM40455T and S. violascens ISP5183T at bootstrap value of 82%, showing relatively high confidence level of the association (Figure 2).

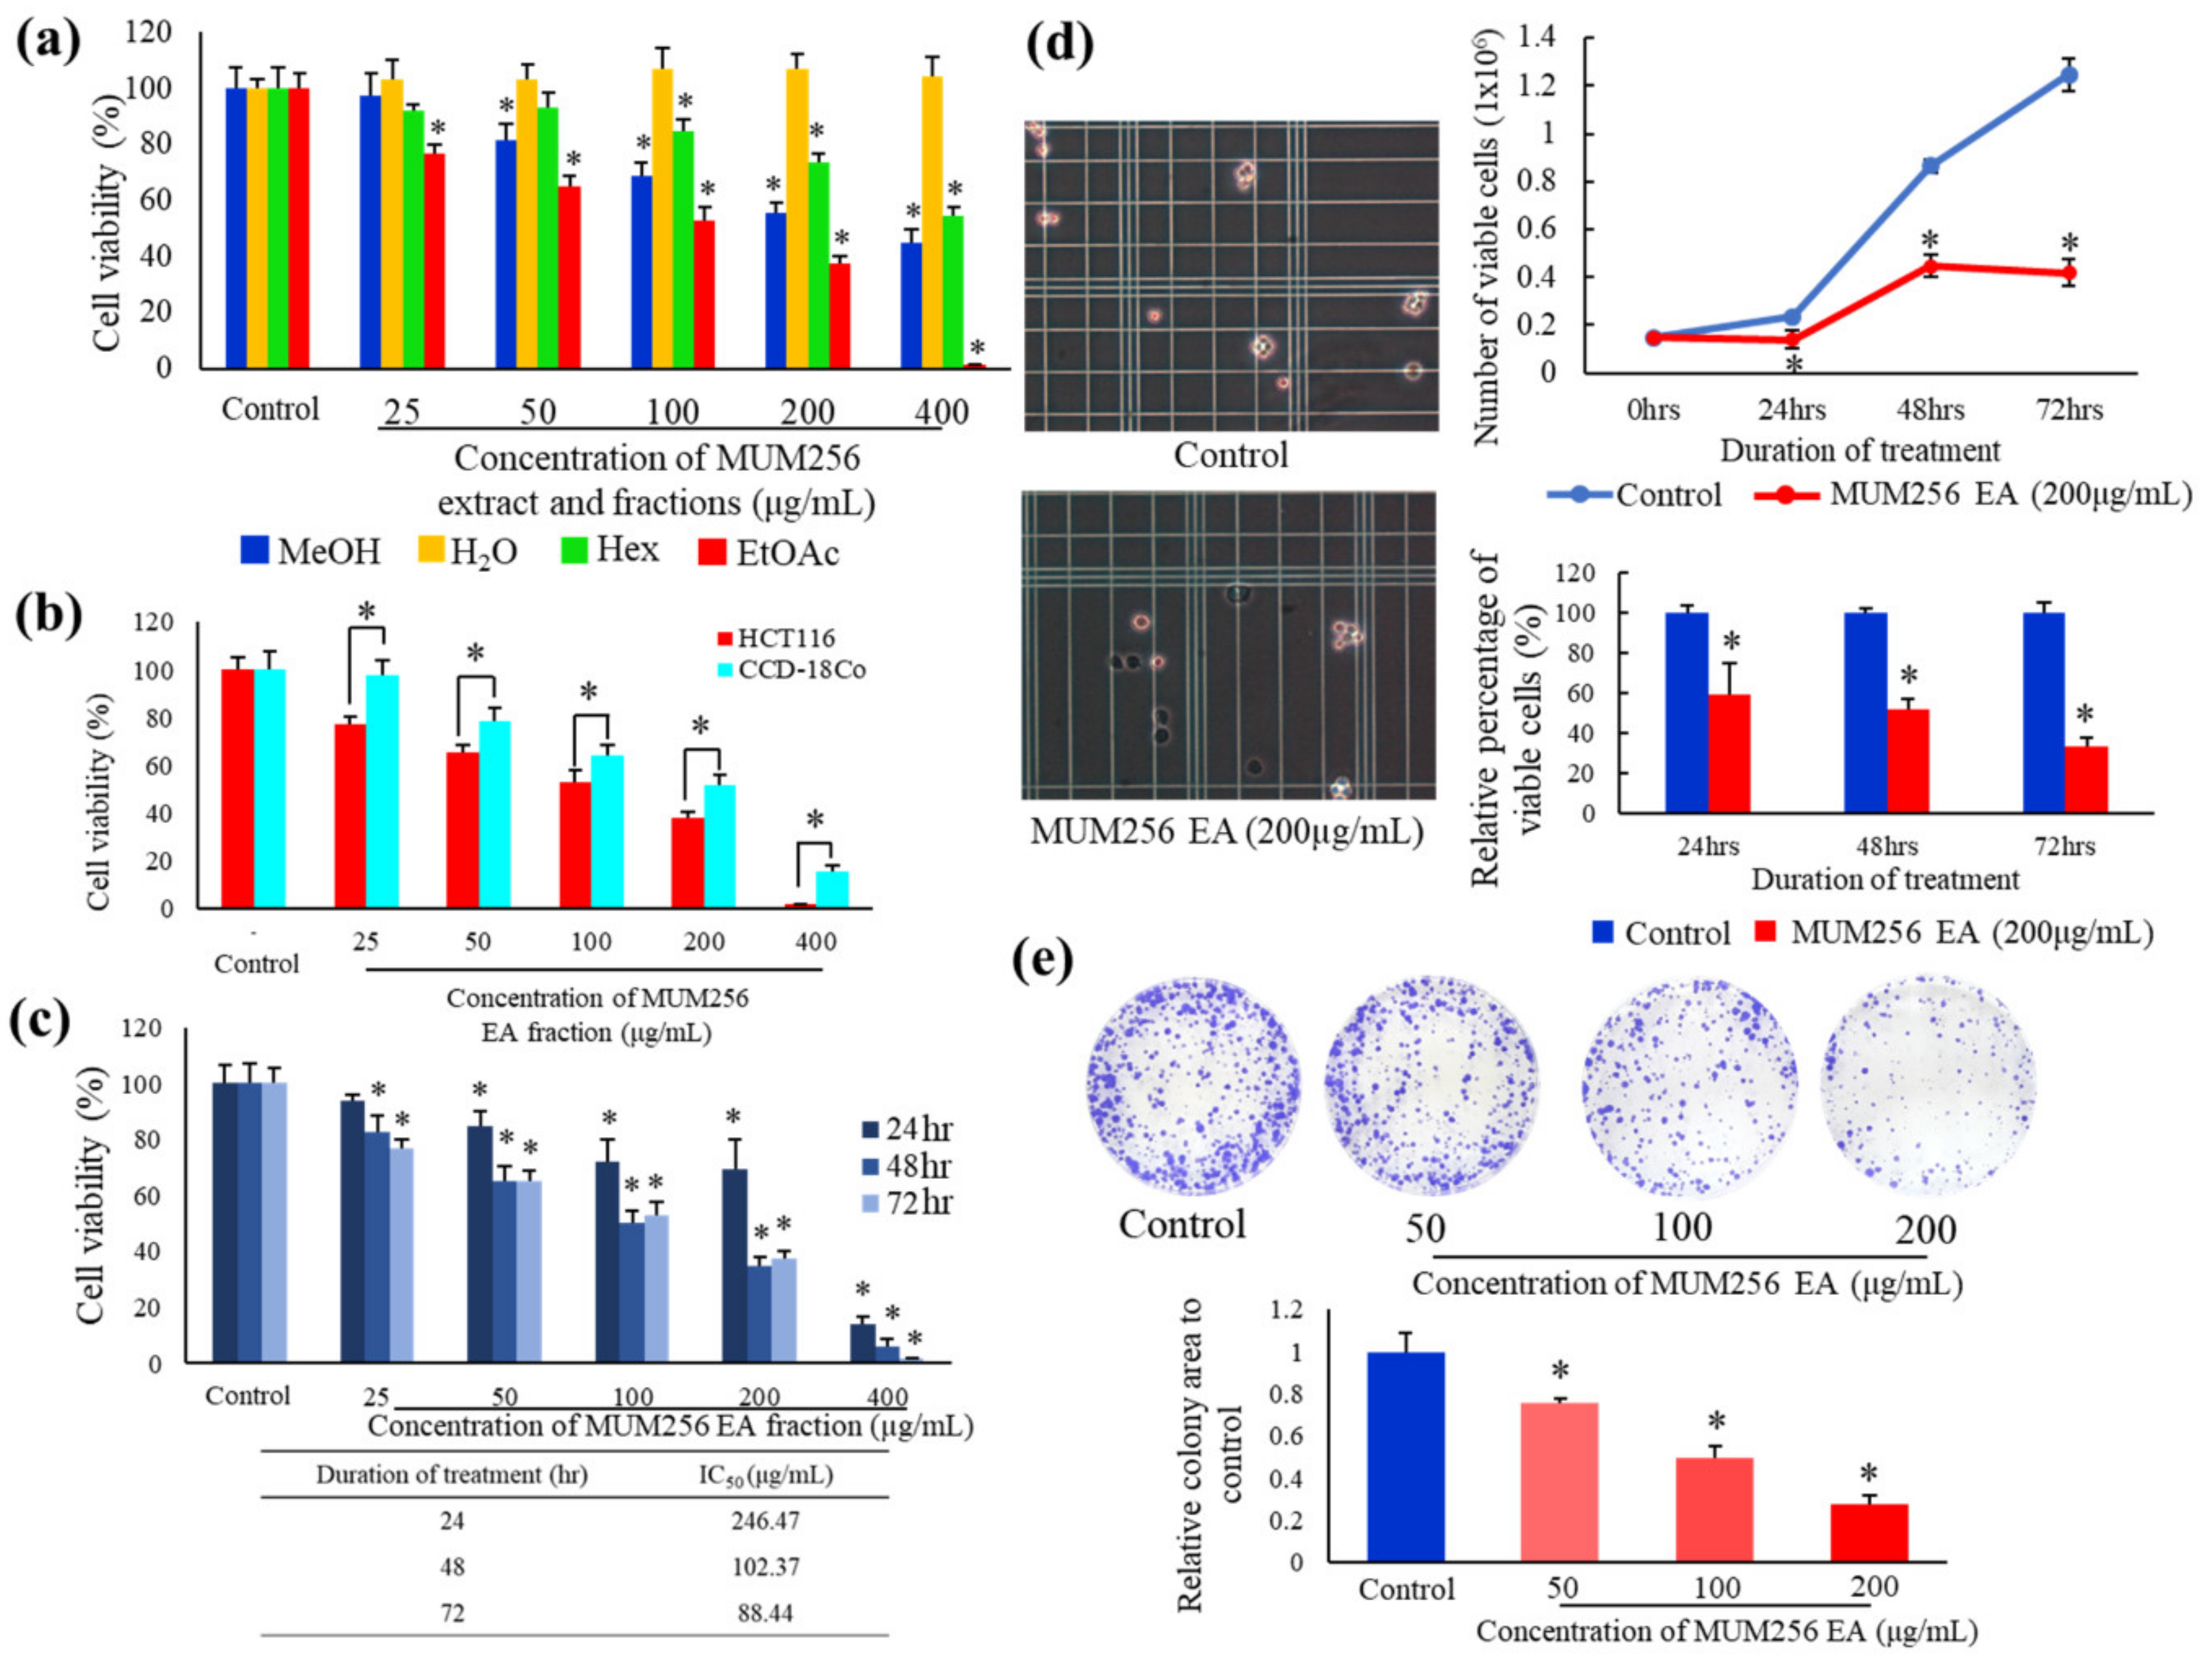
2.2. To Examine the Cytotoxic Effect of Streptomyces sp. MUM256 Fractions against Colon Cancer Cell HCT116

Three different fractions were obtained from the methanolic MUM256 extract after being subjected to sequential fractionation with three types of solvents, namely hexane, ethyl acetate and water. Figure 3a demonstrates the cell viability of HCT116 after exposure to MUM256 extract and the respective fractions for 72 h. The ethyl acetate fraction of MUM256 extract was shown to exhibit the highest cytotoxicity towards HCT116 among the fractions tested, followed by the hexane fraction and the aqueous fraction as the least toxic against HCT116 cells. The toxicity of MUM256 EA was also evaluated on a normal colon cell line CCD-18Co. The MUM256 EA exhibits significantly lesser toxicity towards a normal colon cell (CCD-18Co) at all the concentrations tested in this study (Figure 3b). The IC50 of MUM256 EA towards CCD-18Co was measured at 215 μg/mL which is 1.72 higher than its cytotoxicity towards colon cancer cell (HCT116) with IC50 of 88.44 μg/mL. This result demonstrates that the MUM256 EA displays a slight preferential cytotoxicity against HCT116 colon cancer cells over a CCD-18Co normal colon cell.

2.3. MUM256 EA Suppresses Cell Viability and Proliferation in HCT116 Cells

To further examine the cytotoxic effects of MUM256 EA using MTT assay, the HCT116 cells were treated with increasing concentrations of MUM256 EA for 24, 48 and 72 h. As shown in Figure 3c, when treated for 24, 48 or 72 h in the concentration range of 25 to 400 μg/mL, MUM256 EA reduced the cell viability of HCT116 cells; MUM256 EA demonstrated cytotoxic effect against HCT116 cells in a significant dose-dependent manner at both 48 and 72 h timepoints. At 400 μg/mL, the cell viability of HCT116 was reduced by MUM256 EA in a time-dependent manner. The concentrations of MUM256 EA required to produce a 50% reduction in cell viability (IC50) were determined by a regression analysis; the value of the half maximal inhibitory concentration (IC50) decreases according to the time of treatment (IC50-24 h: 246.47 μg/mL > IC50-48 h: 102.37 μg/mL > IC50-72 h: 88.44 μg/mL).
Trypan blue dye exclusion assay showed that the growth of HCT116 cells were reduced upon MUM256 EA treatment as demonstrated by the lower number of viable HCT116 cells in the wells treated with MUM256 EA when compared to the wells with untreated cells (Figure 3d). According to Figure 3d, a significantly lower number of viable cells were detected following exposure to 200 μg/mL MUM256 EA: 59.7%, 51.7% and 33.6% at 24, 48 and 72 h, respectively, when compared to control.
To further evaluate MUM256 EA’s inhibitory effects on cancer cell proliferation, we performed colony formation/clonogenic survival assay on HCT116 cells upon exposure to MUM256 EA treatment, as a test reflecting long-term effect/toxicity [31]. The assay clearly demonstrated that clone formation of HCT116 cells was reduced in a dose-dependent manner (Figure 3e). Treatment with MUM256 EA resulted in a reduction in both numbers of colonies formed as well as the size of the colonies-colony numbers for treated samples were significantly reduced and appeared smaller than those of the control. Therefore, these results confirm that MUM256 EA is cytotoxic and anti-proliferative towards HCT116 cells.

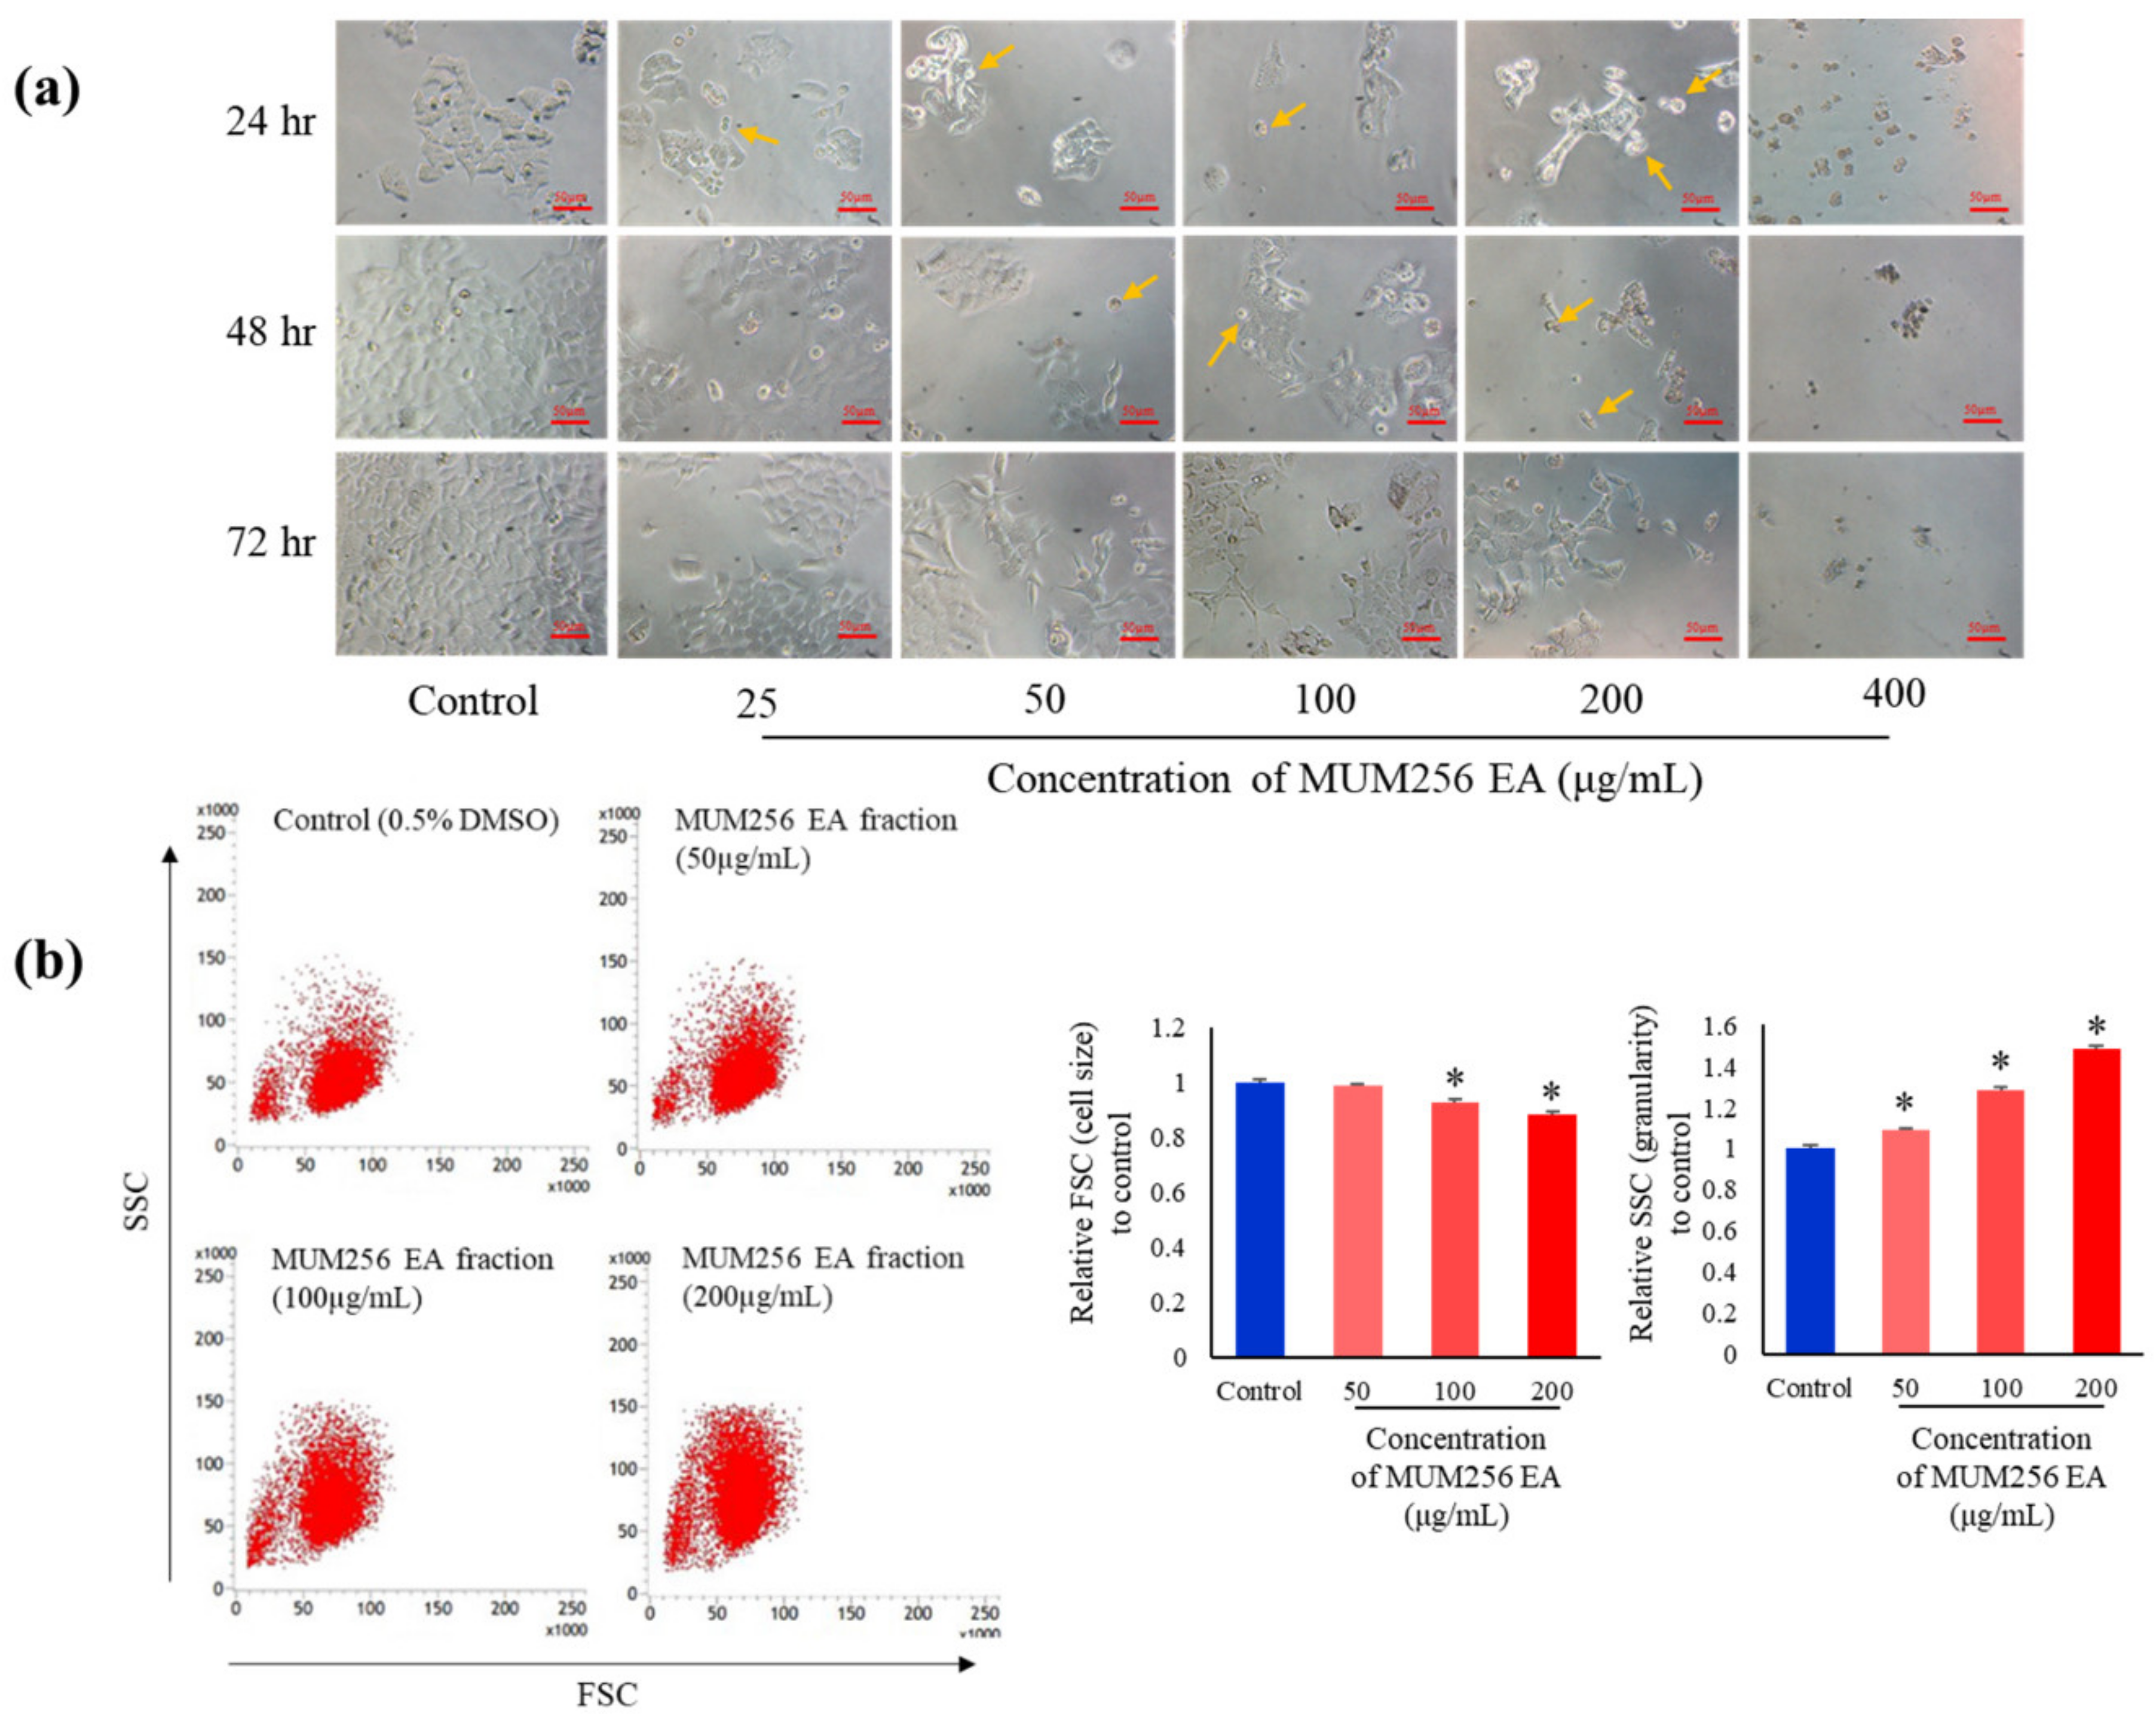
2.4. Morphological Changes Induced by MUM256 EA

The morphological examination revealed that the treatment of MUM256 EA visibly altered the cell morphology of the viable HCT116 cells. In Figure 4a, most of the untreated HCT116 cells (control) appeared as normal angular and spindle shapes, but most of the cells lost these features after treatment with MUM256 EA. For example, it was observed that the treatment caused rounding and detachment of HCT116 cells. In addition, reduced number of cells and cell shrinkage with lesser cytoplasm mass were also observed (indicated by arrows) in Figure 4a. These abnormal morphological changes of the cells upon exposure to MUM256 EA has provided some insight on its cytotoxic effect towards the HCT116 cells.
Furthermore, flow cytometry was also utilized to examine the morphological changes of the cells after treatment with MUM256 EA. The results showed a decrease in forward light scatter (Figure 4b); the median channel fluorescence was lowered in the treated cells with increasing dose of treatment. Meanwhile, the side light scatter was increased in the treated cells significantly with a 1.48-fold increase in the median channel fluorescence compared to the control (Figure 4b). The reduced forward light scatter indicates cell shrinkage, whereas the increased side scatter may be caused by chromatin condensation, nuclear fragmentation and crosslinking of cytoplasmic proteins by activated transglutamine, resulting in the cell becoming more reflective and refractive [32].

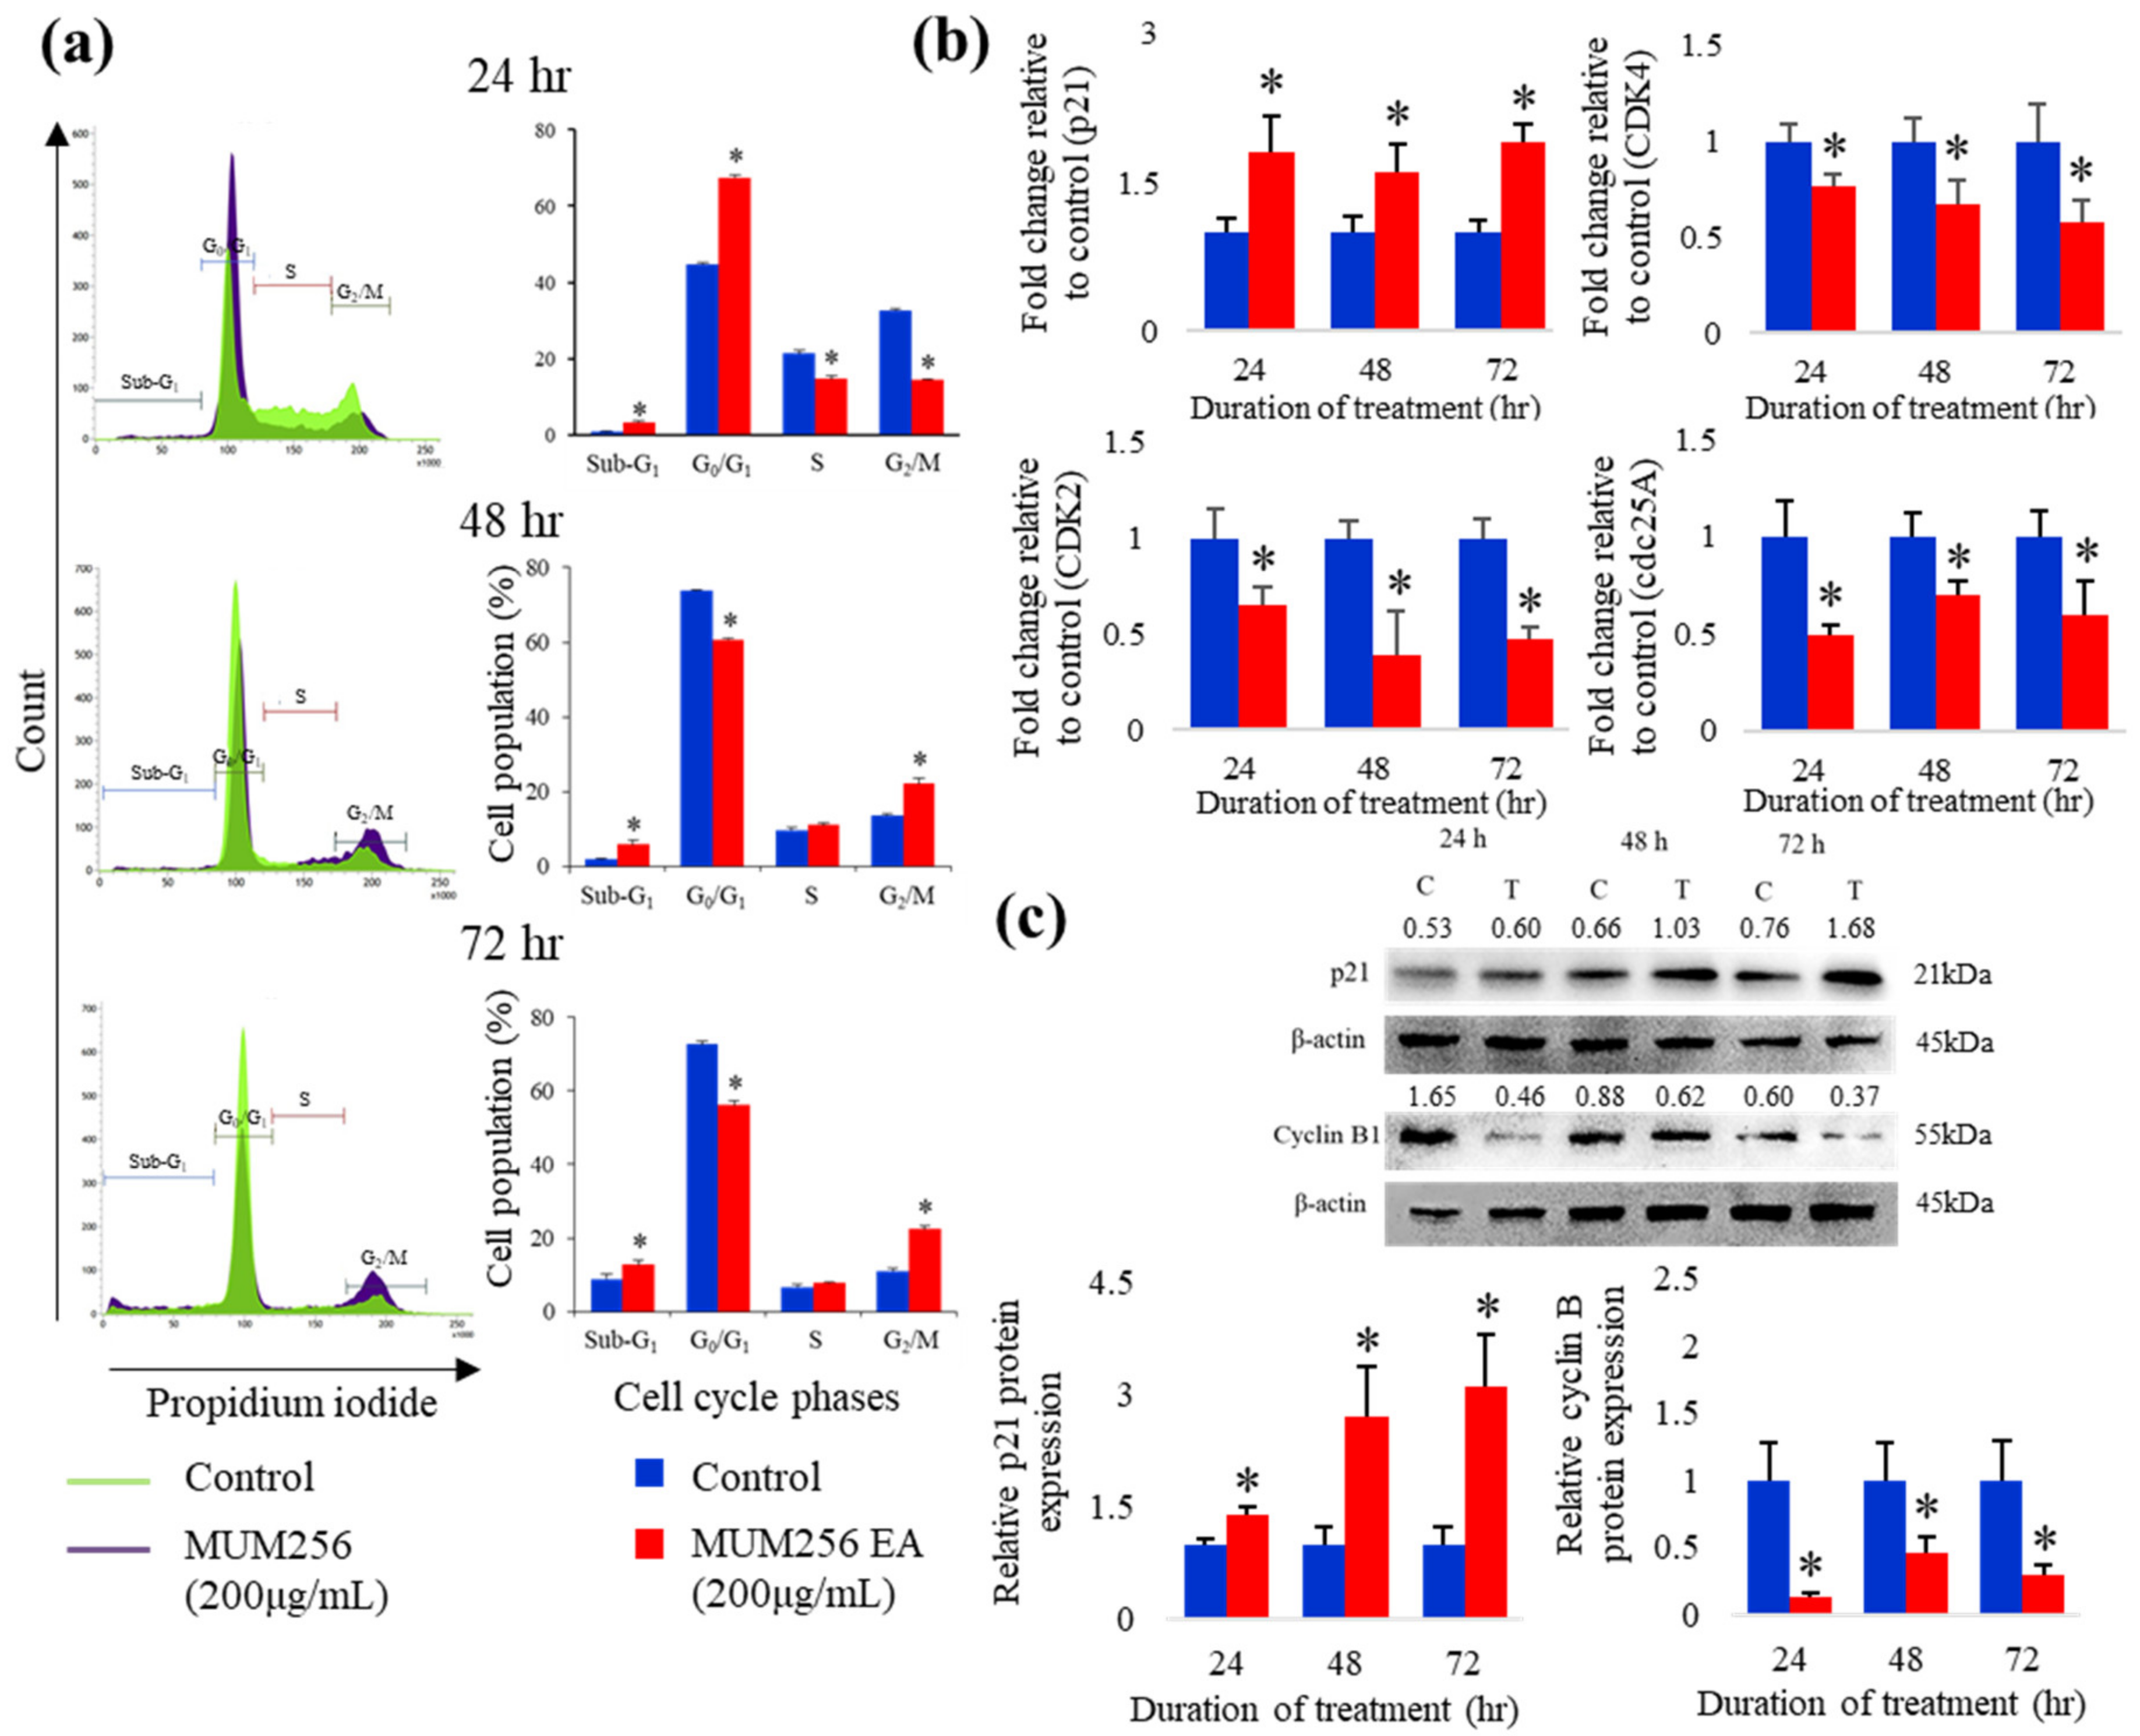
2.5. Cell Cycle Arrest Effect of MUM256 EA in HCT116 Cells

In Figure 5a, exposure of HCT116 to 200 μg/mL of MUM256 EA resulted in a statistically significant increase in the percentage of cells in G0/G1 phase from 44.7% (untreated cells) to 67.4%, with a concomitant decrease in percentage of cells in the G2 phase from 32.68% (untreated cells) to 14.31%. However, by 48 h, cells started accumulating in the G2 phase from 13.74% to 22.13% and followed by accumulation from 11.14% to 22.39% by 72 h (Figure 5a). These results suggested that MUM256 EA hampers cell-cycle progression by arresting the cells in G1 and G2/M phase, subsequently lead to inhibition of cell proliferation.

Expressions of Cell-Cycle Regulatory Proteins

After treatment with MUM256 EA for 24, 48 and 72 h, both reverse-transcription polymerase chain reaction (RT-PCR) and Western blotting analysis showed the expression levels of p21Waf1/Cip1 were significantly elevated as compared to untreated HCT116 cells (Figure 5b,c). As one of the transcriptional targets of p53, the expressions of p21Waf1/Cip1 could be regulated by p53 [33,34,35]. Thus, the changes of p53 in response to MUM256 EA in HCT116 was also investigated using intracellular flow cytometry. The p53 protein expression was shown to be increased upon treatment with MUM256 EA for 24 h (Figure 8c). This result supports that p53 activation plays a role in MUM256 EA-induced p21 up-regulation in HCT116 cells.
Besides that, this study also demonstrated that the MUM256 EA treatment downregulated several important cell cycle regulator genes, including CDK2, CDK4 and cdc25A phosphatase (Figure 5b). Western blot analysis also showed that MUM256 EA induced reduction in cyclin B1 protein levels in the HCT116 cells after 24, 48 and 72 h of exposure (Figure 5c).

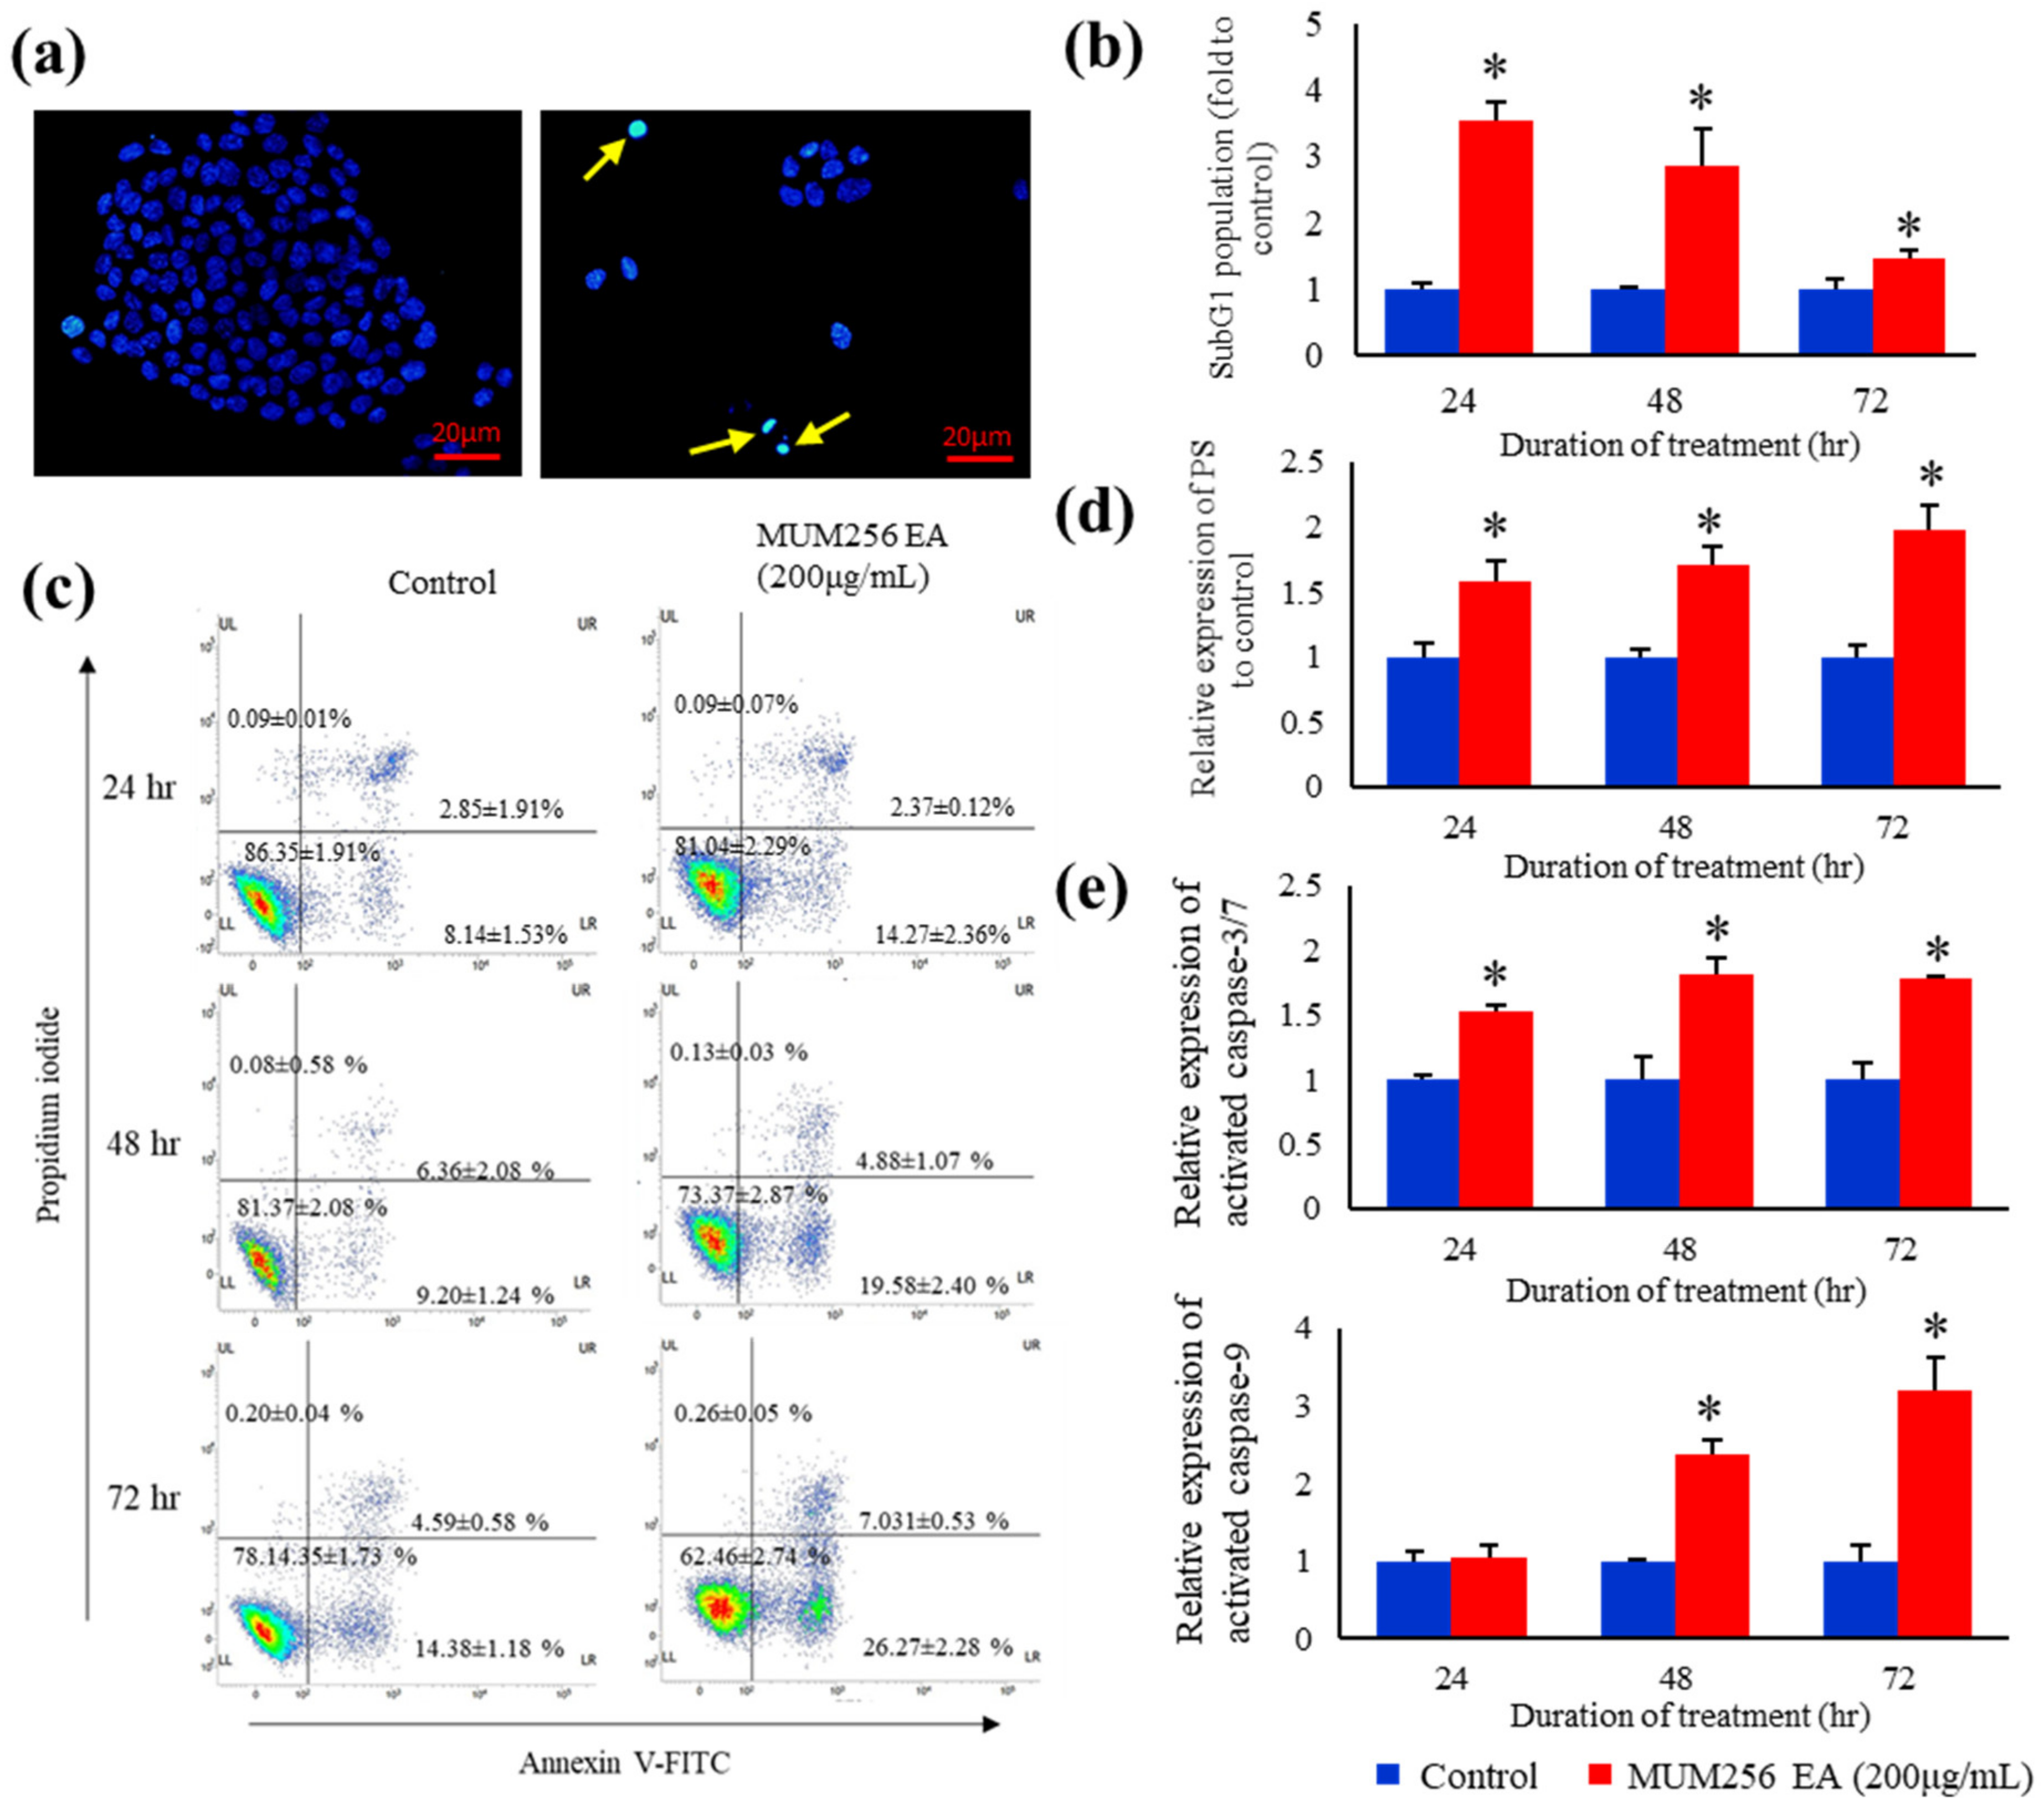
2.6. Nuclear Condensation and DNA Fragmentation

Differences were observed in the nuclei of treated and untreated HCT116 after staining with Hoechst 33258 (Figure 6a). The Hoechst 33258 dye stains morphologically normal nuclei dimly blue, whereas treated cells demonstrate smaller nuclei with brilliant blue staining due to nuclear condensation (yellow arrows). This result demonstrated that MUM256 EA induces morphological changes with characteristics of apoptotic cell death. This result is also consistent with the detection of a significantly increased percentage of subG1 cell populations as an index of the apoptotic DNA fragmentation.
MUM256 EA treatment increased the percentage of cells in the subG1 phase after treatment for 24, 48 and 72 h, respectively, as compared to control (Figure 6b). Intranucleosomal DNA fragmentation is a major hallmark of apoptosis [36,37]. PI is a fluorescent dye that binds stoichiometrically to nucleic acids [38]; and as fluorescence emission is proportional to DNA content of the cells, it allows the analysis of a cell population’s replication state. Hence, cells undergoing apoptosis can be identified from the DNA content histograms as those with lower fluorescent signal due to the low molecular weight of DNA fragments present in these cells compared to the G1 cells [37]. These data suggest that the reduced cell proliferation by MUM256 EA could be contributed by the induction of apoptosis.

2.7. Exposure of Phosphatidylserine

In this study, additional evidence for the occurrence of apoptosis was obtained by double staining of the cells with propidium iodide (PI) and Annexin V-FITC. Annexin V is a protein that binds with high affinity to phosphatidylserine (PS), which is translocated from the inner to the outer membrane leaflet during early apoptosis. Meanwhile, the healthy cells have phosphatidylserines on the inner leaflet of the plasma membrane. This technique is then combined with DNA binding dye (propidium iodide) which is impenetrable to intact membrane, hence allowing for the determination of the apoptotic state of a cell. As shown in Figure 6c, the percentage of the early apoptotic cells (PS positive and PI negative cells) increased in response to treatment with MUM256 EA for 24, 48 and 72 h. Overall, the percentage of apoptotic cells (PS positive cells) were increased in HCT116 cells treated with MUM256 EA for 24, 48 and 72 h (Figure 6d).

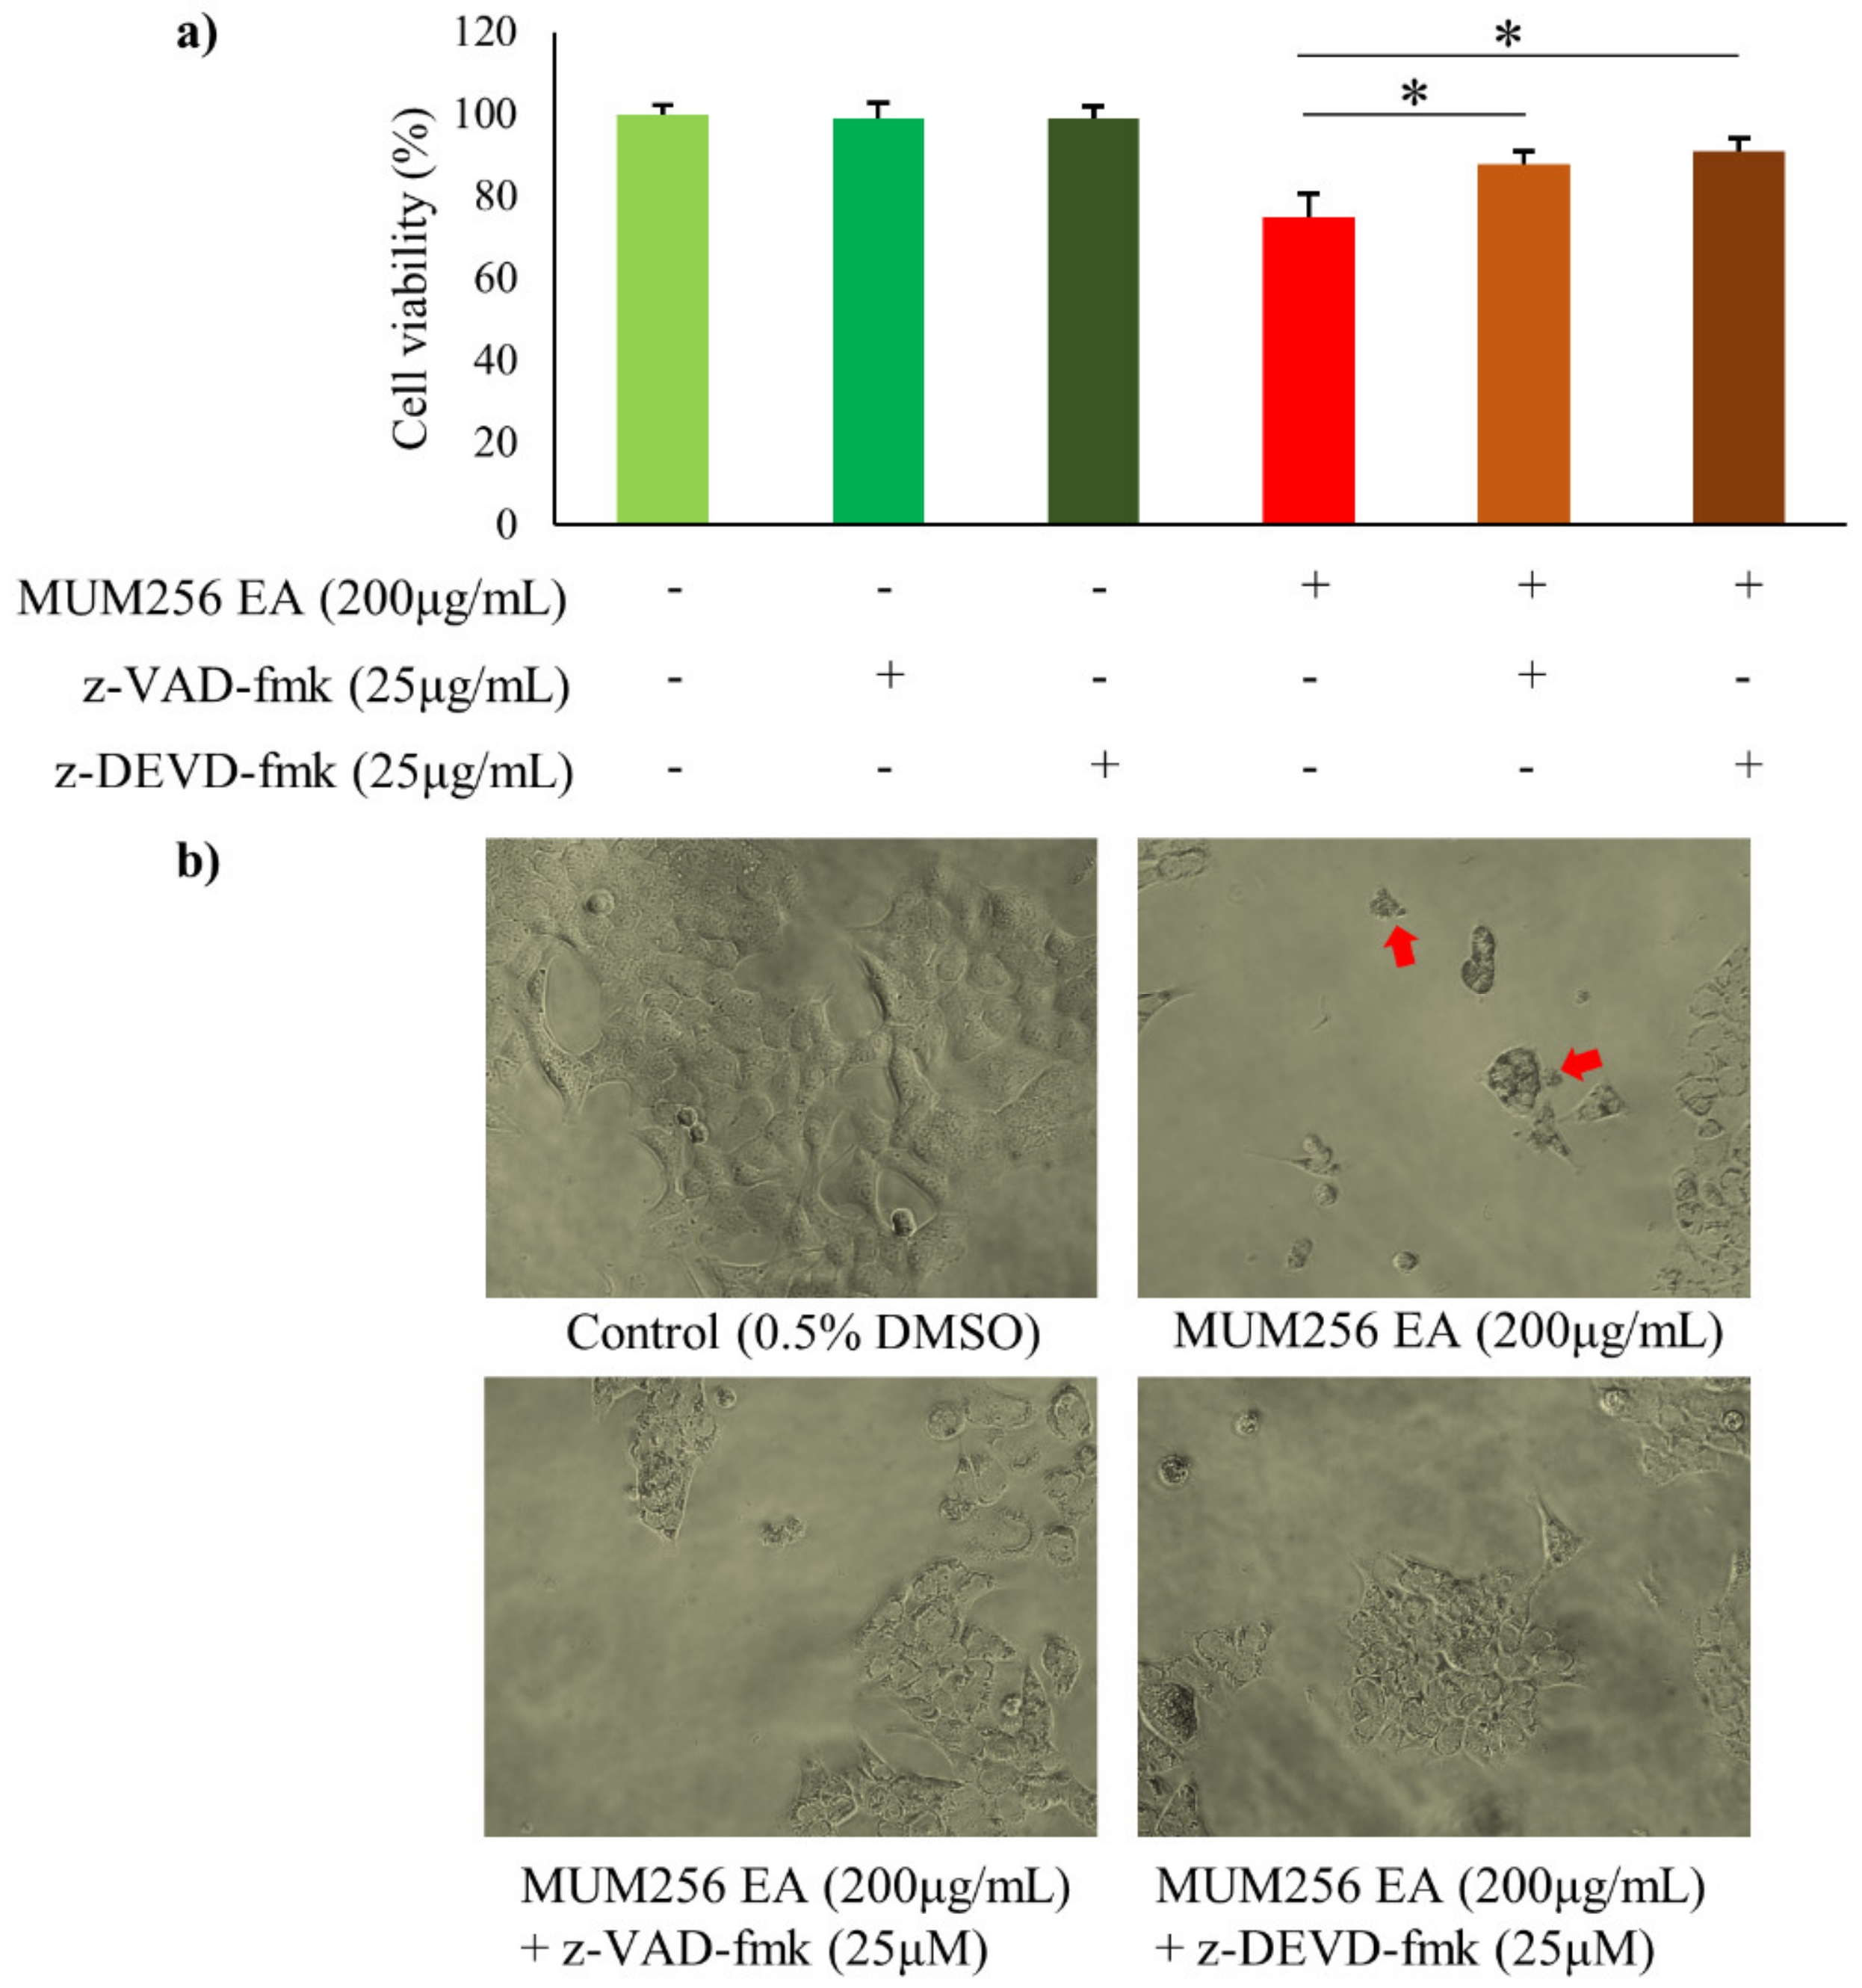
2.8. Caspase Activation

To investigate the effect of MUM256 EA in activation of caspases, flow cytometric analysis was performed using non-cytotoxic fluorescent labelled inhibitors, FAM-DEVD-FMK and FAM-LEHD-FMK that bind irreversibly to cysteine of the active center of caspase-3/7 or caspase-9 in the cells, respectively, hence allowing accurate quantification of the caspase activity in the cells. The results showed that the expression of active caspase-3/7 in HCT116 cells were significantly increased upon treatment with MUM256 EA for 24, 48 and 72 h as demonstrated by the increased median fluorescence intensity (MFI) (Figure 6e). Similarly, the flow-cytometric analysis demonstrated that MUM256 EA induced an increasing trend of caspase-9 activation in HCT116 cells (Figure 6e). Thus, MUM256 EA-induced cell death was accompanied by an increase in caspase activities, which then stimulated the molecular cascade of apoptosis. To further validate the apoptosis inducing effect of MUM256 EA, pretreatment of cells with either z-VAD-fmk, a broad-spectrum caspase inhibitor, or z-DEVD-fmk, a caspase-3 inhibitor, diminished the cell death induced by MUM256 EA (Figure 7). These data suggest that the MUM256 EA-induced apoptosis involves a caspase-dependent pathway in HCT116 cells.

2.9. Mitochondrial Membrane Potential (MMP)

To determine whether the caspase-dependent apoptosis in HCT116 cells was mediated through the mitochondrial apoptotic pathway in response to MUM256 EA treatment, the effect of MUM256 EA on the mitochondrial membrane permeability was investigated. JC-1 dye was used to assess the mitochondrial transmembrane potential of HCT116 cells in response to the treatment with MUM256 EA. JC-1 dye exhibits variable characteristics when bound to the membrane of apoptotic cells versus non-apoptotic cells. In non-apoptotic cells, JC-1 dye appears in aggregate form, emitting orange fluorescence at 590 nm when bound on polarized mitochondrial membrane with high membrane potential; but exists in monomeric form that emits green fluorescence at 527 nm in cells with disrupted mitochondrial potential [39]. The results of flow cytometry showed that treatment of HCT116 cells with MUM256 EA resulted in the increase of green-fluorescence-positive cells as well as the decrease in the JC-1 orange/green ratio in treated cells, suggesting depolarization of MMP (Figure 8a). This result suggested that the MUM256 EA induced cell apoptosis by causing the collapse of mitochondrial transmembrane potential in HCT116 cells.

2.10. Bax Pro-Apoptotic Protein Expressions

Given that mitochondrial transmembrane permeabilization represents a process of point-of-no-return, it is highly regulated, largely by members of the BCL-2 protein family [40]. Thus, we investigated the effect of MUM256 EA on the expression levels of Bax—which is a member of the BCL-2 family—in HCT116 cells. As shown in Figure 8b, RT-PCR analysis showed that treatment of HCT116 cells with MUM256 EA led to significantly increased expression of Bax at 24, 48 and 72 h. In line with the RNA expression result, the intracellular flow cytometry analysis showed the level of proapoptotic protein Bax in HCT116 cells was increased significantly upon treatment with MUM256 EA for 24, 48 and 72 h. This result suggested that the overall increase in Bax expressions could be the contributor to the mitochondrial mediated apoptosis induced by MUM256 EA in HCT116 cells.

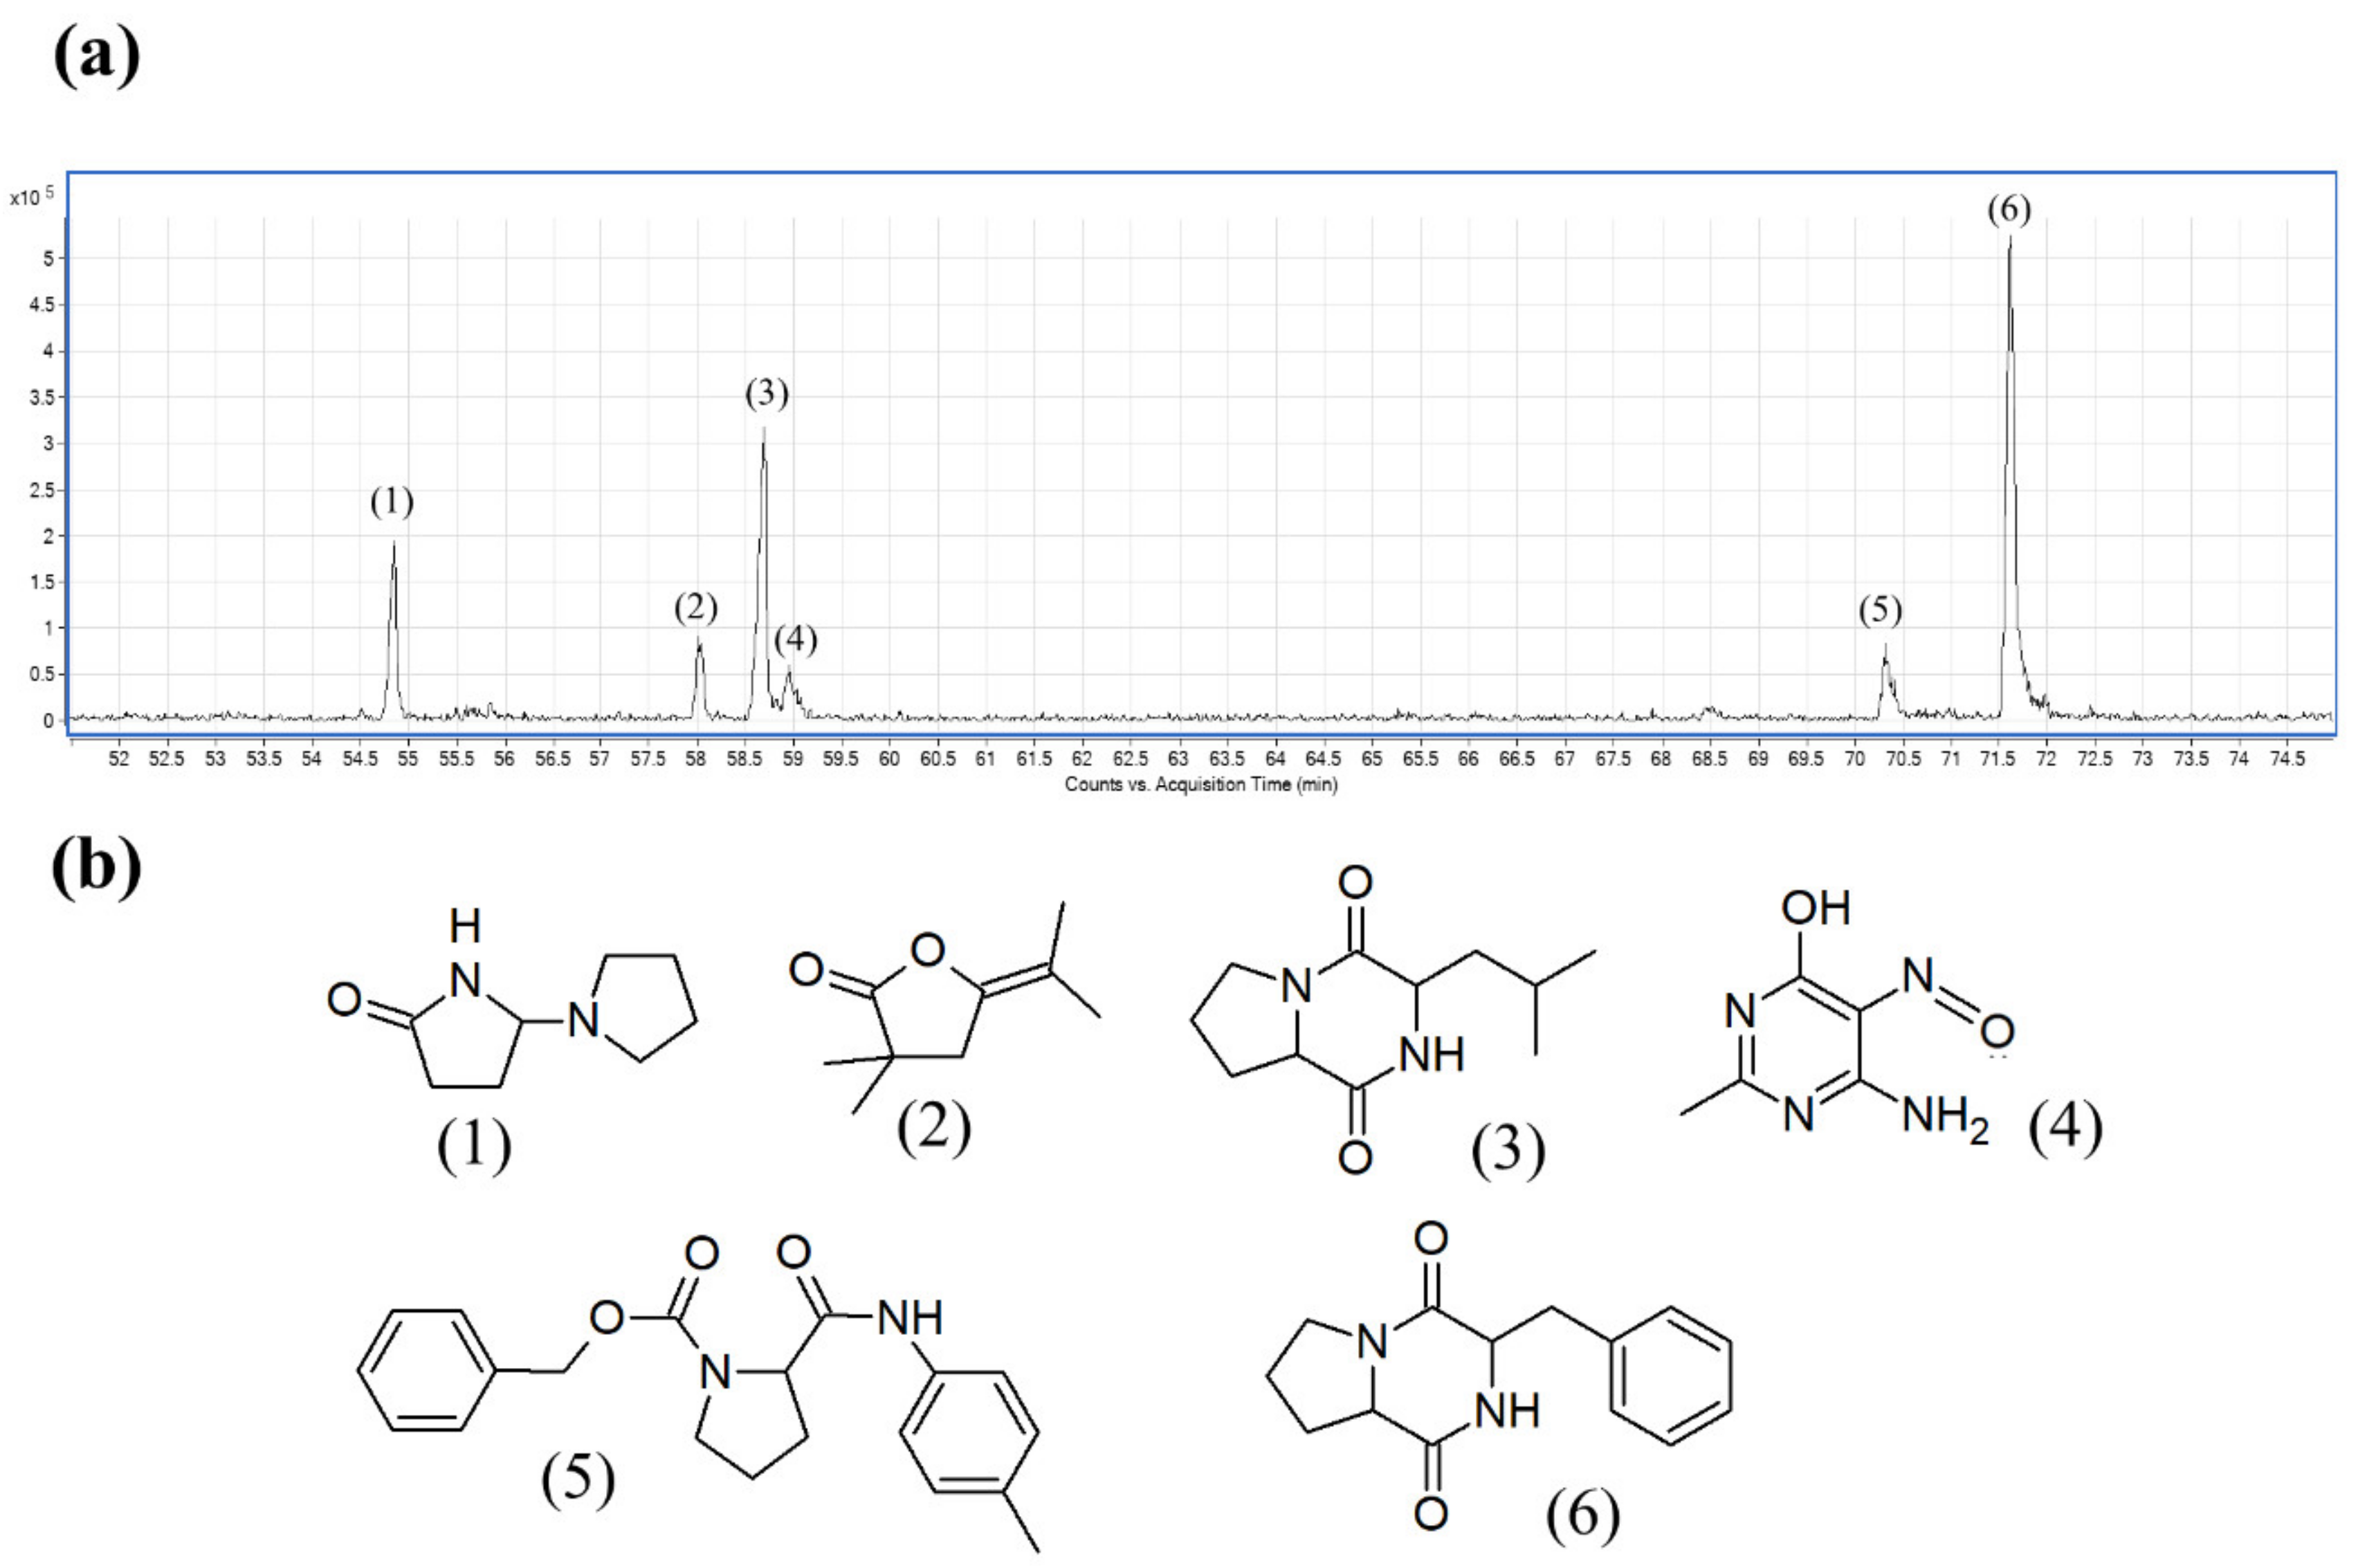
2.11. Detection of Bioactive Constituents in Streptomyces sp. MUM256 EA Extract Using Gas Chromatography-Mass Spectrometry

To further elucidate the potential chemical compounds that may have contributed to the antioxidant and cytotoxic properties, gas chromatography-mass spectrometry (GC-MS) was used to detect the chemical compounds present in MUM256 EA. GC-MS has been widely used as the analytical tool for molecular detection and identification in drug discovery. Numerous studies also utilized GC-MS to profile the bioactive compounds present in the secondary metabolites of Streptomyces bacteria [41,42,43]. The results of GC-MS analysis revealed that MUM256 EA contains several groups of chemical compounds, including the pyrrole, pyrazine and cyclic dipeptides. The identification of the chemical compounds was performed by comparing their mass spectra to standard mass spectra available in the database of NIST 05 Spectral library. Table 1 tabulates the retention time, molecular weight and molecular formula of the chemical compounds. Figure 9a,b depicts the GC chromatogram and chemical structures detected in MUM256 EA, respectively.

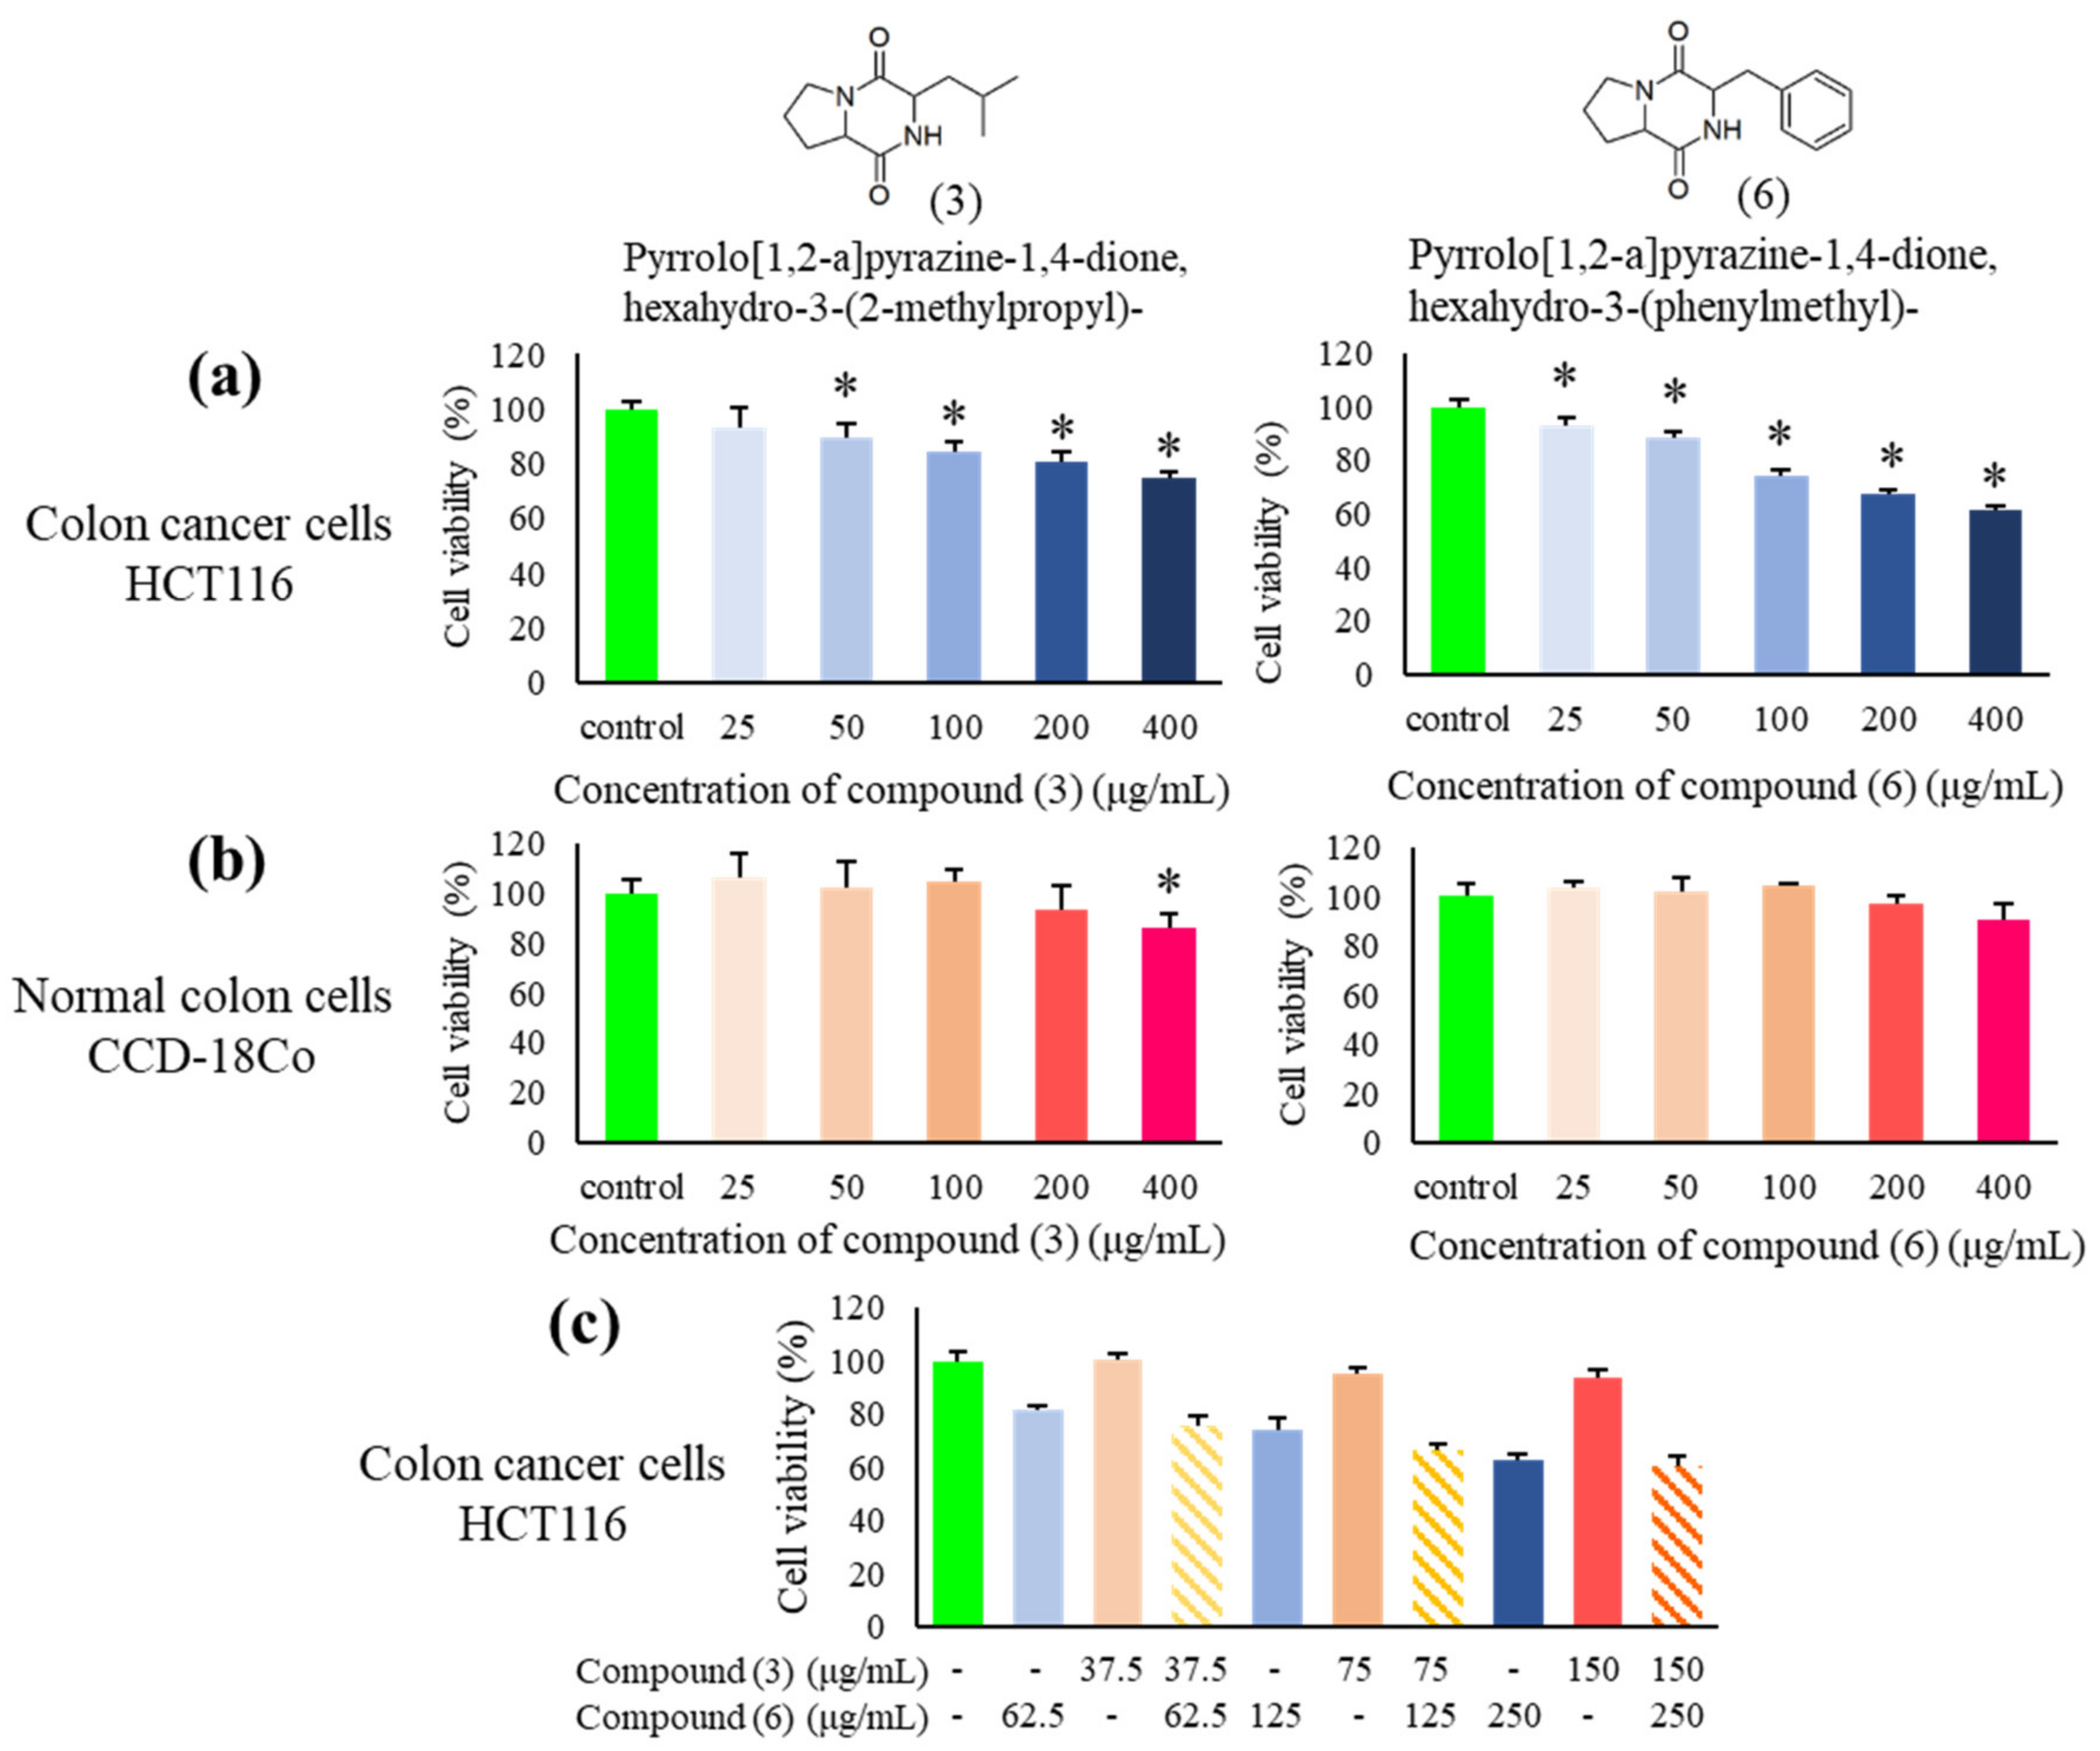
2.12. The Cytotoxic Effects of the Two Main Bioactive Constituents Detected by Gas Chromatography-Mass Spectrometry (GC-MS) against HCT116 and CCD-18Co Cells

To examine the cytotoxic properties of the chemical compounds in MUM256 EA, pure Compounds (3) and (6) were obtained and tested against HCT116 colon cancer cells and the CCD-18Co normal colon cells. Based on the results, Compound (6) showed stronger cytotoxic effect against HCT116 cells as compared to Compound (3) after 72 h exposure (Figure 10a). Interestingly, both compounds were not toxic towards the CCD-18Co cells with no significant reduction in cell viability at all the concentrations tested after 72 h of exposure (Figure 10b), except Compound (3) reduced the cell viability of CCD-18Co to 86% at 400 μg/mL. Both compounds also showed cytotoxic effect against another colon cancer (HT-29 cells) (Figure S2). To investigate potential combination effects between Compounds (3) and (6), HCT116 cells were treated with Compounds (3) and (6) at a ratio of 3:5 based on peak height shown in the GC-MS total ion chromatogram. However, the results did not indicate any significant combined effect of both compounds against HCT116 (Figure 10c).

3. Discussion

Actinobacteria, including the genus Streptomyces, from unexplored ecosystems, such as mangrove environments, represent a prolific source of bioactive compounds which can contribute immensely to humans in various biotechnological and pharmaceutical applications [44,45,46,47,48]. The capability of these mangrove-derived Streptomyces to produce unique secondary metabolites with interesting bioactivities has been linked to the highly dynamic mangrove ecosystem that exerts significant influence on bacterial metabolic and physiological adaptations [26,49]. In the present study, Streptomyces sp. MUM256 was demonstrated to produce bioactive compounds—present in the ethyl acetate fraction of crude extract—which exhibited promising antiproliferative activity against colon cancer cells.
In this study, MUM256 EA demonstrated the strongest cytotoxicity effects on HCT116 cells as examined by the 3-(4,5-dimethylthiazol-2-yl)-2,5-diphenyl tetrazolium bromide (MTT) assay which measures the mitochondrial activity in viable cells [50]. Based on the morphological changes assessed by phase-contrast microscopy and flow cytometry, MUM256 EA is suggested to exert its cytotoxic effect by causing the reduced viability of HCT116 through mechanisms associated to apoptotic cell death. This is because among the predominant features of apoptotic cells were their diminished size, condensation of chromatin, segregation of nucleoli, nuclear fragmentation and formation of apoptotic bodies [51,52], features which we observed in treated cells. However, the decreased forward light-scatter signal is not a specific marker of apoptosis since mechanically broken and fragmented cells, isolated cell nuclei, and necrotic cells also have reduced light-scatter properties. Therefore, a more specific assay should be accompanied with these observations to determine the mode of cell death.
Carcinogenesis is a result of cell-cycle disorganization, leading to uncontrolled cellular proliferation [53]. Regulatory proteins like the cyclins, cyclin-dependent kinases (CDK) and their substrate proteins, CDK inhibitors and tumor-suppressor genes are major proteins that control the cell-cycle progression [54]. In tumors, these cell cycle regulators are altered, resulting in failure to control the correct entry and progression through the cell cycles; thus agents that suppress proliferation of cancer cells by regulating these cell cycle regulators have therapeutic value [55]. In the present study, we demonstrated that MUM256 EA reduced the proliferation of colon cancer cells by arresting cells at G1 and G2 phases through the modulation of cell-cycle regulatory proteins including p21, cyclin B1, CDK2, CDK4 and cdc25A phosphatase.
CDK inhibitory protein, p21, is an essential signaling molecule in regulating the cell-cycle progression by interacting directly with cyclin/CDK complexes. It inhibits CDK activities, which in turn results in decreased cell proliferation. Hence, the expression of CDK inhibitory protein p21 has been exploited in the development of chemotherapeutic drugs that disrupt carcinogenesis by impeding the cell cycle in cancer cells [56]. Consistent with this notion, the increased p21 expression level in response to MUM256 EA treatment was accompanied by the decreased expression levels of CDK2 and CDK4 in HCT116 cells. CDK4 associates with cyclin D to regulate the cell-cycle progression in the G1 phase; the cyclin D/CDK4 senses cell mitogenic signals and prompts the cells to initiate DNA synthesis [55,57]. Similarly, CDK2 associates with cyclins E/A to form complexes which activate the downstream targets, including Rb and E2F transcription factor, hence facilitating the transition of G1 to S phase and DNA synthesis [58]. Thus, the accumulation of HCT116 cells in G1 phase in response to MUM256 EA could be due to the downregulation of CDK2 and CDK4 which are crucial in controlling G1/S transition and G1 progression.
The cdc25A is found to be involved in both early G1/S and late G2/M transitions. In the regulation of S phase entry, it activates CDK2 through its dephosphorylating action [59]. Meanwhile, overexpression of cdc25A was also found to mediate mitosis through the regulation of G2/M transition by activating the cyclin B1/CDK1 complexes [60,61]. Thus, we examined the expression levels of cdc25A and cyclin B1 in HCT116 cells upon treatment with MUM256 EA. The expression of cdc25A phosphatase was reduced in HCT116 cells upon treatment with MUM256 EA. Furthermore, a previous study demonstrated that p21 plays an important role in mediating the degradation of cyclin B1 in response to DNA damage and is necessary for the maintenance of G2 cell-cycle arrest in HCT116 cells [62]. Thus, the upregulation of p21 and downregulation of cdc25A in response to MUM256 EA may be involved in the downregulation of cyclin B1 which lead to G2/M cell-cycle arrest in HCT116 cells.
Dysregulation of the apoptotic mechanism has been associated with carcinogenesis. Therefore, any defects along the apoptotic pathway can lead to unchecked cell proliferation, development and progression of cancer and cancer resistance to drug therapies. Thus, apoptosis induction in cancer cells by modulating the pro-apoptotic proteins involved in the apoptotic pathways is an effective strategy for cancer treatment. We demonstrated that MUM256 EA induced cell death in HCT116 via apoptosis as shown by the increased number of Annexin-V positive cells. Furthermore, the use of fluorescent labelled inhibitors, FAM-DEVD-FMK and FAM-LEHD-FMK and the use of caspase inhibitors (benzoylcarbonyl-valyl-alanyl-aspartyl-[O-methyl]-fluoromethylketone (z-VAD-fmk) and benzoylcarbonyl-aspartyl-glutamyl-valyl-aspartyl-fluoromethylketone (z-DEVD-fmk)) further confirmed the role of caspases in MUM256 EA-induced apoptosis. Activated initiator caspases cleave and activate effector caspases, which are involved in cleavage of multiple cellular protein substrates, resulting in triggering of apoptosis [40].
Our data showed that MUM256 EA treatment resulted in increased HCT116 cells with depolarised MMP as compared to the untreated of HCT116 cells. The loss of mitochondrial membrane potential is one of the hallmarks of apoptosis [63]. This result suggests that MUM256 EA-induced cell apoptosis is mediated by mitochondrial-dependent pathways in HCT116 cells. Nevertheless, the occurrence of mitochondrial depolarization also could be a consequence of apoptosis induced by MUM256 EA.
The apoptotic mitochondrial events are tightly regulated by the members of Bcl-2 family of proteins [64]. As a proapoptotic protein, the active Bax functions to permeabilise the mitochondrial outer membrane through the formation of oligomers which induce pore formation at the mitochondrial outer membrane [65]. It is also well established that Bax accumulation causes the release of cytochrome c from mitochondria, leading to the activation of caspase cascade [66,67]. The present findings indicate that MUM256 EA treatment elevated both RNA and protein expression of Bax in HCT116 cells which confirmed the involvement of intrinsic pathway of apoptosis in HCT116 cells.
Literature shows that p53 mediated G1 and G2 cell cycle arrest could also be accomplished through transcriptional activation of its downstream targets p21, GADD45α, 14-3-3ε [68]. Our results also support this notion that p53 activation may be involved in the cell cycle arrest in HCT116 cells mediated by MUM256 EA-induced p21 up-regulation. Furthermore, p53 plays an important role in apoptosis via induction of pro-apoptotic Bax protein in response to cellular stress responses. Thus, the increased p53 protein expression suggests that p53 activation may also play an important in the MUM256 EA-induced apoptosis in HCT116 cells. Overall, these data suggest that MUM256 EA triggers sequential activation of p53/Bax/caspase-9/caspase-3/7 cascade to induce the mitochondrial-mediated apoptotic cell death program in HCT116 cells.
According to GC-MS analysis, several groups of chemical compounds such as pyrrole, pyrazine and cyclic dipeptides were detected in the MUM256 EA. The chemical compounds detected in this study also have been evidenced previously in the microbial fermentation broth/extracts, including those isolated from Actinobacteria and the genus Streptomyces. For example, 5-pyrrolidino-2-pyrrolidone (1) [43], pyrrolo [1,2-a] pyrazine-1,4-dione, hexahydro-3-(2-methylpropyl)- (3) [69,70], pyrrolo [1,2-a] pyrazine-1,4-dione, hexahydro-3-(phenylmethyl)- (6) [70].
Both pyrrolo [1,2-a] pyrazine-1,4-dione, hexahydro-3-(2-methylpropyl)- (3) and pyrrolo [1,2-a] pyrazine-1,4-dione, hexahydro-3-(phenylmethyl)- (6) were detected and they belong to the chemical group of proline-containing cyclic dipeptide or 2,5-diketopiperazines (DKP). They appear to be the two major constituents present in MUM256 EA (Figure 9a). DKP consists of a group of the simplest peptide derivatives that are found ubiquitously in nature [71]. Numerous studies have also pointed out the detection of these peptides in the fermentation culture of microorganisms [72,73,74]. Previous studies also reported that these cyclic dipeptide compounds possess antioxidant and cytotoxic properties [75,76,77,78]. A number of previous studies also elucidated the underlying mechanism of action of pyrrolo [1,2a] pyrazine-1,4-dione, hexahydro-3-(phenylmethyl)- (6) in killing cancer cells [79,80,81]. To sum up the results of GC-MS analysis, several chemical compounds were detected which have been noted to have pharmacological properties by previous studies, suggesting that the anti-colon cancer properties of MUM256 EA could be contributed by these chemical compounds. In this study, both pyrrolo [1,2-a] pyrazine-1,4-dione, hexahydro-3-(2-methylpropyl)- (3) and pyrrolo [1,2a] pyrazine-1,4-dione, hexahydro-3-(phenylmethyl)- (6) were demonstrated to inhibit the growth of HCT116 cells, indicating that these compounds may have been responsible for the anti-colon cancer properties of MUM256 EA. However, the efficacy of these compounds and their combined effect was not as strong as MUM256 EA against HCT116 colon cells, and this may be due to possible interactions between Compounds (1), (2), (4) and (5) in MUM256 EA with the cancer cells. Thus, future study should further identify and validate the potential lead compound as well as elucidate the mechanisms underlying the cell cycle arrest and apoptosis induction. Nonetheless, this study has shed light on the Streptomyces sp. strain MUM256 as a promising source for bioactive compounds with anti-colon cancer activities.

4. Materials and Methods

4.1. Phylogenetic Analysis of Strain MUM256

The 16S rRNA gene of strain MUM256 (GenBank accession number KT459477) was subjected to multiple alignment analysis using CLUSTAL-X software with representative sequences of related type strains in genus Streptomyces [82]. The reference sequences were obtained from the GenBank/European Molecular Biology Laboratory (EMBL)/DNA Data Bank of Japan (DDBJ) databases on 20th June 2019. The phylogenetic tree was reconstructed according to neighbor-joining algorithm with the use of MEGA version 6.0 software. Kimura’s two-parameter model was selected for computing the evolutionary distances of neighbor-joining algorithm [83]. Bootstrap analysis based on 1000 resamplings method of Felsentein was performed to evaluate the topology of the constructed phylogenetic tree [84]. The sequence similarities were calculated based on Ezbiocloud server (http://www.ezbiocloud.net/) [85].

4.2. Fermentation and Preparation of Extracts for Bioactivities Screening

A 14-day culture of Streptomyces sp. MUM256 in TSB was used as the inoculum for fermentation process using Han’s fermentation media 1 (HFM1) as the fermentative medium [49,86]. Fermentation was carried out in an Erlenmeyer flask containing 200 mL of HFM1 for 7–10 days at 28 °C with shaking speed at 200 rpm. The resulting HFM1 medium was subjected to centrifugation at 12,000× g for 15 min. The supernatant was filtered and freeze-dried before proceeding to extraction with methanol. After 72 h of extraction with methanol, the supernatant was filtered and collected. The residue was re-extracted twice under the same conditions. A rotary vacuum evaporator was used to remove the methanol from the crude extract at 40 °C, and DMSO was used to dissolve the crude extract prior to assay.

4.3. Fractionation of Methanolic Crude Extract of Streptomyces sp. MUM256

The MUM256 crude extract was subjected to sequential fractionation using selected solvents namely hexane, ethyl acetate and water. The solid methanolic MUM256 extract was suspended and macerated with hexane solvent. The hexane fraction was obtained after filtration through filter paper. The residue was partitioned between equal volumes of ethyl acetate and distilled water. Both the hexane and ethyl acetate fractions were concentrated using a rotary evaporator while the aqueous fraction was subjected to freeze drying. The dried fractions were suspended in DMSO before further analysis.

4.4. Cell Culture

Both human colon cancer (HCT116, HT-29) and normal colon (CCD-18Co) cell lines were purchased from American Type Culture Collection (ATCC, Virginia, VA, USA). The cells were cultured in RPMI (Roswell Park Memorial Institute)-1640 (Gibco, Life Technologies, Gaithersburg, MD, USA) supplemented with 10% fetal bovine serum and 1× antibiotic-antimycotic (Gibco) at 37 °C in a humidified incubator containing 5% CO2 and 95% air. The cultures were viewed using an inverted microscope to assess the degree of confluency and to ensure they were free from bacterial and fungal contamination.

4.5. Cell Viability Test Using MTT (3-(4,5-Dimethylthiazol-2-yl)-2,5-Diphenyltetrazolium Bromide) Assay

The cytotoxic effect of the extract/fractions on HCT116, HT-29 and CCD-18Co cell lines were determined using 3-(4,5-dimethylthiazol-2-yl)-2,5-diphenyltetrazolium bromide (MTT) assay [87]. The cells (5 × 10³ cells/well) were seeded into 96-well plates and left to adhere overnight in the incubator. Streptomyces extract/fraction was added into each well in a series of concentrations (25 to 400 µg/mL) in the presence or absence of apoptosis inhibitors (z-VAD-fmk or z-DEVD-fmk). Pyrrolo [1,2-a] pyrazine-1,4-dione, hexahydro-3-(2-methylpropyl)- (Henan Tianfu Chemical Co., Ltd., Zhengzhou, China) and pyrrolo [1,2-a] pyrazine-1,4-dione, hexahydro-3-(phenylmethyl)- (Chemieliva Pharmaceutical Co., Ltd., Chongqing, China) were added into each well in a series of concentrations. DMSO (0.5% (v/v)) was used as the solvent and the negative control in all the experiments. The treatment of cells was conducted according to the indicated durations. MTT assay was performed with the addition of 20 µL of 5 mg/mL of MTT (Sigma, Saint Louis, MO, USA) into each well and incubated at 37 °C in a humid atmosphere with 5% CO2, 95% air for 4 h. The formazan crystals were dissolved in DMSO (100 µL) after the removal of the medium. The absorbance of dissolved formazan solution was measured spectrophotometrically at 570 nm (with 650 nm as reference wavelength) using a microplate reader.

4.6. Trypan Blue Exclusion Assay

Trypan blue was used to stain and differentiate live and dead cells. Under phase contrast microscopy, the live cells appear colorless and bright while the dead cells stained blue after exposure to trypan blue. The live cells were counted using a haemocytometer.

4.7. Clonogenic Survival Assay

HCT116 cells were seeded in 6-well plates at 1500 cells/well, and the indicated concentrations of MUM256 EA were added the following day. After 24 h of treatment, the media containing the MUM256 EA was aspirated and rinsed with phosphate-buffered saline (PBS). Fresh culture media was added, and the cells were left for 1 week to form colonies [88]. The culture media was replaced with fresh culture media every 2 days. Colonies were fixed in ice-cold methanol and subsequently stained with 0.01% crystal violet in dH2O for 10 min. Excess stain was rinsed twice with dH2O and allowed to air dry. Images of each well were taken, and the colony area was quantitated using the ‘colony area’ plugin of ImageJ software [89].

4.8. Phase Contrast Microscopy

The effect of MUM256 EA on the HCT116 cells was examined morphologically with an inverted light microscope.

4.9. Flow Cytometry

Flow cytometric analysis was performed on a BD FACSVerseTM flow cytometer (BD Bioscience, San Jose, CA, USA). For phenotypic characterization of cells, the cells were harvested and washed twice with PBS after treatment. The aliquots of cell suspension were analysed according to cell size (as defined by FSC value) and their granularity (as defined by SSC value) using the FSC/SSC dot plot diagram. A total of 10,000 events were acquired for each sample and presented on the FSC/SSC dot plot.

4.10. Cell-Cycle Analysis Using Propidium Iodide (PI)

DNA content and cell cycle distribution were evaluated using propidium iodide (PI) staining [90]. After exposure to MUM256 EA for a designated period, the cells were harvested and washed with PBS before being fixed with 70% ice-cold ethanol at −20 °C overnight. Fixed cells were washed twice and stained in a buffer containing 25 μg/mL PI, 0.1% Triton-X-100 and 100 μg/mL RNase A for 30 min in a dark at room temperature. The PI-stained cells were acquired up to 10,000 events and analysed using BD FACSVerseTM flow cytometer (BD Bioscience, San Jose, CA, USA).

4.11. Quantification of Gene Expression Using Reverse-Transcription Quantitative Polymerase Chain Reaction (PCR)

To investigate the antiproliferative and apoptotic effects of the Streptomyces sp. MUM256 EA, the expression of genes associated with apoptosis and cell cycle regulation were examined using qPCR. After treatment, the total RNA from cancer cells was extracted using TRIZOL reagent. The RNA concentration was determined by ultraviolet (UV) spectrophotometry. Reverse transcription of the extracted RNA was performed using a commercial cDNA reverse transcription kit. Quantitative real-time PCR was conducted in a reaction mixture containing cDNA, specific primers and SYBR Green qPCR master mix. The following primer pair sequences were used: CDK2, 5′-GGTCCTCCACCGAGACCTTAA-3′ (forward) and 5′-CAGGGACTCCAAAAGCTCTGG-3′ (reverse); CDK4, 5′-CAGTGTACAAGGCCCGTGATC-3′ (forward) and 5′-ACGAACTGTGCTGATGGGAAG-3′ (reverse); cdc25A, 5′-CCCCAAAGGAACCATTGAGA-3′ (forward) and 5′-CTGATGTTTCCCAGCAACTG-3′ (reverse); p21WAF1/CIP1, 5′-GGACAGCAGAGGAAGACCATGT-3′ (forward) and 5′-GCCGTTTTCGACCCTGAGA-3′ (reverse); 18S rRNA, 5′-GGCCCTGTAATTGGAATGAGTC-3′ (forward) and 5′-CCAAGATCCAACTACGAGCTT-3′ (reverse); Bax, 5′-GTCGCCCTTTTCTACTTTGCCAG-3′ (forward) and 5′-TCCAGCCCAACAGCCGCTCC-3′ (reverse); PBGD, 5′-ACCATCGGAGCCATCTGCAAG-3′ (forward) and 5′-CCCACCACACTCTTCTCTGGCA-3′ (reverse). Primers specificity was confirmed by peak melt curve before use. The amplification was then performed as described by Goh, et al. [91]. The RNA expression level of the genes of interest was then analysed and normalized to the house keeping genes (18SrRNA and PBGD) expression levels.

4.12. Western Blot Analysis

The cells were harvested and lysed in cold radioimmunoprecipitation assay (RIPA) buffer containing protease and phosphatase inhibitors after treatment with MUM256 EA for designated periods. The total content of protein was quantified using bicinchoninic acid (BCA) assay. Twenty-five micrograms of total protein were loaded into 10% sodium dodecyl sulphate-polyacrylamide gel electrophoresis (SDS-PAGE) and transferred onto a nitrocellulose membrane. The membrane was blocked with skim milk for 1 h prior to incubation with primary antibodies (p21, cyclin B1 and β-actin, Cell Signaling Technology, Denver, MA, USA) overnight at 4 °C. After substantial washing, the membrane was reacted with anti-rabbit/mouse immunoglobulin G-horseradish peroxidase-labelled secondary antibodies for 1 h at room temperature. The membrane was stained with enhanced chemiluminescence (ECL) detection kit prior to detection using gel documentation system. Image J was used to analyse and quantify the band intensities.

4.13. Hoechst 33342 Nuclear Staining

Hoechst 33342 nuclear stain was used to detect the apoptotic cells by observing the apoptotic nuclear morphology using fluorescence microscopy. After treatment, the cells were harvested in PBS and then exposed to 0.05 g/L Hoechst 33342 dye in PBS for 30 min at room temperature. The samples were observed and analysed under fluorescence microscope [90].

4.14. Externalization of Phosphatidylserine Detection by Flow Cytometry

The cells were harvested after treatment with MUM256 EA. A cell suspension at a density of 1 × 10⁶ /mL was prepared and subjected to centrifugation to obtain the cell pellet. The cell pellet was washed with pre-cooled PBS prior to the staining with Annexin V-FITC and propidium iodide in the 1X binding buffer [90]. After incubation at room temperature for 15 minutes in the dark, cells were analyzed by flow cytometry. A total of 10,000 events were collected and analysed using BD FACSVerseTM flow cytometer (BD Bioscience, San Jose, CA, USA).

4.15. Measurement of Caspases-3/7 and -9 Activities

Using Carboxyfluorescein FLICA Apoptosis Detection Kit (Immunochemistry technologies, LLC), the caspases-3/7 and -9 activities were measured in HCT116 cells after treatment by flow cytometer. The treated cells were harvested and incubated with 1x FAM-DEVD-FMK or FAM-LEHD-FMK reagent for 1 h at 37 °C. The stained cells were washed twice with washing solution before subjected to 10,000 events acquisition and analysis by using FACSVerseTM flow cytometer (BD Bioscience, San Jose, CA, USA).

4.16. Mitochondrial Membrane Potential Analysis

JC-1 (5,5′,6,6′-tetrachloro-1,1′,3,3′-tetrathylbenzimidazolcarbocyanine iodide) dye from BDTM MitoScreen kit ((BD Bioscience, San Jose, CA, USA) was used to evaluate the status of mitochondrial membrane potential of the cells. After exposure to Streptomyces sp. MUM256 EA for a designated period, cells were harvested and washed twice before being subjected to 10,000 events acquisition and analysis by using BD FACSVerseTM flow cytometer (BD Bioscience, San Jose, CA, USA).

4.17. Measurement of p53 and Bax Proteins by Flow Cytometry

The expression level of p53 and Bax proteins was determined by immunofluorescence staining using flow cytometry. After the treatment with MUM256 EA, cells were washed twice with PBS, fixed and subsequently permeabilized using Cytofix/Cytoperm™ kit (BD Biosciences, San Jose, CA, USA). The cells were resuspended in 500 µL of fixation/permeabilization solution and incubated at 4 °C for 20 min. The cells were washed twice with Perm/Wash™ buffer and incubated for another 15 min in 1 mL of Perm/Wash™ buffer. For the detection of Bax or p53 proteins, the fixed and permeabilized cells were incubated with 100 µL of Perm/Wash™ buffer containing corresponding antibodies. Briefly, the indirect antibodies staining was conducted by incubating the cells with mouse anti-human monoclonal antibody (p53, Bax) (Santa Cruz, TX, USA) at 4 °C in the dark for 30 min. After the washing procedure, the cells were further incubated with fluorescein isothiocyanate (FITC)-conjugated goat anti-mouse IgG1 (Santa Cruz, USA) at 4 °C in the dark for 30 min. Finally, the cells were then washed with Perm/Wash™ buffer before being subjected to 10,000 events acquisition and analysis by using FACSVerseTM flow cytometer (BD Bioscience). FITC-conjugated normal mouse IgG1 (Santa Cruz, USA) was used as the isotype control to differentiate non-specific background signal.

4.18. Chemical Profiling of MUM256 EA Using GC-MS

Gas chromatography-mass spectrometry (GC-MS) analysis was performed to profile the constituents present in MUM256 EA [92]. The analysis was conducted using Agilent technologies 6980N (GC) equipped with 5979 Mass Selective Detector (MS), HP-5MS (5% phenyl methyl siloxane) capillary column of dimensions 30.0 m × 250 µm × 0.25 µm and helium was used as the carrier gas at 1 mL/ min. For the initial 10 min, the column was operated at 40 ºC, followed by an increase of 3 °C/min to 250 °C and was kept isothermal for 5 min. The MS was operating at 70 eV. Identification was performed by comparing the mass spectral data of the detected constituents in MUM256 EA with those available in the database NIST 05 Spectral library.

4.19. Statistical Analysis

All the experiments were performed at least in triplicate. The results were expressed as mean ± standard deviation (SD) and analysed using SPSS statistical analysis software. One-way analysis of variance (ANOVA) and Student′s t-test were performed to determine if there was a significant difference between the treated and untreated groups. A difference was considered statistically significant when p ≤ 0.05.

5. Conclusions

In summary, these findings show that MUM256 EA has an inhibitory effect on the proliferating and colony-forming abilities of HCT116 cells. Our work demonstrates that MUM256 EA induced G1 and G2/M cell-cycle arrest in HCT116 cells possibly linked to upregulation of p21 and p53 and downregulation of cyclin B1, CDK2, CDK4 and cdc25A phosphatase. Morphological changes observed suggest the occurrence of apoptosis in HCT116 cells upon treatment with MUM256 EA. The results demonstrated that MUM256 EA induced apoptosis in HCT116 cells mediated through intrinsic pathway with activation of p53, Bax, caspases-9 and -3/7. GC-MS analysis of MUM256 EA detected the presence of cyclic dipeptides which were demonstrated to have various pharmacological properties from previous literature suggesting that these compounds may have contributed to the cytotoxic properties of MUM256 EA. Furthermore, the proline-based cyclic dipeptides detected in MUM256 EA inhibited the growth HCT116 cells while showing little to no toxicity towards CCD-18Co normal colon cells. Taken together, these findings highlight the important role of exploring the microorganisms from the mangrove as a bioresource, especially for proline-based cyclic dipeptides. Further characterization of the lead compounds in this fraction may yield bioactive agents which hold tremendous promise for the development of chemopreventive drugs, and in vivo investigation of MUM256 EA is underway.

Supplementary Materials

The following are available online at https://www.mdpi.com/2072-6694/11/11/1742/s1: Figure S1: The Western blot of protein of interest (p21 and cyclin B) and respective β-actin expressions, Figure S2: Cytotoxic effects of the two main compounds (3) and (6) on HT-29 colon cancer cells.

Author Contributions

The writing was performed by L.T.-H.T., P.P., L.-H.L. and B.-H.G. While C.-K.C., T.M.K., K.-G.C., H.-L.S., L.-H.L. and B.-H.G. provided technical support, vital guidance and insight to the work. The project was conceptualized by L.T.-H.-L. and B.-H.G.

Funding

This research is financially supported by the MOSTI eScience Fund (02-02-10-SF0215), University grants from the University of Malaya (FRGS grant no. FP022-2018A), External Industry Grants from Biotek Abadi Sdn Bhd (vote no. GBA-81811A), Monash Global Asia in the 21st Century (GA21) research grant (GA-HW-19-L01 & GA-HW-19-S01) and Fundamental Research Grant Scheme (FRGS/1/2019/WAB09/MUSM/02/1 & FRGS/1/2019/SKK08/MUSM/02/7).

Acknowledgments

This work was inspired by Monash PhD Research Training Module entitled “Bioprospective of Microbes with Biopharmaceutical Potential with Bioinformatics and Drug Discovery Platforms”. We would like to thank Prof. Chow Sek Chuen (from School of Science, Monash University Malaysia) for providing us with the caspase inhibitors z-VAD-fmk and z-DEVD-fmk.

Conflicts of Interest

The authors declare no conflict of interest.

References

  1. Ferlay, J.; Soerjomataram, I.; Dikshit, R.; Eser, S.; Mathers, C.; Rebelo, M.; Parkin, D.M.; Forman, D.; Bray, F. Cancer incidence and mortality worldwide: Sources, methods and major patterns in GLOBOCAN 2012. Int. J. Cancer 2015, 136, E359–E386. [Google Scholar] [CrossRef] [PubMed]
  2. Arnold, M.; Sierra, M.S.; Laversanne, M.; Soerjomataram, I.; Jemal, A.; Bray, F. Global patterns and trends in colorectal cancer incidence and mortality. Gut 2017, 66, 683–691. [Google Scholar] [CrossRef] [PubMed]
  3. Lee, M.-T.G.; Chiu, C.-C.; Wang, C.-C.; Chang, C.-N.; Lee, S.-H.; Lee, M.; Hsu, T.-C.; Lee, C.-C. Trends and Outcomes of Surgical Treatment for Colorectal Cancer between 2004 and 2012-an Analysis using National Inpatient Database. Sci. Rep. 2017, 7, 2006. [Google Scholar] [CrossRef] [PubMed]
  4. Chatterjee, K.; Zhang, J.; Honbo, N.; Karliner, J.S. Doxorubicin cardiomyopathy. Cardiology 2010, 115, 155–162. [Google Scholar] [CrossRef] [PubMed]
  5. Steele, T.A. Chemotherapy-induced immunosuppression and reconstitution of immune function. Leuk. Res. 2002, 26, 411–414. [Google Scholar] [CrossRef]
  6. Jin, J.; Wu, X.; Yin, J.; Li, M.; Shen, J.; Li, J.; Zhao, Y.; Zhao, Q.; Wu, J.; Wen, Q. Identification of genetic mutations in cancer: Challenge and opportunity in the new era of targeted therapy. Front. Oncol. 2019, 9, 263. [Google Scholar] [CrossRef] [PubMed]
  7. Khoo, X.-H.; Paterson, I.C.; Goh, B.-H.; Lee, W.-L. Cisplatin-Resistance in Oral Squamous Cell Carcinoma: Regulation by Tumor Cell-Derived Extracellular Vesicles. Cancers 2019, 11, 1166. [Google Scholar] [CrossRef] [PubMed]
  8. Eng, S.-K.; Loh, T.H.T.; Goh, B.-H.; Lee, W.-L. KRAS as Potential Target in Colorectal Cancer Therapy. In Natural Bio-active Compounds; Springer: New York, NY, USA, 2019; pp. 389–424. [Google Scholar]
  9. Chan, C.K.; Tang, L.Y.; Goh, B.H.; Kadir, H.A. Targeting apoptosis via inactivation of PI3K/Akt/mTOR signaling pathway involving NF-κB by geraniin in HT-29 human colorectal adenocarcinoma cells. Prog. Drug Discov. Biomed. Sci. 2019, 2, a0000030. [Google Scholar]
  10. Pan, P.; Skaer, C.; Yu, J.; Zhao, H.; Ren, H.; Oshima, K.; Wang, L.S. Berries and other natural products in the pancreatic cancer chemoprevention in human clinical trials. J. Berry Res. 2017, 7, 147–161. [Google Scholar] [CrossRef]
  11. Kotecha, R.; Takami, A.; Espinoza, J.L. Dietary phytochemicals and cancer chemoprevention: A review of the clinical evidence. Oncotarget 2016, 7, 52517–52529. [Google Scholar] [CrossRef]
  12. Tan, L.T.H.; Low, L.E.; Tang, S.Y.; Yap, W.H.; Chuah, L.H.; Chan, C.K.; Lee, L.H.; Goh, B.H. A reliable and affordable 3D tumor spheroid model for natural product drug discovery: A case study of curcumin. Prog. Drug Discov. Biom. Sci. 2019, 2, a0000017. [Google Scholar]
  13. Tan, L.T.-H.; Chan, K.-G.; Pusparajah, P.; Lee, W.-L.; Chuah, L.-H.; Khan, T.M.; Lee, L.-H.; Goh, B.-H. Targeting membrane lipid a potential cancer cure? Front. Pharmacol. 2017, 8, 12. [Google Scholar] [CrossRef] [PubMed]
  14. Low, L.E.; Tan, L.T.-H.; Goh, B.-H.; Tey, B.T.; Ong, B.H.; Tang, S.Y. Magnetic cellulose nanocrystal stabilized Pickering emulsions for enhanced bioactive release and human colon cancer therapy. Int. J. Biol. Macromol. 2019, 127, 76–84. [Google Scholar] [CrossRef] [PubMed]
  15. Tan, L.T.H.; Lee, L.H.; Yin, W.F.; Chan, C.K.; Abdul Kadir, H.; Chan, K.G.; Goh, B.H. Traditional Uses, Phytochemistry, and Bioactivities of Cananga odorata (Ylang-Ylang). Evid. Based Complement. Alternat. Med. 2015, 2015, 896314. [Google Scholar] [CrossRef] [PubMed]
  16. Tang, C.; Hoo, P.C.; Tan, L.T.; Pusparajah, P.; Khan, T.M.; Lee, L.H.; Goh, B.H.; Chan, K.G. Golden Needle Mushroom: A Culinary Medicine with Evidenced-Based Biological Activities and Health Promoting Properties. Front. Pharmacol. 2016, 7, 474. [Google Scholar] [CrossRef]
  17. Tan, H.-L.; Chan, K.-G.; Pusparajah, P.; Lee, L.-H.; Goh, B.-H. Gynura procumbens: An overview of the biological activities. Front. Pharmacol. 2016, 7, 52. [Google Scholar] [CrossRef]
  18. Goh, J.X.H.; Tan, L.T.-H.; Goh, J.K.; Chan, K.G.; Pusparajah, P.; Lee, L.-H.; Goh, B.-H. Nobiletin and derivatives: Functional compounds from citrus fruit peel for colon cancer chemoprevention. Cancers 2019, 11, 867. [Google Scholar] [CrossRef]
  19. Tay, K.-C.; Tan, L.T.-H.; Chan, C.K.; Hong, S.L.; Chan, K.-G.; Yap, W.H.; Pusparajah, P.; Lee, L.-H.; Goh, B.-H. Formononetin: A review of its anticancer potentials and mechanisms. Front. Pharmacol. 2019, 10, 820. [Google Scholar] [CrossRef]
  20. Zhang, J.-Y.; Tao, L.-Y.; Liang, Y.-J.; Yan, Y.-Y.; Dai, C.-L.; Xia, X.-K.; She, Z.-G.; Lin, Y.-C.; Fu, L.-W. Secalonic acid D induced leukemia cell apoptosis and cell cycle arrest of G1 with involvement of GSK-3β/β-catenin/c-Myc pathway. Cell Cycle 2009, 8, 2444–2450. [Google Scholar] [CrossRef]
  21. Lee, L.-H.; Chan, K.-G.; Stach, J.; Wellington, E.M.; Goh, B.-H. The search for biological active agent (s) from actinobacteria. Front. Microbiol. 2018, 9, 824. [Google Scholar] [CrossRef]
  22. Azman, A.-S.; Othman, I.; Fang, C.-M.; Chan, K.-G.; Goh, B.-H.; Lee, L.-H. Antibacterial, anticancer and neuroprotective activities of rare Actinobacteria from mangrove forest soils. Indian J. Microbiol. 2017, 57, 177–187. [Google Scholar] [CrossRef] [PubMed]
  23. Lee, L.-H.; Azman, A.-S.; Zainal, N.; Eng, S.-K.; Ab Mutalib, N.-S.; Yin, W.-F.; Chan, K.-G. Microbacterium mangrovi sp. nov., an amylolytic actinobacterium isolated from mangrove forest soil. Int. J. Syst. Evol. Microbiol. 2014, 64, 3513–3519. [Google Scholar] [CrossRef] [PubMed]
  24. Pugh, L.H.; Katz, E.; Waksman, S.A. Antibiotic and cytostatic properties of the actinomycins. J. Bacteriol. 1956, 72, 660. [Google Scholar]
  25. Katz, L.; Baltz, R.H. Natural product discovery: Past, present, and future. J. Ind. Microbiol. Biotechnol. 2016, 43, 155–176. [Google Scholar] [CrossRef] [PubMed]
  26. Ser, H.L.; Tan, L.T.; Law, J.W.; Chan, K.G.; Duangjai, A.; Saokaew, S.; Pusparajah, P.; Ab Mutalib, N.S.; Khan, T.M.; Goh, B.H.; et al. Focused Review: Cytotoxic and Antioxidant Potentials of Mangrove-Derived Streptomyces. Front. Microbiol. 2017, 8, 2065. [Google Scholar] [CrossRef] [PubMed]
  27. Law, J.W.; Ser, H.L.; Duangjai, A.; Saokaew, S.; Bukhari, S.I.; Khan, T.M.; Ab Mutalib, N.S.; Chan, K.G.; Goh, B.H.; Lee, L.H. Streptomyces colonosanans sp. nov., A Novel Actinobacterium Isolated from Malaysia Mangrove Soil Exhibiting Antioxidative Activity and Cytotoxic Potential against Human Colon Cancer Cell Lines. Front. Microbiol. 2017, 8, 877. [Google Scholar] [CrossRef]
  28. Ser, H.-L.; Palanisamy, U.D.; Yin, W.-F.; Chan, K.-G.; Goh, B.-H.; Lee, L.-H. Streptomyces malaysiense sp. nov.: A novel Malaysian mangrove soil actinobacterium with antioxidative activity and cytotoxic potential against human cancer cell lines. Sci. Rep. 2016, 6, 24247. [Google Scholar] [CrossRef] [Green Version]
  29. Tan, L.T.-H.; Chan, K.-G.; Pusparajah, P.; Yin, W.-F.; Khan, T.M.; Lee, L.-H.; Goh, B.-H. Mangrove derived Streptomyces sp. MUM265 as a potential source of antioxidant and anticolon-cancer agents. BMC Microbiol. 2019, 19, 38. [Google Scholar] [CrossRef]
  30. Tan, L.T.H.; Ser, H.L.; Yin, W.F.; Chan, K.G.; Lee, L.H.; Goh, B.H. Investigation of Antioxidative and Anticancer Potentials of Streptomyces sp. MUM256 Isolated from Malaysia Mangrove Soil. Front. Microbiol. 2015, 6, 1316. [Google Scholar] [CrossRef]
  31. Munshi, A.; Hobbs, M.; Meyn, R.E. Clonogenic cell survival assay. In Chemosensitivity; Springer: New York, NY, USA, 2005; pp. 21–28. [Google Scholar]
  32. Wlodkowic, D.; Skommer, J.; Darzynkiewicz, Z. Cytometry of apoptosis. Historical perspective and new advances. Exp. Oncol. 2012, 34, 255–262. [Google Scholar]
  33. Taylor, W.R.; Stark, G.R. Regulation of the G2/M transition by p53. Oncogene 2001, 20, 1803–1815. [Google Scholar] [CrossRef] [PubMed] [Green Version]
  34. Zhang, X.; Song, X.; Yin, S.; Zhao, C.; Fan, L.; Hu, H. p21 induction plays a dual role in anti-cancer activity of ursolic acid. Exp. Biol. Med. (Maywood) 2016, 241, 501–508. [Google Scholar] [CrossRef] [PubMed]
  35. Waldman, T.; Kinzler, K.W.; Vogelstein, B. p21 is necessary for the p53-mediated G1 arrest in human cancer cells. Cancer Res. 1995, 55, 5187–5190. [Google Scholar] [PubMed]
  36. Wyllie, A.H. Glucocorticoid-induced thymocyte apoptosis is associated with endogenous endonuclease activation. Nature 1980, 284, 555–556. [Google Scholar] [CrossRef] [PubMed]
  37. Henry, C.M.; Hollville, E.; Martin, S.J. Measuring apoptosis by microscopy and flow cytometry. Methods 2013, 61, 90–97. [Google Scholar] [CrossRef] [PubMed]
  38. Riccardi, C.; Nicoletti, I. Analysis of apoptosis by propidium iodide staining and flow cytometry. Nat. Protoc. 2006, 1, 1458–1461. [Google Scholar] [CrossRef] [PubMed]
  39. Darzynkiewicz, Z.; Bedner, E. Analysis of apoptotic cells by flow and laser scanning cytometry. Methods Enzymol. 1999, 322, 18–39. [Google Scholar]
  40. Green, D.; Kroemer, G. The central executioners of apoptosis: Caspases or mitochondria? Trends Cell Biol. 1998, 8, 267–271. [Google Scholar] [CrossRef]
  41. Elleuch, L.; Shaaban, M.; Smaoui, S.; Mellouli, L.; Karray-Rebai, I.; Fourati-Ben Fguira, L.; Shaaban, K.A.; Laatsch, H. Bioactive secondary metabolites from a new terrestrial Streptomyces sp. TN262. Appl. Biochem. Biotechnol. 2010, 162, 579–593. [Google Scholar] [CrossRef]
  42. Kavitha, A.; Savithri, H.S. Biological Significance of Marine Actinobacteria of East Coast of Andhra Pradesh, India. Front. Microbiol. 2017, 8, 1201. [Google Scholar] [CrossRef] [Green Version]
  43. Zothanpuia, A.K.P.; Chandra, P.; Leo, V.V.; Mishra, V.K.; Kumar, B.; Singh, B.P. Production of Potent Antimicrobial Compounds from Streptomyces cyaneofuscatus Associated with Fresh Water Sediment. Front. Microbiol. 2017, 8, 68. [Google Scholar] [CrossRef] [PubMed] [Green Version]
  44. Tan, L.T.-H.; Chan, K.-G.; Lee, L.-H.; Goh, B.-H. Streptomyces bacteria as potential probiotics in aquaculture. Front. Microbiol. 2016, 7, 79. [Google Scholar] [CrossRef] [PubMed]
  45. Tan, L.T.H.; Mahendra, C.K.; Yow, Y.Y.; Chan, K.G.; Khan, T.M.; Lee, L.H.; Goh, B.H. Streptomyces sp. MUM273b: A mangrove-derived potential source for antioxidant and UVB radiation protectants. MicrobiologyOpen 2019, 8, e859. [Google Scholar] [CrossRef] [PubMed]
  46. Ser, H.-L.; Ab Mutalib, N.-S.; Yin, W.-F.; Goh, B.-H.; Lee, L.-H.; Chan, K.-G. Genome sequence of Streptomyces antioxidans MUSC 164T isolated from mangrove forest. Prog. Microbes Mol. Biol. 2018, 1, a0000001. [Google Scholar]
  47. Lee, L.-H.; Zainal, N.; Azman, A.-S.; Ab Mutalib, N.-S.; Hong, K.; Chan, K.-G. Mumia flava gen. nov., sp. nov., an actinobacterium of the family Nocardioidaceae. Int. J. Syst. Evol. Microbiol. 2014, 64, 1461–1467. [Google Scholar] [CrossRef]
  48. Lee, L.-H.; Cheah, Y.-K.; Sidik, S.M.; Xie, Q.-Y.; Tang, Y.-L.; Lin, H.-P.; Ab Mutalib, N.-S.; Hong, K. Barrientosiimonas humi gen. nov., sp. nov., an actinobacterium of the family Dermacoccaceae. Int. J. Syst. Evol. Microbiol. 2013, 63, 241–248. [Google Scholar] [CrossRef]
  49. Hong, K.; Gao, A.H.; Xie, Q.Y.; Gao, H.; Zhuang, L.; Lin, H.P.; Yu, H.P.; Li, J.; Yao, X.S.; Goodfellow, M.; et al. Actinomycetes for marine drug discovery isolated from mangrove soils and plants in China. Mar. Drugs 2009, 7, 24–44. [Google Scholar] [CrossRef]
  50. Twentyman, P.R.; Luscombe, M. A study of some variables in a tetrazolium dye (MTT) based assay for cell growth and chemosensitivity. Br. J. Cancer 1987, 56, 279. [Google Scholar] [CrossRef]
  51. Kerr, J.F.; Wyllie, A.H.; Currie, A.R. Apoptosis: A basic biological phenomenon with wideranging implications in tissue kinetics. Br. J. Cancer 1972, 26, 239. [Google Scholar] [CrossRef]
  52. Gerschenson, L.E.; Rotello, R.J. Apoptosis: A different type of cell death. FASEB J. 1992, 6, 2450–2455. [Google Scholar] [CrossRef]
  53. Reddy, L.; Odhav, B.; Bhoola, K.D. Natural products for cancer prevention: A global perspective. Pharmacol. Ther. 2003, 99, 1–13. [Google Scholar] [CrossRef]
  54. Grana, X.; Reddy, E.P. Cell cycle control in mammalian cells: Role of cyclins, cyclin dependent kinases (CDKs), growth suppressor genes and cyclin-dependent kinase inhibitors (CKIs). Oncogene 1995, 11, 211–219. [Google Scholar] [PubMed]
  55. Malumbres, M.; Barbacid, M. Cell cycle, CDKs and cancer: A changing paradigm. Nat. Rev. Cancer 2009, 9, 153–166. [Google Scholar] [CrossRef] [PubMed]
  56. Karimian, A.; Ahmadi, Y.; Yousefi, B. Multiple functions of p21 in cell cycle, apoptosis and transcriptional regulation after DNA damage. DNA Repair (Amst) 2016, 42, 63–71. [Google Scholar] [CrossRef] [PubMed]
  57. Malumbres, M. Cyclin-dependent kinases. Genome Biol. 2014, 15, 122. [Google Scholar] [CrossRef]
  58. Chohan, T.A.; Qian, H.; Pan, Y.; Chen, J.-Z. Cyclin-dependent kinase-2 as a target for cancer therapy: Progress in the development of CDK2 inhibitors as anti-cancer agents. Curr. Med. Chem. 2015, 22, 237–263. [Google Scholar] [CrossRef]
  59. Busino, L.; Chiesa, M.; Draetta, G.F.; Donzelli, M. Cdc25A phosphatase: Combinatorial phosphorylation, ubiquitylation and proteolysis. Oncogene 2004, 23, 2050–2056. [Google Scholar] [CrossRef]
  60. Chen, M.-S.; Ryan, C.E.; Piwnica-Worms, H. Chk1 kinase negatively regulates mitotic function of Cdc25A phosphatase through 14-3-3 binding. Mol. Cell. Biol. 2003, 23, 7488–7497. [Google Scholar] [CrossRef]
  61. Mailand, N.; Podtelejnikov, A.V.; Groth, A.; Mann, M.; Bartek, J.; Lukas, J. Regulation of G2/M events by Cdc25A through phosphorylation-dependent modulation of its stability. EMBO J. 2002, 21, 5911–5920. [Google Scholar] [CrossRef]
  62. Gillis, L.D.; Leidal, A.M.; Hill, R.; Lee, P.W. p21Cip1/WAF1 mediates cyclin B1 degradation in response to DNA damage. Cell Cycle 2009, 8, 253–256. [Google Scholar] [CrossRef]
  63. Fesik, S.W. Promoting apoptosis as a strategy for cancer drug discovery. Nat. Rev. Cancer 2005, 5, 876. [Google Scholar] [CrossRef] [PubMed]
  64. Kirkin, V.; Joos, S.; Zornig, M. The role of Bcl-2 family members in tumorigenesis. Biochim. Biophys. Acta 2004, 1644, 229–249. [Google Scholar] [CrossRef] [PubMed]
  65. Er, E.; Oliver, L.; Cartron, P.-F.; Juin, P.; Manon, S.; Vallette, F.M. Mitochondria as the target of the pro-apoptotic protein Bax. Biochim. Biophys. Acta (BBA)-Bioenerg. 2006, 1757, 1301–1311. [Google Scholar] [CrossRef] [PubMed] [Green Version]
  66. Kroemer, G.; Reed, J.C. Mitochondrial control of cell death. Nat. Med. 2000, 6, 513–519. [Google Scholar] [CrossRef] [PubMed]
  67. Lin, M.; Tang, S.; Zhang, C.; Chen, H.; Huang, W.; Liu, Y.; Zhang, J. Euphorbia factor L2 induces apoptosis in A549 cells through the mitochondrial pathway. Acta Pharm. Sin. B 2017, 7, 59–64. [Google Scholar] [CrossRef] [PubMed]
  68. Johnson, D.G.; Walker, C.L. Cyclins and cell cycle checkpoints. Annu. Rev. Pharmacol. Toxicol. 1999, 39, 295–312. [Google Scholar] [CrossRef] [PubMed]
  69. Rhee, K.H. Isolation and characterization of Streptomyces sp KH-614 producing anti-VRE (vancomycin-resistant enterococci) antibiotics. J. Gen. Appl. Microbiol. 2002, 48, 321–327. [Google Scholar] [CrossRef] [PubMed]
  70. Macherla, V.R.; Liu, J.; Bellows, C.; Teisan, S.; Nicholson, B.; Lam, K.S.; Potts, B.C. Glaciapyrroles A, B, and C, pyrrolosesquiterpenes from a Streptomyces sp. isolated from an Alaskan marine sediment. J. Nat. Prod. 2005, 68, 780–783. [Google Scholar] [CrossRef]
  71. Prasad, C. Bioactive cyclic dipeptides. Peptides 1995, 16, 151–164. [Google Scholar] [CrossRef]
  72. Vazquez-Rivera, D.; Gonzalez, O.; Guzman-Rodriguez, J.; Diaz-Perez, A.L.; Ochoa-Zarzosa, A.; Lopez-Bucio, J.; Meza-Carmen, V.; Campos-Garcia, J. Cytotoxicity of cyclodipeptides from Pseudomonas aeruginosa PAO1 leads to apoptosis in human cancer cell lines. BioMed Res. Int. 2015, 2015, 197608. [Google Scholar] [CrossRef]
  73. Ser, H.-L.; Yin, W.-F.; Chan, K.-G.; Khan, T.M.; Goh, B.-H.; Lee, L.-H. Antioxidant and cytotoxic potentials of Streptomyces gilvigriseus MUSC 26T isolated from mangrove soil in Malaysia. Prog. Microbes Mol. Biol. 2018, 1, a0000002. [Google Scholar]
  74. Würth, R.; Barbieri, F.; Florio, T. New molecules and old drugs as emerging approaches to selectively target human glioblastoma cancer stem cells. BioMed Res. Int. 2014, 2014, 126586. [Google Scholar] [CrossRef] [PubMed]
  75. Ser, H.-L.; Palanisamy, U.D.; Yin, W.-F.; Malek, A.; Nurestri, S.; Chan, K.-G.; Goh, B.-H.; Lee, L.-H. Presence of antioxidative agent, Pyrrolo [1, 2-a] pyrazine-1, 4-dione, hexahydro-in newly isolated Streptomyces mangrovisoli sp. nov. Front. Microbiol. 2015, 6, 854. [Google Scholar] [CrossRef] [PubMed]
  76. Law, J.W.-F.; Ser, H.-L.; Ab Mutalib, N.-S.; Saokaew, S.; Duangjai, A.; Khan, T.M.; Chan, K.-G.; Goh, B.-H.; Lee, L.-H. Streptomyces monashensis sp. nov., a novel mangrove soil actinobacterium from East Malaysia with antioxidative potential. Sci. Rep. 2019, 9, 3056. [Google Scholar] [CrossRef]
  77. Tan, L.T.-H.; Chan, K.-G.; Chan, C.K.; Khan, T.M.; Lee, L.-H.; Goh, B.-H. Antioxidative potential of a Streptomyces sp. MUM292 isolated from mangrove soil. BioMed Res. Int. 2018, 2018, 4823126. [Google Scholar] [CrossRef]
  78. Tan, L.T.-H.; Chan, K.-G.; Khan, T.M.; Bukhari, S.I.; Saokaew, S.; Duangjai, A.; Pusparajah, P.; Lee, L.-H.; Goh, B.-H. Streptomyces sp. MUM212 as a source of antioxidants with radical scavenging and metal chelating properties. Front. Pharmacol. 2017, 8, 276. [Google Scholar] [CrossRef]
  79. Brauns, S.C.; Dealtry, G.; Milne, P.; Naude, R.; Van de Venter, M. Caspase-3 activation and induction of PARP cleavage by cyclic dipeptide cyclo(Phe-Pro) in HT-29 cells. Anticancer Res. 2005, 25, 4197–4202. [Google Scholar]
  80. Brauns, S.C.; Milne, P.; Naude, R.; Van de Venter, M. Selected cyclic dipeptides inhibit cancer cell growth and induce apoptosis in HT-29 colon cancer cells. Anticancer Res. 2004, 24, 1713–1719. [Google Scholar]
  81. Rhee, K.-H. Inhibition of DNA topoisomerase I by cyclo (L-prolyl-L-phenylalanyl) isolated from Streptomyces sp. AMLK-335. J. Microbiol. Biotechnol. 2002, 12, 1013–1016. [Google Scholar]
  82. Thompson, J.D.; Gibson, T.J.; Higgins, D.G. Multiple sequence alignment using ClustalW and ClustalX. Curr. Protoc. Bioinform. 2003, 1, 2–3. [Google Scholar] [CrossRef]
  83. Kumar, S.; Tamura, K.; Nei, M. MEGA: Molecular evolutionary genetics analysis software for microcomputers. Bioinformatics 1994, 10, 189–191. [Google Scholar] [CrossRef] [PubMed]
  84. Felsenstein, J. Confidence limits on phylogenies: An approach using the bootstrap. Evolution 1985, 39, 783–791. [Google Scholar] [CrossRef] [PubMed]
  85. Yoon, S.-H.; Ha, S.-M.; Kwon, S.; Lim, J.; Kim, Y.; Seo, H.; Chun, J. Introducing EzBioCloud: A taxonomically united database of 16S rRNA gene sequences and whole-genome assemblies. Int. J. Syst. Evol. Microbiol. 2017, 67, 1613. [Google Scholar] [PubMed]
  86. Lee, L.H.; Cheah, Y.K.; Mohd Sidik, S.; Ab Mutalib, N.S.; Tang, Y.L.; Lin, H.P.; Hong, K. Molecular characterization of Antarctic actinobacteria and screening for antimicrobial metabolite production. World J. Microbiol. Biotechnol. 2012, 28, 2125–2137. [Google Scholar] [CrossRef] [PubMed]
  87. Chan, C.K.; Tan, L.T.; Andy, S.N.; Kamarudin, M.N.A.; Goh, B.H.; Kadir, H.A. Anti-neuroinflammatory Activity of Elephantopus scaber L. via Activation of Nrf2/HO-1 Signaling and Inhibition of p38 MAPK Pathway in LPS-Induced Microglia BV-2 Cells. Front. Pharmacol. 2017, 8, 397. [Google Scholar] [CrossRef] [PubMed]
  88. Tessmann, J.W.; Buss, J.; Begnini, K.R.; Berneira, L.M.; Paula, F.R.; de Pereira, C.M.P.; Collares, T.; Seixas, F.K. Antitumor potential of 1-thiocarbamoyl-3,5-diaryl-4,5-dihydro-1H-pyrazoles in human bladder cancer cells. Biomed. Pharmacother. 2017, 94, 37–46. [Google Scholar] [CrossRef]
  89. Guzman, C.; Bagga, M.; Kaur, A.; Westermarck, J.; Abankwa, D. ColonyArea: An ImageJ plugin to automatically quantify colony formation in clonogenic assays. PLoS ONE 2014, 9, e92444. [Google Scholar] [CrossRef]
  90. Goh, B.H.; Kadir, H.A. In vitro cytotoxic potential of Swietenia macrophylla King seeds against human carcinoma cell lines. J. Med. Plants Res. 2011, 5, 1395–1404. [Google Scholar]
  91. Goh, B.H.; Chan, C.K.; Kamarudin, M.N.A.; Abdul Kadir, H. Swietenia macrophylla King induces mitochondrial-mediated apoptosis through p53 upregulation in HCT116 colorectal carcinoma cells. J. Ethnopharmacol. 2014, 153, 375–385. [Google Scholar] [CrossRef]
  92. Supriady, H.; Kamarudin, M.N.A.; Chan, C.K.; Goh, B.H.; Kadir, H.A. SMEAF attenuates the production of pro-inflammatory mediators through the inactivation of Akt-dependent NF-κB, p38 and ERK1/2 pathways in LPS-stimulated BV-2 microglial cells. J. Funct. Foods 2015, 17, 434–448. [Google Scholar] [CrossRef]
Figure 1. The summarized flow chart of this study. The figure illustrates the fermentation, crude extract extraction, fractionation and elucidated mechanisms of MUM256 EA in cell-cycle arrest and apoptosis induction.
Cancers 11 01742 g001
Figure 2. Neighbour-joining phylogenetic tree based on 16S rRNA gene sequence of strain MUM256 (1343bp). The tree illustrates the relationship between strain MUM256 and closely related strains. Numbers at nodes indicate percentages of 1000 bootstrap re-samplings. Bar, 0.001 substitutions per site.
Cancers 11 01742 g002
Figure 3. Cytotoxic and antiproliferative properties of MUM256 EA against HCT116 cells. (a) Cytotoxic effect of MUM256 crude extract (MeOH: methanol) and 3 different fractions (H2O: water; Hex: hexane; EtOAc: ethyl acetate) against HCT116 cells at a series of concentrations after 72 h treatment, (n = 4, * p < 0.05). (b) The toxicity of MUM256 EA towards CCD-18Co as compared to its cytotoxicity against HCT116 after 72 h exposure, (n = 4, * p < 0.05). (c) Cytotoxic effect of MUM256 EA at a series of concentrations against HCT116 cells after 24, 48 and 72 h of exposure, (n = 4, * p < 0.05). (d) Line graph shows the inhibitory effect of MUM256 EA fraction on HCT116 cells. Bar graph illustrates the relative percentage of number of viable cells after exposure to MUM256 EA fraction after normalized to 100% for number of viable cells exposed to vehicle control (0.5% dimethyl sulfoxide (DMSO)) (n = 3), * p < 0.05 indicates significant difference between the untreated and the treated cells. (e) Images of colony formation after 7 days of control and MUM256 EA pre-treated cells in 6 well-plate. Crystal violet staining was used for visualization and quantification of colonies. The area of colonies formed are shown as bar graph with the mean relative mean colony area to control ± standard deviation (SD) (n = 3, * p < 0.05).
Cancers 11 01742 g003
Figure 4. Morphological changes of HCT116 cells after exposure to MUM256 EA treatment. (a) Phase contrast microscopic evaluation of HCT116 cells under ×10 magnification. Decreased number of HCT116 cells were observed across the 3 timepoints with increasing concentration of MUM256 EA treatment. Furthermore, arrows indicate the rounded cells due to cytoplasmic shrinkage and detached cells which was increased in number with increasing concentration of MUM256 EA treatment. (b) Representative forward scatter/side scatter (FSC/SSC) dot plot of HCT116 cells after exposure to MUM256 EA at different concentrations. The x-axis shows a decreasing FSC in HCT116 cells treated with increasing concentrations of MUM256 EA. The FSC represents the diffracted light and it is related to cell size. The y-axis shows an increasing SSC in HCT116 treated with increasing concentrations of MUM256 EA. The SSC represent the reflected and refracted light and is related to cell granularity and complexity. The bar graphs show the relative median FSC and SSC fluorescence signals of treated cell population as compared to control ± SD (n = 3, * p < 0.05).
Cancers 11 01742 g004
Figure 5. Cell-cycle arrest at G1 and G2 phase induced by MUM256 EA through modulation of cell cycle regulatory proteins. (a) Effect of MUM256 EA on cell cycle distribution. HCT116 cells were treated with 200 μg/mL of MUM256 EA for indicated durations (24, 48 and 72 h). Cells were harvested and fixed with ice-cold 70% ethanol overnight. Before flow cytometric analysis, the cells were incubated in phosphate-buffered saline (PBS) containing 25 μg/mL PI, 0.1% Triton-X-100 and 100 μg/mL RNase A for 30 min in the dark at room temperature. The cellular DNA content was determined by flow cytometry. Representative of histograms showing X-axis, DNA contents; y-axis, cell population (%). Each bar represents at least three individual experiments, (* p < 0.05). (b) Real-time polymerase chain reaction (PCR) analysis of p21, CDK2, CDK4 and cdc25A expressions in HCT116 cells treated with 200μg/mL MUM256 EA. The fold change of the gene was normalized against 18S rRNA expression using the formula 2−∆∆CT. Bar graph represents the comparison between treatment and control by t-test, * p < 0.05 (n = 3). (c) The levels of p21 and cyclin B1 proteins were determined by Western blotting. HCT116 cells were treated with DMSO and MUM256 EA at 200 μg/mL for indicated durations and the expression of p21 and cyclin B1 were determined by Western blotting with specific antibody. One representative Western blot of three is presented (Figure S1). Each has the expression of β-actin as the internal control. Protein expression was quantified by the densitometry analysis using Image J and normalized against β-actin expression. The values above each band indicate the densitometry ratio of each protein of interest normalized against respective β-actin expression. Bar graph represents the comparison between treatment and control by t-test, * p < 0.05 (n = 3).
Cancers 11 01742 g005
Figure 6. Apoptosis evaluation of MUM256 EA on HCT116 cells. (a) Nuclear morphology of HCT116 stained by Hoechst 33342 dye. Comparison of the nuclear morphological features of untreated and treated HCT116 under fluorescence microscope. Arrow indicates the abnormal nuclear morphological features (nuclear shrinkage or condensation shown by the bright-blue fluorescent and nuclear fragmentation) resulted from the cytotoxic effect of MUM256 EA fraction, indicating sign of apoptosis. (b) Bar graph represents the mean percentage of subG1 population ± S.D. (n = 3, * p < 0.05). (c) The apoptosis-inducing effect of MUM256 EA fraction was examined by flow cytometric analysis using double staining of Annexin V-FITC and PI on HCT116 cells for 24, 48 and 72 h. Quantification of early apoptosis (LR) (Annexin V positive/PI negative) and late apoptosis (UR) (Annexin V positive/PI positive) are shown by the representative four quadrants plot. The bar graph represents the mean percentage of population ± S.D., (n = 3, * p < 0.05). (d) Both the early apoptotic portion and the late apoptotic portion were included as the total apoptotic cells upon treatment for 24, 48 and 72 h. The bar graph represents the mean percentage of apoptotic cells ± S.D, (n = 3, * p < 0.05). (e) Flow cytometry analysis of caspase-3/7 and 9 activities in HCT116 cells using a non-cytotoxic fluorescent labelled inhibitors of caspase-3/7 and 9. HCT116 cells were treated with 200 µg/mL MUM256 EA fraction for various times as indicated, or with DMSO as a control, then stained with FAM-DEVD-FMK or FAM-LEHD-FMK which recognizes and binds to active caspase-3/7 or 9, respectively, before analysed by flow cytometry (BD FacVerse). The bar graph represents the median of fluorescence intensity (MFI) of active caspase-3/7 or 9 straining in treated cells normalized to control ± SD. (n = 3, * p < 0.05).
Cancers 11 01742 g006
Figure 7. Effect of caspase inhibitors on MUM256 EA induced apoptosis in HCT116 cells. (a) Cells were pretreated with either z-VAD-fmk (25 μg/mL) or z-DEVD-fmk (25 μg/mL) for 1 h, then treated as described (Control—0.5% DMSO, with or without—200 μg/mL MUM256 EA) for 24 h. Cell viability was measured by MTT (3-(4,5-dimethylthiazol-2-yl)-2,5-diphenyltetrazolium bromide) assay, (n = 4, * p < 0.05). (b) Morphological changes of HCT116 cells upon indicated treatments were observed by phase-contrast microscopy (magnification ×20). Arrows indicate the treated cells with apoptotic morphology.
Cancers 11 01742 g007
Figure 8. Effect of MUM256 EA on the mitochondrial membrane potential, proapoptotic protein (Bax) and p53 status in HCT116 cells. (a) HCT116 cells were treated with MUM256 EA for indicated durations and then were stained with JC-1 dye to detect the change of MMP by flow cytometry. Dot plots are representative of three independent experiments. Bar graph shows the ratio of JC-1 orange/green normalized to control, decrease in the ratio indicating MMP depolarization upon treatment, * p < 0.05 (n = 3). (b) Real-time PCR analysis of Bax expression in HCT116 cells treated with 200 μg/mL MUM256 EA fraction. The fold change of the gene was normalized against porphobilinogen deaminase (PBGD) expression using the formula 2−∆∆CT. Flow cytometry analysis of Bax protein expression in HCT116 cells using intracellular immunofluorescence staining method. Representative overlay of histograms showing Bax-associated fluorescence intensity after exposure to MUM256 EA fraction at 200 µg/mL for 24, 48 and 72 h. Bar graph represents the relative expression levels of Bax protein in treated HCT116 cells compared to control. Values are mean percentage of cells with expressed Bax ± SD. of three independent experiments. Asterisks indicate a significant difference compared to control (* p < 0.05). (c) Flow cytometry analysis of p53 protein expression in HCT116 cells using intracellular immunofluorescence staining method. Representative overlay of histograms showing p53-associated fluorescence intensity after exposure to MUM256 EA fraction at 200 µg/mL for 24, 48 and 72 h. Relative expression levels of p53 protein in HCT116 cells. Values are median fluorescence intensity ± SD of three independent experiments. Asterisks indicate a significant difference compared to control (* p < 0.05).
Cancers 11 01742 g008
Figure 9. Gas chromatography-mass spectrometry (GC-MS) analysis of MUM256 EA. (a) The GC chromatogram of MUM256 EA. (b) The chemical structures of the detected constituents present in MUM256 EA. The identification of the chemical compounds was performed by comparing their mass spectra to standard mass spectra available in the database of NIST 05 Spectral library.
Cancers 11 01742 g009
Figure 10. Cytotoxic effects of the two main Compounds (3) and (6) on HCT116 and CCD-18Co cells. (a) Cytotoxic effect of pyrrolo [1,2-a] pyrazine-1,4-dione, hexahydro-3-(2-methylpropyl)- (3) and pyrrolo [1,2-a] pyrazine-1,4-dione, hexahydro-3-(phenylmethyl)- (6) against HCT116 cells at a series of concentrations after 72 h treatment, (n = 5, * p < 0.05). (b) The toxicity of pyrrolo [1,2-a] pyrazine-1,4-dione, hexahydro-3-(2-methylpropyl)- (3) and pyrrolo [1,2-a]pyrazine-1,4-dione, hexahydro-3-(phenylmethyl)- (6) towards CCD-18Co after 72 h exposure, (n = 5, * p < 0.05). (c) The combined effect of Compounds (3) and (6) on HCT116 at respective concentrations after 72 h treatment, (n = 5, * p < 0.5).
Cancers 11 01742 g010
Table 1. Chemical constituents detected by GC-MS analysis.
No.ConstituentsRetention Time Molecular FormulaChemical GroupMolecular Weight Similarity (%)
15-Pyrrolidino-2-pyrrolidone54.839C8H14N2OHeterocyclic, pyrrolidine 15493.8
25-Isopropylidene-3,3-dimethyl-dihydrofuran-2-one58.047C9H14O2Heterocyclic, cyclic ether 15498.2
3Pyrrolo[1,2-a]pyrazine-1,4-dione, hexahydro-3-(2-methylpropyl)-58.654C11H18N2O2Cyclic dipeptides21091.6
44(1H)-Pyrimidinone, 6-amino-2-methyl-5-nitroso-58.957C5H6N4O2Heterocyclic, pyridine15495.9
5Pyrrolidine-2-carboxamide, 1-benzyloxycarbonyl-N-(4-tolyl)-70.314C20H22N2O3Heterocyclic, pyrrolidine33896.6
6Pyrrolo[1,2-a]pyrazine-1,4-dione, hexahydro-3-(phenylmethyl)-71.593C14H16N2O2Cyclic dipeptides24499.0

