Caloric and Macronutrient Intake and Meal Timing Responses to Repeated Sleep Restriction Exposures Separated by Varying Intervening Recovery Nights in Healthy Adults


Abstract
:1. Introduction
2. Materials and Methods
2.1. Participants
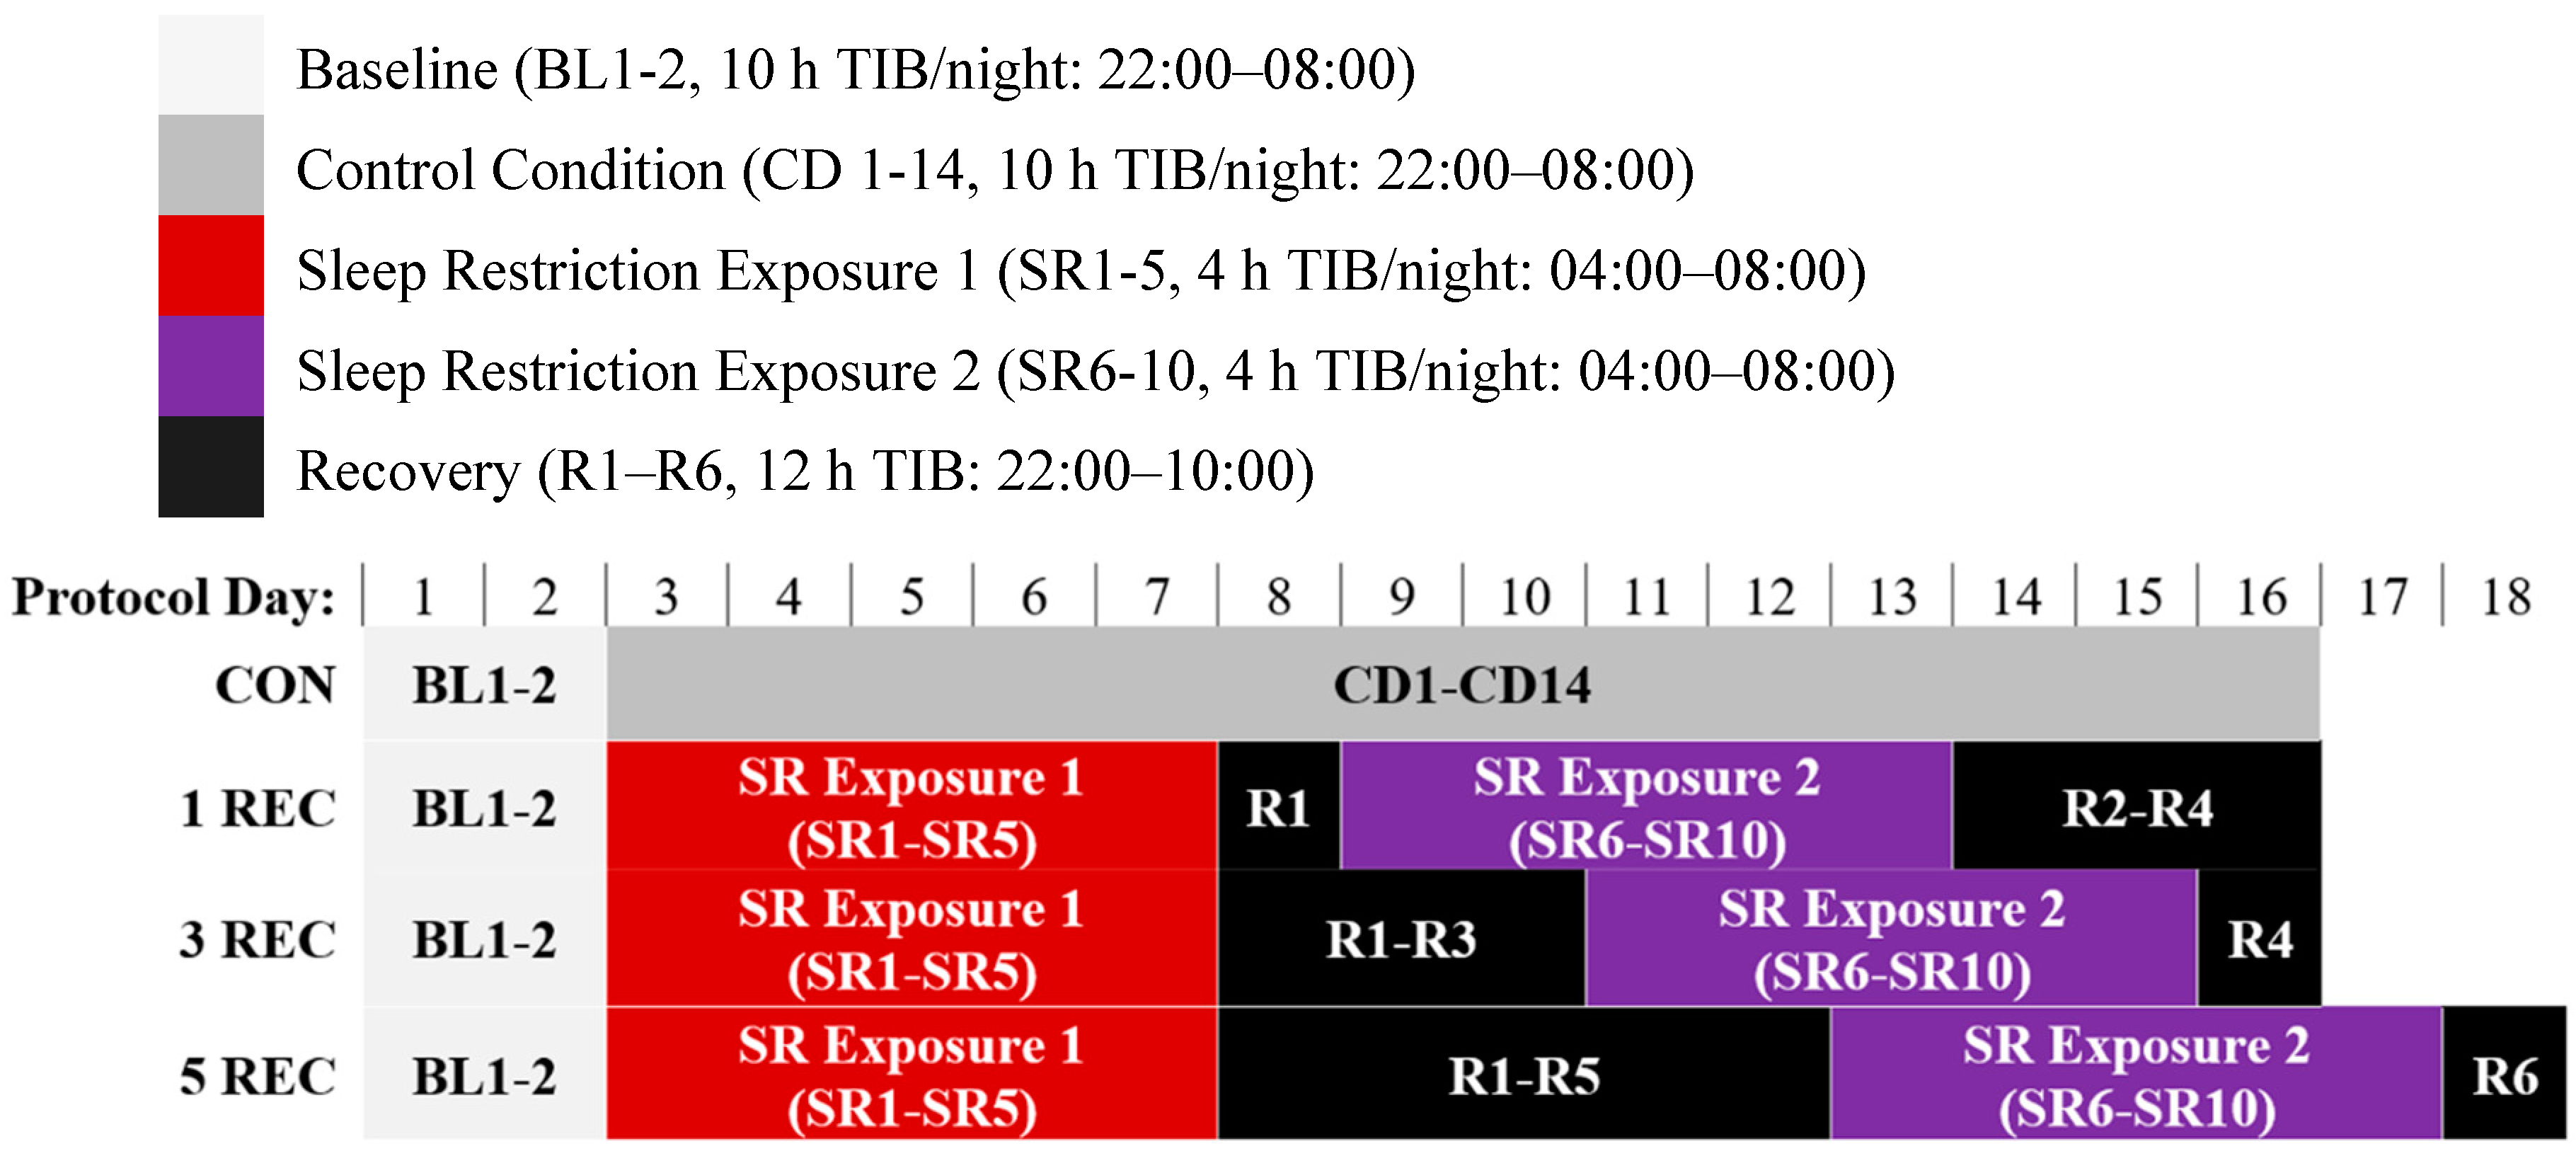
2.2. Protocol
2.3. Measures and Procedures
2.4. Data Analysis
3. Results
3.1. Participant Characteristics
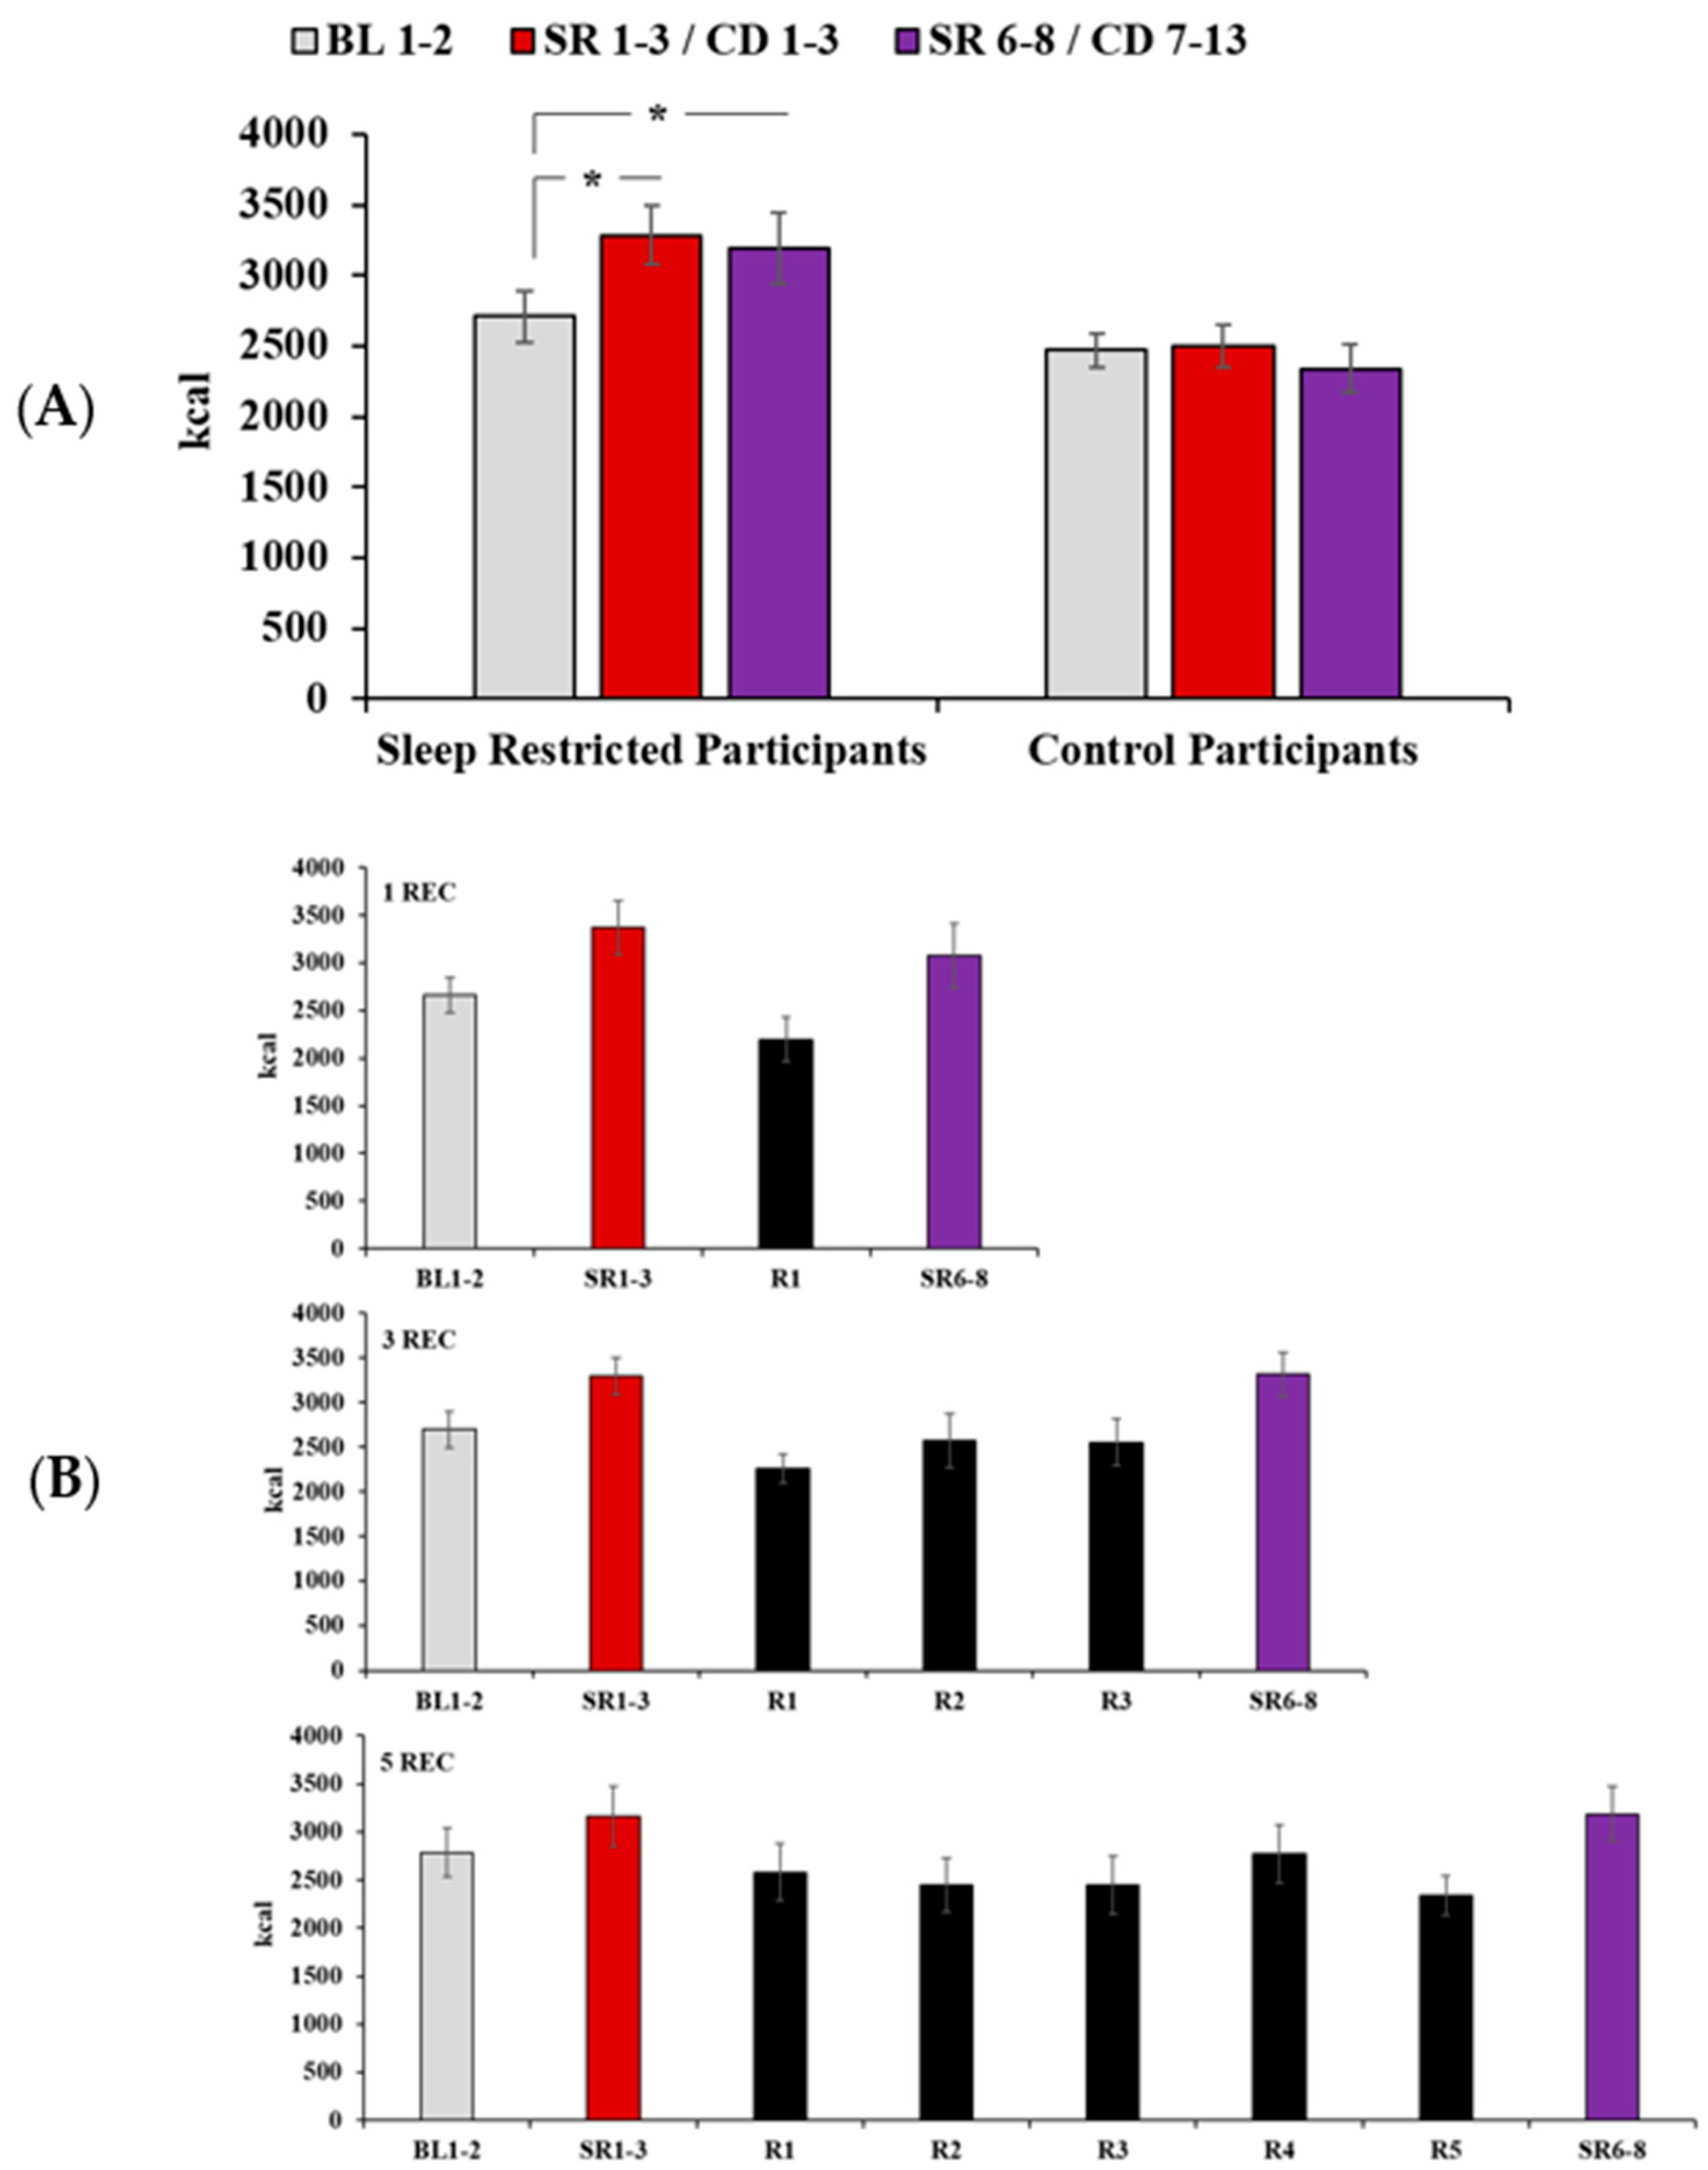
3.2. Daily Caloric Intake
3.3. Daily Macronutrient Intake
3.4. Fiber, Sugar, and Saturated Fat Intake
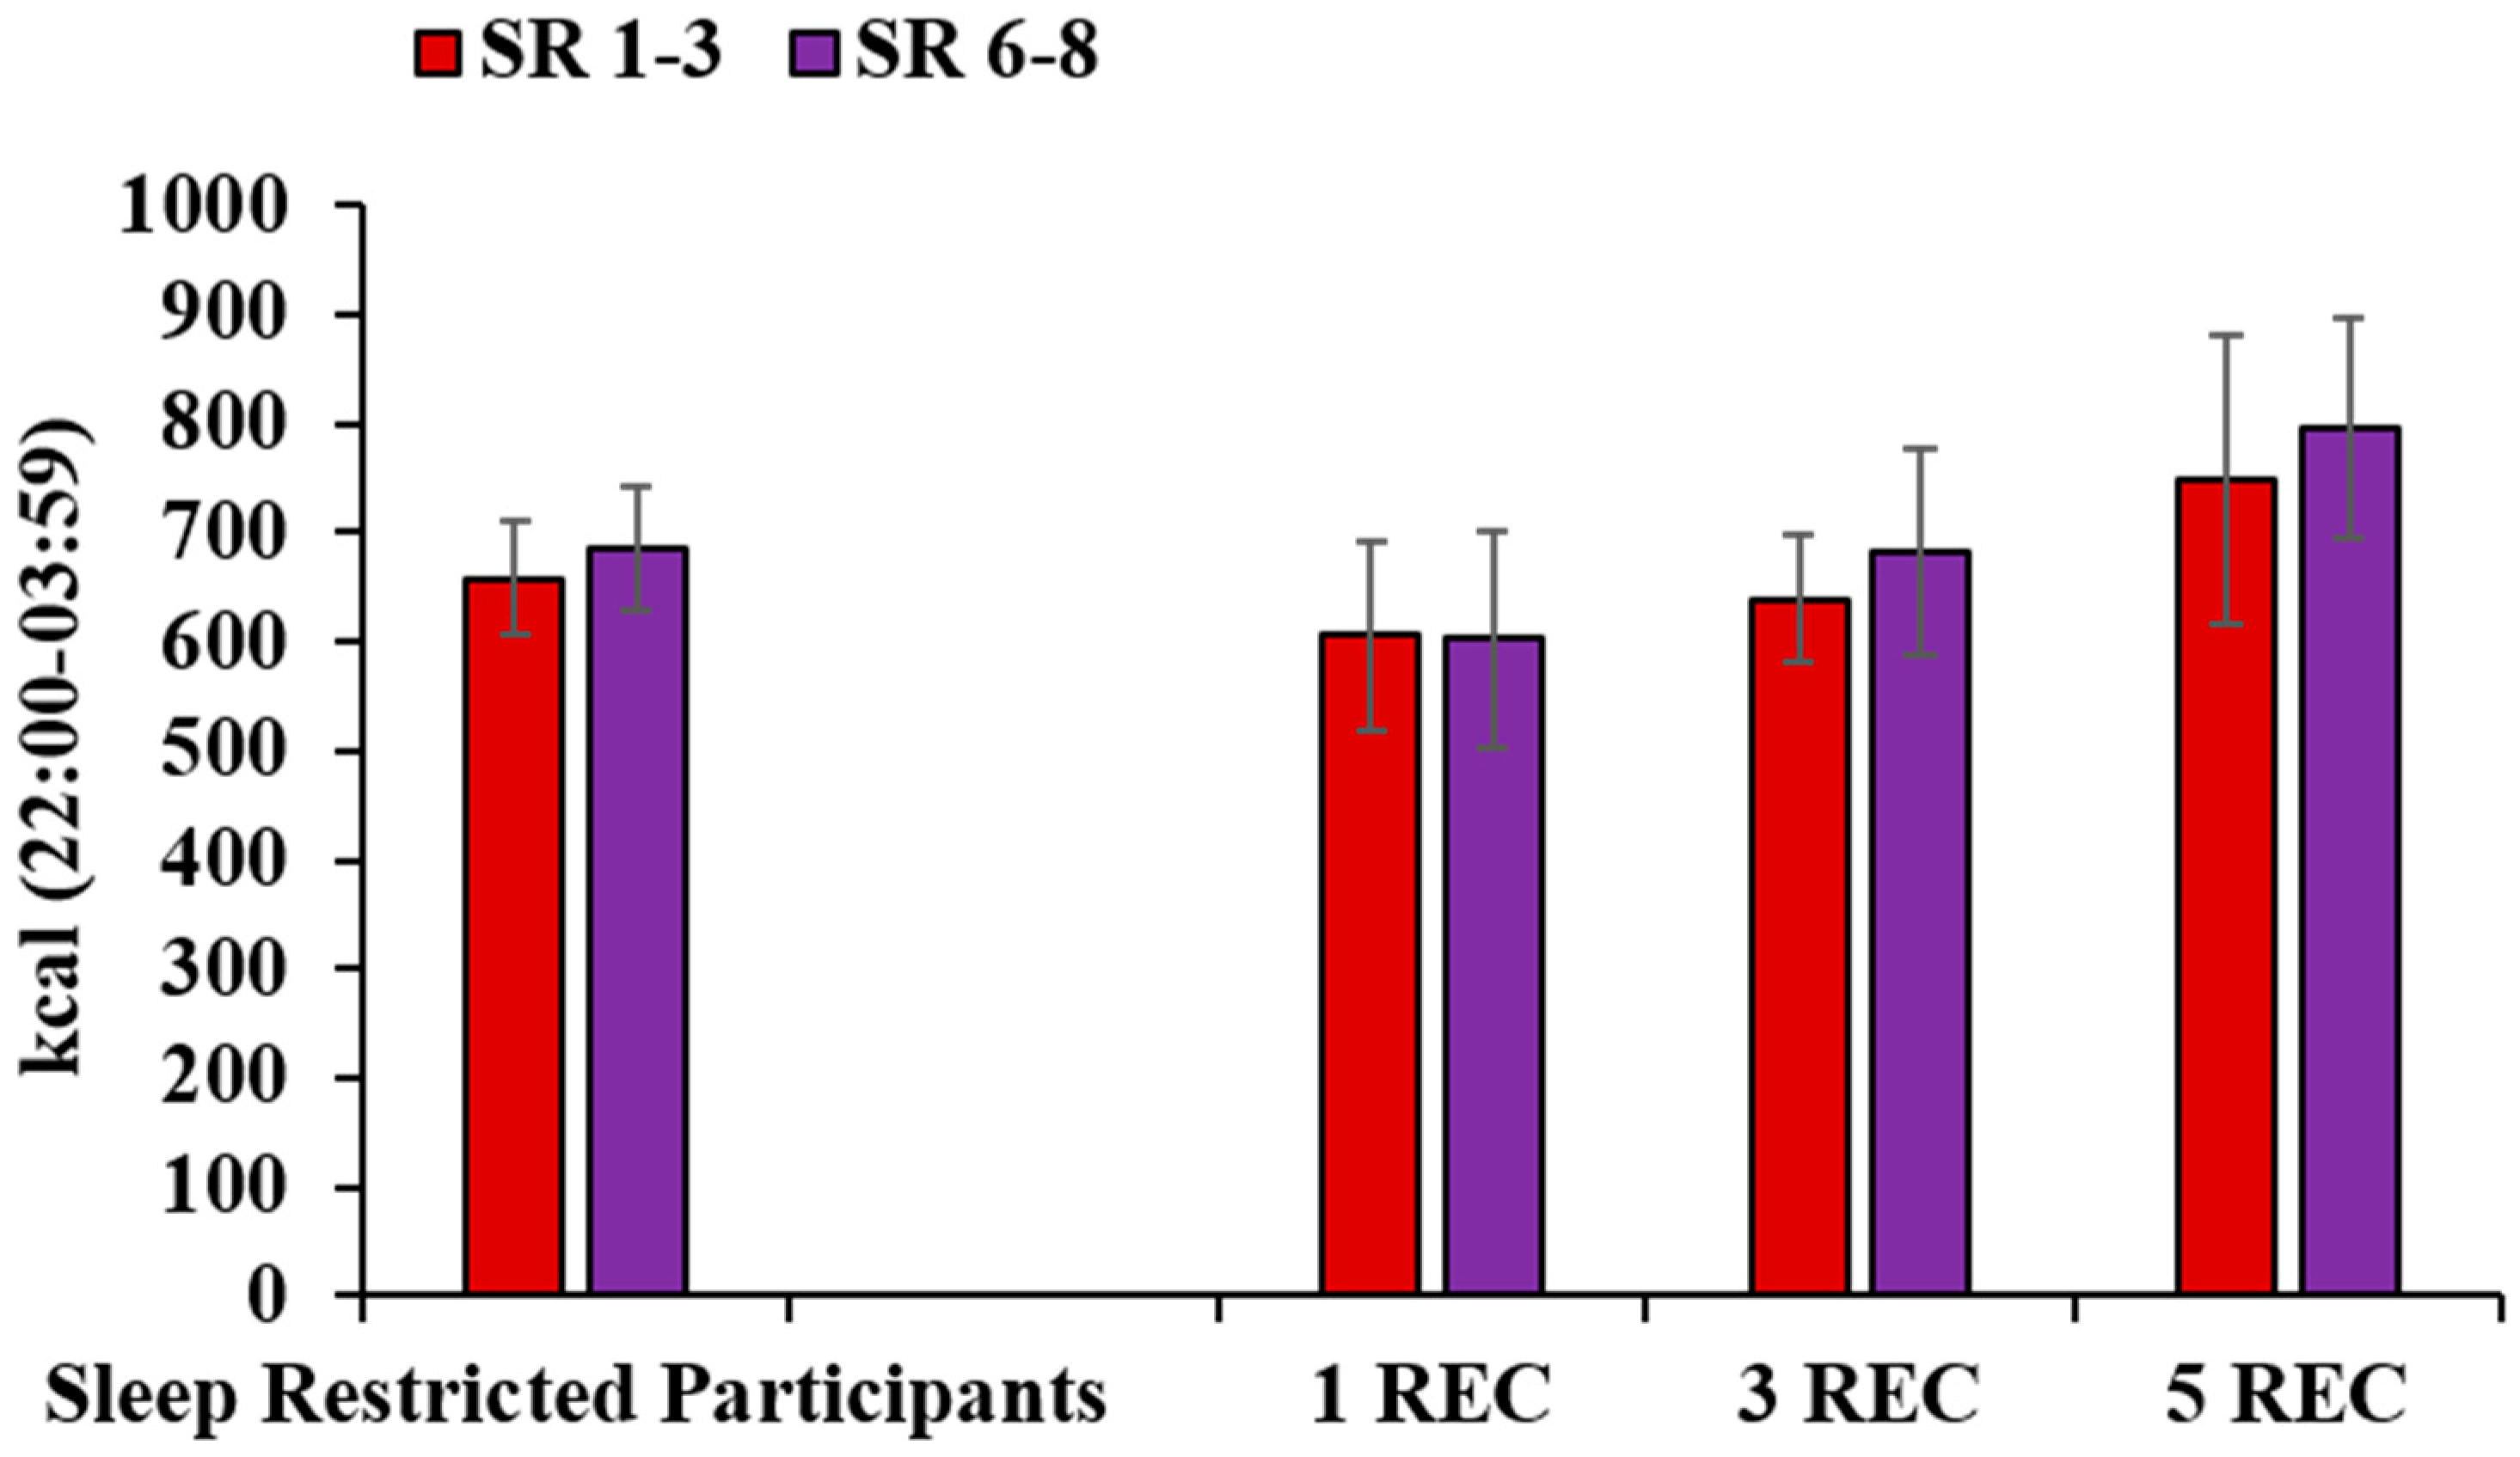
3.5. Late-Night Intake
3.6. Intake During Recovery
4. Discussion
5. Conclusions
Author Contributions
Funding
Acknowledgments
Conflicts of Interest
References
- Watson, N.F.; Badr, M.S.; Belenky, G.; Bliwise, D.L.; Buxton, O.M.; Buysse, D.; Dinges, D.F.; Gangwisch, J.; Grandner, M.A.; Kushida, C.; et al. Recommended amount of sleep for a healthy adult: A joint consensus statement of the american academy of sleep medicine and sleep research society. Sleep 2015, 38, 843–844. [Google Scholar] [CrossRef] [PubMed]
- Liu, Y.; Wheaton, A.G.; Chapman, D.P.; Cunningham, T.J.; Lu, H.; Croft, J.B. Prevalence of healthy sleep duration among adults--United States, 2014. MMWR Morb. Mortal. Wkly. Rep. 2016, 65, 137–141. [Google Scholar] [CrossRef] [PubMed] [Green Version]
- Goel, N. Neurobehavioral effects and biomarkers of sleep loss in healthy adults. Curr. Neurol. Neurosci. Rep. 2017, 17, 89. [Google Scholar] [CrossRef] [PubMed]
- Van Dongen, H.P.A.; Maislin, G.; Mullington, J.M.; Dinges, D.F. The cumulative cost of additional wakefulness: Dose-response effects on neurobehavioral functions and sleep physiology from chronic sleep restriction and total sleep deprivation. Sleep 2003, 26, 117–126. [Google Scholar] [CrossRef] [PubMed]
- Tobaldini, E.; Costantino, G.; Solbiati, M.; Cogliati, C.; Kara, T.; Nobili, L.; Montano, N. Sleep, sleep deprivation, autonomic nervous system and cardiovascular diseases. Neurosci. Biobehav. Rev. 2017, 74, 321–329. [Google Scholar] [CrossRef]
- Wu, Y.; Zhai, L.; Zhang, D. Sleep duration and obesity among adults: A meta-analysis of prospective studies. Sleep. Med. 2014, 15, 1456–1462. [Google Scholar] [CrossRef]
- Shan, Z.; Hongfei, M.; Manling, X.; Yan, P.; Guo, Y.; Bao, W. Sleep duration and risk of type 2 diabetes: A meta-analysis of prospective studies. Diabetes Care 2015, 38, 529–537. [Google Scholar] [CrossRef] [Green Version]
- Chattu, V.K.; Manzar, M.D.; Kumary, S.; Burman, D.; Spence, D.W.; Pandi-Perumal, S.R. The global problem of insufficient sleep and its serious public health implications. Healthcare 2018, 7, 1. [Google Scholar] [CrossRef] [Green Version]
- Basner, M.; Fomberstein, K.M.; Razavi, F.M.; Banks, S.; William, J.H.; Rosa, R.R.; Dinges, D.F. American time use survey: Sleep time and its relationship to waking activities. Sleep 2007, 30, 1085–1095. [Google Scholar] [CrossRef] [Green Version]
- Åkerstedt, T.; Ghilotti, F.; Grotta, A.; Zhao, H.; Adami, H.O.; Trolle-Lagerros, Y.; Bellocco, R. Sleep duration and mortality—Does weekend sleep matter? J. Sleep. Res. 2019, 28, e12712. [Google Scholar] [CrossRef]
- Hansen, M.; Janssen, I.; Schiff, A.; Zee, P.C.; Dubocovich, M.L. The impact of school daily schedule on adolescent sleep. Pediatrics 2005, 115, 1555–1561. [Google Scholar] [CrossRef] [PubMed] [Green Version]
- Monk, T.H.; Buysse, D.J.; Rose, L.R.; Hall, J.A.; Kupfer, D.J. The sleep of healthy people—A diary study. Chronobiol. Int. 2000, 17, 49–60. [Google Scholar] [CrossRef] [PubMed]
- Tsui, Y.Y.; Wing, Y.K. A study on the sleep patterns and problems of university business students in Hong Kong. J. Am. Coll. Health 2009, 58, 167–176. [Google Scholar] [CrossRef] [PubMed]
- Wing, Y.K.; Li, S.X.; Li, A.M.; Zhang, J.; Kong, A.P. The effect of weekend and holiday sleep compensation on childhood overweight and obesity. Pediatrics 2009, 124, e994–e1000. [Google Scholar] [CrossRef] [PubMed]
- National Sleep Foundation. Sleep in America Poll Summary of Findings. 2010. Available online: www.sleepfoundation.org (accessed on 1 June 2020).
- St Hilaire, M.A.; Rüger, M.; Fratelli, F.; Hull, J.T.; Phillips, A.J.; Lockley, S.W. Modeling neurocognitive decline and recovery during repeated cycles of extended sleep and chronic sleep deficiency. Sleep 2017, 40, zsw009. [Google Scholar] [CrossRef] [PubMed] [Green Version]
- Yang, H.; Haack, M.; Gautam, S.; Meier-Ewert, H.K.; Mullington, J.M. Repetitive exposure to shortened sleep leads to blunted sleep-associated blood pressure dipping. J. Hypertens. 2017, 35, 1187–1194. [Google Scholar] [CrossRef]
- Simpson, N.S.; Diolombi, M.; Scott-Sutherland, J.; Yang, H.; Bhatt, V.; Gautam, S.; Mullington, J.; Haack, M. Repeating patterns of sleep restriction and recovery: Do we get used to it? Brain Behav. Immun. 2016, 58, 142–151. [Google Scholar] [CrossRef] [Green Version]
- St-Onge, M.P. Sleep-obesity relation: Underlying mechanisms and consequences for treatment. Obes. Rev. 2017, 18, 34–39. [Google Scholar] [CrossRef]
- St-Onge, M.P.; Roberts, A.L.; Chen, J.; Kelleman, M.; O‘Keeffe, M.; RoyChoudhury, A.; Jones, P.J. Short Sleep duration increases energy intakes but does not change energy expenditure in normal-weight individuals. Am. J. Clin. Nutr. 2011, 94, 410–416. [Google Scholar] [CrossRef] [Green Version]
- Spaeth, A.M.; Dinges, D.F.; Goel, N. Effects of experimental sleep restriction on weight gain, caloric intake, and meal timing in healthy adults. Sleep 2013, 36, 981–990. [Google Scholar] [CrossRef]
- Spaeth, A.M.; Dinges, D.F.; Goel, N. Sex and race differences in caloric intake during sleep restriction in healthy adults. Am. J. Clin. Nutr. 2014, 100, 559–566. [Google Scholar] [CrossRef] [PubMed] [Green Version]
- Markwald, R.R.; Melanson, E.L.; Smith, M.R.; Higgins, J.; Perreault, L.; Eckel, R.H.; Wright, K.P., Jr. Impact of insufficient sleep on total daily energy expenditure, food intake, and weight gain. Proc. Natl. Acad. Sci. USA 2013, 110, 5695–5700. [Google Scholar] [CrossRef] [PubMed] [Green Version]
- Zhu, B.; Shi, C.; Park, C.G.; Zhao, X.; Reutrakul, S. Effects of sleep restriction on metabolism-related parameters in healthy Adults: A comprehensive review and meta-analysis of randomized controlled trials. Sleep Med. Rev. 2019, 45, 18–30. [Google Scholar] [CrossRef] [PubMed]
- Depner, C.M.; Melanson, E.L.; Eckel, R.H.; Snell-Bergeon, J.K.; Perreault, L.; Bergman, B.C.; Higgins, J.A.; Guerin, M.K.; Stothard, E.R.; Morton, S.J.; et al. Ad libitum weekend recovery sleep fails to prevent metabolic dysregulation during a repeating pattern of insufficient sleep and weekend recovery sleep. Curr. Biol. 2019, 29, 957–967.e4. [Google Scholar] [CrossRef] [PubMed] [Green Version]
- Pejovic, S.; Basta, M.; Vgontzas, A.N.; Kritikou, I.; Shaffer, M.L.; Tsaoussoglou, M.; Stiffler, D.; Stefanakis, Z.; Bixler, E.O.; Chrousos, G.P. Effects of recovery sleep after one work week of mild sleep restriction on interleukin-6 and cortisol secretion and daytime sleepiness and performance. Am. J. Physiol. Endocrinol. Metab. 2013, 305, E890–E896. [Google Scholar] [CrossRef] [Green Version]
- Yang, H.; Haack, M.; Dang, R.; Gautam, S.; Simpson, N.S.; Mullington, J.M. Heart rate variability rebound following exposure to persistent and repetitive sleep restriction. Sleep 2019, 42, zsy226. [Google Scholar] [CrossRef] [Green Version]
- Chai, Y.; Fang, Z.; Yang, F.N.; Xu, S.; Deng, Y.; Raine, A.; Wang, J.; Yu, M.; Basner, M.; Goel, N.; et al. Two Nights of recovery sleep restores hippocampal connectivity but not episodic memory after total sleep deprivation. Sci. Rep. 2020, 10, 8774. [Google Scholar] [CrossRef]
- Legera, D.; Richard, J.B.; Colina, O.; Fabien, S.; Farautab, B. Napping and weekend catchup sleep do not fully compensate for high rates of sleep debt and short sleep at a population level. Sleep Med. 2020, 74, 278–288. [Google Scholar] [CrossRef]
- Dennis, L.E.; Spaeth, A.M.; Goel, N. Phenotypic stability of energy balance responses to experimental total sleep deprivation and sleep restriction in healthy adults. Nutrients 2016, 8, 823. [Google Scholar] [CrossRef] [PubMed]
- Spaeth, A.M.; Dinges, D.F.; Goel, N. Objective measurements of energy balance are associated with sleep architecture in healthy adults. Sleep 2017, 40, zsw018. [Google Scholar] [CrossRef] [PubMed] [Green Version]
- Smith, C.S.; Reilly, C.; Midkiff, K. Evaluation of three circadian rhythm questionnaires with suggestions for an improved measure of morningness. J. Appl. Psychol. 1989, 74, 728–738. [Google Scholar] [CrossRef] [PubMed]
- Goel, N.; Abe, T.; Braun, M.E.; Dinges, D.F. Cognitive workload and sleep restriction interact to influence sleep homeostatic responses. Sleep 2014, 37, 1745–1756. [Google Scholar] [CrossRef] [Green Version]
- Banks, S.; Van Dongen, H.P.; Maislin, G.; Dinges, D.F. Neurobehavioral dynamics following chronic sleep restriction: Dose-response effects of one night for recovery. Sleep 2010, 33, 1013–1026. [Google Scholar] [CrossRef] [PubMed] [Green Version]
- Yamazaki, E.M.; Goel, N. Robust stability of trait-like vulnerability or resilience to common types of sleep deprivation in a large sample of adults. Sleep 2020, 43, zsz292. [Google Scholar] [CrossRef] [PubMed]
- Spaeth, A.M.; Dinges, D.F.; Goel, N. Resting metabolic rate varies by race and by sleep duration. Obesity 2015, 23, 2349–2356. [Google Scholar] [CrossRef] [Green Version]
- Hise, M.E.; Sullivan, D.K.; Jacobsen, D.J.; Johnson, S.L.; Donnelly, J.E. Validation of energy intake measurements determined from observer-recorded food records and recall methods compared with the doubly labeled water method in overweight and obese individuals. Am. J. Clin. Nutr. 2002, 75, 263–267. [Google Scholar] [CrossRef] [Green Version]
- Spaeth, A.M.; Dinges, D.F.; Goel, N. Phenotypic vulnerability of energy balance responses to sleep loss in healthy adults. Sci. Rep. 2015, 5, 14920. [Google Scholar] [CrossRef]
- Cohen, J. Statistical Power Analysis for the Behavioral-Sciences, 2nd ed.; Lawrence Erlbaum Associates: Mahwah, NJ, USA, 1988. [Google Scholar]
- Landis, J.R.; Koch, G.G. The measurement of observer agreement for categorical data. Biometrics 1977, 33, 159–174. [Google Scholar] [CrossRef] [Green Version]
- Harris, J.A.; Benedict, F.G. A biometric study of human basal metabolism. Proc. Natl. Acad. Sci. USA 1918, 4, 370–373. [Google Scholar] [CrossRef] [Green Version]
- Salgado-Delgado, R.; Angeles-Castellanos, M.; Saderi, N.; Buijs, R.M.; Escobar, C. Food intake during the normal activity phase prevents obesity and circadian desynchrony in a rat model of night work. Endocrinology 2010, 151, 1019–1029. [Google Scholar] [CrossRef]
- Salgado-Delgado, R.; Angeles-Castellanos, M.; Buijs, M.R.; Escobar, C. Internal desynchronization in a model of night-work by forced activity in rats. Neuroscience 2008, 154, 922–931. [Google Scholar] [CrossRef] [PubMed]
- Barf, R.P.; Desprez, T.; Meerlo, P.; Scheurink, A.J. Increased Food Intake and Changes in Metabolic Hormones in Response to Chronic Sleep Restriction Alternated with Short Periods of Sleep Allowance. Am. J. Physiol. Regul. Integr. Comp. Physiol. 2012, 302, R112–R117. [Google Scholar] [CrossRef] [PubMed] [Green Version]
- Everson, C.A.; Szabo, A. Recurrent Restriction of Sleep and Inadequate Recuperation Induce Both Adaptive Changes and Pathological Outcomes. Am. J. Physiol. Regul. Integr. Comp. Physiol. 2009, 297, R1430–R1440. [Google Scholar] [CrossRef] [PubMed] [Green Version]
- Penev, P.D. Update on energy homeostasis and insufficient sleep. J. Clin. Endocrinol. Metab. 2012, 97, 1792–1801. [Google Scholar] [CrossRef] [PubMed] [Green Version]
- Jackson, S.E.; Llewellyn, C.H.; Smith, L. The obesity epidemic—Nature via nurture: A narrative review of high-income countries. SAGE Open Med. 2020, 8, 2050312120918265. [Google Scholar] [CrossRef] [PubMed]
- Allison, K.C.; Goel, N. Timing of eating in adults across the weight spectrum: Metabolic factors and potential circadian mechanisms. Physiol. Behav. 2018, 192, 158–166. [Google Scholar] [CrossRef] [PubMed]
- Beulen, Y.; Martínez-González, M.A.; van de Rest, O.; Salas-Salvadó, J.; Sorlí, J.V.; Gómez-Gracia, E.; Fiol, M.; Estruch, R.; Santos-Lozano, J.M.; Schröder, H.; et al. Quality of dietary fat intake and body weight and obesity in a mediterranean population: Secondary analyses within the predimed trial. Nutrients 2018, 10, 2011. [Google Scholar] [CrossRef] [Green Version]
- Rupp, T.L.; Wesensten, N.J.; Bliese, P.D.; Balkin, T.J. Banking sleep: Realization of benefits during subsequent sleep restriction and recovery. Sleep 2009, 32, 311–321. [Google Scholar] [CrossRef] [Green Version]
- Henst, R.H.P.; Pienaar, P.R.; Roden, L.C.; Rae, D.E. The effects of sleep extension on cardiometabolic risk factors: A systematic review. J. Sleep Res. 2019, 28, e12865. [Google Scholar] [CrossRef]
- Arnal, P.J.; Sauvet, F.; Leger, D.; van Beers, P.; Bayon, V.; Bougard, C.; Rabat, A.; Millet, G.Y.; Chennaoui, M. Benefits of sleep extension on sustained attention and sleep pressure before and during total sleep deprivation and recovery. Sleep 2015, 38, 1935–1943. [Google Scholar] [CrossRef]
- Van Dongen, H.P.; Baynard, M.D.; Maislin, G.; Dinges, D.F. Systematic interindividual differences in neurobehavioral impairment from sleep loss: Evidence of trait-like differential vulnerability. Sleep 2004, 27, 423–433. [Google Scholar] [PubMed]
- Jean-Louis, G.; Youngstedt, S.; Grandner, M.; Williams, N.J.; Sarpong, D.; Zizi, F.; Ogedegbe, G. Unequal burden of sleep-related obesity among black and white Americans. Sleep Health 2015, 1, 169–176. [Google Scholar] [CrossRef] [PubMed] [Green Version]
- Hetherington, M.H.; Anderson, A.S.; Norton, G.N.M.; Newson, L. Situational effects on meal intake: A comparison of eating alone and eating with others. Physiol. Behav. 2006, 88, 498–505. [Google Scholar] [CrossRef] [PubMed]
- Al Khatib, H.K.; Harding, S.V.; Darzi, J.; Pot, G.K. The effects of partial sleep deprivation on energy balance: A systematic review and meta-analysis. Eur. J. Clin. Nutr. 2017, 71, 614–624. [Google Scholar] [CrossRef] [PubMed]


| Experimental Conditions | ||||
|---|---|---|---|---|
| CON n = 10 | 1 REC n = 13 | 3 REC n = 12 | 5 REC n = 10 | |
| Age (years) | 33.6 ± 9.8 | 31.9 ± 7.2 | 36.2 ± 10.3 | 34.0 ± 8.9 |
| Women | 4 (40.0) | 5 (38.5) | 5 (41.7) | 3 (30.0) |
| African Americans | 6 (60.0) | 8 (61.5) | 5 (41.7) | 6 (60.0) |
| Body Mass Index (kg/m2) | 24.3 ± 3.6 | 25.2 ± 4.3 | 25.3 ± 3.3 | 24.0 ± 3.6 |
| Estimated Caloric Need a | 2318.8 ± 330.3 | 2353.4 ± 422.3 | 2336.3 ± 447.7 | 2332.5 ± 287.6 |
| Chronotype b | 43.00 ± 4.14 | 42.92 ± 5.53 | 41.18 ± 5.31 | 40.50 ± 7.58 |
| Pre-Study Sleep Duration (h) c | 7.98 ± 0.53 | 7.76 ± 0.50 | 8.29 ± 0.33 | 7.89 ± 0.38 |
| Pre-Study Sleep Midpoint (time ± min) c | 03:37 ± 39.12 | 03:32 ± 41.29 | 03:24 ± 32.47 | 03:40 ± 36.08 |
| Protein (% kcal) | Carbohydrate (% kcal) | Fat (% kcal) | |||||||
|---|---|---|---|---|---|---|---|---|---|
| BL1-2 | SR1-3/ CD1-3 | SR6-8/ CD7-13 | BL1-2 | SR1-3/ CD1-3 | SR6-8/ CD7-13 | BL1-2 | SR1-3/ CD1-3 | SR6-8/ CD7-13 | |
| CON (n = 10) | 14.80 ± 3.90 | 13.70 ± 3.06 | 14.28 ± 3.43 | 59.59 ± 5.53 | 62.29 ± 5.73 | 60.94 ± 5.58 | 27.55 ± 4.89 | 27.00 ± 3.97 | 27.84 ± 5.30 |
| All SR Participants (n = 35) | 14.30 ± 2.73 | 12.84 ± 1.98 * | 13.29 ± 1.92 * | 57.95 ± 5.75 | 58.50 ± 4.38 | 57.75 ± 5.56 | 29.38 ± 4.94 | 30.53 ± 4.20 | 30.77 ± 5.16 |
| 1 REC (n = 13) | 14.62 ± 1.84 | 13.06 ± 2.06 | 13.36 ± 1.73 | 57.28 ± 7.06 | 56.72 ± 4.37 | 57.39 ± 6.77 | 29.85 ± 6.38 | 32.11 ± 4.73 | 31.09 ± 6.20 |
| 3 REC (n = 12) | 15.73 ± 3.06 | 13.23 ± 1.86 | 14.02 ± 2.08 | 57.47 ± 5.89 | 58.64 ± 5.54 | 57.57 ± 5.54 | 28.49 ± 4.52 | 30.09 ± 4.08 | 30.39 ± 5.11 |
| 5 REC (n = 10) | 12.18 ± 2.08 | 12.08 ± 2.00 | 12.34 ± 1.73 | 59.39 ± 3.58 | 60.64 ± 3.80 | 58.42 ± 4.21 | 29.84 ± 3.38 | 29.02 ± 3.20 | 30.80 ± 4.12 |
| Fiber (g) | Fiber (g/1000 kcal) | |||||
|---|---|---|---|---|---|---|
| BL1-2 | SR1-3/ CD1-3 | SR6-8/ CD7-13 | BL1-2 | SR1-3/ CD1-3 | SR6-8/ CD7-13 | |
| CON (n = 10) | 20.23 ± 4.57 | 24.82 ± 4.05 *,† | 21.01 ± 4.46 | 8.87 ± 3.34 | 10.63 ± 3.62 | 9.65 ± 2.75 |
| All SR Participants (n = 35) | 24.01 ± 9.24 | 27.12 ± 10.34 * | 25.57 ± 10.31 | 9.26 ± 4.09 | 8.48 ± 2.84 | 8.48 ± 4.15 |
| 1 REC (n = 13) | 22.66 ± 8.07 | 26.34 ± 9.53 | 24.61 ± 11.12 | 9.20 ± 5.19 | 8.29 ± 3.47 | 8.92 ± 5.75 |
| 3 REC (n = 12) | 28.08 ± 9.85 | 29.05 ± 11.02 | 27.38 ± 10.58 | 10.71 ± 3.44 | 8.66 ± 1.50 | 8.29 ± 3.27 |
| 5 REC (n = 10) | 20.88 ± 9.01 | 25.83 ± 11.28 | 24.64 ± 9.65 | 7.61 ± 2.64 | 8.50 ± 3.39 | 8.14 ± 2.74 |
| Sugar (g) | Sugar (% kcal) | |||||
|---|---|---|---|---|---|---|
| BL1-2 | SR1-3/ CD1-3 | SR6-8/ CD7-13 | BL1-2 | SR1-3/ CD1-3 | SR6-8/ CD7-13 | |
| CON (n = 10) | 193.84 ± 70.08 | 177.27 ± 79.08 | 164.02 ± 91.61 * | 30.43 ± 5.99 | 27.64 ± 7.23 | 26.96 ± 8.00 |
| All SR Participants (n = 35) | 197.26 ± 671.03 | 231.92 ± 87.16 *,† | 211.12 ± 95.68 | 28.81 ± 5.86 | 28.09 ± 6.26 † | 26.07 ± 6.46 * |
| 1 REC (n = 13) | 182.44 ± 68.28 | 224.86 ± 99.62 | 200.23 ± 105.11 | 27.22 ± 5.54 | 26.56 ± 7.48 | 25.31 ± 6.38 |
| 3 REC (n = 12) | 184.86 ± 65.88 | 222.04 ± 51.57 | 193.55 ± 57.75 | 26.85 ± 5.04 | 27.02 ± 4.77 | 23.75 ± 5.34 |
| 5 REC (n = 10) | 231.41 ± 75.61 | 252.97 ± 107.33 | 246.37 ± 117.54 | 33.23 ± 5.23 | 31.37 ± 5.34 | 29.84 ± 6.66 |
| Saturated Fat (g) | Saturated Fat (% kcal) | |||||
|---|---|---|---|---|---|---|
| BL1-2 | SR1-3/ CD1-3 | SR6-8/ CD7-13 | BL1-2 | SR1-3/ CD1-3 | SR6-8/ CD7-13 | |
| CON (n = 10) | 27.91 ± 10.51 | 29.41 ± 10.76 | 25.01 ± 10.15 | 10.07 ± 2.47 | 10.29 ± 2.32 | 9.54 ± 2.17 |
| All SR Participants (n = 35) | 32.22 ± 13.27 | 40.56 ± 17.12* | 38.20 ± 17.47* | 10.41 ± 2.86 | 10.82 ± 2.84 | 10.52 ± 3.00 |
| 1 REC (n = 13) | 32.15 ± 12.49 | 45.81 ± 19.06 | 39.90 ± 21.86 | 10.64 ± 3.46 | 11.95 ± 3.14 | 11.22 ± 3.97 |
| 3 REC (n = 12) | 30.61 ± 13.95 | 39.61 ± 15.30 | 37.75 ± 16.89 | 9.85 ± 2.80 | 10.67 ± 2.88 | 9.98 ± 2.82 |
| 5 REC (n = 10) | 34.18 ± 14.54 | 34.86 ± 16.10 | 36.55 ± 12.64 | 10.77 ± 2.17 | 9.53 ± 1.86 | 10.26 ± 1.45 |
| Protocol Day | |||||
|---|---|---|---|---|---|
| R1 | R2 | R3 | R4 | R5 | |
| Protein (% kcal) | |||||
| 1 REC | 13.94 ± 2.54 | ||||
| 3 REC | 15.11 ± 2.81 | 15.21 ± 2.74 | 13.44 ± 3.46 | ||
| 5 REC | 13.00 ± 2.82 | 13.37 ± 2.39 | 13.29 ± 2.67 | 12.31 ± 2.50 | 12.93 ± 2.37 |
| Carbohydrate (% kcal) | |||||
| 1 REC | 61.08 ± 9.04 * | ||||
| 3 REC | 59.76 ± 8.05 | 56.83 ± 6.70 | 59.14 ± 8.89 | ||
| 5 REC | 57.76 ± 4.05 | 57.56 ± 5.82 | 59.74 ± 4.13 | 56.48 ± 6.44 | 58.00 ± 5.11 |
| Fat (% kcal) | |||||
| 1 REC | 26.7 ± 8.41 | ||||
| 3 REC | 27.03 ± 7.03 | 29.37 ± 5.58 | 29.83 ± 7.21 | ||
| 5 REC | 30.59 ± 4.32 | 30.68 ± 4.22 | 29.20 ± 3.40 | 32.46 ± 6.23 | 29.78 ± 5.57 |
© 2020 by the authors. Licensee MDPI, Basel, Switzerland. This article is an open access article distributed under the terms and conditions of the Creative Commons Attribution (CC BY) license (http://creativecommons.org/licenses/by/4.0/).
Share and Cite
Spaeth, A.M.; Goel, N.; Dinges, D.F. Caloric and Macronutrient Intake and Meal Timing Responses to Repeated Sleep Restriction Exposures Separated by Varying Intervening Recovery Nights in Healthy Adults. Nutrients 2020, 12, 2694. https://doi.org/10.3390/nu12092694
Spaeth AM, Goel N, Dinges DF. Caloric and Macronutrient Intake and Meal Timing Responses to Repeated Sleep Restriction Exposures Separated by Varying Intervening Recovery Nights in Healthy Adults. Nutrients. 2020; 12(9):2694. https://doi.org/10.3390/nu12092694
Chicago/Turabian StyleSpaeth, Andrea M., Namni Goel, and David F. Dinges. 2020. "Caloric and Macronutrient Intake and Meal Timing Responses to Repeated Sleep Restriction Exposures Separated by Varying Intervening Recovery Nights in Healthy Adults" Nutrients 12, no. 9: 2694. https://doi.org/10.3390/nu12092694