Article

Assessment of Household and Outdoor Air Pollution Exposure Link to Urinary Metals Content in Pregnant Women

1
Environmental Epidemiology, Ministry of Health, 9446724 Jerusalem, Israel
2
Department of Clinical Biochemistry and Pharmacology, Ben-Gurion University of the Negev, 84105 Beer-Sheva, Israel
3
The Fredy and Nadine Herrmann Institute of Earth Sciences, The Hebrew University of Jerusalem, 9190501 Jerusalem, Israel
4
Neonatology Department, Soroka University Medical Center, 84101 Beer-Sheva, Israel
5
Negev Environmental Health Research Institute, Soroka University Medical Center, 84101 Beer-Sheva, Israel
6
Faculty of Health Sciences, Ben-Gurion University of the Negev, 84105 Beer-Sheva, Israel
7
Environmental Epidemiology, Harvard School of Public Health, Boston, MA 02115, USA
8
Geography Department, Ben-Gurion University of the Negev, 84105 Beer-Sheva, Israel
9
Department of Public Health, Ben-Gurion University of the Negev, 84105 Beer-Sheva, Israel
*
Author to whom correspondence should be addressed.
Atmosphere 2020, 11(6), 638; https://doi.org/10.3390/atmos11060638
Submission received: 21 April 2020 / Revised: 25 May 2020 / Accepted: 10 June 2020 / Published: 16 June 2020
(This article belongs to the Special Issue Air Pollution and Human Exposures in Israel)

Abstract

:
We aimed to estimate the association of urinary metal content with the exposure to hazardous household factors and ambient air pollution in pregnant women. We analyzed urine samples of 143 women enrolled at delivery and assessed household exposure by questionnaire. Air pollution estimates were based on monitoring stations and satellite-based models. Complaints about noise, rubbish, and sewage in the neighborhood were associated with higher uranium concentrations (prevalence ratio (PR) = 1.42, 1.46, and 1.18, respectively). Complaints about noise were more frequent in women with higher cobalt, nickel, molybdenum, cadmium, and vanadium urine concentrations (PRs = 2.42–9.43), and complaints about smell in women with higher cobalt and strontium (PRs = 2.55–6.27). Exposure to nitrogen oxides was associated with higher concentrations of nickel, aluminum, lead, and chromium in urine (PRs = 1.80–5.85). Women exposed to elevated levels of particulate matter were more likely to have higher concentrations of cobalt, nickel, thallium, lead, iron, strontium, barium, silver, and chromium (PRs = 1.97–13.64). Exposure to high levels of sulfur dioxide was positively associated with cobalt and nickel (PR = 1.98 and 1.88, respectively). The current analysis suggests the possibility of a related simultaneous exposure to multiple pollutants. Further studies are warranted to corroborate the findings and reveal the multiple exposure effect on human health.

Graphical Abstract

1. Introduction

The typical pathway suggested for the effect of most pollutants on human health begins with absorption into the body and, via the inflammatory reaction, proceeds to the development of pathophysiological processes [1,2]. While outdoor pollution estimates are largely available from the constantly expanding net of monitoring stations and advanced modeling approaches [3], the information on the internal dose of pollutants absorbed is infrequently available, and therefore the presumed effect of the pollutants is derived from ecological estimations. Human biomonitoring (HBM) has been recognized as the main tool for verifying the actual dose of environmental exposures in a general population [4,5,6,7,8]. Due to the high cost of HBM and its complicated logistics, the process is heavily resource dependent and usually limited to small groups of exposed subjects [4]. The evaluation of the association between the body levels of pollutants and measured external exposures is imperative for the risk assessment of potential hazardous factors at a large population scale.
The link between exposure to ambient pollutants and biomarkers has been reported in multiple occupational health studies. For instance, concentrations of metals, such as Cr, molybdenum (Mo), tungsten (W), and vanadium (V), measured at the workplace were found to be associated with the metal concentrations in welders’ blood and urine [9]. Exposure to manganese (Mn) at work was found to be related to high blood values of Mn [10]. Studies of non-occupational populations were able to establish a link between residence in a polluted area and metal detection in human liquids. For instance, in studies performed in Belgium [11], Korea [12], and France [13], higher concentrations of Pb, Cd, and mercury (Hg) were recorded in blood and urine samples of subjects residing in proximity to industrial zones compared to subjects from the reference areas. Household concentrations of Pb in dust were also positively associated with Pb in samples of infants’ blood and hair [14]. In a study of the adult population via the National Health and Nutrition Examination Survey (NHANES) in 1988–1994 and 1999–2008, Pb values in blood were related to Pb air measurements, while the dose of Pb measured in humans steadily decreased with an overall reduction of ambient Pb [15].
HBM results related to vulnerable populations of elderly, children, and pregnant women are scarce, and, as a result, the concentrations of chemical pollutants are mostly unknown. Yet, extensive research has suggested that maternal exposure to pollution assessed at the ecological level may be followed by a number of possible complications among their offspring, i.e., malformations [16], low birth weight [17,18], metabolic changes [19], kidney complications [20], autism [21], and more.
Bedouin Arabs reside in southern Israel and comprise one-third of the regional population (total 750,000). One-third live in temporary housing, such as tents or shacks, without running water or modern sewage infrastructure. This community is characterized by low socio-economic status [22], a male smoking rate of close to 95% [17,23,24], consanguineous marriages [17,23], and high unemployment [23,25], and residents often develop malformations, respiratory diseases, and other morbidities [24,26].
As we showed previously, pregnant women in this community are characterized by high levels of urinary metals. Traces of aluminum (Al), Arsenic (As), Nickel (Ni), and Cadmium (Cd) were detected in 30% of 140 women in the previously tested sample [27].
In the current investigation, we aim to describe the distribution of 24 metals in urine among pregnant women and attempt to classify them into subgroups. For instance, metals such as sodium (Na), potassium (K), magnesium (Mg), calcium (Ca), zinc (Zn), selenium (Se), and copper (Cu) are necessary for the correct functioning of various body tissues, and therefore can be referred to as biometals or metals that are essential for human physiology [28]. Others can be classified to a category of potentially toxic metals due to an adverse effect they are believed to produce, or empirically, by their chemical or/and physical features.
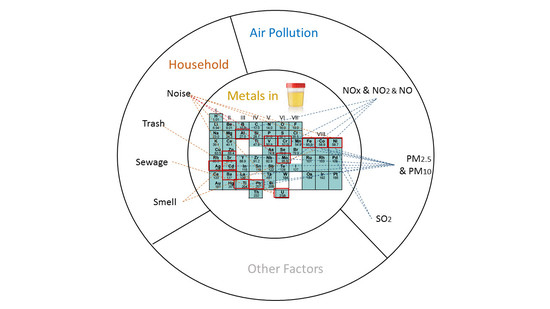
Furthermore, we analyzed the possible sources of exposure to metals in the household and outdoor air of the participants. Specifically, we explored environmental factors present in the household and ambient air pollution at the place of residence. Finally, we evaluated a possible association of those factors with levels of urinary metals.

2. Materials and Methods

We analyzed urine samples collected from 143 pregnant women. All subjects were enrolled upon their arrival for delivery in 2012–2013 in a wider study that aimed to investigate birth outcomes as a function of ambient exposures. The study methodology and results have been reported elsewhere [17,23,25,27]. All women signed an informed consent prior to their enrollment. The current study population is a subset of all women enrolled in the cohort for whom a urine sample was stored until the time of the new laboratory analysis.

2.1. Household Exposure

The questionnaire was completed within 24 h of delivery and included information on demographic characteristics, medical history, and behavioral characteristics. The data collected by the questionnaire provided a detailed description of women’s households, including information regarding the types of heating and cooking, and whether a woman had concerns about factors in her neighborhood, such as noise, proximity of parked cars, sewage, and smell.

2.2. Outdoor Exposure Assessment

The methodology for air pollution assessment has been described elsewhere [17,25]. Briefly, we estimated the levels of ambient air pollutants, i.e., nitrogen oxides (NOx, NO, NO2) and sulphur dioxide (SO2), using the daily averages reported by the monitoring stations in the area. Only estimates from the monitoring stations within a radius of 20 km from the residential address were used in the analysis. The values of particulate matter (PM) of sizes less than 2.5 and 10 μm (PM2.5 and PM10) originated from a spatiotemporally resolved estimation model producing predictions at a 1 × 1 km spatial resolution developed by Kloog et al. [29] The modeling involved calibrating satellite-based observations to relevant PM monitoring data collected within 1 km of a satellite reading and included adjusting to additional spatial and temporal covariates as predictors.

2.3. Laboratory Testing

All urine samples were stored at −20 °C in a freezer until being shipped to the testing laboratory. The specific test used in the current analysis became available in 2019, approximately 6 years after the collection of the samples.
The testing procedure was performed in a trace-metal-clean room, at a laboratory of the Hebrew University in Jerusalem. Vials with 5.0 mL urine samples were transferred into a 5 mL auto-sampler tube. We diluted the content in 4.5 mL 1.5% HNO3 which was accurately weighed. The samples were further incubated at 25 °C overnight. Following the stage of organic material digesting, the metal content of each sample was measured by Agilent 7500 Series Inductively Coupled Plasma Mass Spectrometer (ICP-MS) (Agilent Technologies, Tokyo, Japan).
To determine the optimum gas flow and detection limits, 0.1% HNO3 solution and a multi-element standard solution for ICP (ICP VI, Merck, Darmstadt, Germany) were analyzed. The National Institute of Standards and Technology (NIST) SRM 2668 panel with toxic substances in human urine served as a certified reference for materials at low concentration levels (for elements: argon (Ar), Cd, caesium (Cs), Co, Pb, Va, Ba, Be, chromium (Cr), copper (Cu), Mn, Mo, Ni, plutonium (Pl), titanium (Ti), U, K, Na) and higher concentration levels (for the same elements as at low concentration levels, with the exceptions of Pl, Tn, Ti, and U, as well as antimony (Sb)) for defining trace element levels. The calculation of the final concentrations was calibrated versus NIST panel values within two standard deviations of the standard material.
Accuracy was verified by analysis of standard reference samples (SRS) at the beginning of each analytical session, specifically T-201 and T-209 by the U.S. Geological Survey (USGS). Precision was monitored by analysis of selected standards every 15 samples. Detection limits were defined as three-fold the standard deviation of the calibration blank concentrations analyzed every 15 samples during the course of five analytical sessions.
Testing a non-occupationally exposed population entails using new-generation high sensitivity equipment to detect a presumably low level of environmental exposure, as opposed to most toxicological laboratories, which target high occupational levels of exposure. Consequently, the laboratory technique implemented in the current investigation was considerably more sensitive in the detection of metals compared to the analysis performed in the past on a different subgroup of the same cohort [27]. Levels of quantification (LOQ) of laboratory equipment used in the previous analysis were substantially higher (9, 20, 1.0, and 5 μg/L for Al, As, Cd, and Ni, respectively) compared to approximately 0.01 μg/L obtained for the majority of metals in the current analysis. Values below the LOQ were imputed by the LOQ divided by the square root of two.
Urinary metal concentrations were not adjusted for their dilution by creatinine or relative density, as no significant variation was expected within the study population, which comprised healthy young women.

2.4. Statistical Analysis

The metal concentrations in urine are reported as geometric means with a 95% confidence interval (CI). Household factors were explored by ratio t-test, based on a logarithmic transformation of the metal concentration. Associations between ambient air pollutants and urinary metal concentrations were explored using mixed linear models with the log-transformed concentration of the analyte as the dependent variable and an exposure to a pollutant as an independent covariate. Associations between ambient air pollutants and metals were deemed to be non-linear.
Exposure windows for ambient pollutants were defined as 3 months and 1 months prior to testing (delivery), in which the first overlaps with the last trimester of pregnancy, and the latter captures an ambient exposure estimate closest to the time of urine sampling. Women residing in an area where an average ambient concentration of a pollutant was in the 4th quartile were defined as exposed. To account for a possible spatial bias, the models accounted for clusters of monitoring stations in the case of exposure to NO2, NO, NOx, and SO2, and clusters of towns in exposure to PMs, corresponding to a different resolution in the estimation of each pollutant. The point estimate of an association in both regression types was defined by a prevalence rate (PR) resulting from a lognormal regression.
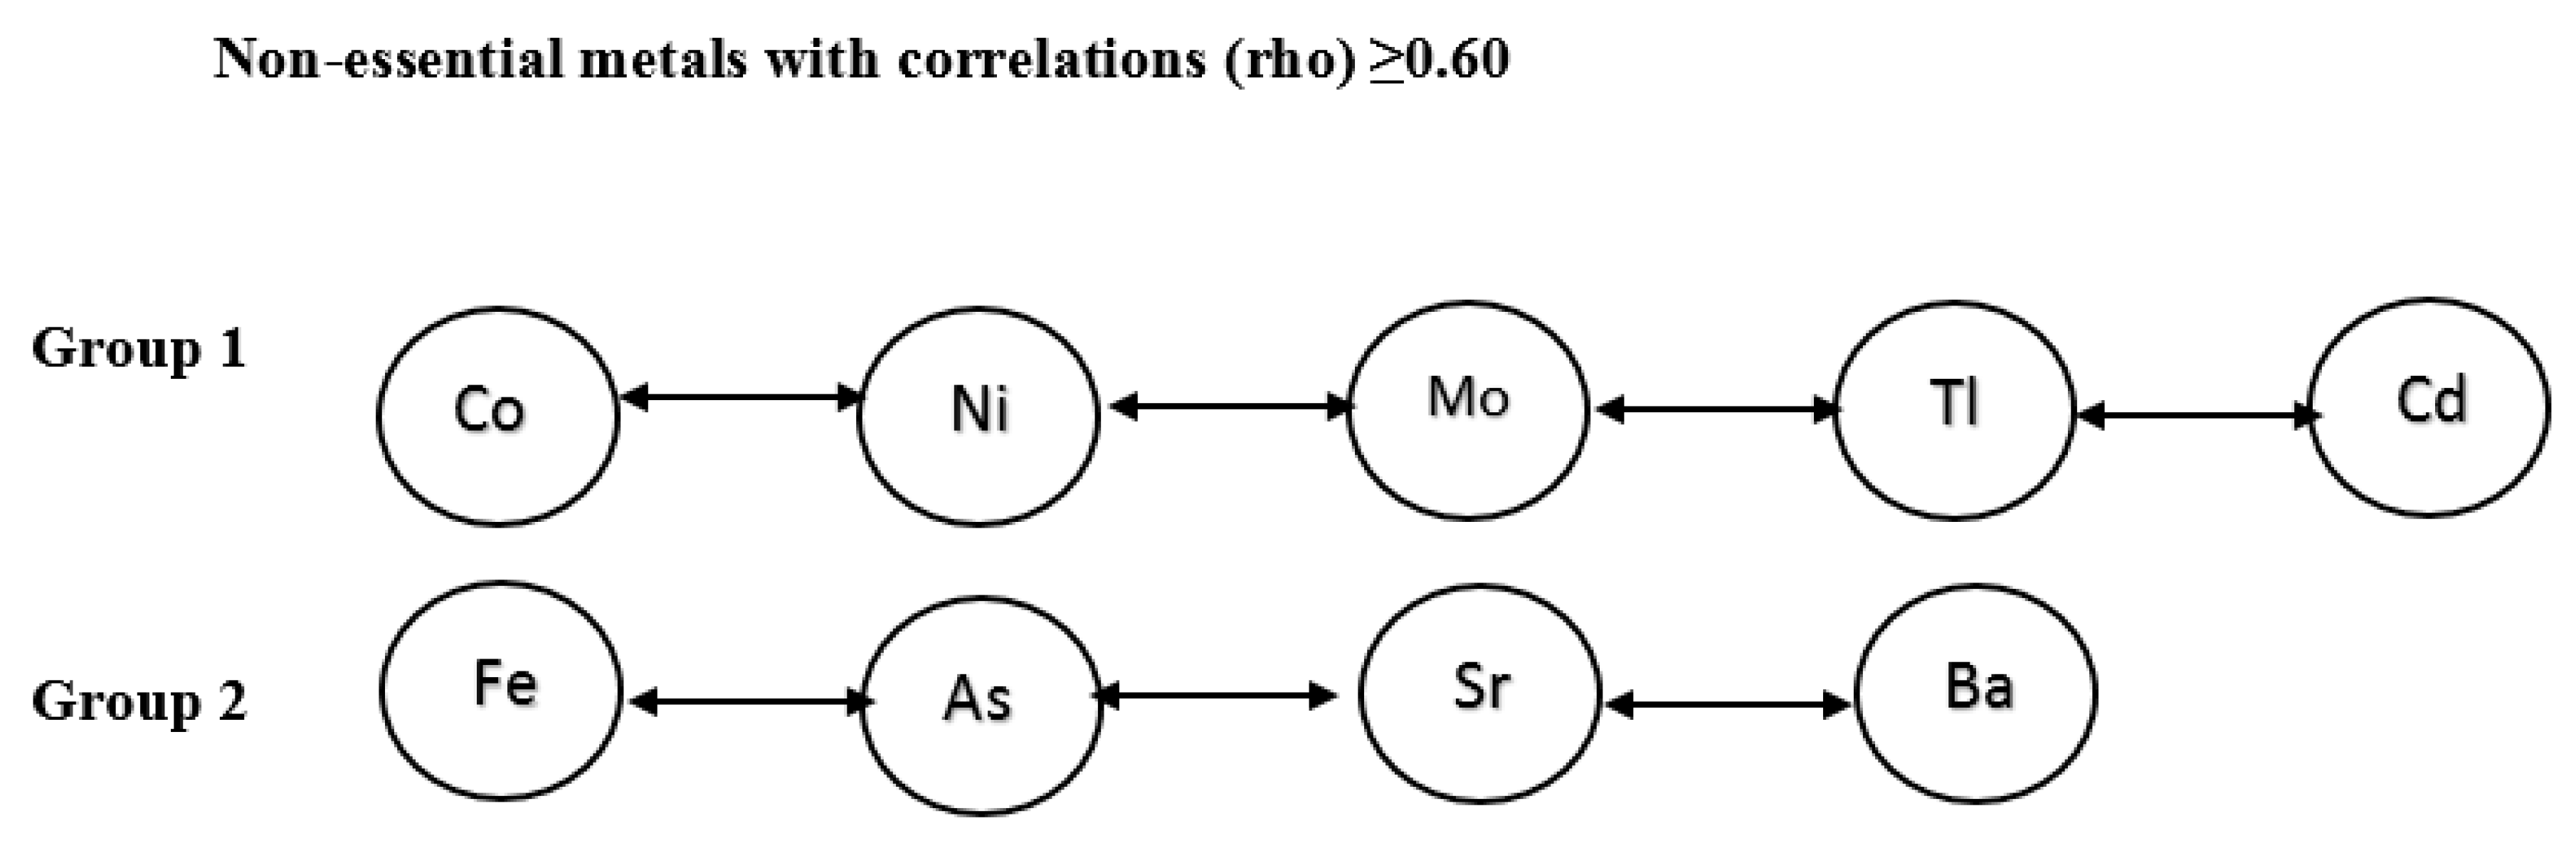
To classify metals, we applied the principal components analysis (PCA) technique, in which principal components (PC) with eigenvalues above one signified groups. In addition to the PCA approach, we calculated pairwise Spearman correlations to identify possible clusters of metals and chose rho estimates ≥0.60 to indicate clinically significant correlations. A chi squared test was used for comparisons between groups, if not stated otherwise.
In view of the relatively small sample size and the explorative nature of the analysis, we allowed p-values below 0.1 to define a statistically significant result. For the same reason, the analysis was not corrected for multiple comparisons. The analysis was performed using SAS 9.4 (Statistical Analysis System).
The study protocol was approved by the Ethics Committee of the Soroka University Medical Center.

3. Results

Women assessed in this analysis were, on average, 28.1 ± 6.1 years old and delivering their fourth child. Newborns were mostly born at term with an average weight of 3256.4 ± 447.4 g (Table 1). We administered the questionnaire to 64.3% of the women (92/143) who could be reached by the study interviewers during their peri-partum hospitalization. Women not interviewed were similar to those who completed the questionnaire in terms of all of the main parameters reported in the hospital database. Almost two-thirds of the participants reported they were married in a consanguineous marriage. Close to 30% of study participants resided in temporary shacks or tents, around 75% cooked on an open fire, 11.7% used an open fire for heating, 19.5% reported using a stove without a chimney, and 9.1% used a stove with a chimney. The remaining participants heated their houses by electricity. Drinking water was stored in the majority of households (89.4%), usually in large or small tanks and, in one-quarter of the study population, in small plastic containers or jerry cans. Around 90% of husbands smoked and the same proportion was employed outside their household. Women usually stayed at home and did not report smoking.
Seven of 24 metals analyzed in the study were defined as biometals (Na, K, Mg, Ca, Zn, Se, and Cu) [20]. We classified the remainder using the PCA approach and Spearman correlations. Specifically, the PCA analysis identified one group with an eigenvalue above 1, containing Co, Ni, Mo, Cd, and Tl, further referred to as “group 1”. The analysis by Spearman correlation (Appendix A, Table A1) supported the PCA findings regarding the group 1 metals and indicated a possibility of forming another group from the Fe, As, Sr, and Ba elements, further referred as “group 2”. Table 2 and Figure 1 presents the final grouping of metals and Table 3 shows their distribution in urine. To reference the obtained concentrations with published values, we compared our findings to the reported levels for the female population in the NHANES cohort [30].
We further explored possible sources of metals measured in urine by household factors and ambient air pollution at three and one months prior to delivery. Table 4 shows the association of urinary metal levels and the household characteristics associated with metal concentrations at a significance level of ≤0.1. Women complaining about noise were more likely to have a higher concentration of the metals (Cu, Co, Ni, Mo, Cd, U, and V), with values increasing by a factor in a range of 1.42–9.43. Complaints about dust were linked to increased values of predominantly essential metals, i.e., Na, K, Se, and Zn. Similarly, complaints about smell were associated with higher essential urinary metals, i.e., Na, K, Se, Zn, and Cu, in addition to metals such as Co and Sr. Complaints about rubbish and sewage in the neighborhood were associated with higher U concentrations (PR = 1.46 and PR = 1.18, respectively). Heating by open fire was not found to be related to metal concentrations in urine, but women heating using a wood stove without a chimney were more likely to have higher concentrations of U (PR = 1.20) and Fe (PR = 9.63), and lower Be and Cr. Water storage in large and small tanks was associated with higher urinary metal content (Se, Cd, Tl). For instance, women residing in a tent or shack had lower levels of Ni, Cd, and Cr, and women reporting cooking on an open fire were more likely to have lower Ni, Pb, and Cr. Smoking by husband (secondhand exposure) was not associated with increased levels of any of the metals.
The air pollutants levels averaged for three and one months prior to delivery/sample collection are presented in Table 5. The median daily level of NO2 in the study population was around 9.91 (±1.59) ppb, and of PM2.5 and PM10 were 20.74 (±2.19) and 44.33 (±9.57) µg/m3, respectively. The average daily temperatures during the study were in the range 23.34–28.17 °C (data not shown). Not all women (49/143) could be characterized by an ambient pollution estimate, because their residence was not within a 20-km radius of a monitoring station and/or due to an inability to verify their exact location, which is frequently the case for women living in temporary tents or shacks.
To explore the links between urinary metal content and ambient air pollutants, we considered the average daily exposure to each pollutant being in the fourth quartile and two possible exposure windows, of one and three months prior to delivery. We present results separately for gaseous pollutants and particulate matter, presuming different patterns of exposure. The exposure to gaseous pollutants above the 75th percentile within three months prior to delivery was associated with higher levels of metals in urine. Specifically, exposure to NOx in its fourth quartile was associated with higher Ni, Al, Pb, and Cr concentrations; the highest point estimate was recorded for Pb, PR = 5.82, similar to those of NO2 and NO. The latter was also associated with higher Ba (PR = 2.39). Exposure to the same pollutants (NOx, NO2, and NO) averaged only for the last month before pregnancy was not associated with urinary metal content. Residing in an area with SO2 being in the highest quartile was associated with higher Co, Ni, and Cr when averaged over one month prior to sampling, and with higher As if a longer window period of three months was considered (Table 6).
Subjects residing within three months prior to the delivery in an area with PM2.5 above the 75th percentile were more likely to have higher concentrations of Co, Ni, Tl, Pb, Fe, and Sr. Higher PM10 was similarly associated with Pb, Fe, and Sr and with Ba, Ag, and Cr. The magnitude of association with Pb, Fe, and Sr was higher for PM10 than for PM2.5, and was particularly high when averaged over one month prior to sampling, reaching PR = 41.08 for Pb. Biometals, such as Mg and Ca, were positively related to exposure to PMs of both sizes, 2.5 and 10 μm (Table 6).
Comparing between the exposure windows, an exposure averaged over the three-month period was more pertinent for studying an association with NOx-related pollutants and PM2.5. The exposure averaged over the one-month period was more relevant for its association with SO2. The association between PM10 and metals did not vary between exposure windows.

4. Discussion

Using a novel laboratory technology, we were able to quantify all of the 24 metals tested in the study population with residential exposure. Urinary metal concentrations were mostly within the same range as the urinary metal content in women in the NHANES cohort.
Levels of metals varied with household factors, e.g., women complaining about noise, smell, rubbish, and sewage next to their house were more likely to have high concentrations of non-essential and potentially toxic metals. Exposure to disturbing noises and smells may suggest a presence of other common sources in the environment, which, in turn, might be directly related to increased concentrations of Cu, Co, Ni, Mo, and Cd; the latter four of these are recognized as industry-related trace metals. On the other hand, factors such as noise, smell, rubbish and sewage may be the attributes of a low socio-economic neighborhood and imply that its residents are probably exposed to other toxic sources in their surrounding area that can potentially affect their urine concentrations.
In certain cases, exposure to a factor that was expected to increase a metal content in urine appeared to be linked to lower values, e.g., cooking on an open fire or living in a temporary shack were associated with lower concentrations of Ni, Cd, Pb, or Cr. Although these findings may appear a contradiction, they most probably indicate that women with high concentrations of these metals resided in permanent houses (as shown in Table 3) and were not exposed to hazardous environments in their immediate household, but rather those in their neighborhood, via sewage, rubbish, etc. Indeed, women residing in permanent housing were more inclined to complain about the neighborhood factors (p-value < 0.001, data not shown).
As opposed to investigating self-reported hazards possibly related to personal attitudes, the level of ambient air pollutants is an objectively measured exposure. By analyzing the association between these two health hazards, we recorded multiple statistical associations, especially for the non-essential metals. The most noticeable finding was for women exposed to the fourth quartile of NOx and/or PM10 in the three months before delivery, for whom Pb concentrations were 5.82 and 23.59 times higher compared to all others, respectively. Although the magnitude of an association estimate might seem physiologically high, it is the direct derivative of its extremely wide range of Pb levels (0.01–62.02). A small number of previous studies analyzing pollution-biomarker associations showed similar results [11,12,13,14,15]; however, none of the studies used an ambient pollutant, e.g., PMs or NOx, as an indicator of the exposure, but utilized a proximity to a certain metal industry instead.
The current study has a number of limitations. First, the sample size of 143 is relatively small. However, it is comparable to similar HBM studies, and probably sufficient for indicating clinically significant signals for a link between metal content in body fluids and environmental factors. Second, questionnaires were not completed by a portion of our population due to deliveries taking place during weekends or holidays, and/or short hospitalization stays, when our research staff could not reach all enrolled subjects. On the other hand, enrollment at delivery rooms ensured sampling from the general population of Arab-Bedouin women and, therefore, reduced the possibility of selection bias. Furthermore, the questionnaire did not assess food and water sources, which could have contributed to high values of some of the metals. Lastly, our analysis is prone to type one errors due to setting the significance level to 10% and the conducting of multiple comparisons. However, we believe that a departure from the strict statistical assumptions is acceptable owing to the exploratory nature of our investigation.
The current investigation benefits from combining multiple layers of information relating to households, ambient environment, and medical charts available for the majority of the population, which provided a maximally granulated description of our subjects. Additionally, we used a sensitive laboratory method allowing a complete description of metal ranges in urine.

5. Conclusions

To conclude, in the current analysis we estimated the link between women’s household and outdoor environments with actual doses of absorbed pollution, as measured by urinary metal content. This is the first biomonitoring study set in Israel that has tested for an extensive list of 24 metals. Our findings shed a light on the extent of toxic exposure within the population of pregnant women and indicate the possibility of a link between environmental exposure and the absorbed amount of toxin in the form of metals. Nonetheless, the study conclusions should be treated with caution due principally to the study’s relatively small sample.
Further investigation of this topic is warranted, focusing on the potential relationship of maternal and pediatric morbidity with the toxic effect of metals.

Author Contributions

Conceptualization, I.K. (Isabella Karakis), D.L., B.S. and LN. Data curation, O.T. and I.K. (Itai Kloog); Formal analysis, N.S., I.K. (Itai Kloog) and L.N.; Funding acquisition, B.S. and L.N.; Investigation, N.S., O.T. and R.G.; Methodology, I.K. (Isabella Karakis), O.T., D.L., R.G., B.S. and L.N.; Project administration, D.L., R.G. and M.Y.-S.; Supervision, I.K. (Isabella Karakis), D.L. and L.N; Visualization, L.N.; Writing—original draft, L.N.; Writing—review & editing, I.K. (Isabella Karakis), N.S., O.T., D.L., M.Y.-S., I.K. (Itai Kloog) and B.S. All authors have read and agreed to the published version of the manuscript.

Funding

This research was funded by the Public Committee for Allocation of Estate Funds, Ministry of Health, Israel. grant number 3-7298.

Conflicts of Interest

The authors declare no conflict of interest.

Appendix A

Table A1. Spearman correlation between metals’ concentrations in the study population (n = 143 subjects). 1
NaKMgCaSeZnCuLiCoNiTlAlCrSrBaCdBeVAsFeMoMnAgPbU
Na, ppm
K, ppm0.52
Mg, ppm0.450.39
Ca, ppm0.580.400.57
Se, ppb0.680.690.580.55
Zn, ppb0.480.540.530.390.63
Cu, ppb0.540.630.500.330.710.72
Li, ppb0.590.600.650.560.780.550.63
Co, ppb0.550.600.520.440.630.470.510.57
Ni, ppb0.580.660.530.490.670.610.590.590.85
Tl, ppb0.510.510.340.250.630.470.400.400.360.49
Al, ppb0.220.190.320.120.250.360.300.040.140.240.45
Cr, ppb0.430.280.450.330.550.360.380.400.320.280.320.29
Sr, ppb0.560.360.640.870.500.430.390.610.460.490.260.100.29
Ba, ppb0.400.240.520.610.490.470.340.500.270.260.200.110.540.63
Cd, ppb0.510.560.310.300.520.550.620.330.380.550.640.490.200.360.11
Be, ppb0.470.320.380.360.420.270.330.430.360.250.02−0.030.330.370.330.06
V, ppb0.530.460.450.410.570.500.540.530.350.480.580.430.250.400.330.450.05
As, ppb0.480.540.500.420.640.480.570.610.420.520.500.330.330.460.370.530.190.48
Fe, ppb0.360.410.420.540.380.450.410.390.250.380.270.340.180.510.480.360.100.540.63
Mo, ppb0.500.470.370.400.560.460.510.480.430.600.640.360.200.460.140.760.000.520.580.41
Mn, ppb−0.07−0.11−0.02−0.13−0.140.02−0.09−0.19−0.06−0.010.200.37−0.04−0.06−0.030.05−0.300.290.000.190.10
Ag, ppb0.210.150.180.230.120.110.040.150.040.190.410.17−0.100.220.090.16−0.250.540.220.370.330.47
Pb, ppb0.180.180.270.210.230.200.140.130.210.230.390.420.400.230.310.21−0.190.490.270.400.300.490.49
U, ppb0.220.260.030.070.220.200.270.120.070.200.300.350.170.100.030.56−0.040.160.290.230.430.01−0.090.09
1 The numbers shown in bold indicate correlation estimates ≥ 0.6.

References

  1. González-Casanova, J.E.; Pertuz-Cruz, S.L.; Caicedo-Ortega, N.H.; Rojas-Gomez, D.M. Adipogenesis Regulation and Endocrine Disruptors: Emerging Insights in Obesity. BioMed Res. Int. 2020, 2020, 7453786. [Google Scholar] [CrossRef] [PubMed]
  2. Son, E.S.; Park, J.W.; Kim, Y.J.; Jeong, S.H.; Hong, J.H.; Kim, S.H.; Kyung, S.Y. Effects of antioxidants on oxidative stress and inflammatory responses of human bronchial epithelial cells exposed to particulate matter and cigarette smoke extract. Toxicol. In Vitro 2020, 104883. [Google Scholar] [CrossRef] [PubMed]
  3. Brokamp, C.; Brandt, E.B.; Ryan, P.H. Assessing exposure to outdoor air pollution for epidemiological studies: Model-based and personal sampling strategies. J. Allergy Clin. Immunol. 2019, 143, 2002–2006. [Google Scholar] [CrossRef] [PubMed]
  4. Louro, H.; Heinälä, M.; Bessems, J.; Buekers, J.; Vermeire, T.; Woutersen, M.; van Engelen, J.; Borges, T.; Rousselle, C.; Ougier, E.; et al. Human biomonitoring in health risk assessment in Europe: Current practices and recommendations for the future. Int. J. Hyg. Environ. Health 2019, 222, 727–737. [Google Scholar] [CrossRef]
  5. Di Ciaula, A.; Gentilini, P.; Diella, G.; Lopuzzo, M.; Ridolfi, R. Biomonitoring of Metals in Children Living in an Urban Area and Close to Waste Incinerators. Int. J. Environ. Res. Public Health 2020, 17, 1919. [Google Scholar] [CrossRef] [Green Version]
  6. Pourchet, M.; Debrauwer, L.; Klanova, J.; Price, E.J.; Covaci, A.; Caballero-Casero, N.; Oberacher, H.; Lamoree, M.; Damont, A.; Fenaille, F.; et al. Suspect and non-targeted screening of chemicals of emerging concern for human biomonitoring, environmental health studies and support to risk assessment: From promises to challenges and harmonisation issues. Environ. Int. 2020, 139, 105545. [Google Scholar] [CrossRef]
  7. Dereumeaux, C.; Saoudi, A.; Pecheux, M.; Berat, B.; de Crouy-Chanel, P.; Zaros, C.; Brunel, S.; Delamaire, C.; le Tertre, A.; Lefranc, A.; et al. Biomarkers of exposure to environmental contaminants in French pregnant women from the Elfe cohort in 2011. Environ. Int. 2016, 97, 56–67. [Google Scholar] [CrossRef]
  8. Dereumeaux, C.; Fillol, C.; Charles, M.A.; Denys, S. The French human biomonitoring program: First lessons from the perinatal component and future needs. Int. J. Hyg. Environ. Health 2017, 220, 64–70. [Google Scholar] [CrossRef]
  9. Ellingsen, D.G.; Chashchin, M.; Berlinger, B.; Fedorov, V.; Chashchin, V.; Thomassen, Y. Biological monitoring of welders’ exposure to chromium, molybdenum, tungsten and vanadium. J. Trace Elem. Med. Biol. 2017, 41, 99–106. [Google Scholar] [CrossRef]
  10. Mirmohammadi, S.; Moghaddasi, Y.; Yazdani, J.; Yousefinejad, R.; Esfandyari, Y.; Gorgani, M.; Habibpour, M. Correlation between airborne manganese concentration at the workstations in the iron foundry and manganese concentration in workers’ blood. Med. Pr. 2017, 68, 449–458. [Google Scholar] [CrossRef] [Green Version]
  11. Fierens, S.; Mairesse, H.; Heilier, J.F.; Focant, J.F.; Eppe, G.; De Pauw, E.; Bernard, A. Impact of iron and steel industry and waste incinerators on human exposure to dioxins, PCBs, and heavy metals: Results of a cross-sectional study in Belgium. J. Toxicol. Environ. Health A 2007, 70, 222–226. [Google Scholar] [CrossRef] [PubMed]
  12. Sung, J.H.; Oh, I.; Kim, A.; Lee, J.; Sim, C.S.; Yoo, C.; Park, S.J.; Kim, G.B.; Kim, Y. Environmental and Body Concentrations of Heavy Metals at Sites Near and Distant from Industrial Complexes in Ulsan, Korea. J. Korean Med. Sci. 2018, 33, e33. [Google Scholar] [CrossRef] [PubMed] [Green Version]
  13. Tagne-Fotso, R.; Leroyer, A.; Howsam, M.; Dehon, B.; Richeval, C.; Nisse, C. Members of Health Examination Centres of Nord-Pas-de-Calais Region Network. Current sources of lead exposure and their relative contributions to the blood lead levels in the general adult population of Northern France: The IMEPOGE Study, 2008–2010. J. Toxicol. Environ. Health A 2016, 79, 245–265. [Google Scholar] [CrossRef]
  14. Zota, A.R.; Riederer, A.M.; Ettinger, A.S.; Schaider, L.A.; Shine, J.P.; Amarasiriwardena, C.J.; Wright, R.O.; Spengler, J.D. Associations between metals in residential environmental media and exposure biomarkers over time in infants living near a mining-impacted site. J. Expo. Sci. Environ. Epidemiol. 2016, 26, 510–519. [Google Scholar] [CrossRef] [PubMed] [Green Version]
  15. Richmond-Bryant, J.; Meng, Q.; Davis, A.; Cohen, J.; Lu, S.E.; Svendsgaard, D.; Brown, J.S.; Tuttle, L.; Hubbard, H.; Rice, J.; et al. The influence of declining air lead levels on blood lead-air lead slope factors in children. Environ. Health Perspect. 2014, 122, 754–760. [Google Scholar] [CrossRef] [Green Version]
  16. Baldacci, S.; Gorini, F.; Santoro, M.; Pierini, A.; Minichilli, F.; Bianchi, F. Environmental and individual exposure and the risk of congenital anomalies: A review of recent epidemiological evidence. Epidemiol. Prev. 2018, 42, 1–34. [Google Scholar] [CrossRef]
  17. Landau, D.; Novack, L.; Yitshak-Sade, M.; Sarov, B.; Kloog, I.; Hershkovitz, R.; Grotto, I.; Karakis, I. Nitrogen Dioxide pollution and hazardous household environment: What impacts more congenital malformations. Chemosphere 2015, 139, 340–348. [Google Scholar] [CrossRef]
  18. Westergaard, N.; Gehring, U.; Slama, R.; Pedersen, M. Ambient air pollution and low birth weight-are some women more vulnerable than others? Environ. Int. 2017, 104, 146–154. [Google Scholar] [CrossRef]
  19. Russ, K.; Howard, S. Developmental Exposure to Environmental Chemicals and Metabolic Changes in Children. Curr. Probl. Pediatr. Adolesc. Health Care 2016, 46, 255–285. [Google Scholar] [CrossRef]
  20. Skröder, H.; Hawkesworth, S.; Moore, S.E.; Wagatsuma, Y.; Kippler, M.; Vahter, M. Prenatal lead exposure and childhood blood pressure and kidney function. Environ. Res. 2016, 151, 628–634. [Google Scholar] [CrossRef]
  21. Posar, A.; Visconti, P. Autism in 2016: The need for answers. J. Pediatr. 2017, 93, 111–119. [Google Scholar] [CrossRef] [PubMed] [Green Version]
  22. Sarov, B.; Bentov, Y.; Kordysh, E.; Karakis, I.; Bolotin, A.; Hershkovitz, R.; Belmaker, I. Perinatal mortality and residential proximity to an industrial park. Arch. Environ. Occup. Health 2008, 63, 17–25. [Google Scholar] [CrossRef] [PubMed]
  23. Karakis, I.; Sarov, B.; Landau, D.; Manor, E.; Yitshak-Sade, M.; Rotenberg, M.; Hershkovitz, R.; Grotto, I.; Gurevich, E.; Novack, L. Association between prenatal exposure to metals and neonatal morbidity. J. Toxicol. Environ. Health A 2014, 77, 1281–1284. [Google Scholar] [CrossRef]
  24. Yitshak-Sade, M.; Novack, V.; Katra, I.; Gorodischer, R.; Tal, A.; Novack, L. Non-anthropogenic dust exposure and asthma medication purchase in children. Eur. Respir. J. 2015, 45, 652–660. [Google Scholar] [CrossRef] [PubMed]
  25. Yitshak-Sade, M.; Novack, L.; Landau, D.; Kloog, I.; Sarov, B.; Hershkovitz, R.; Karakis, I. Relationship of ambient air pollutants and hazardous household factors with birth weight among Bedouin-Arabs. Chemosphere 2016, 160, 314–322. [Google Scholar] [CrossRef]
  26. Kordysh, E.; Karakis, I.; Belmaker, I.; Vardi, H.; Bolotin, A.; Sarov, B. Respiratory morbidity in hospitalized Bedouins residing near an industrial park. Arch. Environ. Occup. Health. 2005, 60, 147–155. [Google Scholar] [CrossRef] [PubMed]
  27. Karakis, I.; Landau, D.; Yitshak-Sade, M.; Hershkovitz, R.; Rotenberg, M.; Sarov, B.; Grotto, I.; Novack, L. Exposure to metals and congenital anomalies: A biomonitoring study of pregnant Bedouin-Arab women. Sci. Total Environ. 2015, 517, 106–112. [Google Scholar] [CrossRef]
  28. Pokusa, M.; Kráľová Trančíková, A. The Central Role of Biometals Maintains Oxidative Balance in the Context of Metabolic and Neurodegenerative Disorders. Oxid. Med. Cell. Longev. 2017, 2017, 8210734. [Google Scholar] [CrossRef]
  29. Rosenfeld, A.; Dorman, M.; Schwartz, J.; Novack, V.; Just, A.C.; Kloog, I. Estimating daily minimum, maximum, and mean near surface air temperature using hybrid satellite models across Israel. Environ. Res. 2017, 159, 297–312. [Google Scholar] [CrossRef]
  30. Centers for Disease Control and Prevention. National Report on Human Exposure to Environmental Chemicals. 2019. Available online: https://www.cdc.gov/exposurereport/index.html (accessed on 19 May 2020).
Figure 1. Classification of metals.
Atmosphere 11 00638 g001
Table 1. Study Population.
Subjects’ CharacteristicsN = 143 Subjects
Demographic and delivery relevant factors
Age, years
Mean ± SD (n)28.1 ± 6.1 (141)
Median26.8
Min; Max18.4; 41.7
Smoking, % (n/N)1.2 (1/82)
Employed, % (n/N)5.8 (5/86)
Parity
Mean ± SD (n)4.2 ± 2.9 (134)
Median4.0
Min; Max1.0; 12.0
Gestational Age, weeks
Mean ± SD (n)39.4 ± 1.7 (138)
Median39.0
Min; Max32.0; 44.0
Infant Weight, grams
Mean ± SD (n)3256.4 ± 447.4 (138)
Median3300.0
Min; Max1725.0; 4165.0
Questionnaire (at least partially filled) available, % (n/N)64.3 (92/143)
Consanguineous marriage, % (n/N)62.9 (44/70)
Household environment
Residence in tent or shack, % (n/N)29.9 (23/77)
Family owns a car, % (n/N)91.3 (63/69)
Husband smokes, % (n/N)90.5 (76/84)
Husband employed, % (n/N)88.1 (74/84)
Complaints on, % (n/N)
Smell87.0 (67/77)
Dust85.7 (66/77)
Noise11.7 (9/77)
Trash9.1 (7/77)
Sewage22.1 (17/77)
Transport41.6 (32/77)
Cooking on open fire, % (n/N)74.7 (53/71)
Heating by, % (n/N)
Stove with chimney9.1 (7/77)
Stove without chimney19.5 (15/77)
By open fire11.7 (9/77)
Chemical fertilizer, % (n/N)2.9 (2/70)
Water storage, %(n/N)
Stored89.4 (76/85)
Storage type
Large tanks25.3 (19/75)
Small tanks50.7 (38/75)
Jerrycans24.0 (18/75)
Table 2. Classification of metals.
BiometalsNon-Essential Metals. Grouping Based on PCA and Correlation Analysis:
Group 1Group 2Other Metals
sodium (Na)cobalt (Co)iron (Fe)aluminum (Al)
potassium (K)nickel (Ni)arsenic (As)beryllium (Be)
magnesium (Mg)molybdenum (Mo)strontium (Sr)chromium (Cr)
calcium (Ca)thallium (Tl)barium (Ba)vanadium (V)
zinc (Zn)cadmium (Cd) manganese (Mn)
selenium (Se) silver (Ag)
copper (Cu) lead (Pb)
uranium (U)
Table 3. Metal urine concentrations in the study population.
GroupMetal (n = 143)Geometric Mean95% CIMaximumUrinary Measurements in NHANES 1 Cohort, Presented as Geometric Mean and 95% CI
BiometalsNa, ppm1756.981129.24; 2733.6910,832.98Not available
K, ppm1059.61691.71; 1623.186647.87Not available
Mg, ppm16.8611.15; 25.49160.22Not available
Ca, ppm22.5514.88; 34.18329.96Not available
Se, ppb20.4815.16; 27.67226.59Females 2015–2016: 189.0 (185.0–193.0)
Zn, ppb159.99109.22; 234.354862.63Available only in blood
Cu, ppb12.779.51; 17.142861.69Available only in blood
Group 1Co, ppb0.950.77; 1.175.06Available only in blood
Ni, ppb1.281.03; 1.598.31Not available
Mo, ppb7.674.38; 13.41604.57Females 2015–2016: 31.8 (28.8–35.1)
Cd, ppb0.210.17; 0.262.75Females 2015–2016: 0.14 (0.12–0.15)
Tl, ppb0.040.03; 0.050.62Females 2015–2016: 0.14 (0.13–0.16)
Group 2Fe, ppb1.720.87; 3.411640.82Not available
As, ppb4.132.80; 6.08192.18Females 2015–2016: 7.19 (6.54–7.89)
Sr, ppb79.8656.03; 113.831158.26Females 2015–2016: 77.6 (70.5–85.4)
Ba, ppb1.440.49; 0.93337.47Females 2015–2016: 1.35 (1.26–1.45)
Other metalsAl, ppb6.954.63; 10.43412.43Not available
Be, ppb0.120.09; 0.172.63Females 2009–2010: <LOD 2, 95th perc <LOD 2
Cr, ppb0.670.49; 0.9310.09Females 2015–2016: <LOD 2, 95th perc:1.08
V, ppb0.050.04; 0.061.37Not available
Mn, ppb0.020.02; 0.036.22Females 2015–2016: <LOD 2, 95th perc: 0.35
Ag, ppb0.050.03; 0.0717.13Not available
Pb, ppb0.170.10; 0.2962.02Females 2015–2016: 0.26 (0.236–0.29)
U, ppb0.010.01; 0.010.11Not available
1 National Health and Nutrition Examination Survey (NHANES); 2 Limit of detection.
Table 4. Association between household environment and internal dose of metals expressed as prevalence ratio (PR) and p-value 1,2.
Metal Types Metal Complaints on Environmental FactorHeating by:Cooking on Open Fire (53/77)Water Stored (76/85)Water Stored in:
Living in Tent/Shack (23/77)Noise (9/77)Dust (66/77)Trash (7/77)Sewage (17/77)Smell (67/77)Wood Stove, no Chimney (15/77)Open Fire (9/77)Large Tanks (19/75)Small Tanks (38/75)Jerrycans (18/75)
BiometalsNa, ppm0.22 (0.041) 7.66 (0.034) 10.93 (0.016)
K, ppm0.22 (0.031) 6.71 (0.039) 8.15 (0.029)
Mg, ppm
Ca, ppm
Se, ppb0.41 (0.076) 3.21 (0.073) 4.04 (0.039) 2.19 (0.099)
Zn, ppb 5.71 (0.035) 5.33 (0.052)
Cu, ppb0.37 (0.046)3.54 (0.073) 4.50 (0.025)
Non-essential metalsGroup 1Co, ppb 2.42 (0.069) 2.55 (0.044) 0.47 (0.073)
Ni, ppb0.52 (0.068)2.61 (0.061) 0.56 (0.081)0.46 (0.080)
Mo, ppb 9.43 (0.081)
Cd, ppb0.50 (0.045)2.73 (0.039) 1.74 (0.090)0.38 (0.010)
Tl, ppb 1.89 (0.063)0.51 (0.096)
Group 2Fe, ppb 9.63 (0.052)
As, ppb
Sr, ppb 6.27 (0.017)
Ba, ppb
Other metalsAl, ppb
Be, ppb 0.29 (0.042)
Cr, ppb0.38 (0.065) 0.35 (0.083) 0.27 (0.014)
V, ppb 3.28 (0.055)
Mn, ppb 0.26 (0.086)
Ag, ppb
Pb, ppb 0.17 (0.064)
U, ppb 1.42 (0.002) 1.46 (0.003)1.18 (0.061) 1.20 (0.048)
1 The table presents a prevalence ratio (PR) reflecting a multiplicative change in metal concentrations following an increase in the factors by one unit. As all the factors are dichotomous, the PR shows an increase in a metal concentration in a subject exposed to an environmental factor compared to a subject not exposed to it. 2 The table shows only the statistically significant results (p-value ≤ 0.1); p-values are shown in parenthesis.
Table 5. Association between gaseous air pollutants (4th quartile) at one and three months prior to delivery with urinary concentrations of metals 1.
MetalNOx, ppbNO2, ppbNO, ppbSO2, ppm
Mean ± SD (n)11.55 ± 2.21 (94)9.91 ± 1.59 (94)1.72 ± 0.64 (94)0.29 ± 0.17 (94)
Median11.5610.011.720.30
Q1, Q310.13; 13.428.97; 11.291.13; 2.300.14; 0.37
Min; Max5.69; 15.145.50; 12.390.65; 3.250.02; 0.64
Prevalence ratio (PR) shows a multiplicative change in the internal dose of a metal as a function of the exposure to levels of ambient pollutant in the 4th quartile vs all others (p-value) 1
Three months priorOne month priorThree months priorOne month priorThree months priorOne month priorThree months priorOne month prior
BiometalsNa, ppm
K, ppm
Mg, ppm 3.26 (0.045)2.76 (0.079) 3.30 (0.042)
Ca, ppm2.82 (0.069)2.62 (0.091)2.74 (0.077)
Se, ppb 2.22 (0.097)
Zn, ppb
Cu, ppb
Non-essential metalsGroup 1Co, ppb 1.98 (0.035)
Ni, ppb1.84 (0.074) 1.80 (0.084) 1.88 (0.064)
Mo, ppb
Cd, ppb
Tl, ppb
Group 2Fe, ppb
As, ppb 2.89 (0.069)
Sr, ppb
Ba, ppb 2.39 (0.062)
Other metalsAl, ppb3.13 (0.067) 2.91 (0.087)
Be, ppb
Cr, ppb2.90 (0.041) 2.53 (0.076) 4.88 (0.002) 3.14 (0.025)
V, ppb
Mn, ppb
Ag, ppb 5.85 (0.025)
Pb, ppb5.82 (0.025)
U, ppb
1 The table shows only the statistically significant results (p-value ≤ 0.1).
Table 6. Association between particulate matter (4th quartile) and urinary concentrations of metals, three months and one month prior to delivery.
MetalPM2.5, µg/m3PM10, µg/m3
Mean ± SD (n)20.97 ± 2.19 (88)44.76 ± 9.57 (88)
Median20.6243.05
Q1, Q318.97; 23.0936.54; 53.21
Min; Max17.84; 26.3630.54; 68.64
Prevalence ratio (PR) showing a multiplicative change in the internal dose of a metal as a function of the exposure to levels of ambient pollutant in the 4th quartile vs all others.
PR(PM2.5) (p-value) 1PR(PM10) (p-value) 1
Three months prior One month prior Three months prior One month prior
BiometalsNa, ppm
K, ppm
Mg, ppm5.17 (0.011) 4.68 (0.019)3.65 (0.046)
Ca, ppm5.50 (0.007) 5.17 (0.011)
Se, ppb
Zn, ppb
Cu, ppb
Non-essential metalsGroup 1Co, ppb1.97 (0.047)
Ni, ppb2.27 (0.023)
Mo, ppb
Cd, ppb
Tl, ppb2.17 (0.054)
Group 2Fe, ppb7.82 (0.049) 13.64 (0.013)8.40 (0.042)
As, ppb
Sr, ppb2.93 (0.059) 3.22 (0.043)
Ba, ppb 3.53 (0.019)3.27 (0.025)
Other metalsAl, ppb
Be, ppb
Cr, ppb 3.53 (0.004)4.04 (0.002)
V, ppb
Mn, ppb 2.38 (0.085)
Ag, ppb 4.01 (0.057)5.45 (0.017)
Pb, ppb4.07 (0.099) 23.59 (<0.001)41.08 (<0.001)
U, ppb
1 The table shows only the statistically significant results (p-value ≤ 0.1).

