Article

Emerging Role of Oxidative Stress on EGFR and OGG1-BER Cross-Regulation: Implications in Thyroid Physiopathology

by
Carmelo Moscatello
1,
Maria Carmela Di Marcantonio
2,
Luca Savino
2,
Emira D’Amico
1,
Giordano Spacco
1,
Pasquale Simeone
3,4,
Paola Lanuti
3,4,
Raffaella Muraro
2,
Gabriella Mincione
2,
Roberto Cotellese
1,5 and
Gitana Maria Aceto
1,*
1
Department of Medical, Oral and Biotechnological Sciences, University “G. d’Annunzio” Chieti-Pescara, Via dei Vestini 31, 66100 Chieti, Italy
2
Department of Innovative Technologies in Medicine & Dentistry, University “G. d’Annunzio”, Chieti-Pescara, Via dei Vestini 31, 66100 Chieti, Italy
3
Department of Medicine and Aging Sciences, University “G. d’Annunzio”, Chieti-Pescara, 66100 Chieti, Italy
4
Center for Advanced Studies and Technology (C.A.S.T.) at University “G. d’Annunzio”, Chieti-Pescara, 66100 Chieti, Italy
5
Villa Serena Foundation for Research, 66013 Pescara, Italy
*
Author to whom correspondence should be addressed.
Cells 2022, 11(5), 822; https://doi.org/10.3390/cells11050822
Submission received: 30 November 2021 / Revised: 17 February 2022 / Accepted: 23 February 2022 / Published: 26 February 2022
(This article belongs to the Special Issue The DNA Damage Response in Cell Physiology and Disease)

Abstract

:
Thyroid diseases have a complex and multifactorial aetiology. Despite the numerous studies on the signals referable to the malignant transition, the molecular mechanisms concerning the role of oxidative stress remain elusive. Based on its strong oxidative power, H2O2 could be responsible for the high level of oxidative DNA damage observed in cancerous thyroid tissue and hyperactivation of mitogen-activated protein kinase (MAPK) and PI3K/Akt, which mediate ErbB signaling. Increased levels of 8-oxoG DNA adducts have been detected in the early stages of thyroid cancer. These DNA lesions are efficiently recognized and removed by the base excision repair (BER) pathway initiated by 8-oxoG glycosylase1 (OGG1). This study investigated the relationships between the EGFR and OGG1-BER pathways and their mutual regulation following oxidative stress stimulus by H2O2 in human thyrocytes. We clarified the modulation of ErbB receptors and their downstream pathways (PI3K/Akt and MAPK/ERK) under oxidative stress (from H2O2) at the level of gene and protein expression, according to the mechanism defined in a human non-pathological cell system, Nthy-ori 3-1. Later, on the basis of the results obtained by gene expression cluster analysis in normal cells, we assessed the dysregulation of the relationships in a model of papillary thyroid cancer with RET/PTC rearrangement (TPC-1). Our observations demonstrated that a H2O2 stress may induce a physiological cross-regulation between ErbB and OGG1-BER pathways in normal thyroid cells (while this is dysregulated in the TPC-1 cells). Gene expression data also delineated that MUTYH gene could play a physiological role in crosstalk between ErbB and BER pathways and this function is instead lost in cancer cells. Overall, our data on OGG1 protein expression suggest that it was physiologically regulated in response to oxidative modulation of ErbB, and that these might be dysregulated in the signaling pathway involving AKT in the progression of thyroid malignancies with RET/PTC rearrangements.

1. Introduction

Over the last 30 years, the incidence rate of thyroid cancer has steadily increased by 2.4 times [1,2] and papillary thyroid carcinoma (PTC) represents the most common histological type, with a frequency around 80% of cases [1]. Carcinogenesis and tumor progression in the thyroid gland are a phenotypic expression of a complex molecular interaction based on the connection between gene predisposition, environmental factors, and lifestyle, the effects of which influence thyroid hormone metabolism and oxidative DNA damage [3,4]. Oxidative damage has been suggested to promote tumor initiation and progression by increasing mutation rates and activating oncogenic pathways. Thyroid hormone synthesis is a complex and multistep physiological process that requires an adequate amount of H2O2 for oxidative iodination catalyzed by the enzyme thyroid peroxidase (TPO) [5,6,7,8]. On the other hand, based on its strong oxidative power, H2O2, could be responsible for the high level of oxidative DNA damage as observed in thyroid cancer tissue; it is also considered a second messenger able to activate several signaling pathways [9,10]. Oxidative DNA lesions have been detected in advanced stages of thyroid cancer, suggesting their contribution to tumor progression [4]. In recent years, there has been a growing interest in studying the role of oxidative stress in cancer initiation/progression and therapeutic response [11]. Indeed, H2O2 is also a signaling molecule involved in both the regulation of cell proliferation and apoptosis [10].
In cancer cells, H2O2 may regulate EGFR and mitogen-activated protein kinase (MAPK) signaling that contribute to redox protein-mediated cancer progression [12]. In addition, high levels of ROS have been found in thyroid adenomas and early stages of cellular transformation along with decreased antioxidant enzymes. Indeed, both oxidative stress and DNA damage are thought to be events that precede neoplasia in thyroid cells. [13] Such a circumstance, present in chronic thyroiditis, may contribute to the development of papillary thyroid carcinoma (PTC) [14]. H2O2 has been shown to cause the RET/PTC1 rearrangement frequently found in radiation-induced PTCs [15]. A marked increase in the presence of 8-oxoG in nuclear and mitochondrial DNA was evident after treatment with H2O2 or ionizing radiation [16]. Of the various types of oxidative DNA damage, 8-oxo-7,8-dihydroguanine (8-oxoG), has been reported as the most abundant. Despite its mild cytotoxicity, the 8-oxoG incorporation into DNA may be mutagenic since it causes a high transversion mutation rate [17,18,19]. Increased levels of the 8-oxoG DNA adducts have been detected in early stages of thyroid cancer: this may contribute to mutagenesis resulting in increased cell proliferation and survival [20]. The 8-oxoG DNA lesion is recognized and efficiently removed by 8-oxoG glycosylase1 (OGG1)-initiated base excision repair (BER) pathway (OGG1-BER) [20,21,22]. OGG1 glycosylase protects DNA from mutagenic potential caused by 8-oxoG:A mismatch leading to G:C to T:A transversion. Therefore, a correct function of OGG1-BER can be considered a protective factor against the triggering of carcinogenic pathways [20,21].
The involvement of EGFR signaling in thyroid carcinogenesis has been documented for a long time [23,24] and a link between DNA repair mechanisms and epidermal growth factor receptor (EGFR) signaling has been reported in many human tumor cells [25,26,27]; however, their cross-regulation is poorly understood in thyroid pathophysiology.
All these observations prompted us to study the existence of cross-regulation between EGFR- and OGG1-BER-related molecular pathways in thyrocytes under H2O2-mediated acute oxidative stress.
For our purpose, we compared a thyroid cancer (PTC) model with a normal cell counterpart to better identify changes in molecular signaling under specific treatment conditions, that would alter biological pathways for maintaining normal cell function. We chose to use a system of immortalized normal cells, Nty-ori 3-1, and a human model of differentiated papillary thyroid cancer (TPC- 1 cells). In the context of papillary carcinoma cell lines, the TPC-1 line has no mutations other than RET/TPC rearrangement [28].
This allowed us to elucidate how modulation of ErbB receptors and their downstream pathways (PI3K/Akt and MAPK/ERK) under acute oxidative stress are able to influence the molecular relationships with the OGG1-BER pathway.

2. Materials and Methods

2.1. Cell Culture and Treatments

Human thyroid follicular epithelial Nthy-ori 3-1 cells, obtained from European Collection of Authenticated Cell Cultures (ECACC 90011609) (Public Health England, Porton Down, Salisbury, UK) (Sigma Aldrich, St. Louis, MO, USA) were cultured at 37 °C in RPMI 1640 medium containing 10% fetal bovine serum (FBS), 100 U/mL penicillin/streptomycin and 2 mM L-glutamine. Human thyroid cancer cell lines, TPC-1 (harboring RET-PTC rearrangement, BRAF WT/WT), characterized according to Schweppe et al., and kindly provided by A. Coppa (Department of Experimental Medicine, Sapienza University of Rome, Rome), were maintained in a 5% CO2 culture humidified atmosphere, at 37 °C in Dulbecco’s modified Eagle medium (DMEM) supplemented with 10% FBS [29]. For experiments, cells were seeded and at sub-confluence (70%), were starved overnight using medium with 0.2% FBS, in order to reduce basal cellular activity [30,31]. Then, the cells were stressed by H2O2 (Sigma-Aldrich, Milan, Italy) alone or combined with EGF (human recombinant, Sigma Aldrich) or MAPK and AKT inhibitors (PD98059 and LY294002, respectively). In particular, the cells were pretreated with 50 ng/mL EGF for 15 min or with PD98059 (PD) at 50 μM and LY294002 (LY) at 25 μM (Cell Signaling Technology, Beverly, MA, USA) for 1 h and then stressed by a supra-physiological H2O2 concentration added to the external medium.

2.2. Cell Viability Assay

To assess the H2O2 effects on cell viability, Nthy-ori 3-1 and TPC-1 cells were cultured in 96-well plate (1.0 × 10⁴ cells/well) for 48 h, starved overnight using medium with 0.2% FBS and then exposed to supra-physiological H2O2 increasing concentration (from 50 µM to 10 mM) at different times (3, 6 and 24 h). This was followed by incubation with 10 μL/well of 2-[2-methoxy-4-nitrophenyl]-3-[4-nitrophenyl]-5-[2,4-disulphophenyl]-2H-tetrazolium, monosodium salt (MTS) assay (Promega, Madison WI, USA) a 37 °C for 1 h. Cell viability was evaluated at 490 nm using the GloMax-Multi Detection System (Promega). The MTS assay is an indirect measure of cell number/vitality based on mitochondrial metabolic activity. The H2O2 stressor concentration range was chosen based on the physiological amounts of H2O2 reported as being produced in vitro by proliferating thyroid models [31].

2.3. Flow Cytometry and Cell Cycle Assay

The effect of limit H2O2 stress on the quality of cell cycle at short time points was evaluated by flow cytometry cell cycle analyses (FACS) on normal and tumor cell lines. The cells were seeded on 6 cm plate at a density of 0.8 × 10⁶; at sub-confluence (70%), the cells were starved overnight (with 0.2% FBS), then were treated with H2O2 10 mM for a short time (15 and 30 min). FACS analysis were carried out as already reported [32,33]. Briefly 3 × 10⁵ cells/sample were fixed by adding 500 μL of 70 % cold ethanol and then stored at 4 °C. After at least 24 h, samples were washed and stained by 500 μL of a solution composed of 50 μg/mL of propidium iodide (PI, Sigma) and 200 μg/mL of RNAse (Sigma). Cells were incubated overnight at 4 °C in the dark and then acquired by flow cytometry. PI fluorescence data were collected using linear amplification. Samples were acquired on a FACSCanto II flow cytometer (Becton Dickinson Biosciences, San Jose, CA, USA). Data were analyzed using the FlowJo software (Becton Dickinson Biosciences).

2.4. Real-Time Quantitative PCR Analysis (qRT-PCR)

For gene expression experiments, the cells were seeded on 10 cm plate at a density of 3.2 × 10⁴; at sub-confluence (70%), starved overnight using medium with 0.2% FBS, then the cells were treated with H2O2 alone or combined EGF or MAPK and AKT inhibitors (PD98059 and LY294002, respectively) and then acutely stressed for 15 and 30 min with a concentration of H2O2 (10 mM) determined on the basis of MTS and FACS assays.
Total RNA was isolated using TriFast (EUROGOLD EuroClone) according to the manufacturer’s instructions. The synthesis of complementary DNA (cDNA) was performed as previously described [34]. The mRNA levels were evaluated by SYBR Green quantitative real-time PCR (qRT-PCR) analysis using StepOne™ 2.0 (Applied Biosystems, Thermo Fisher Scientific, Waltham, MA, USA). Data were analyzed using the comparative Ct method and were graphically indicated as 2−ΔΔCt + SD. In accordance with the method, the mRNA amounts of the target genes were normalized by the ratio on the median value of the endogenous housekeeping gene (GUSB) obtained in each treated cells vs. untreated (quiescent) cells.
Targets and reference genes were amplified in triplicate in a volume of 10 μL containing 1 μL template cDNA, 0.2 μL of primers mixture and 5 μL of GoTaq® 2-Step RT-qPCR System (Promega) according to the manufacturer’s instructions. Primers sequences are available in Table S1. The cycling conditions were performed as follows: 10 min at 95 °C and 40 cycles of 15 s at 95 °C, followed by 1 min at 60 °C, and final elongation of 15 s at 95 °C.

2.5. Gene Dosage Assay of OGG1 and MUTYH

Two different genomic target sequences were selected for OGG1 (GeneID: 4968; Gene Bank accession number: NM_016821) and MUTYH (GeneID: 4595; Gene Bank accession number: NM_12222.1). Genomic DNA was extracted as previously described [35] and gene dosage was performed by SYBR Green qRT-PCR. The samples were amplified in triplicate in three independent experiments. Data were analyzed using 2−ΔΔCt + SD. In accordance with the qRT-PCR method, previously described, the gDNA amounts of the target genes were normalized by the ratio on median value of the β-Actin as genomic reference from TPC-1 vs. Nthy-ori 3-1. Primers sequences are listed in Table S1.

2.6. Western Blotting

For protein expression experiments, Nthy-ori 3-1 and TPC-1 cells were seeded on 10 cm plate at 3.2 × 10⁴ density, at sub-confluence the cells were starved overnight and then acutely stressed by 10 mM H2O2 for 15 and 30 min alone or combined with EGF or PD or LY. Total proteins were isolated from treated and untreated cells using lysis buffer [2 mM Na3VO4, 4 mM sodium pyrophosphate, 10 mM sodium fluoride, 50 mM HEPES pH 7.9, 100 mM NaCl, 10 mM EDTA, 1% Triton X-100, 2 µg/mL leupeptin, 2 µg/mL aprotinin, 1 mM PMSF]. Protein concentrations were determined using the BCA protein assay (Thermo Fisher Scientific, Waltham, CA, USA). An equal amount of total proteins was separated on 4–20% SDS-PAGE pre-cast gel electrophoresis (Bio-Rad Laboratories, Hercules, CA, USA) and transferred onto PVDF membranes (GE Healthcare, Chicago, IL, USA). Then, after blocking, the membranes were incubated with primary antibody overnight at 4 °C. The following primary antibodies were used: phospho-p44/42 MAPK, phospho-AKT, phospho-EGFR (Tyr1068), PARP-1 (Cell Signaling Technology); EGFR (Santa Cruz Biotechnology, Santa Cruz, CA, USA); ErbB2 (Dako, Santa Clara, CA, USA); OGG1 (Novus Biologicals, Littleton, CO, USA); β-actin (Sigma-Aldrich, St. Louis, MI, USA)—used as a protein loading control. Secondary antibodies were HRP-conjugated anti-rabbit or anti-mouse (Bethyl Laboratories, Montgomery, TX, USA). The immune complexes were visualized using the ECL Western blot detection system (EuroClone). Protein amounts were quantified by the Image Lab TM Software Version 5.0 (Bio-Rad Laboratories).

2.7. Statistical Analysis and Tools

All measurements were made after three independent experiments, and, for each, data is shown as a representative value of all experiments plus standard deviation. The results were subjected to t-test or one-way analysis of variance (ANOVA) as appropriate. All p values are two-sided and a p value of less than 0.05 was considered significant. All analyses were performed using SPSS software version 20 (IBM Corp., Armonk, NY, USA). The program Multiexperiment viewer v4.9.0 (MeV v4.9.0, J. Craig Venter Institute, La Jolla, CA, USA) [36] was employed to elucidate molecular relationship among genes expression detected in the normal Nthy-ori 3-1 cells in response to the treatments.

3. Results

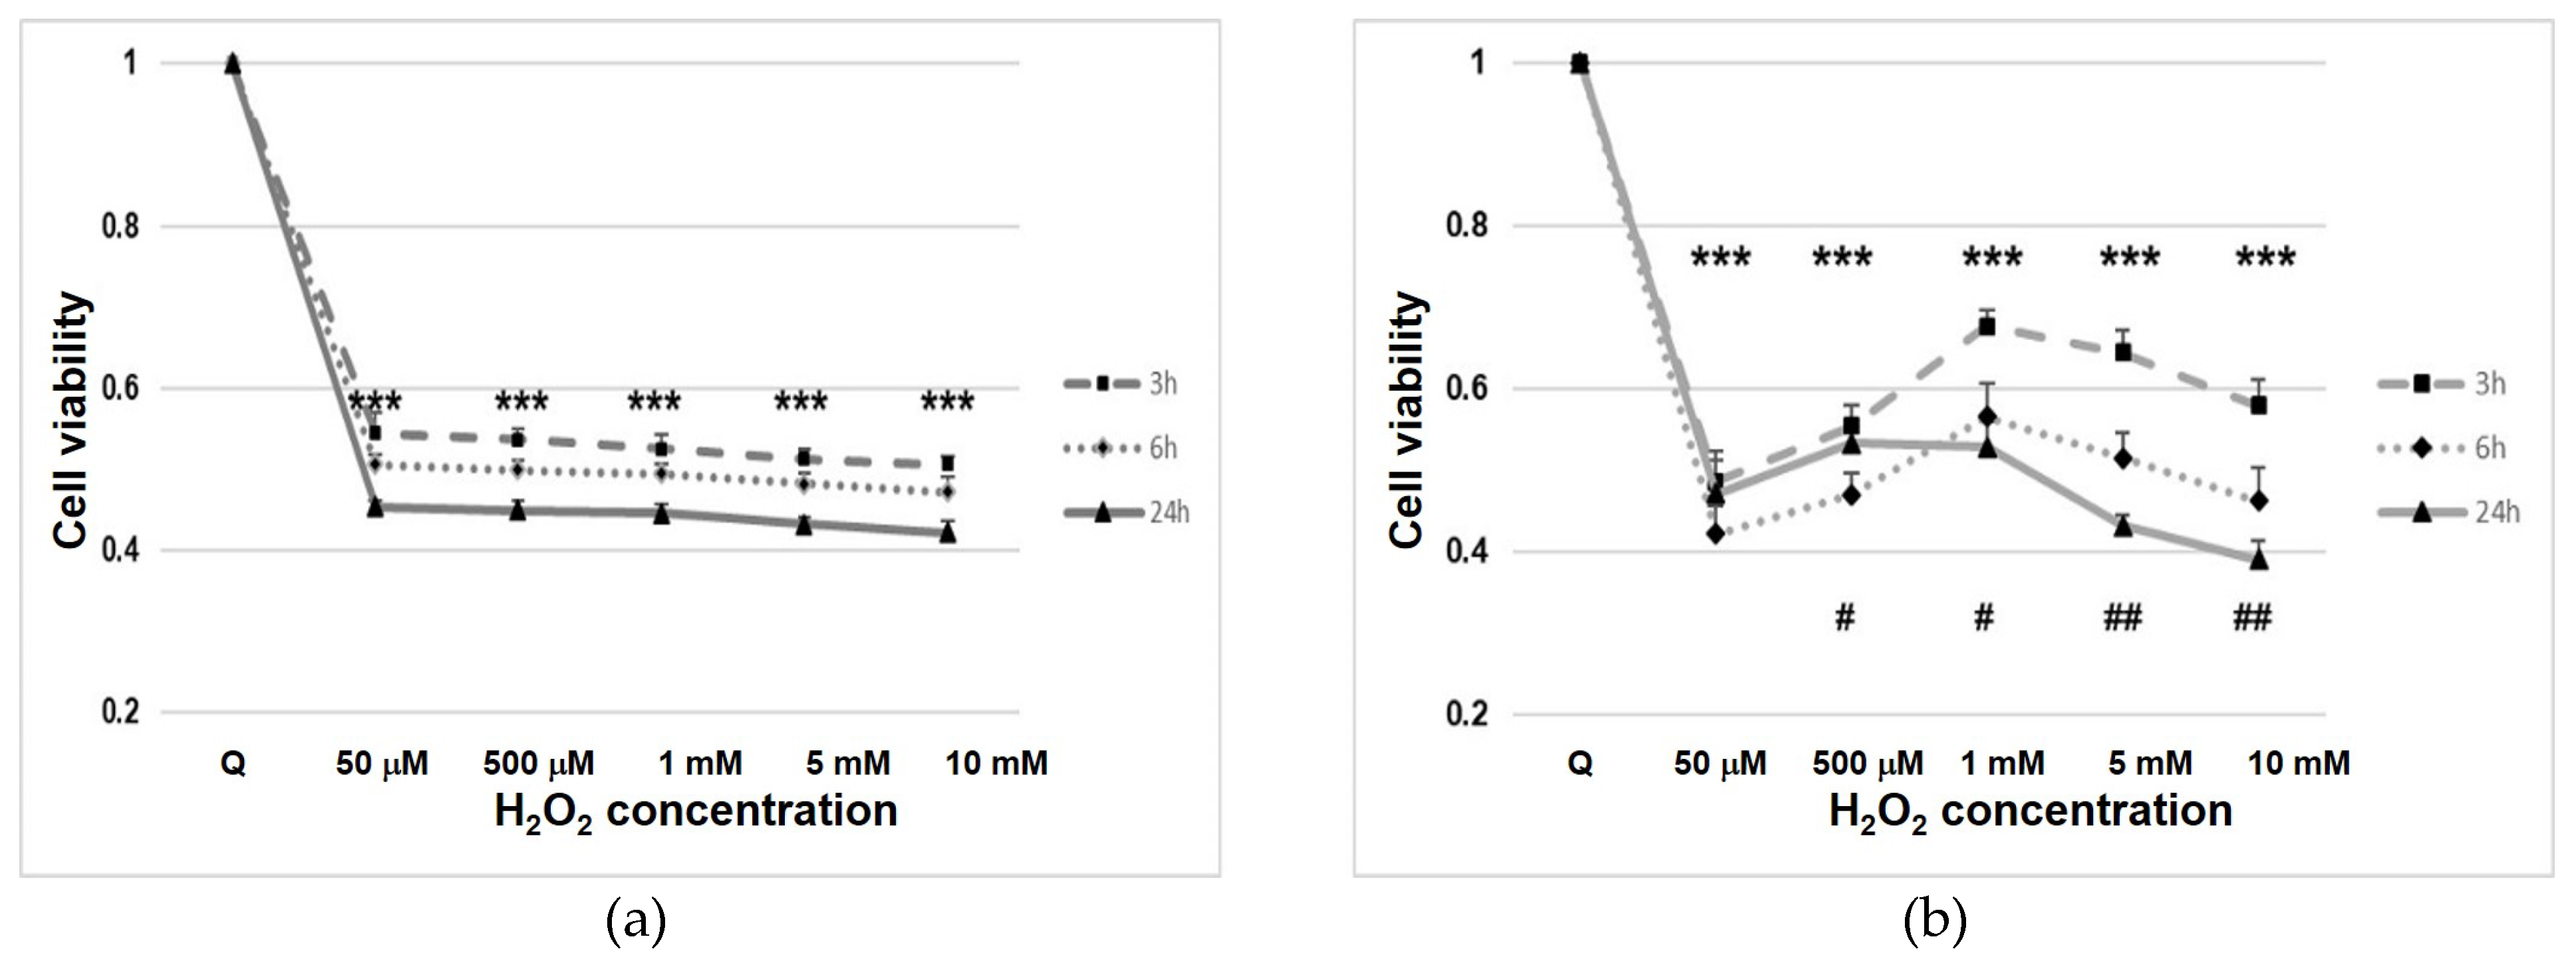
3.1. Cell Line Viability after Hydrogen Peroxide (H2O2) Treatment

In starved cells after H2O2 treatment, we observed a rapid decline in cell viability, probably due to the interference of H2O2 with mitochondrial activity (p < 0.001) (Figure 1). In normal cells (Nthy-ori 3-1), viability settled at a constant value (approximately 50%) for all concentrations and times (Figure 1a). In contrast, tumor cells (TPC-1), after treatment, showed variability in their viability, at the different H2O2 concentrations used (Figure 1b).

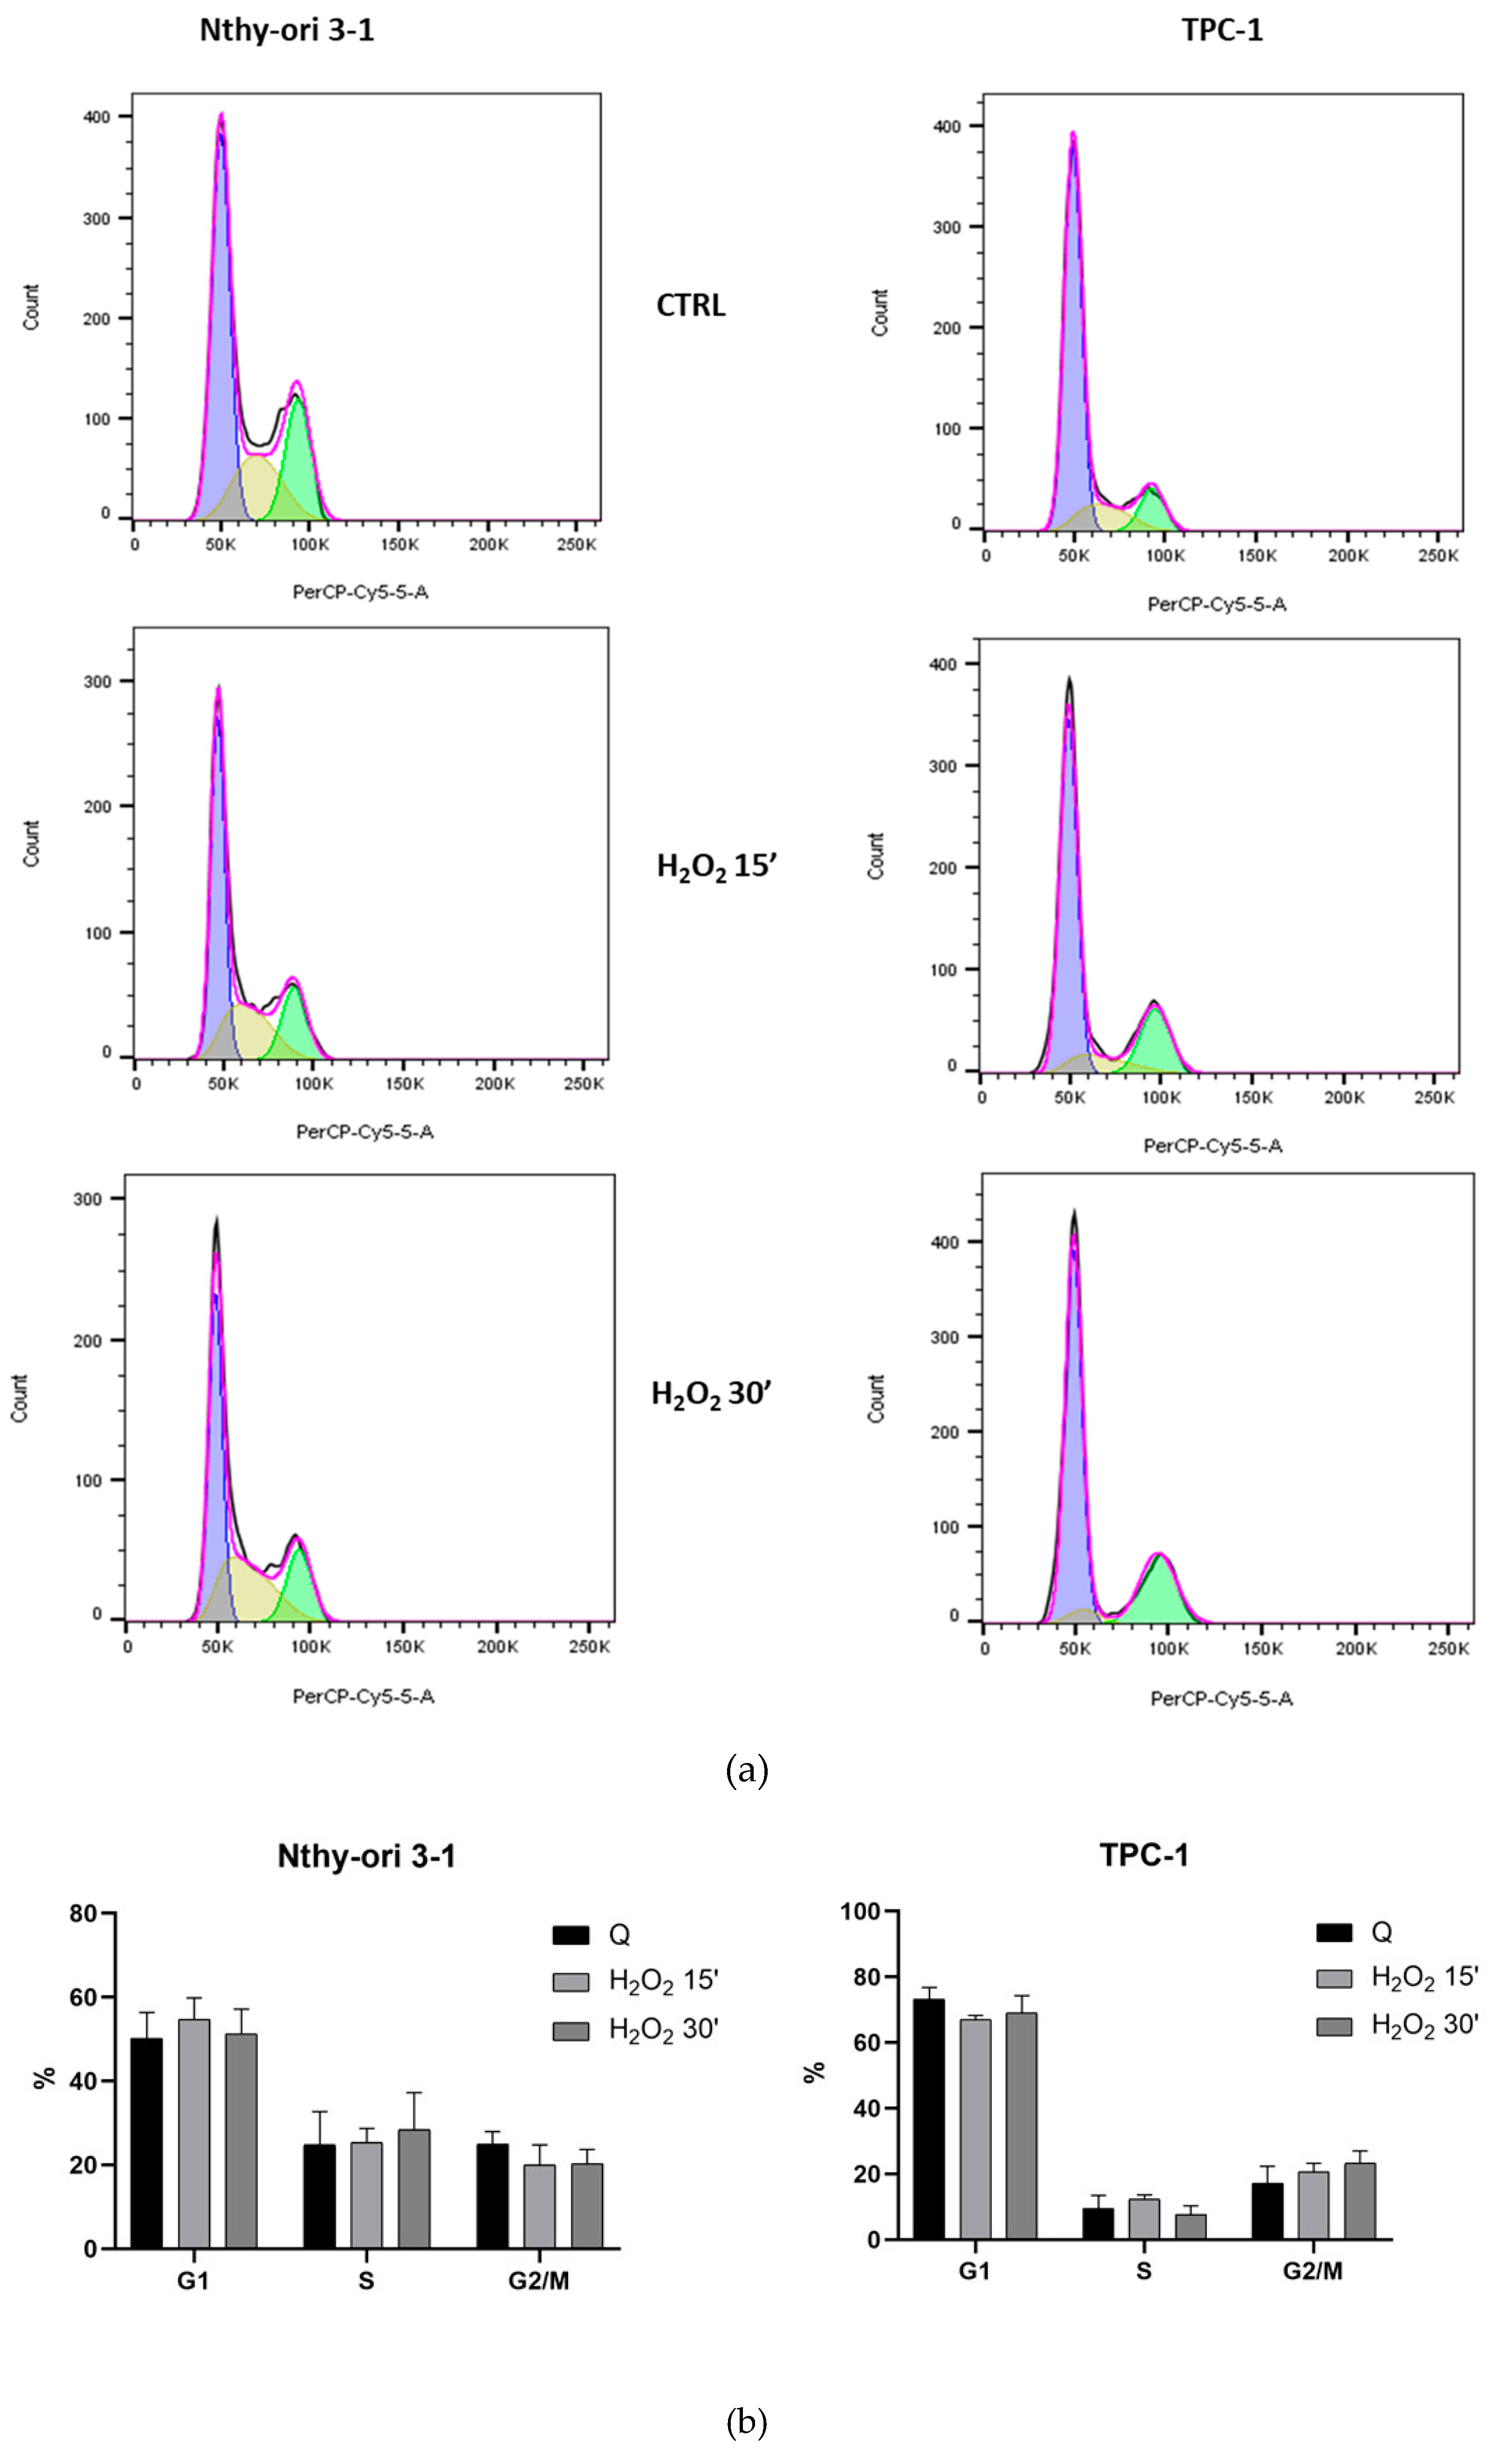
3.2. Cell Cycle Analysis

Based on the MTS results, we evaluated the acute oxidizing effect on the cell cycle quality of treatments with the highest concentration of 10 mM to test the acute effects of H2O2 at 15 and 30 min, in Nthy-ori-3-1 and TPC-1 cells. The percentages of cells in G0/G1, S and G2/M phases of the cell cycle were calculated using FlowJo software. FACS analysis on untreated Nthy-ori-3-1 underlined that 50.3 ± 6.1 % of cells were in G0/G1 phase, 24.8 ± 7.9 % in S phase and 25 ± 3.0 % in G2 phase in control group. The comparison with treated cells at 15 and 30 min resulted in a slight increase in the percentage of G0/G1-phase cells and in a reduction in G2 phase. H2O2 treatment seemed do not affect the S-phase cell population. Untreated TPC-1 cells compared with normal cells showed a higher percentage of G0/G1 phase cells (73.3% ± 3.5), a lower percentage of S phase cells (9.5% ± 3.9) and the remaining 17.2 ± 5.2 in G2. Treated TPC-1 cells showed a reduction in G0/G1 and an increase in G2 phase cell percentage (Figure 2a,b).

3.3. Gene Expression of BER and EGF Signaling in Nthy-ori 3-1 vs. TPC-1

Gene expression modulation of BER and EGF signaling was assayed in starved human thyroid follicular epithelial Nthy-ori 3-1 cells and starved papillary carcinoma cell line TPC-1 after short term treatments (15 and 30 min), with H2O2 [10 mM], EGF, PD, LY alone or combined.

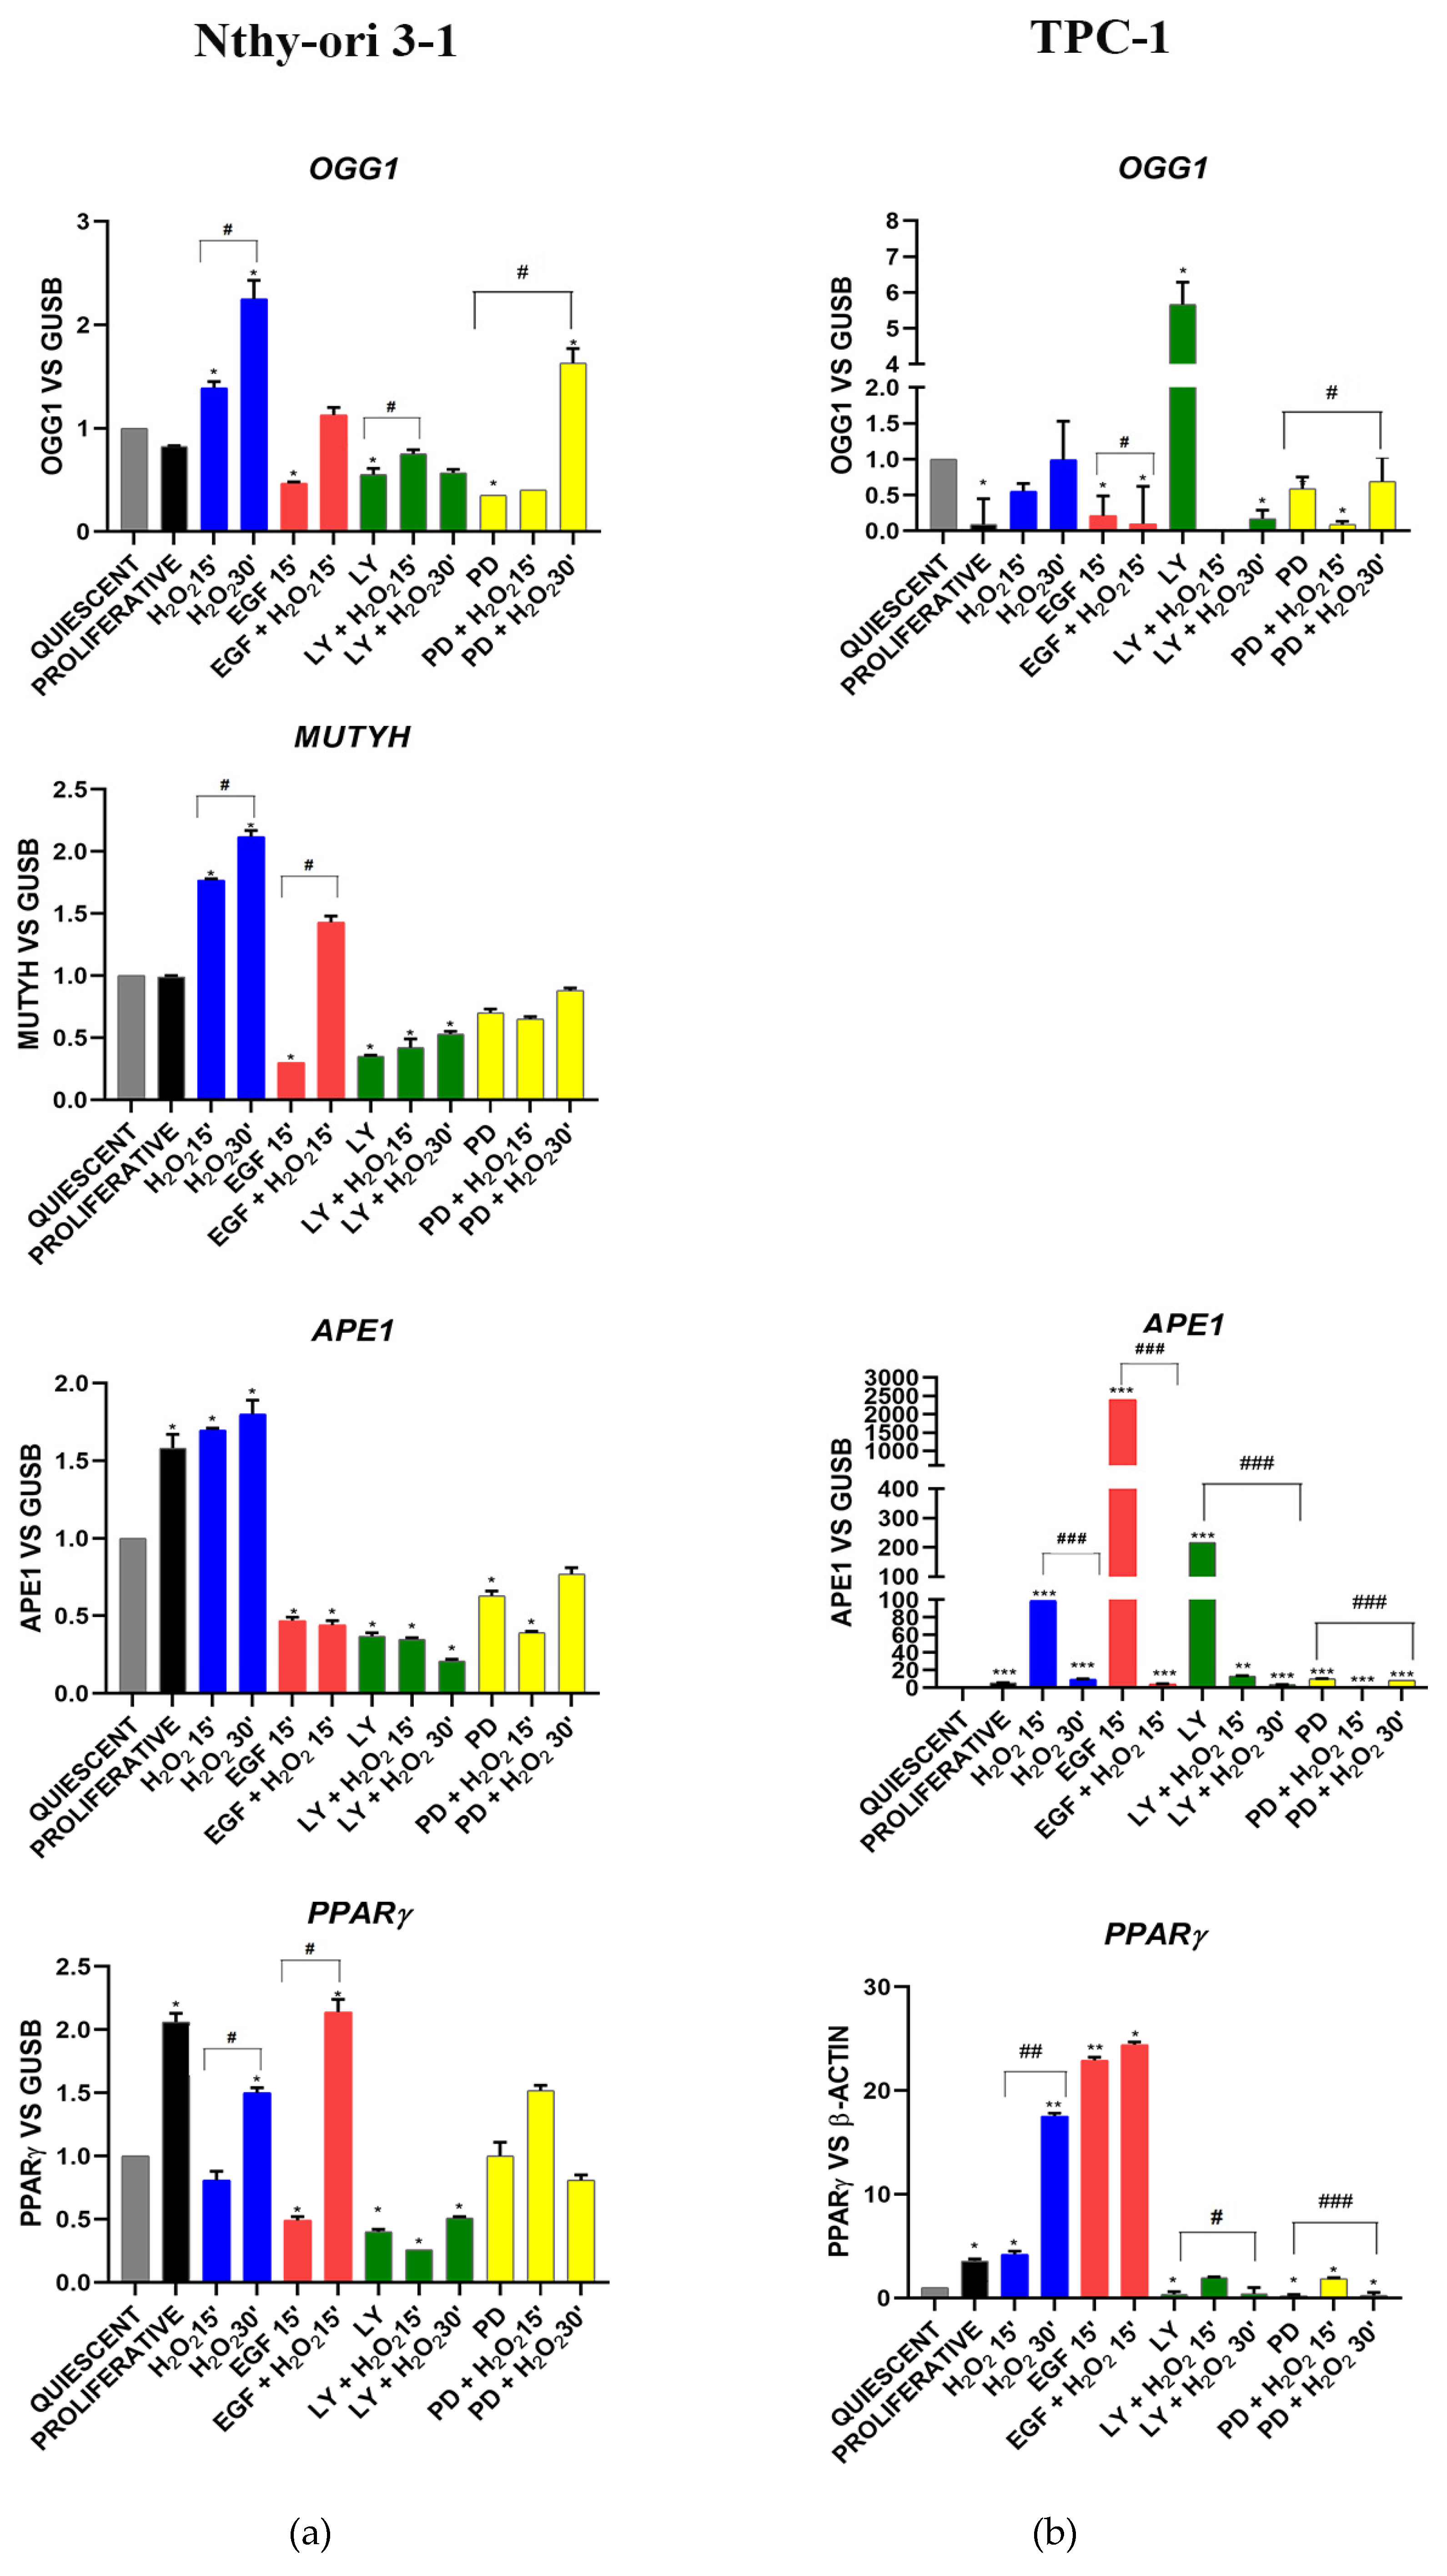
3.3.1. OGG1-BER Signaling

The BER genes—OGG1, MUTYH, APE-1/Ref-1 and PPARγ—in Nthy-ori 3-1 exhibited generally the same trend in the different experimental conditions (Figure 3a). These genes showed a significant (p < 0.05) time-dependent increase, after H2O2 exposure, and a significant (p < 0.05) decrease after EGF stimulation and AKT and MAPK inhibition (Figure 3a). EGF and H2O2 co-treatment increased OGG1, MUTYH and PPARγ compared with EGF stimulation alone; this was not observed for APE-1. With respect to normal cells, the TPC-1 tumor cells showed an overall gene expression deregulation, in response to the treatments (Figure 3b vs. Figure 3a). Indeed, an increase in expression after AKT inhibition was observed for OGG1 and APE1, while PPARγ and APE1 showed an overexpression after stimulation by EGF (Figure 2b). MUTYH expression was not appreciably detected in TPC-1 cells (data not shown).

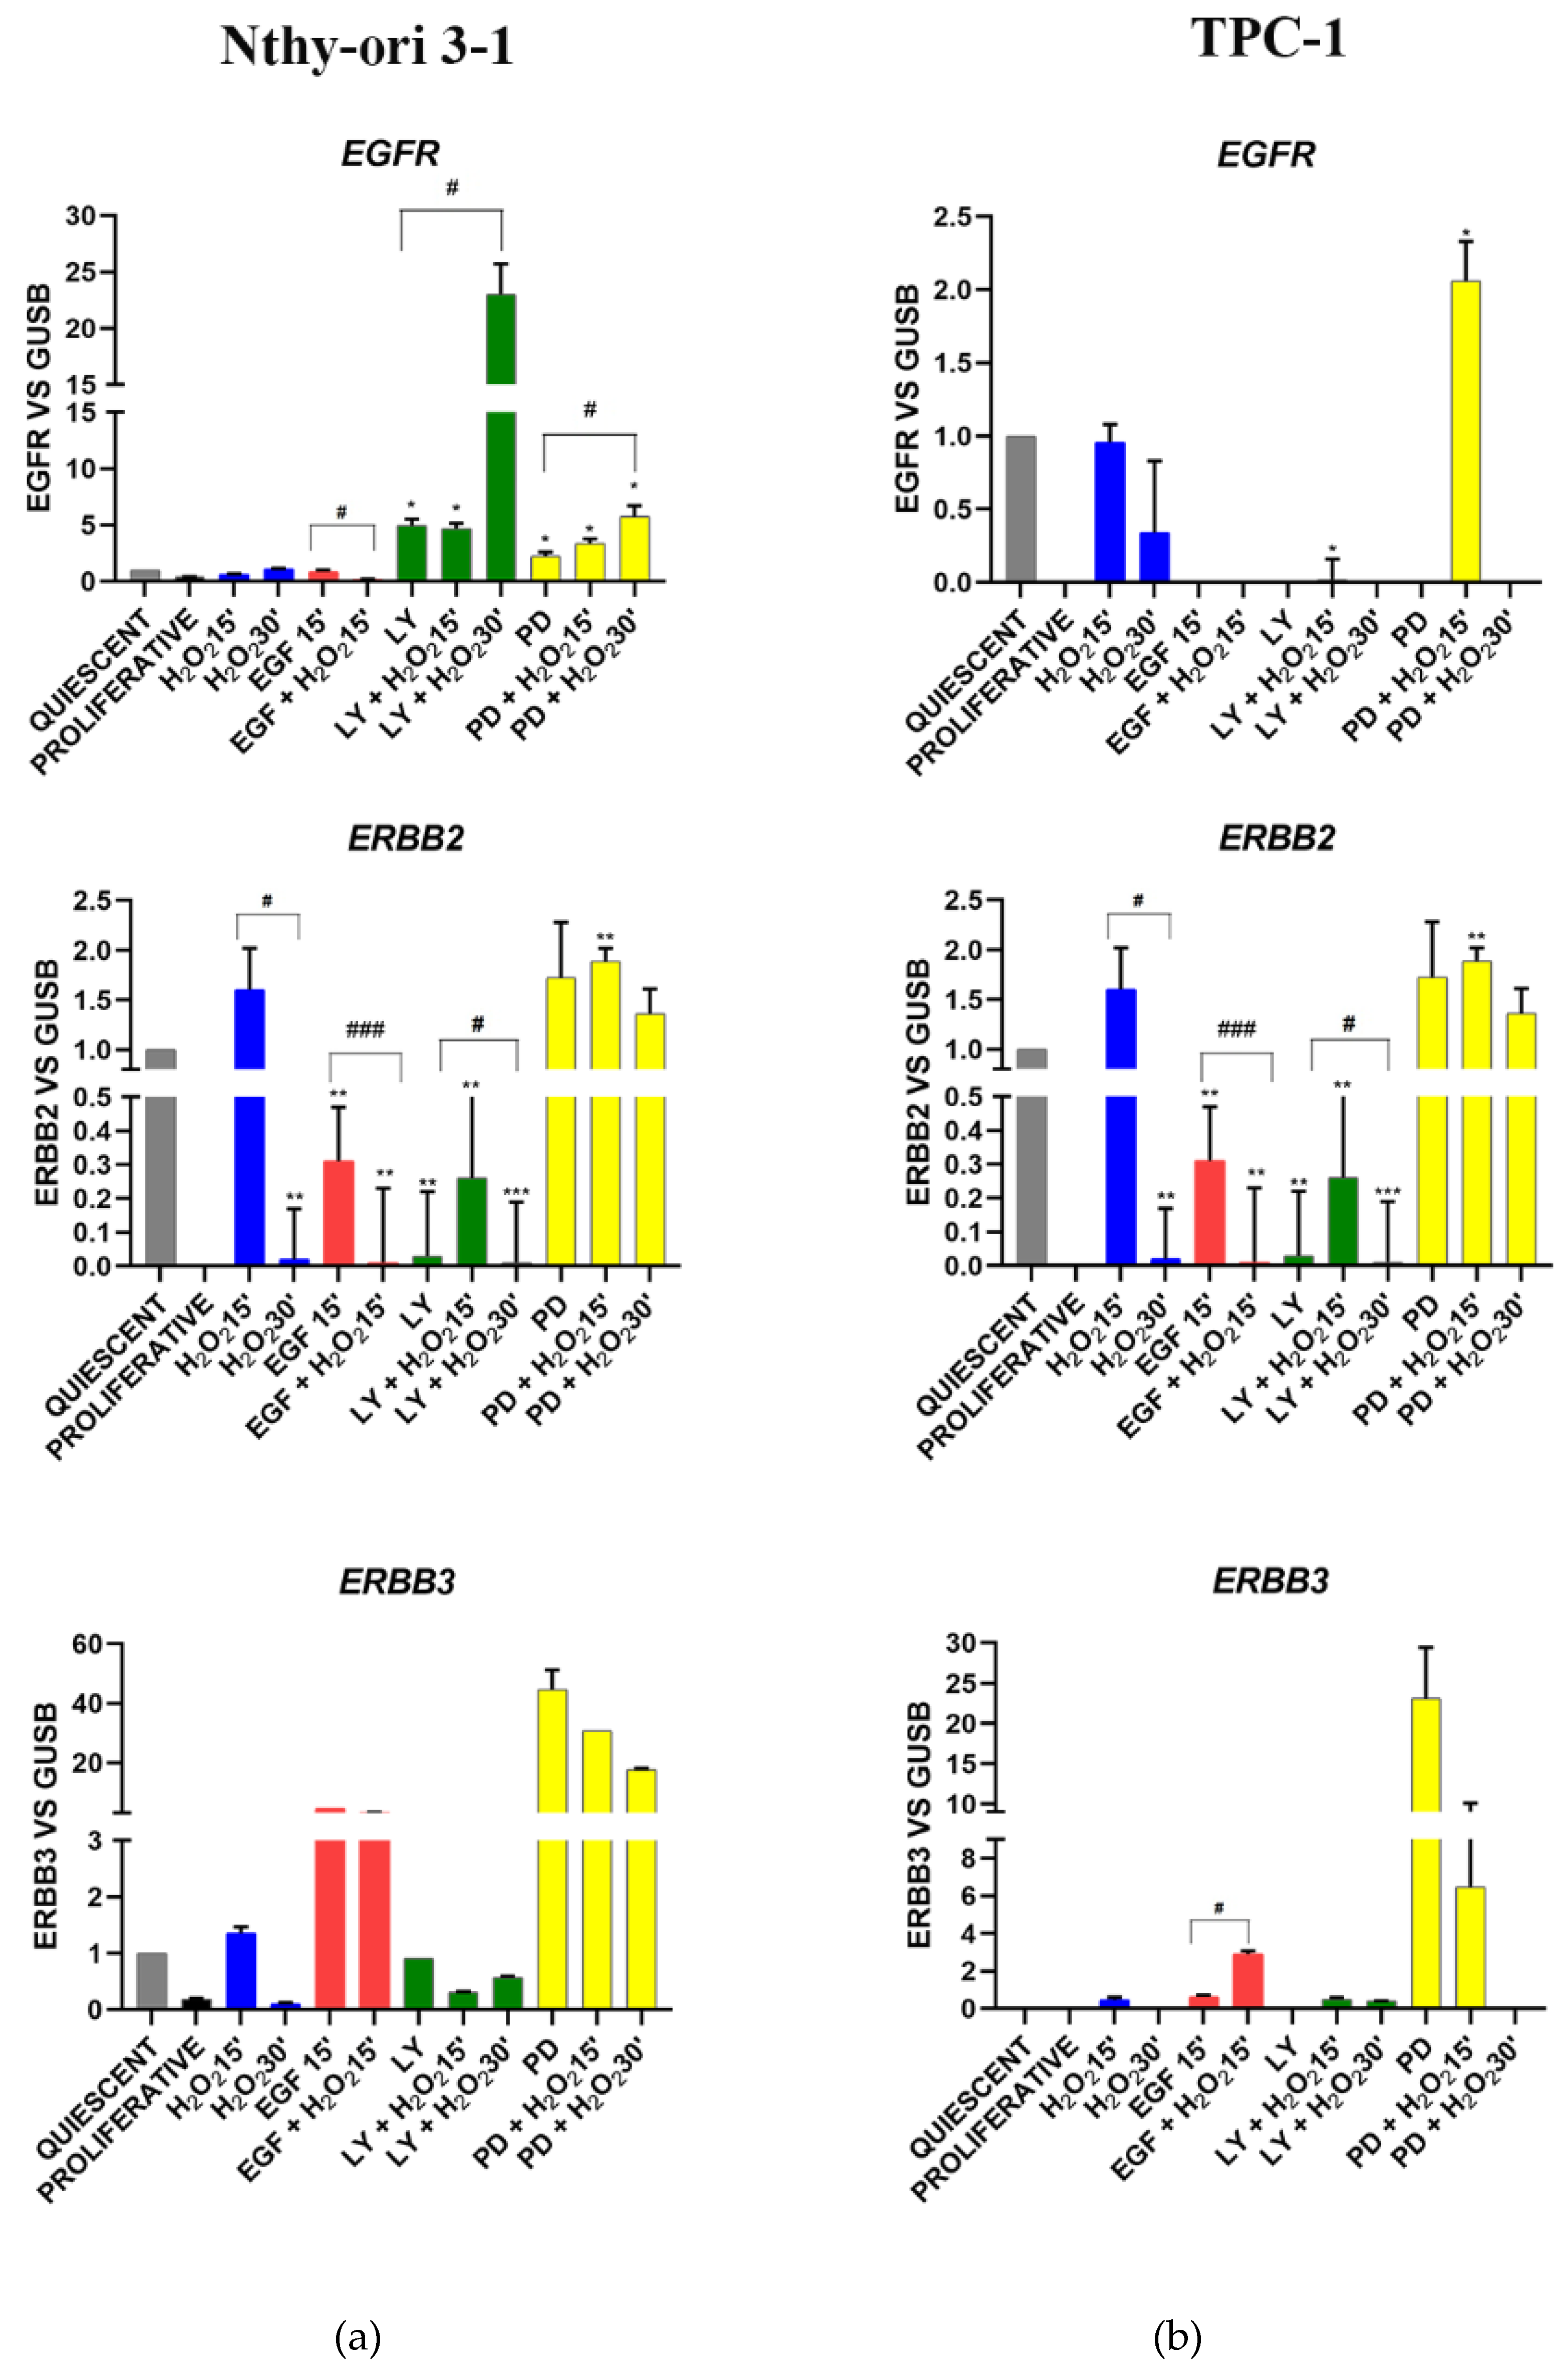
3.3.2. EGF Signaling

In Nthy-ori 3-1 cells, the stimulation with EGF and H2O2, alone or combined, did not induce any EGFR modulation; while LY and PD determined its overexpression and furthermore H2O2 strengthened the action of inhibitors (Figure 4a). ErbB2 expression was increased by H2O2 combined with EGF and MAPK inhibitor. ErbB2 expression was increased by co-treatment with H2O2 and EGF, while it was downregulated by EGF alone and by AKT inhibitor. (Figure 4a). ErbB3 was stimulated by EGF and PD treatments, also combined with H2O2 (Figure 4a). In all conditions ErbB4 was not detected, except after EGF stimulation (data not shown). An aberrant modulation of the EGFR, ERBB2 and ERBB3 genes was observed in TPC-1 cells. In fact, these genes tended to be repressed or poorly expressed (even in proliferating cells) but they resulted stimulated by MAPK inhibition combined with H2O2 (Figure 4b).

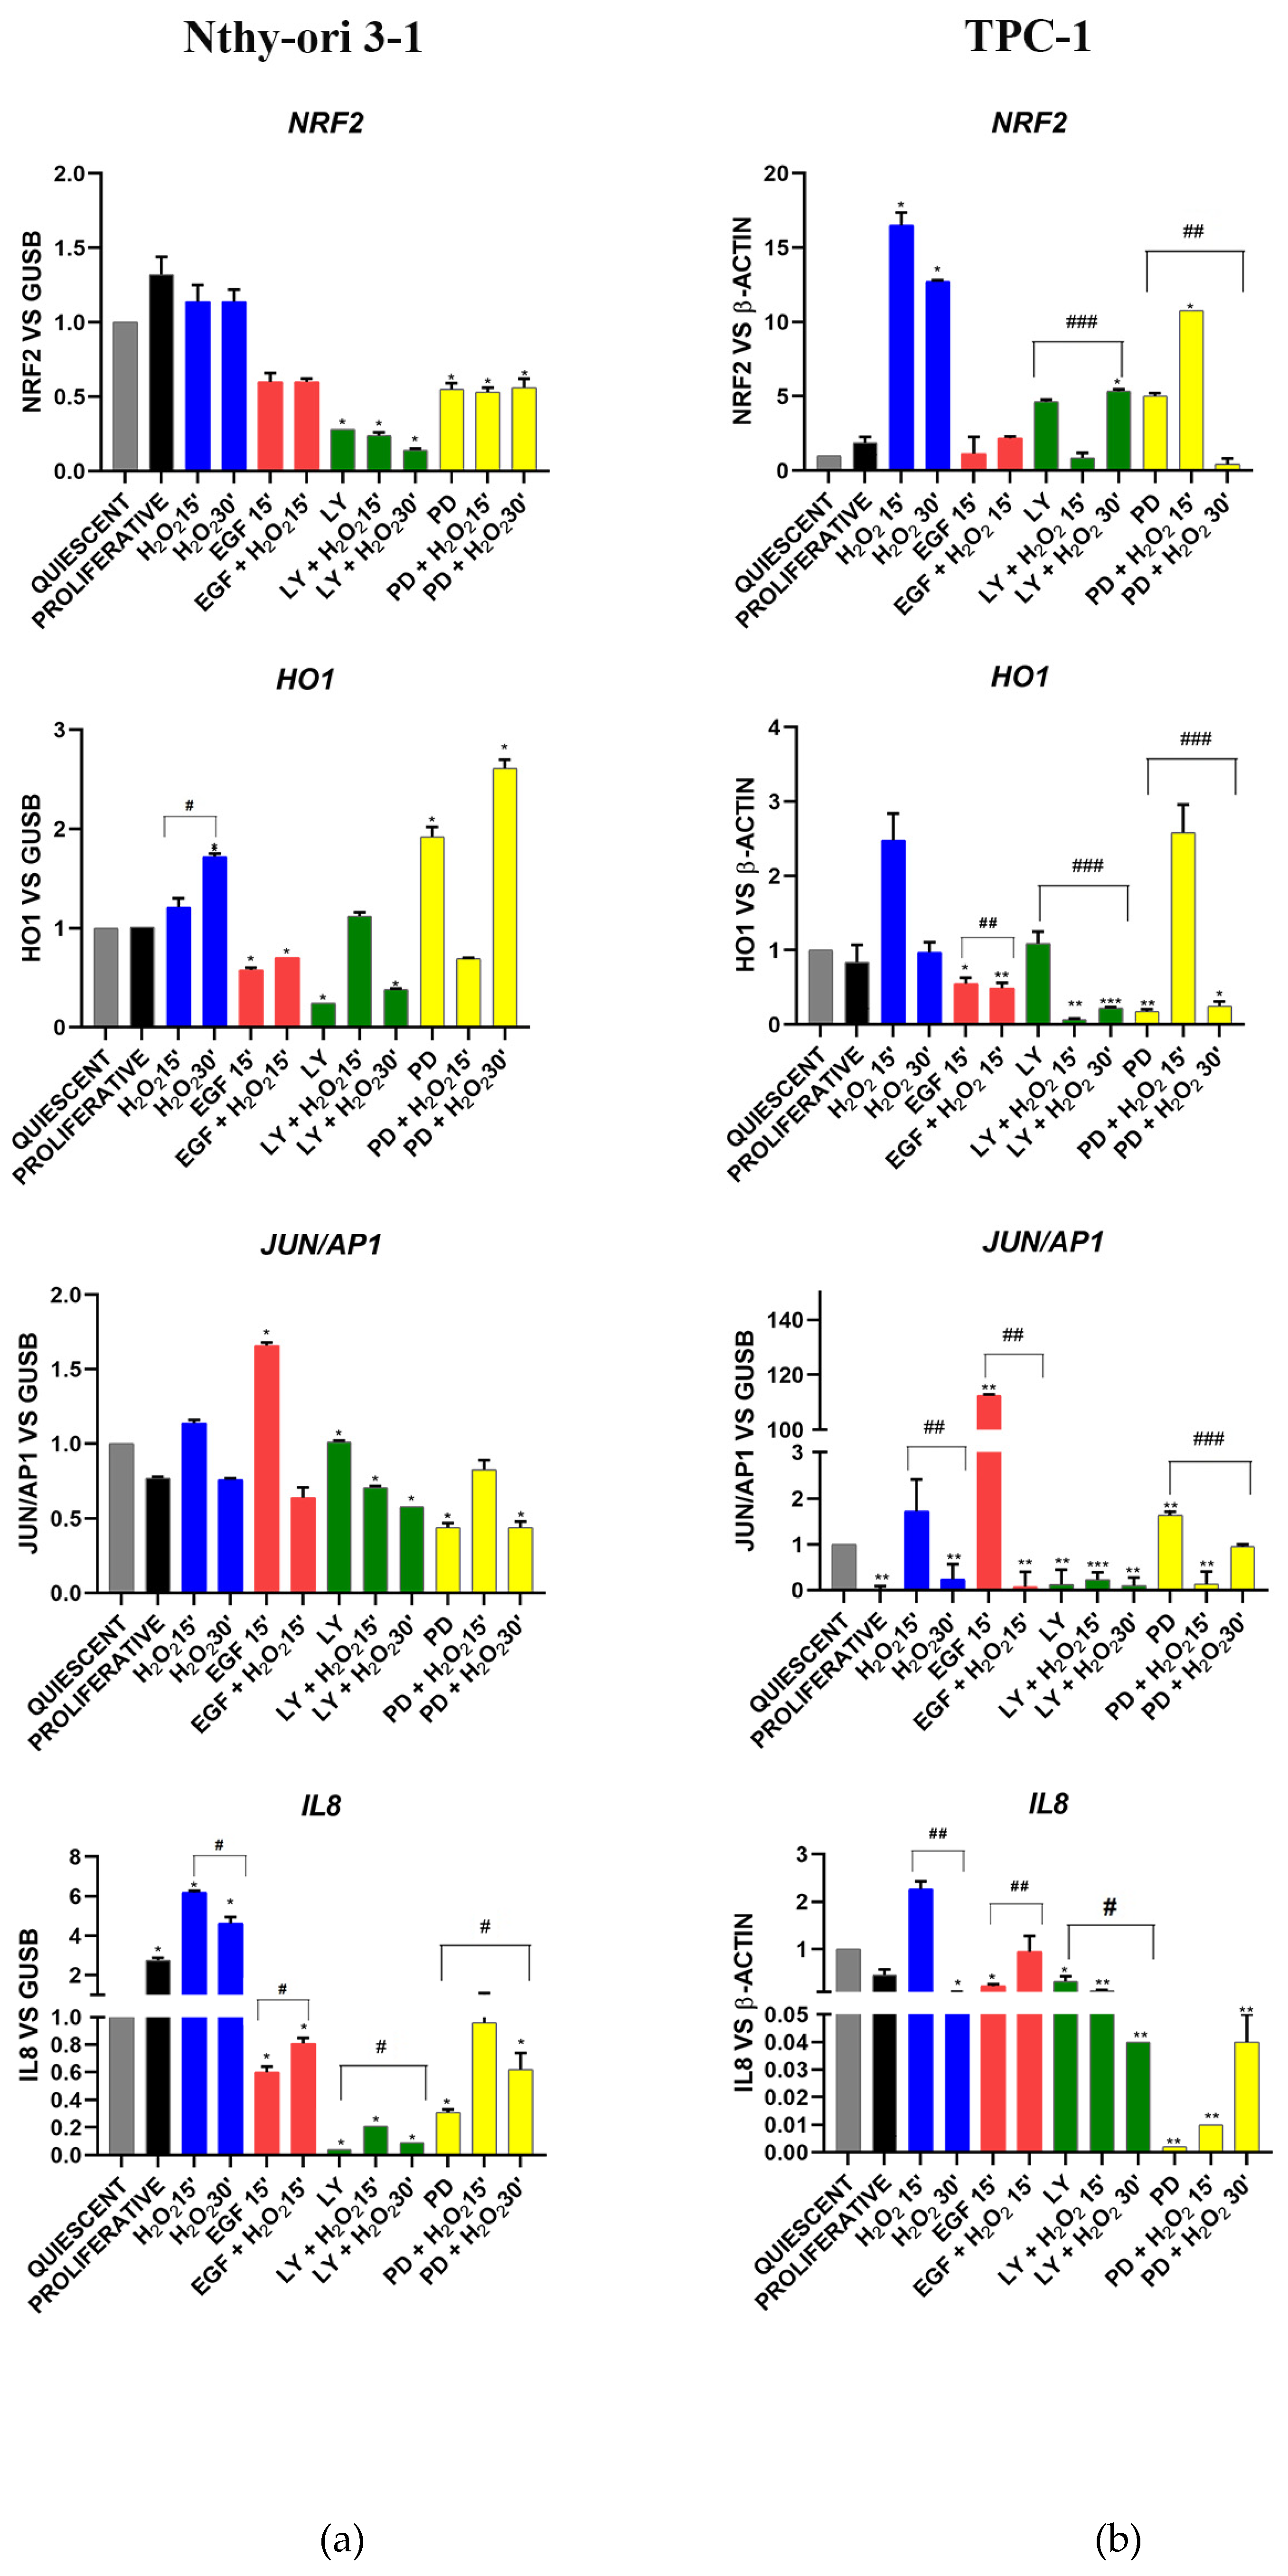
3.3.3. Oxidative Stress Signaling

The gene expression levels of the molecules known to be involved in the oxidative stress response are shown in Figure 4.
In Nthy-ori 3-1, the nuclear factor erythroid-derived 2-like 2, (NRF2), decreased with EGF, LY and PD (alone and combined with H2O2) (Figure 5a). The inhibition by PD and PD + H2O2 after 30 min increased the expression of protective antioxidant gene HO1, that conversely was decreased by EGF and LY inhibitor (Figure 5a). In cancer cells, NRF2 showed a significant alteration in its expression, especially after treatment with H2O2, but also with LY and PD (Figure 5b).
In normal cells, the transcription factor JUN/AP1 did not show any modulation following H2O2, LY and PD treatments, but its expression was increased by EGF (Figure 5a). In tumor cells, EGF stimulation resulted in overexpression of JUN/AP1 while inhibition of AKT downregulated it (Figure 5b). The pro-inflammatory CXC chemokine IL-8 gene (CXCL8) was significantly increased in normal proliferating cells compared with normal starved cells and in particular after H2O2 treatments, whereas its expression was reduced by EGF stimulation and its downstream pathways (AKT and MAPK) inhibition (Figure 5a). In cancer cells, IL-8 expression is dramatically reduced by MAPK inhibition.

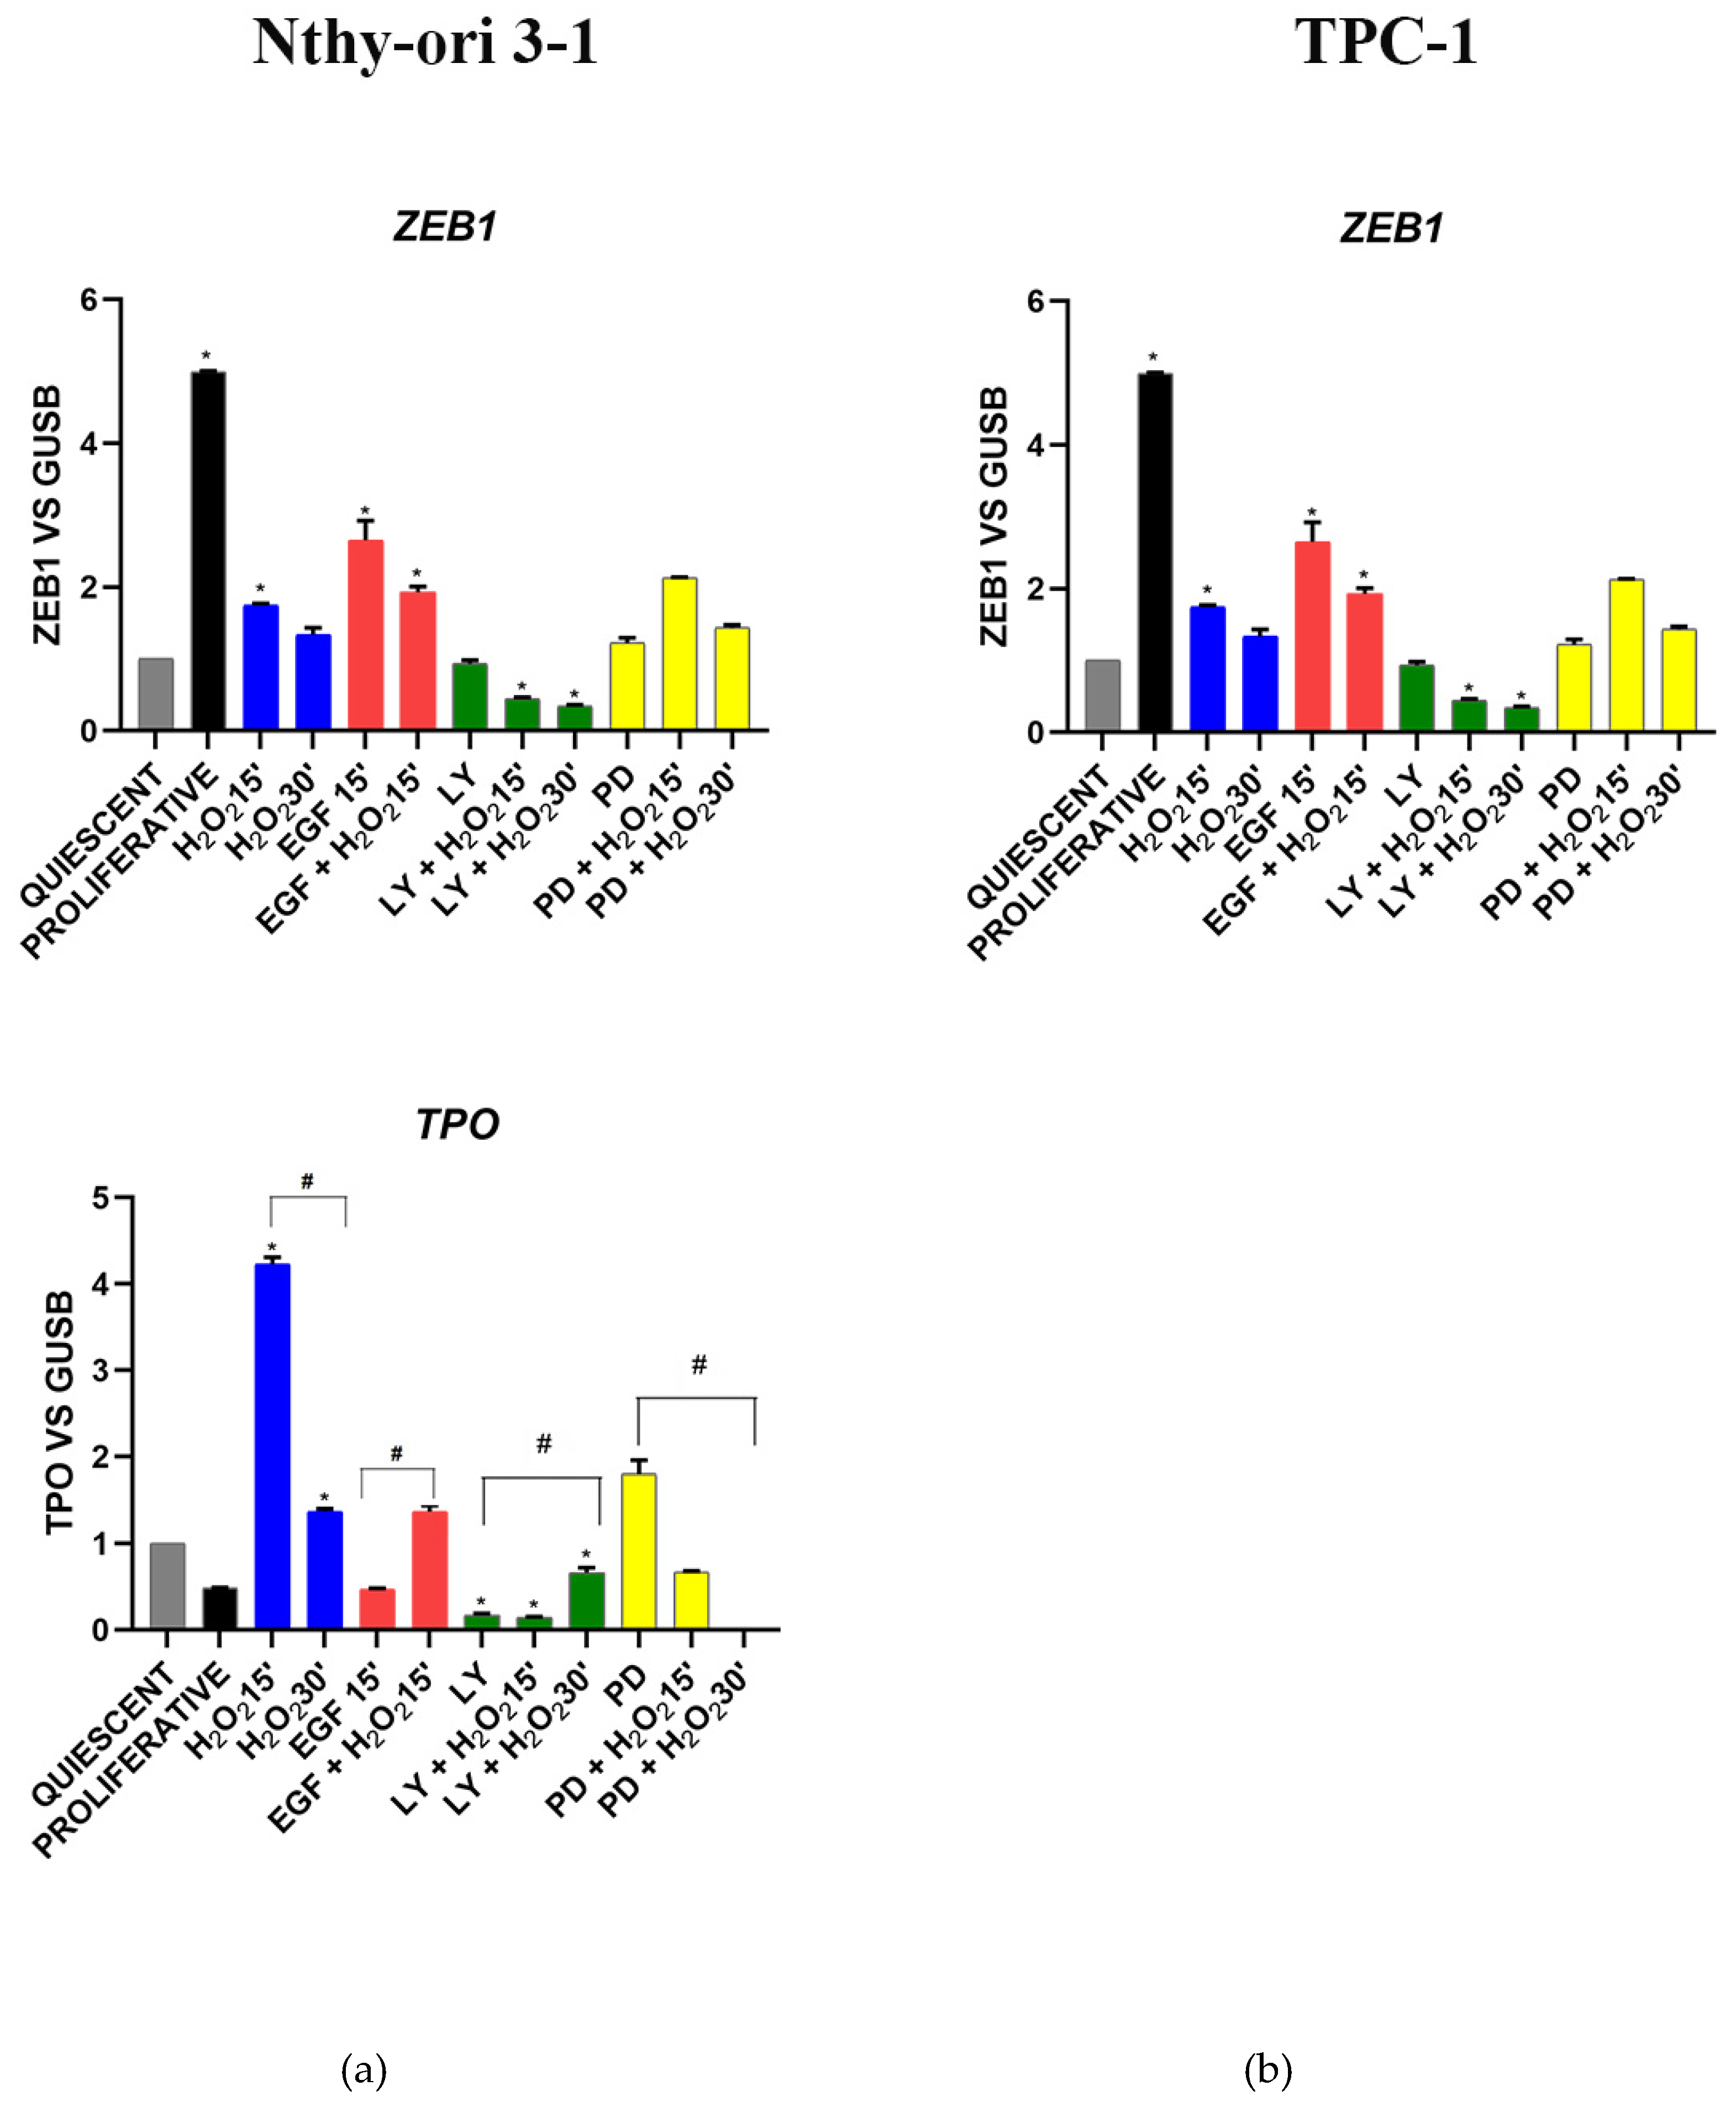
3.3.4. Stemness and Differentiation Markers

As expected, in Nthy-ori 3-1, the expression of stem cell regulator ZEB1 increased in proliferating cells, after EGF stimulation and in stress conditions, while its expression was decreased by LY and H2O2 co-treatment (Figure 6a). Thyroid differentiation marker TPO showed an opposite trend in gene expression compared with ZEB1, except for the treatment with H2O2 (Figure 6a). The reduction in TPO gene expression was detected following the inhibition of the AKT pathway while an opposite effect was obtained after MAPK inhibition (Figure 6a). In TPC-1 the expression of zinc finger ZEB1 increased after LY and PD treatments, while H2O2 reduced its expression (Figure 6b). In all experimental conditions, thyroid differentiation marker TPO resulted undetected (data not shown).

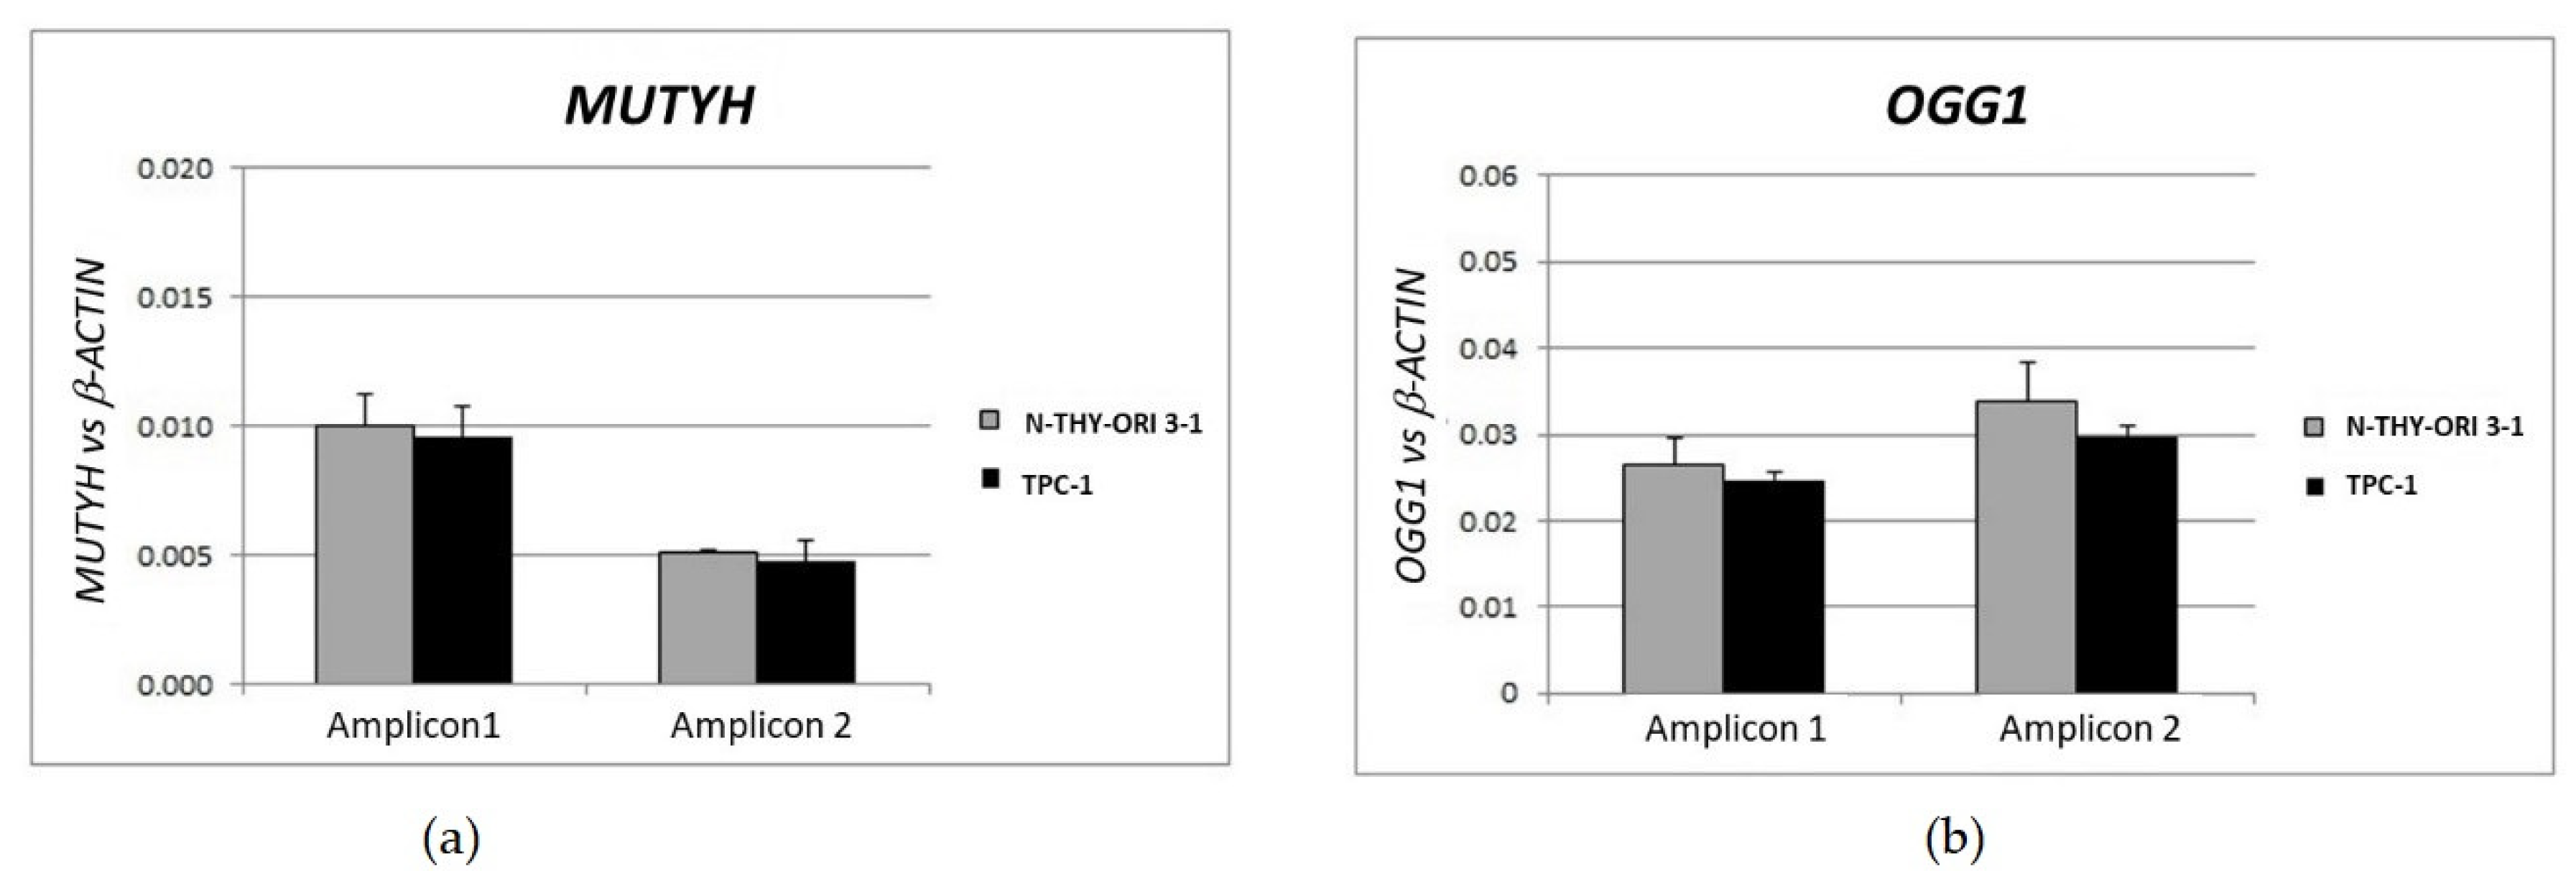
3.4. Gene Dosage Assay of OGG1 and MUTYH in TPC1 Cells

Since TPC-1 cells did not express MUTYH, we evaluated the amount of genomic DNA (gDNA) of this gene and its partner OGG1. The qPCR data were normalized by the ratio on the value of endogenous B-Actin gDNA. The reference amount of the both alleles presence was validated on gDNA from Nthy-ori 3-1 cells; since the normalized values of the controls (cell lines) matched perfectly, we were confident to employ this method to assay the TPC-1 cell line genome. In the TPC-1 cells, OGG1 and MUTYH gDNA values did not show reduction (Figure 7).

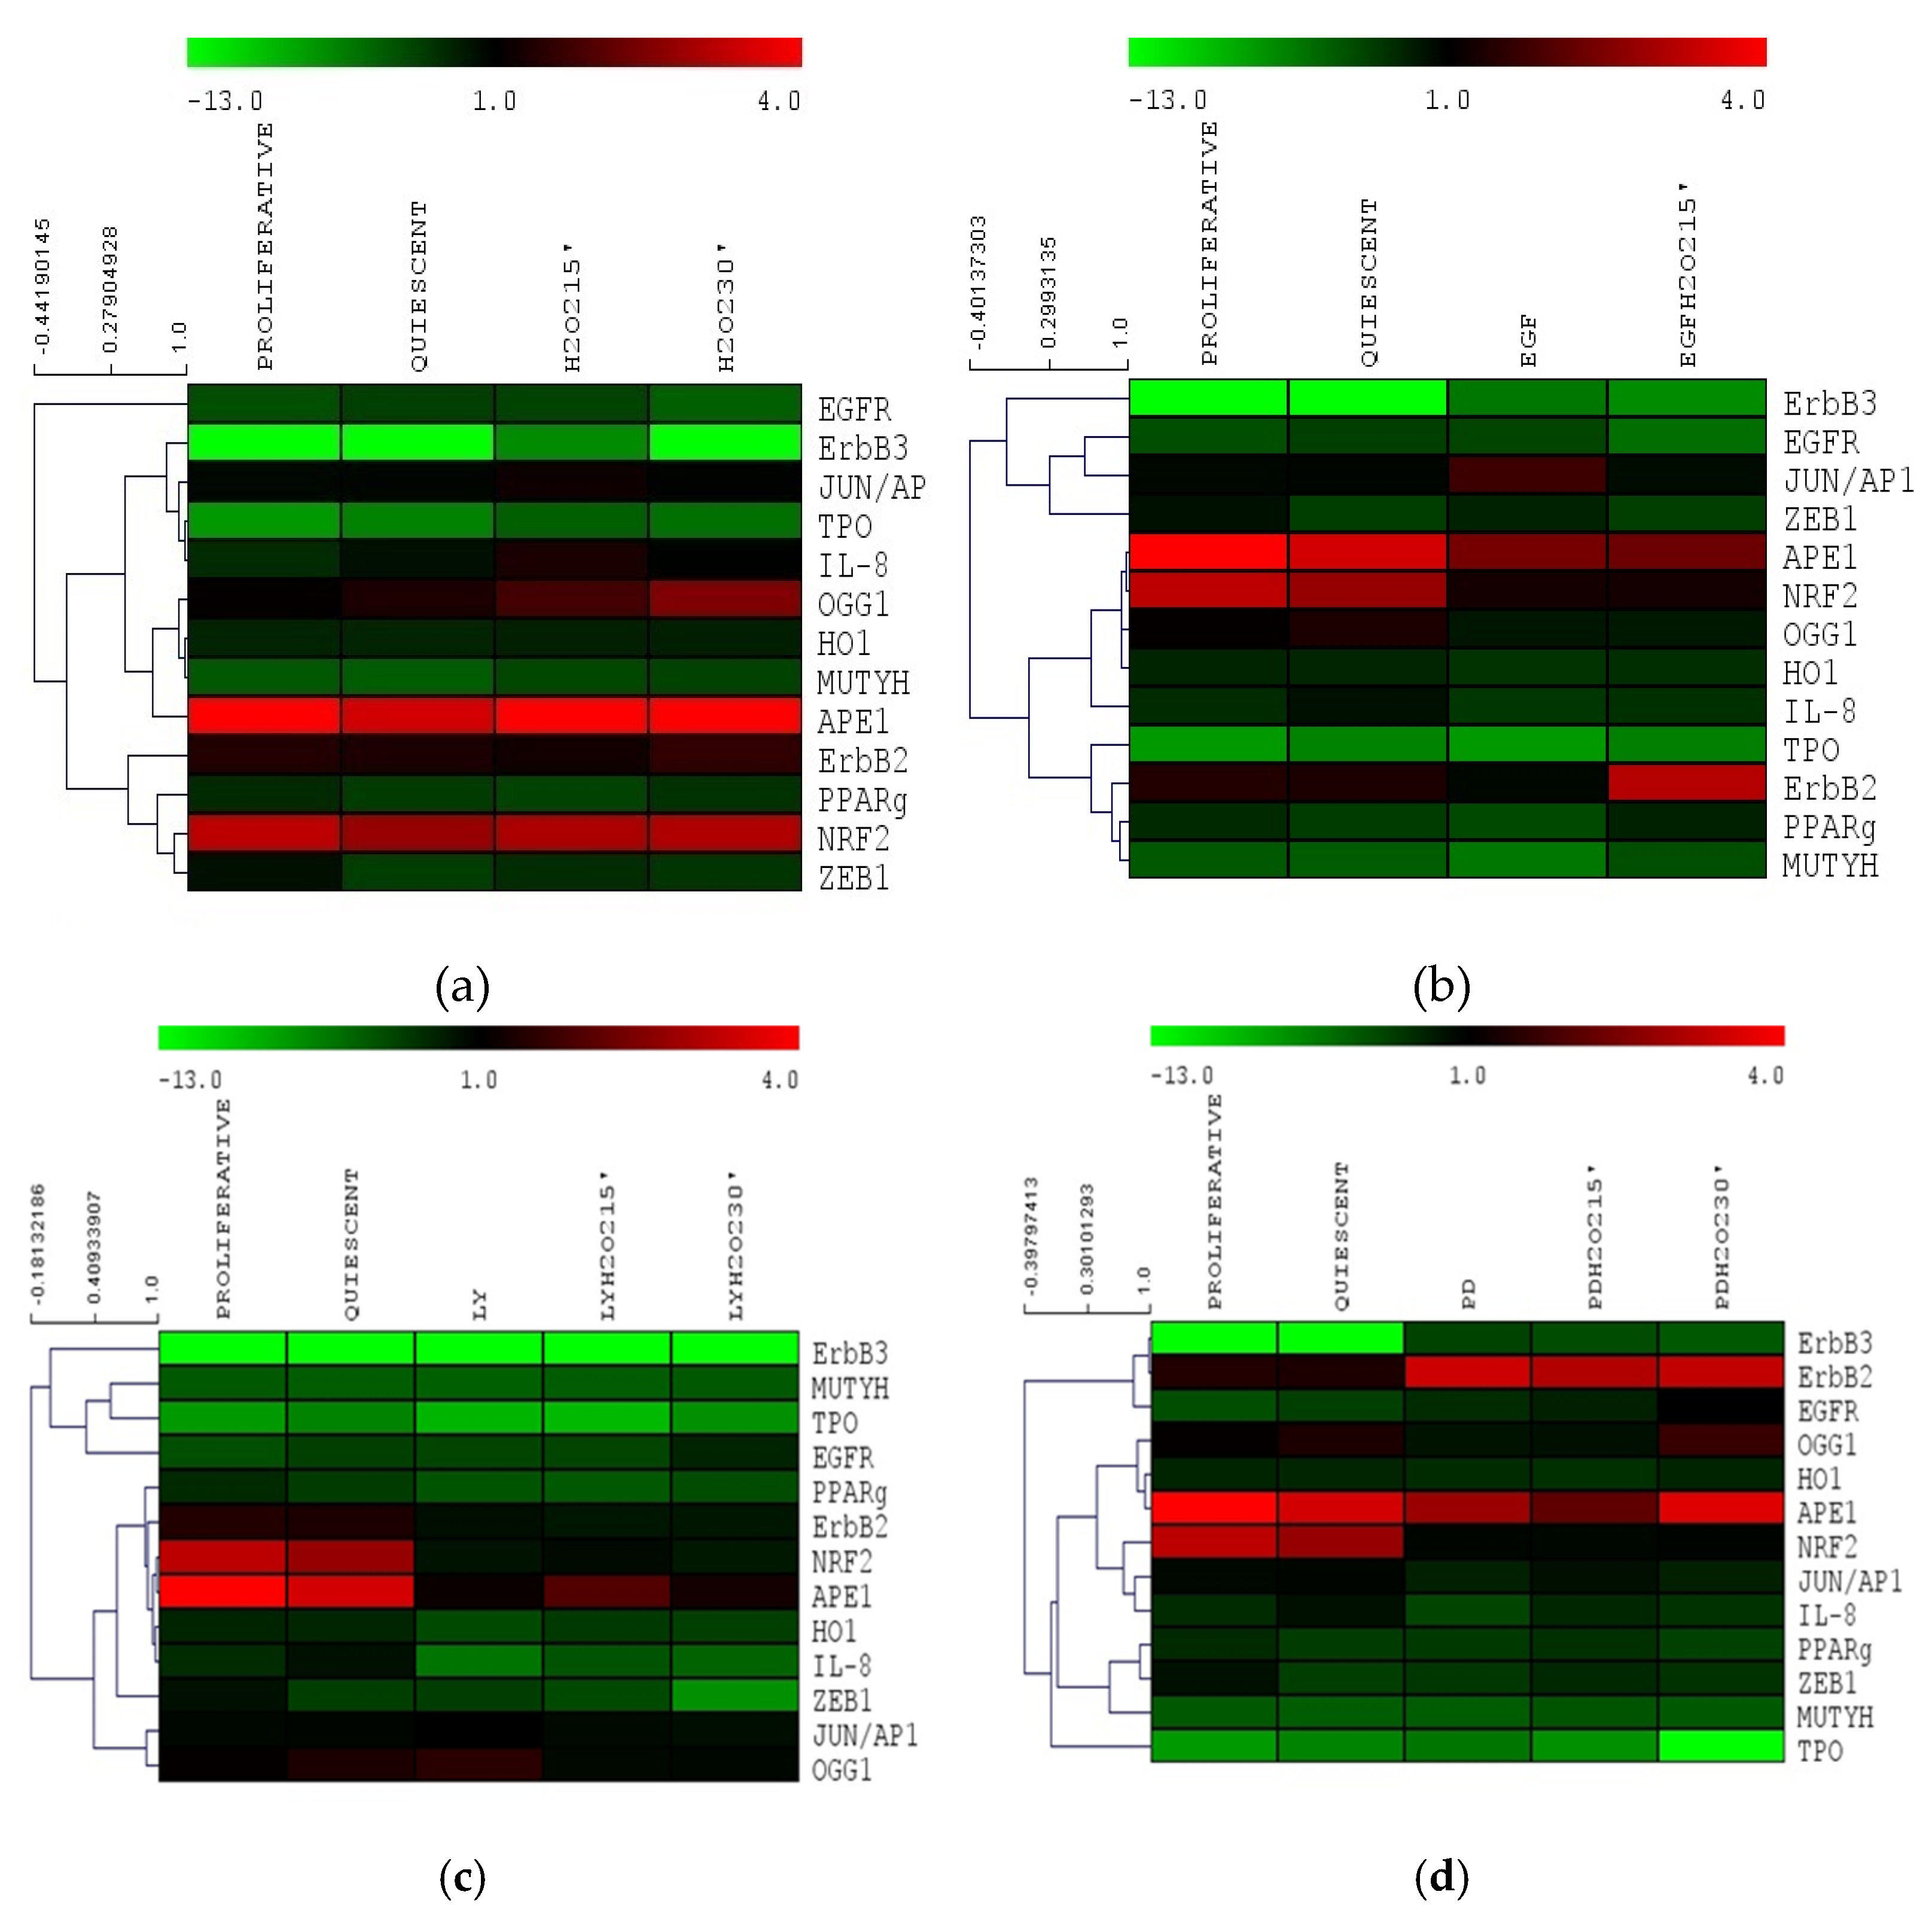
3.5. Gene Expression Cluster Analysis in Nthy-ori 3-1

To elucidate the potential cross-regulation between BER and EGFR pathways, we compared the genes expression levels detected in Nthy-ori 3-1 cells in response to the several treatments employing Multiexperiment viewer v4.0 program (MeV4.0) [35] (Figure 8). Under acute oxidative stress conditions (by 10 mM H2O2 treatment), a close correlation among genes involved in stress response, i.e., MUTYH, HO1 and OGG1, was observed. We also highlighted the correlation among TPO, IL-8 and JUN/AP1 transcription factor (Figure 8a).
When the Nthy-ori 3-1 cell line was stimulated by EGF, a strong relationship among the BER genes, OGG1 and APE1/Ref1 (alternatively named APEX1, HAP1, APEN), and antioxidant response gene, NRF2 and OH1 was shown; whereas MUTYH and PPARγ showed a correlation with ErbB2 (Figure 8b). The inhibition of AKT pathway by LY, highlighted a lack of BER gene correlation, in addition to APE1/Ref1, was related to NRF2, HO1 IL-8 and ErbB2 (Figure 8c). Interestingly, in normal thyroid cells the inhibition of MAPK (by PD) was the unique experimental condition that showed a correlation among the ErbB receptors (Figure 8d).

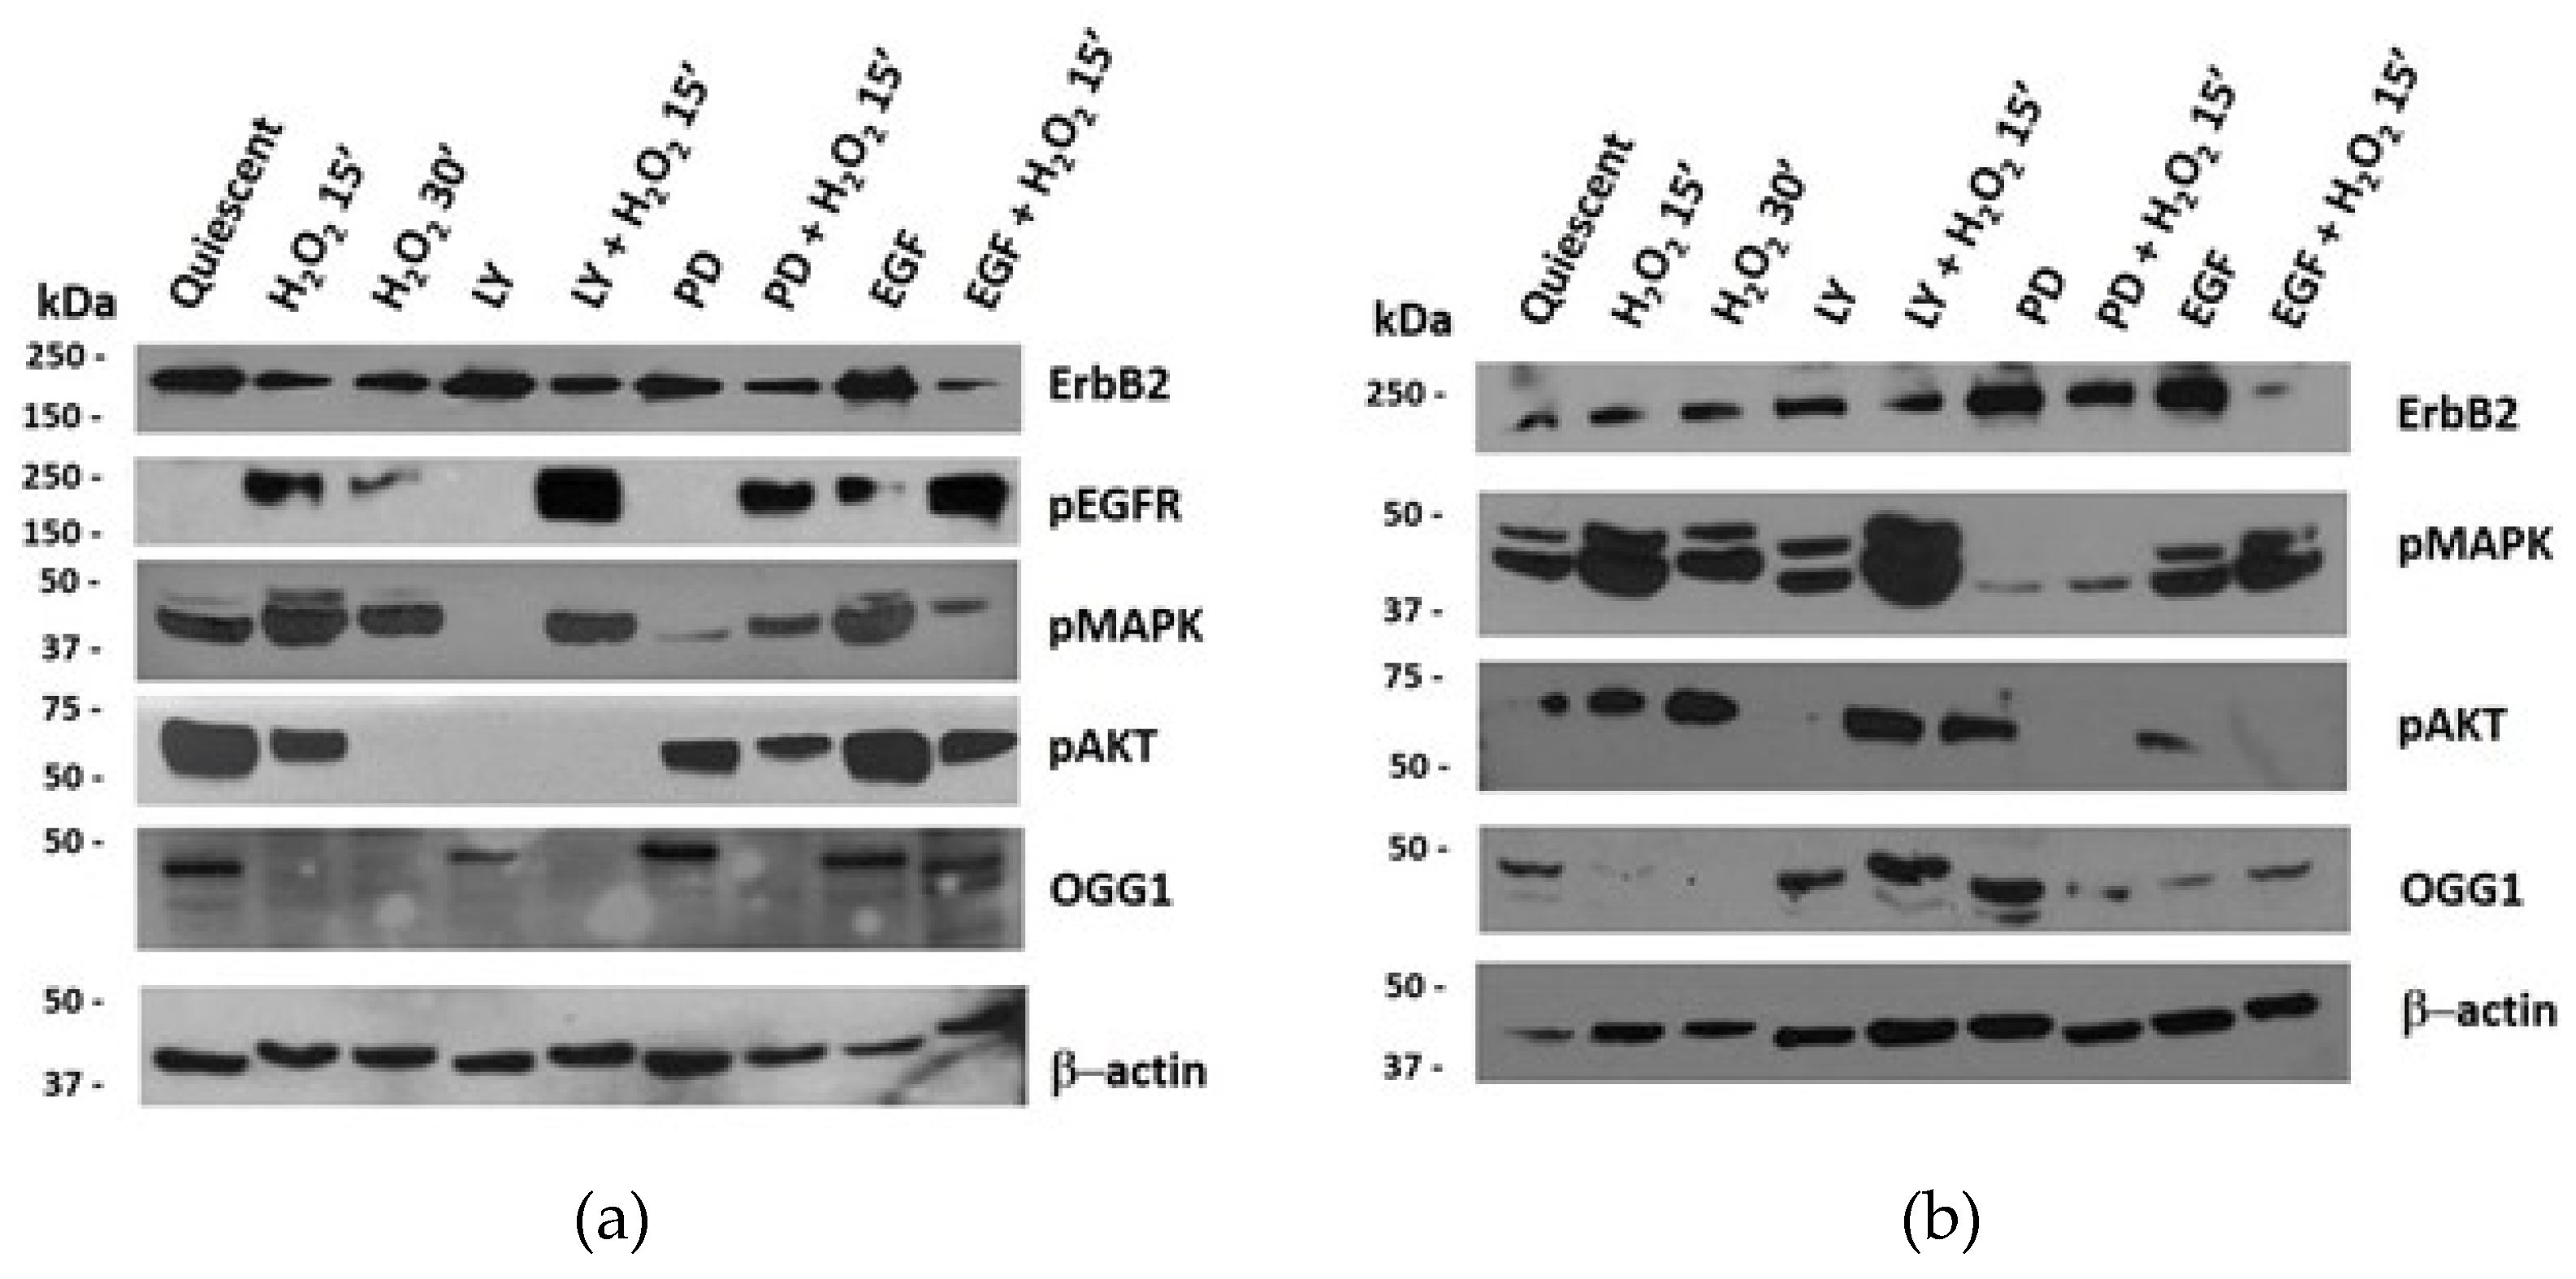
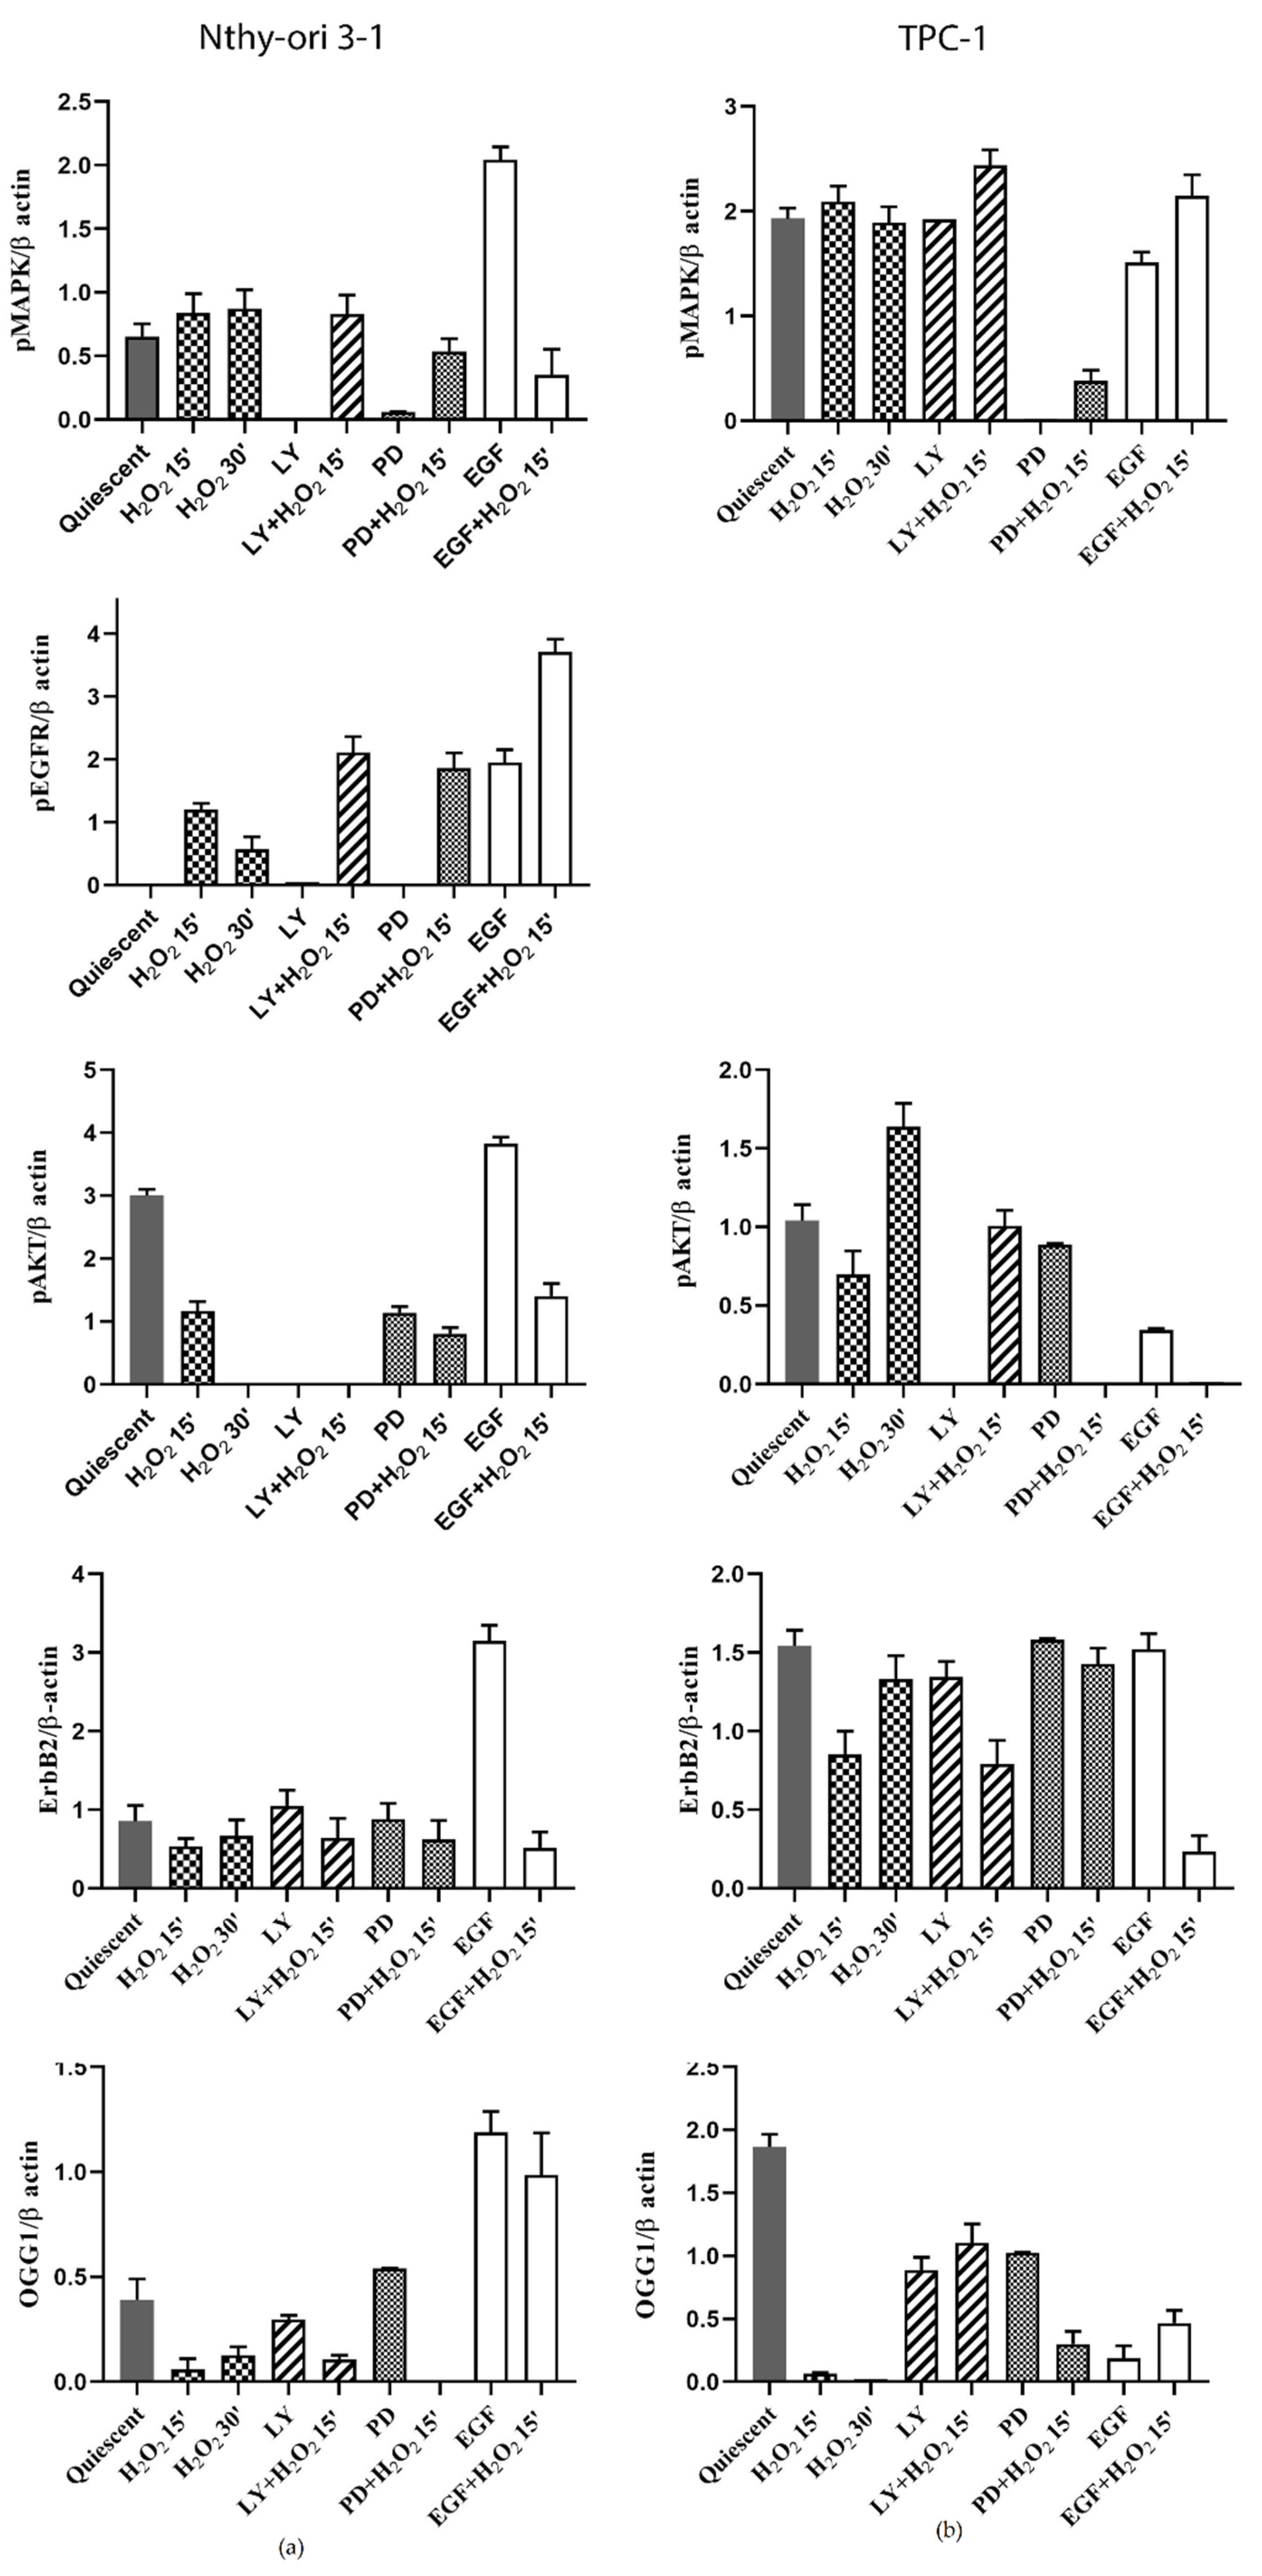
3.6. Protein Expression of ErbB Pathway and OGG1 in NThy-ori 3-1 and TPC-1 Cells

The effect induced by acute H2O2 stress on ErbB and OGG1 pathways was also assessed on protein expression. Western blotting analyses showed that the OGG1 protein was expressed in quiescent Nthy-ori 3-1 cells, with clearly visible bands, at approximately 50 kDa (Figure 9a) [37,38]. This OGG1 isoform was reduced or absent after H2O2 treatments alone or combined with AKT and MAPK inhibitors (LY and PD, respectively). Instead, the same bands increased after PD and EGF treatment (Figure 9a), while EGF and H2O2 co-treatment seemed to induce further OGG1 post-transcriptional modifications, thus allowing the detection of 37kD isoform (Figure 9a).
The 37 kDa band, which should correspond to the nuclear OGG1 isoform (1a) [37] was increased by EGF and H2O2 co-treatment. The level of PARP-1 protein expression was very mild in quiescent NThy-ori 3-1 and TPC-1 cells and the oxidative stress did not seem to modulate it (data no shown). Under all the experimental conditions we used, this protein resulted not cleaved, indicating that apoptosis (PARP-1-dependent) has not been activated.
Unlike what observed in normal Nthy-ori 3-1, in TPC-1 cells H2O2 increased OGG1 expression after MAPK pathway inhibition, and EGF stimulation caused relevant changes respect to untreated quiescent cells (Figure 9a vs. Figure 9b). In Nthy-ori 3-1 cell line, the protein level of EGFR remained unchanged upon all treatments (data not shown), while, as expected, its phosphorylation in Tyr1068 was absent in starved untraded cells and appeared after EGF stimulation (Figure 9a). The acute stress by H2O2 always induced EGFR phosphorylation even after inhibition of the AKT and MAPK. In all experimental conditions, ErbB2 was expressed and slightly reduced following oxidative stress (Figure 9a). In quiescent cells, MAPK phosphorylation was observed, while it was lightly inhibited by treatment with LY alone and with EGF plus H2O2. PD and H2O2 co-treatment increased MAPK phosphorylation compared with PD alone. In quiescent untreated cells, a high level of phospho-AKT was detected, and H2O2 treatment, after 30’, inhibited it so as to be undetected. PD treatment led a decrease in AKT phosphorylation which was more pronounced after co-treatment with H2O2.
Papillary thyroid cancer model TPC-1 did not express p-EGFR under any of the tested conditions (data not shown), whereas ErbB2 protein was always expressed and particularly increased after PD and EGF alone treatments (Figure 9b). The MAPK were activated in all experimental conditions especially with LY and H2O2 co-treatment, contrary to what observed in normal cells. AKT was activated in the presence of H2O2 also with PD and EGF alone. Relative expression quantification of the analyzed proteins in Nthy-ori3-1 and TPC-1 cells are visible in Figure 10.

4. Discussion

Thyroid diseases have a complex and multifactorial etiology [39]. Despite the numerous studies on the signals referable to the malignant transition [3], the molecular mechanisms concerning the role of oxidative stress in diseases and carcinogenesis of thyroid remain elusive. Indeed, it has long been believed that oxidative stress plays an active role in carcinogenesis and cancer progression [5]. One of the molecules with pro-oxidant characteristics is H2O2. It is physiologically produced and is involved in the adaptation to stress and in chronic inflammatory responses [9,10], but it is also actively produced in the thyroid as necessary for thyroid hormone synthesis. However, there are still many gaps in our knowledge regarding the cellular signaling network attributable to H2O2 and to DNA damage in thyroid. Based on its strong oxidative power, H2O2 in cancer cells with high proliferative rate could be responsible for the high level of oxidative DNA damage as observed in cancerous thyroid tissue [15] and hyperactivation of some signaling pathways [10] including mitogen-activated protein kinase (MAPK), and PI3K/Akt, involved in ErbB signaling [13,40].
Several studies on exposure of thyroid cells to irradiation or to nonlethal concentrations of H2O2 have shown that H2O2 can cause DNA damage, also supporting the hypothesis that H2O2 generation in the thyroid could play a role in mutagenesis, especially when antioxidant defense is deficient. [4]. Indeed, marked increases in the presence of 8-oxoG in nuclear and mitochondrial DNA were evident after treatment with H2O2 or ionizing radiation. [16]. In aqueous solutions, as in the cellular interior, the reaction of H2O2 with guanine leads to the formation of 8-oxoG complexed with a water molecule can occur according to two different mechanisms that have two steps each. The processes are described in detail by Jena et colleagues [41]. H2O2 exposure has also been widely used to study the dynamics of 8-oxoG in mitochondrial DNA in wild-type and OGG1-deficent cell models. [42] Wang and colleagues used H2O2 to simulate oxidative stress. They stated that although it is not a free radical, H2O2 can circulate in cells and be efficiently converted to a hydroxyl radical and lead to an overall increase in genomic 8-oxoG level even in cells with wild-type OGG1. This increase in DNA lesions in proliferant cells was detected starting at 5 min of treatment, peaking at 15 min, and were then rapidly repaired by wild-type OGG1, restoring the redox balance. The authors also argued that the high level of 8-oxoG itself might not increase cell death [22].
In this study, we investigated the relationship between the EGFR and OGG1-BER pathways and its regulation following acute oxidative stress by H2O2 in quiescent human thyroid cells. We evaluated, in both starved cell models, the effects of H2O2 on cell viability. Initially, the range of concentrations chosen was supposed to mimic momentary distress compared with physiological amounts of H2O2 produced by thyroid models in vitro [33], but also to what might be produced in the tissue microenvironment, e.g., under infectious and/or inflammatory conditions [10].
The H2O2 response of cultured cells appears to depend on many factors [41], In starved cells, we observed a rapid decline in cell viability after H2O2 treatment due to H2O2 interference with mitochondrial activity (Figure 1) and apoptosis/death (Figure S1) [43]. In additional analysis of cell cycle, after H2O2 treatment, we did not observe sub-G1 cells in the H2O2-treated samples (Figure 2a). TPC-1 tumor cells showed a recovery of viability at 3 h with the lowest concentrations of H2O2, this phenomenon also appears to occur in other tumor cell models [44] and could be due to the multiple functional ormetic properties of H2O2 in the cell context [44,45,46]. On the other hand, we must also consider that in thyrocytes the TPO downregulation, reducing its H2O2 chemo-protective function, is involved in the evolution of nodularity towards the condition of tumorigenesis [47], in TPC-1 the expression of TPO was not detected. H2O2, is a crucial substrate for thyroid peroxidase (TPO), a key enzyme involved in thyroid hormone synthesis [8]. On the plasma membrane of thyrocytes, TPO is associated with oxidoreductase dual oxidase 2 (DUOX2) and this functional interaction is essential for the regulation of the extracellular H2O2 level [8].
Based on the above considerations, in this study we highlighted the crosstalk effect between EGFR and OGG1-BER on gene expression modulation, by stimulating starved thyroid cells with H2O2 and EGF, and inhibiting EGFR its downstream ways, AKT and MAPK, using LY and PD (respectively) for a short time (15’ and 30’). We assessed the physiological relationships between the two pathways using a normal thyroid cell line (Nthy-ori 3-1), and verified the dysregulations of these signals in TPC-1 tumor cells. Nthy-ori 3-1 cells were treated with H2O2, EGF, LY and PD alone and in combination. We observed that expression of genes involved in BER pathway, i.e., OGG1, MUTYH, APE-1/Ref1 and PPARγ, exhibited generally the same trend, resulting upregulated by H2O2 and downregulated by LY and PD. The NRF2 gene expression decreased with EGF, LY and PD (with and without H2O2), while in contrast OGG1 increased. This suggested that in thyroid OGG1 may be regulated by a NRF2-indipendent way, in spite of the presence of an ARE (antioxidant response elements) region recognized by NRF2 in OGG1 promoter [48]. In addition, the expression of the HO1 gene, which responds both to oxidative stress and to NRF2-mediated gene regulation in different tissues [49], displayed a different behavior with respect to NRF2. These data did not completely exclude a role of NRF2 transcription factor in the response to acute oxidative stress in our system, because it is well-known that there are inactive form resides as subcellular compartmentalization pool bounded to Keap1 [50]. Gene expression cluster analysis showed that when Nthy-ori 3-1 cells were stimulated with EGF and H2O2, OGG1 and APE1/Ref1 showed a strong correlation with NRF2 and its downstream HO1 and IL8. Instead, MUTYH demonstrated a correlation with ErbB2 and PPARg (Figure 8a,b). After LY treatment no significant correlation between any of the BER genes was shown (Figure 8c). Interestingly, MAPK inhibition (with PD) was the only experimental condition in which we observed a correlation between ErbB genes, this suggests a positive feedback mechanism in control gene expression (Figure 8d). Our results highlighted that the inhibition of ErbB receptors downstream pathways may have a role in dysregulation of the BER genes.
After inhibition of the AKT pathway, a correlation was observed between OGG1 and JUN/AP1 while after MAPK inhibition (Figure 8c,d), they correlated with CXC chemokine IL-8 (also CXCL8) and JUN/AP1, as reported in the literature [51]. Therefore, the JUN/AP1transcriptional activator could play a pivotal role in the correlation between the ErbB and BER systems (Figure 7).
Pro-inflammatory CXC chemokine IL-8 (CXCL8) gene expression was significantly increased in Nthy-ori 3-1 proliferating cells and after H2O2 treatments compared with starved cells. On the contrary, IL-8 was reduced after EGF, LY and PD treatments alone and combined with H2O2 (Figure 4). Our data confirmed that IL-8 plays a role in response to oxidative stress that also stimulate its own production [52]. Interestingly, its synthesis may be dependent by EGFR activation [53]. IL-8 was the first demonstrated chemokine to be secreted by human normal thyrocytes [54]. Moreover, the secretion of IL-8 by cancer cells can enhance the proliferation and survival capabilities through an autocrine loop [53]. MUTYH gene in Nthy-ori 3-1 cells was clustered with other BER genes under oxidative stress conditions, whereas EGF induced a correlation with PPARγ and ErbB2 (Figure 2 and Figure 3), but this correlation was lost after LY and PD treatment suggesting that MUTYH gene expression might be regulated by EGFR pathways. Furthermore, gene expression data underlined a close correlation among MUTYH, HO1 and OGG1, following H2O2 treatment. In contrast, following EGF treatment, a close correlation among MUTYH, PPARγ and ErbB2 was shown. These results confirmed the relationship between ErbB2 and PPARγ in regulating cell proliferation and metabolism as already displayed in other tissues [55]. It also highlights a bivalent role for MUTYH, under acute oxidative stress condition MUTYH showed a correlation with the other BER genes, probably because the primary necessity of cells is to defends itself from the high level of oxidative stress, whereas after EGF growth stimulus MUTYH showed a correlation with ErbB2 and PPARγ likely due to an increase in the metabolism rather than DNA repair, which becomes a secondary mechanism.
In Nthy-ori 3-1 cells, EGF treatment increased ErbB2 gene expression only in combination with H2O2. The same effect was observed by blocking MAPK pathway by PD (Figure 3a). Under the effect of LY and PD, cotreated with H2O2, EGFR expression increased significantly (Figure 3a). These data were confirmed by protein analysis showing changes in EGFR receptor activation after H2O2 treatment without altering its expression (Figure 9). These results led us to suggest the presence of fine-tuned mechanisms that regulate signals downstream of EGF and crosstalk with activities controlled by OGG1 protein. The simultaneous presence of a factor that stimulates cellular growth (i.e., EGF) and adaptation to the H2O2-mediated oxidative stress, induced the expression of different isoforms of the OGG1 in these cells. Our results showed that OGG1 protein in normal thyroid cells was expressed in several isoforms depending on the treatments used (Figure 8). These findings could be explained both on the basis of that is currently known about this enzyme; an alternative splicing mechanism that acts on the C-terminal region was delineated. As a consequence, all isoforms share the N-terminal region but differ in C-terminal, determining the existence of several isoforms, such as the alternative splicing process of the C-terminal region of OGG1 [35,36] and on post-translational modifications occurred as a response to the stress [56]. Currently, most of the activities of these isoforms are unknown.
In the normal system, OGG1 was shown to be controlled by the AKT pathway as it also decreased in protein level, while the stimulation with EGF increased its expression in many of its isoforms (Figure 9). Our results highlighted that the inhibition of ErbB receptors downstream pathways may have a role in modulation of the OGG1 end BER. This aspect is very dysregulated in the TPC-1 tumor cell which shows a strong expression of OGG1 despite the inhibition of AKT (Figure 9b).
In Nthy-ori cells, upon H2O2 treatment, AKT activity decreased under all conditions tested, whereas in TPC-1 cells, AKT activity increased upon H2O2 treatment. This difference in signaling between the two models could be explained by H2O2-driven deregulation in the mTOR pathways in TPC tumor model. H2O2, acting as an intracellular messenger, can activate phosphatidylinositol-3-kinase (PI3K) and its downstream target Akt, promoting cell survival. Accumulation of ROS has been associated with activation/phosphorylation of AKT to inactivation/phosphorylation of tuberin and activation of mTOR/complex II. Activation of adenosine-monophosphate-activated protein kinase (AMPK) by rapamycin may directly impact OGG1 activation or indirectly through blocking mTOR activity. This unusual activation of AKT is also followed by a higher protein level of OGG1 in the LY + H2O2 condition, which is not reflected in mRNA levels. The increase in OGG1 was detected in several tumor cells treated to suppress mTOR activity. Rapamycin treatments can inhibit mTORC1 through increased phosphorylation of AMPK and lead to increased OGG1 activity. Although lower concentrations of rapamycin appeared to inhibit the activation of mTOR activation in cancer cells, higher concentrations were required to increase the protein and promoter activity of OGG1, suggesting that high concentrations of rapamycin may be required to activate other kinases, such as AMPK, in addition to blocking mTOR activity [57]. In support of this hypothesis, rapamycin increases the phosphorylation of AMPK, a signaling intermediate upstream of the mTOR pathway in several tumor cells. Activation of AMPK by rapamycin results in the inhibition of mTOR activity and increased protein expression and promoter activity of OGG1. In addition, activation of AMPK, by 5-aminoimidazole-4-carboxamide riboside (AICAR), resulted in inhibition of mTOR activity and increased promoter activity and protein expression of OGG1 in tuberin-deficient and von Hippel–Lindau (VHL) deficient cells [57].
The mechanism of regulation of cellular OGG1 protein, particularly in response to oxidative stress, is unclear. The stability of OGG1 is increased in response to oxidative stress induced by ionizing radiation. As a consequence of prolonged OGG1 stability and increased excision activity in the absence of E3 ubiquitin-protein ligase NEDD4-like, cells show increased DNA repair capacity but, conversely, this decreases post-irradiation cell survival. This effect may be reproduced upon overexpression of OGG1, suggesting that dysregulation of OGG1 increases intermediate DNA lesion formation [58]. Therefore, it would be very interesting to further investigate these functional aspects of OGG1 in papillary thyroid carcinoma with RET/TPC rearrangements.
Although OGG1-BER protects the genome integrity by repairing the lesion or eliminating cells with malignant potential and its overexpression improves H2O2-induced cell death [22], in the case of TPC-1 cells, the lack of MUTYH gene expression could favor the maintenance of tumor phenotype loop [59]. Furthermore, this confirms that OGG1, as a sensor in the BER response, can be controlled both at the gene and protein level by the Pi3K/AKT pathway, while this was not detected following stimulation by EGF and H2O2. Probably in quiescent TPC-1 cells, the presence of the RET/PTC rearrangement keeps the growth pathways independent of EGF stimulation by not expressing p-EGFR, as it appears to be (albeit slightly) in TPC-1 proliferating cells [60]. Molecular studies have also shown that RET/PTC in human thyrocytes promotes the activation of inflammation-related genes expression, and this could contribute to the progression and locoregional metastases, characteristic of the PTC tumors [60,61]. Stimulation of the OGG1 isoforms could also be caused by this aspect. Indeed, some studies have shown that the 8-oxoguanin glycosylase-1 repair enzyme is also involved in inflammation regulation and diseases [62,63].
TPC-1 cells showed a strong deregulation of the BER, OGG1 and MUTYH, components (Figure 2) with a loss in the gene expression of MUTYH and an increased expression of APE-1/Ref1. This result could be due to the presence of the RET/PTC rearrangement in the papillary tumor model; indeed, oncogenic potential of RET/PTC is related to intrinsic tyrosine kinase activity and repression of p53-dependent transactivation [64]. Moreover, some previous studies have shown that the gene expression of MUTYH is controlled by TP53 [65] and that TP53 can also modulate the transcriptional activity of APE-1/Ref1 [66]. At present, these interactions between tyrosine kinase activities and BER signaling modulations have not yet been adequately explored in thyroid carcinogenesis and deserve further study.

5. Conclusions

Our observations highlighted that human thyroid cells, under acute oxidative stress, activate a physiological cross-regulation between the ErbB and OGG1-BER pathways. This regulation, assessed in a normal thyroid epithelial cell model and in a differentiated papillary cancer model, appeared to be dependent on H2O2- and EGF-related oxidative signals. This was evidenced by the significant positive response of OGG1 protein to inhibition of MAPK and AKT signaling, as well as the complete inhibition of MUTYH gene expression and the very strong increase in APE1 gene expression. Our data on OGG1 protein expression suggest that it was physiologically regulated in response to oxidative modulation of ErbB, and that these might be dysregulated in the signaling pathway involving AKT in the progression of thyroid malignancies with RET/PTC rearrangements. Overall, this study suggests further investigation of the pathophysiological interactions of OGG1-BER pathways to elucidate the mechanisms underlying the onset and development of thyroid diseases.

Supplementary Materials

The following are available online at https://www.mdpi.com/article/10.3390/cells11050822/s1, Table S1: Details of primers for each evaluated gene by qRT-PCR and gene dosage assay, Figure S1: FACS analysis for FITC-Annexin-V-based apoptosis detection.

Author Contributions

C.M. contributed to study design, gene expression, data curation and wrote the manuscript; M.C.D.M., L.S. and E.D. performed cell cultures and protein analyses; R.C., G.M. and R.M. critically reviewed the manuscript; G.M.A. designed and coordinated the study and drafted the manuscript; G.S. performed gene dosage assay; P.S. and P.L. FACS analysis and data curation. All authors contributed to data analysis, drafting or revising the article, gave final approval of the version to be published, and agree to be accountable for all aspects of the work. All authors have read and agreed to the published version of the manuscript.

Funding

This research was funded by the “G. d’Annunzio” University of Chieti-Pescara (Fondi di Ateneo per la Ricerca–F.A.R.) grants to G.M.A., G.M., R.C. and R.M.

Institutional Review Board Statement

Not applicable.

Informed Consent Statement

Not applicable.

Data Availability Statement

The datasets used and/or analyzed during the current study are available from the corresponding author upon reasonable request.

Conflicts of Interest

The authors declare that they have no competing interest.

Abbreviations

AMPKadenosine-monophosphate-activated protein kinase
AKTprotein kinase B
BERbase excision repair
DUOX2dual oxidase 2
APE1/Ref1apurinic/apyrimidinic endodeoxyribonuclease-1
EGFRepidermal growth factor receptor
ErbB2Erb-B2 receptor tyrosine kinase 2
ErbB3Erb-B3 receptor tyrosine kinase 3
ErbB4Erb-B4 receptor tyrosine kinase 4
GUSBglucuronidase Beta
HO1heme oxygenase 1
IL8CXCL8, interleukin 8
Jun/AP1Jun proto-oncogene, AP-1 transcription factor subunit
LYLY294002;
MAPKmitogen-activated protein kinase
MUTYHmutY DNA glycosylase
NRF2realted factor
OGG18-oxoguanine glycosylase-1
PPARgperoxisome-proliferator-activated receptor gamma
PTCpapillary thyroid carcinoma
ROSreactive oxygen species
TPOthyroid peroxidase
ZEB-1zinc finger E-box-binding homeobox 1
PDPD98059

References

  1. Lim, H.; Devesa, S.S.; Sosa, J.A.; Check, D.; Kitahara, C.M. Trends in Thyroid Cancer Incidence and Mortality in the United States, 1974-2013. JAMA 2017, 317, 1338–1348. [Google Scholar] [CrossRef] [PubMed]
  2. Johnson, N.A.; Tublin, M.E. Postoperative surveillance of differentiated thyroid carcinoma: Rationale, techniques, and controversies. Radiology 2008, 249, 429–444. [Google Scholar] [CrossRef]
  3. Arora, N.; Scognamiglio, T.; Zhu, B.; Fahey, T.J. Do benign thyroid nodules have malignant potential? An evidence-based review. World J. Surg. 2008, 32, 1237–1246. [Google Scholar] [CrossRef]
  4. Ameziane El Hassani, R.; Buffet, C.; Leboulleux, S.; Dupuy, C. Oxidative stress in thyroid carcinomas: Biological and clinical significance. Endocr. Relat. Cancer. 2019, 26, R131–R143. [Google Scholar] [CrossRef] [Green Version]
  5. Moloney, J.N.; Cotter, T.G. ROS signaling in the biology of cancer. Semin. Cell Dev. Biol. 2018, 80, 50–64. [Google Scholar] [CrossRef] [PubMed]
  6. Ekholm, R. Iodination of thyroglobulin: An intracellular or extracellular process? Mol. Cell. Endocrinol. 1981, 24, 141–163. [Google Scholar] [CrossRef]
  7. Howie, A.F.; Arthur, J.R.; Nicol, F.; Walker, S.W.; Beech, S.G.; Beckett, G.J. Identification of a 57-kilodalton selenoprotein in human thyrocytes as thioredoxin reductase and evidence that its expression is regulated through the calcium-phosphoinositol signaling pathway. J. Clin. Endocrinol. Metab. 1998, 83, 2052–2058. [Google Scholar]
  8. Carvalho, D.P.; Dupuy, C. Thyroid hormone biosynthesis and release. Mol. Cell. Endocrinol. 2017, 458, 6–15. [Google Scholar] [CrossRef]
  9. Sigurdson, A.J.; Hauptmann, M.; Alexander, B.H.; Doody, M.M.; Thomas, C.B.; Struewing, J.P.; Jones, I.M. DNA damage among thyroid cancer and multiple cancer cases, controls, and long-lived individuals. Mutat. Res. 2005, 586, 173–188. [Google Scholar] [CrossRef] [Green Version]
  10. Sies, H. Hydrogen peroxide as a central redox signaling molecule in physiological oxidative stress: Oxidative eustress. Redox Biol. 2017, 11, 613–619. [Google Scholar] [CrossRef]
  11. Kumari, S.; Badana, A.K.; Mohan, G.M.; Shailender, G.; Malla, R. Reactive Oxygen Species: A Key Constituent in Cancer Survival. Biomark. Insights 2018, 13, 1177271918755391. [Google Scholar] [CrossRef] [PubMed] [Green Version]
  12. Weng, M.S.; Chang, J.H.; Hung, W.Y.; Yang, Y.C.; Chien, M.H. The interplay of reactive oxygen species and the epidermal growth factor receptor in tumor progression and drug resistance. J. Exp. Clin. Cancer Res. 2018, 37, 61. [Google Scholar] [CrossRef] [PubMed] [Green Version]
  13. Metere, A.M.; Frezzotti, F.; Graves, C.E.; Vergine, M.; De Luca, A.; Pietraforte, D.; Giacomelli, L.A. Possible role for selenoprotein glutathione peroxidase (GPx1) and thioredoxin reductases (TrxR1) in thyroid cancer: Our experience in thyroid surgery. Cancer Cell Int. 2018, 18, 7. [Google Scholar] [CrossRef] [PubMed]
  14. Szanto, I.; Pusztaszeri, M.; Mavromati, M. H2O2 Metabolism in Normal Thyroid Cells and in Thyroid Tumorigenesis: Focus on NADPH Oxidases. Antioxidants 2019, 8, 126. [Google Scholar] [CrossRef] [Green Version]
  15. Yi, J.W.; Park, J.Y.; Sung, J.Y.; Kwak, S.H.; Yu, J.; Chang, J.H.; Kim, J.H.; Ha, S.Y.; Paik, E.K.; Lee, W.S.; et al. Genomic evidence of reactive oxygen species elevation in papillary thyroid carcinoma with Hashimoto thyroiditis. Endocr. J. 2015, 62, 857–877. [Google Scholar] [CrossRef] [Green Version]
  16. Soultanakis, R.P.; Melamede, R.J.; Bespalov, I.A.; Wallace, S.S.; Beckman, K.B.; Ames, B.N.; Taatjes, D.J.; Janssen-Heininger, Y.M. Fluorescence detection of 8-oxoguanine in nuclear and mitochondrial DNA of cultured cells using a recombinant Fab and confocal scanning laser microscopy. Free Radic. Biol. Med. 2000, 28, 987–998. [Google Scholar] [CrossRef]
  17. Mo, J.Y.; Maki, H.; Sekiguchi, M. Hydrolytic elimination of a mutagenic nucleotide, 8-oxodGTP by human 18-kilodalton protein: Sanitization of nucleotide pool. Proc. Natl. Acad. Sci. USA 1992, 89, 11021–11025. [Google Scholar] [CrossRef] [Green Version]
  18. Oka, S.; Leon, J.; Tsuchimoto, D.; Sakumi, K.; Nakabeppu, Y. MUTYH, an adenine DNA glycosylase, mediates p53 tumor suppression via PARP-dependent cell death. Oncogenesis. 2015, 4, e142. [Google Scholar] [CrossRef] [Green Version]
  19. Banda, D.M.; Nuñez, N.N.; Burnside, M.A.; Bradshaw, K.M.; David, S.S. Repair of 8-oxoG:A mismatches by the MUTYH glycosylase:Mechanism, metals and medicine. Free Radic. Biol. Med. 2017, 107, 202–215. [Google Scholar] [CrossRef]
  20. Paschke, R. Molecular pathogenesis of nodular goiter. Langenbecks Arch. Surg. 2011, 396, 1127–1397. [Google Scholar] [CrossRef]
  21. Svilar, D.; Goellner, E.M.; Almeida, K.H.; Sobol, R.W. Base excision repair and lesion-dependent subpathways for repair of oxidative DNA damage. Antioxid. Redox Signal 2011, 14, 2491–2507. [Google Scholar] [CrossRef] [Green Version]
  22. Wang, R.; Li, C.; Qiao, P.; Xue, Y.; Zheng., X.; Chen, H.; Zeng, X.; Liu, W.; Boldogh, I.; Ba, X. OGG1-initiated base excision repair exacerbates oxidative stress-induced parthanatos. Cell Death Dis. 2018, 9, 628. [Google Scholar] [CrossRef] [PubMed]
  23. Mincione, G.; Di Marcantonio, M.C.; Tarantelli, C.; D’Inzeo, S.; Nicolussi, A.; Nardi, F.; Donini, C.F.; Coppa, A. EGF and TGF-β1 Effects on Thyroid Function. J. Thyroid Res. 2011, 2011, 431718. [Google Scholar] [CrossRef] [PubMed] [Green Version]
  24. Ely, A.; Bischoff, L.A.; Weiss, V.L. Wnt signaling in thyroid homeostasis and carcinogenesis. Genes 2018, 9, 204. [Google Scholar] [CrossRef] [Green Version]
  25. Chen, D.J.; Nirodi, C.S. The epidermal growth factor receptor: A role in repair of radiation- induced DNA damage. Clin. Cancer Res. 2007, 13, 6555–6560. [Google Scholar] [CrossRef] [Green Version]
  26. Bensimon, A.; Aebersold, R.; Shiloh, Y. Beyond ATM: The protein kinase landscape of the DNA damage response. FEBS Lett. 2011, 585, 1625–1639. [Google Scholar] [CrossRef] [Green Version]
  27. Oberthür, R.; Seemann, H.; Gehrig, J.; Rave-Fränk, M.; Bremmer, F.; Halpape, R.; Conradi, L.C.; Scharf, J.G.; Burfeind, P.; Kaulfuß, S. Simultaneous inhibition of IGF1R and EGFR enhances the efficacy of standard treatment for colorectal cancer by the impairment of DNA repair the induction of cell death. Cancer. Lett. 2017, 407, 93–105. [Google Scholar] [CrossRef]
  28. Saiselet, M.; Floor, S.; Tarabichi, M.; Dom, G.; Hébrant, A.; van Staveren, W.C.; Maenhaut, C. Thyroid cancer cell lines: An overview. Front. Endocrinol. 2012, 3, 133. [Google Scholar] [CrossRef] [Green Version]
  29. Nicolussi, A.; D’Inzeo, S.; Mincione, G.; Buffone, A.; Di Marcantonio, M.C.; Cotellese, R.; Cichella, A.; Capalbo, C.; Di Gioia, C.; Nardi, F.; et al. PRDX1 and PRDX6 are repressed in papillary thyroid carcinomas via BRAF V600E-dependent and -independent mechanisms. Int. J. Oncol. 2014, 44, 548–556. [Google Scholar] [CrossRef] [PubMed] [Green Version]
  30. Pirkmajer, S.; Chibalin, A.V. Serum starvation: Caveat emptor. Am. J. Physiol. Cell. Physiol. 2011, 301, C272–C279. [Google Scholar] [CrossRef] [Green Version]
  31. Massart, C.; Hoste, C.; Virion, A.; Ruf, J.; Dumont, J.E.; Van Sande, J. Cell biology of H2O2 generation in the thyroid: Investigation of the control of dual oxidases (DUOX) activity in intact ex vivo thyroid tissue and cell lines. Mol. Cell Endocrinol. 2011, 343, 32–44. [Google Scholar] [CrossRef]
  32. Lanuti, P.; Fuhrmann, S.; Lachmann, R.; Marchisio, M.; Miscia, S.; Kern, F. Simultaneous characterization of phospho-proteins and cell cycle in activated T cell subsets. Int. J. Immunopathol. Pharmacol. 2009, 22, 689–698. [Google Scholar] [CrossRef] [PubMed]
  33. Bologna, G.; Lanuti, P.; D’Ambrosio, P.; Tonucci, L.; Pierdomenico, L.; D’Emilio, C.; Celli, N.; Marchisio, M.; d’Alessandro, N.; Santavenere, E.; et al. Water-soluble platinum phthalocyanines as potential antitumor agents. Biometals 2014, 27, 575–589. [Google Scholar] [CrossRef]
  34. Moscatello, C.; Di Nicola, M.; Veschi, S.; Di Gregorio, P.; Cianchetti, E.; Stuppia, L.; Battista, P.; Cama, A.; Curia, M.C.; Aceto, G.M. Relationship between MUTYH, OGG1 and BRCA1 mutations and mRNA expression in breast and ovarian cancer predisposition. Mol. Clin. Oncol. 2021, 14, 15. [Google Scholar] [CrossRef]
  35. Aceto, G.M.; Fantini, F.; De Iure, S.; Di Nicola, M.; Palka, G.; Valanzano, R.; Di Gregorio, P.; Stigliano, V.; Genuardi, M.; Battista, P.; et al. Correlation between mutations and mRNA expression of APC and MUTYH genes: New insight into hereditary colorectal polyposis predisposition. J. Exp. Clin. Cancer Res. 2015, 34, 131. [Google Scholar] [CrossRef] [Green Version]
  36. Saeed, A.I.; Sharov, V.; White, J.; Li, J.; Liang, W.; Bhagabati, N.; Braisted, J.; Klapa, M.; Currier, T.; Thiagarajan, M.; et al. TM4: A free, open-source system for microarray data management and analysis. Biotechniques 2003, 34, 374–378. [Google Scholar] [CrossRef] [PubMed] [Green Version]
  37. Furihata, C. An active alternative splicing isoform of human mitochondrial 8-oxoguanine DNA glycosylase (OGG1). Genes Environ. 2015, 37, 21. [Google Scholar] [CrossRef] [PubMed] [Green Version]
  38. Pal, R.; Ramdzan, Z.M.; Kaur, S.; Duquette, P.M.; Marcotte, R.; Leduy, L.; Davoudi, S.; Lamarche-Vane, N.; Iulianella., A.; Nepveu., A. CUX2 protein functions as an accessory factor in the repair of oxidative DNA damage. J. Biol. Chem. 2015, 290, 22520–22531. [Google Scholar] [CrossRef] [PubMed] [Green Version]
  39. Böttcher, Y.; Eszlinger, M.; Tönjes, A.; Paschke, R. The genetics of euthyroid familial goiter. Trends Endocrinol. Metab. 2005, 16, 314–319. [Google Scholar] [CrossRef]
  40. Yarden, Y.; Sliwkowski, M.X. Untangling the ErbB signaling network. Nat. Rev. Mol. Cell Biol. 2001, 2, 127–137. [Google Scholar] [CrossRef]
  41. Jena, N.R.; Mishra, P.C. Mechanisms of formation of 8-oxoguanine due to reactions of one and two OH* radicals and the H2O2 molecule with guanine: A quantum computational study. J. Phys. Chem. B 2005, 109, 14205–14218. [Google Scholar] [CrossRef] [PubMed]
  42. Ohno, M.; Oka, S.; Nakabeppu, Y. Quantitative analysis of oxidized guanine, 8-oxoguanine, in mitochondrial DNA by immunofluorescence method. Methods Mol. Biol. 2009, 554, 199–212. [Google Scholar] [PubMed]
  43. Barbouti, A.; Amorgianiotis, C.; Kolettas, E.; Kanavaros, P.; Galaris, D. Hydrogen peroxide inhibits caspase-dependent apoptosis by inactivating procaspase-9 in an iron-dependent manner. Free Radic. Biol. Med. 2007, 43, 1377–1387. [Google Scholar] [CrossRef] [PubMed]
  44. Halliwell, B. Cell culture, oxidative stress, and antioxidants: Avoiding pitfalls. Biomed J. 2014, 37, 99–105. [Google Scholar] [CrossRef]
  45. Gorrini, C.; Harris, I.S.; Mak, T.W. Modulation of oxidative stress as an anticancer strategy. Nat. Rev. Drug. Discov. 2013, 12, 931–947. [Google Scholar] [CrossRef]
  46. Wu, W.S. The signaling mechanism of ROS in tumor progression. Cancer Metastasis Rev. 2006, 25, 695–705. [Google Scholar] [CrossRef]
  47. Knobel, M.; Medeiros-Neto, G. An outline of inherited disorders of the thyroid hormone generating system. Thyroid 2003, 13, 771–801. [Google Scholar] [CrossRef]
  48. Kim, K.C.; Lee, I.K.; Kang, K.A.; Cha, J.W.; Cho, S.J.; Na, S.Y.; Chae, S.; Kim, H.S.; Kim, S.; Hyun, J.W. 7,8-Dihydroxyflavone suppresses oxidative stress-induced base modification in DNA via induction of the repair enzyme 8-oxoguanine DNA glycosylase-1. BioMed Res. Int. 2013, 2013, 863720. [Google Scholar] [CrossRef] [Green Version]
  49. Loboda, A.; Damulewicz, M.; Pyza, E.; Jozkowicz, A.; Dulak, J. Role of Nrf2/HO-1 system in development, oxidative stress response and diseases: An evolutionarily conserved mechanism. Cell Mol. Life Sci. 2016. 73, 3221–3247. [CrossRef] [Green Version]
  50. Wang, L.; Jiang, H.; Yin, Z.; Aschner, M.; Cai, J. Methylmercury toxicity and Nrf2-dependent detoxification in astrocytes. Toxicol. Sci. 2009, 107, 135–143. [Google Scholar] [CrossRef] [Green Version]
  51. Natarajan, R.; Gupta, S.; Fisher, B.J.; Ghosh, S.; Fowler, A.A., 3rd. Nitric oxide suppresses IL-8 transcription by inhibiting c-Jun N-terminal kinase-induced AP-1 activation. Exp. Cell. Res. 2001, 266, 203–212. [Google Scholar] [CrossRef] [PubMed]
  52. Paszti-Gere, E.; Szeker, K.; Csibrik-Nemeth, E.; Csizinszky, R.; Marosi, A.; Palocz, O.; Farkas, O.; Galfi, P. Metabolites of Lactobacillus plantarum 2142 prevent oxidative stress-induced overexpression of proinflammatory cytokines in IPEC-J2 cell line. Inflammation 2012, 35, 1487–1499. [Google Scholar] [CrossRef] [PubMed]
  53. Waugh, D.J.; Wilson, C. The interleukin-8 pathway in cancer. Clin. Cancer Res. 2008, 14, 6735–6741. [Google Scholar] [CrossRef] [Green Version]
  54. Weetman, A.P.; Bennett, G.L.; Wong, W.L. Thyroid follicular cells produce interleukin-8. J. Clin. Endocrinol. Metab. 1992, 75, 328–330. [Google Scholar] [PubMed]
  55. Menendez, J.A. Fine-tuning the lipogenic/lipolytic balance to optimize the metabolic requirements of cancer cell growth: Molecular mechanisms and therapeutic perspectives. Biochim. Biophys. Acta. 2010, 1801, 381–391. [Google Scholar] [CrossRef]
  56. Carter, R.J.; Parsons, J.L. Base Excision Repair a Pathway Regulated by Posttranslational Modifications. Mol. Cell. Biol. 2016, 36, 1426–1437. [Google Scholar] [CrossRef] [PubMed] [Green Version]
  57. Habib, S.L. Mechanism of activation of AMPK and upregulation of OGG1 by rapamycin in cancer cells. Oncotarget 2011, 2, 958–959. [Google Scholar] [CrossRef] [Green Version]
  58. Hughes, J.R.; Parsons, J.L. The E3 Ubiquitin Ligase NEDD4L Targets OGG1 for Ubiquitylation and Modulates the Cellular DNA Damage Response. Front Cell Dev. Biol. 2020, 12, 607060. [Google Scholar] [CrossRef] [PubMed]
  59. Curia, M.C.; Catalano, T.; Aceto, G.M. MUTYH: Not just polyposis. World J. Clin. Oncol. 2020, 11, 428–449. [Google Scholar] [CrossRef] [PubMed]
  60. Frasca, F.; Vella, V.; Nicolosi, M.L.; Messina, R.L.; Gianì, F.; Lotta, S.; Vigneri, P.; Regalbuto, C.; Vigneri, R. Thyroid cancer cell resistance to gefitinib depends on the constitutive oncogenic activation of the ERK pathway. J. Clin. Endocrinol. Metab. 2013, 98, 2502–2512. [Google Scholar] [CrossRef] [Green Version]
  61. Borrello, M.G.; Alberti, L.; Fischer, A.; Degl’innocenti, D.; Ferrario, C.; Gariboldi, M.; Marchesi, F.; Allavena, P.; Greco, A.; Collini, P.; et al. Induction of a proinflammatory program in normal human thyrocytes by the RET/PTC1 oncogene. Proc. Natl. Acad. Sci. USA 2005, 102, 14825–14830. [Google Scholar] [CrossRef] [PubMed] [Green Version]
  62. Li, G.; Yuan, K.; Yan, C.; Fox, J., 3rd; Gaid, M.; Breitwieser, W.; Bansal, A.K.; Zeng, H.; Gao, H.; Wu, M. 8-Oxoguanine-DNA glycosylase 1 deficiency modifies allergic airway inflammation by regulating STAT6 and IL-4 in cells and in mice. Free Radic Biol. Med. 2012, 52, 392–401. [Google Scholar] [CrossRef] [PubMed] [Green Version]
  63. Ba, X.; Aguilera-Aguirre, L.; Rashid, Q.T.; Bacsi, A.; Radak, Z.; Sur, S.; Hosoki, K.; Hegde, M.L.; Boldogh, I. The role of 8-oxoguanine DNA glycosylase-1 in inflammation. Int. J. Mol. Sci. 2014, 15, 16975–16997. [Google Scholar] [CrossRef] [PubMed] [Green Version]
  64. Kim, D.W.; Hwang, J.H.; Suh, J.M.; Kim, H.; Song, J.H.; Hwang, E.S.; Hwang, I.Y.; Park, K.C.; Chung, H.K.; Kim, J.M.; et al. RET/PTC (rearranged in transformation/papillary thyroid carcinomas) tyrosine kinase phosphorylates and activates phosphoinositide-dependent kinase1 (PDK1): An alternative phosphatidylinositol 3-kinase-independent pathway to activate PDK1. Mol. Endocrinol. 2003, 17, 1382–1394. [Google Scholar] [CrossRef] [PubMed] [Green Version]
  65. Oka, S.; Nakabeppu, Y. DNA glycosylase encoded by MUTYH functions as a molecular switch for programmed cell death under oxidative stress to suppress tumorigenesis. Cancer Sci. 2011, 102, 677–682. [Google Scholar] [CrossRef] [PubMed]
  66. Uddin, M.A.; Akhter, M.S.; Siejka, A.; Catravas, J.D.; Barabutis, N. P53 supports endothelial barrier function via APE1/Ref1 suppression. Immunobiology 2019, 224, 532–538. [Google Scholar] [CrossRef]
Figure 1. Nthy-ori 3-1 (a) and TPC-1 (b) cell line viability under H2O2 stress condition. Cell viability was assayed using MTS. The cells were exposed to H2O2 for different time and concentrations (from 50 µM to 10 mM). For each experiment, n = 5 replicates wells were assayed per clone. Cell viability values were calculated as means and compared with untreated quiescent cells (Q). ***—p < 0.001 vs. quiescent; #—p < 0.05; ##—p < 0.01 cells with same dosage of H2O2 treatment at different time.
Cells 11 00822 g001
Figure 2. Effect of H2O2 [10 mM] on the cell cycle of starved thyroid cell lines. (a) FACS analysis profile of Nthy-ori 3-1 and TPC-1 untreated and treated cells by 10 mM H2O2 after 15 or 30 min; (b) relative percentages in cell cycle stages.
Cells 11 00822 g002
Figure 3. OGG1 (8-Oxoguanine glycosylase), MUTYH (mutY DNA glycosylase), APE1 (apurinic/apyrimidinic endodeoxyribonuclease-1) and PPARγ (peroxisome-proliferator-activated receptor gamma) gene expression modulation under H2O2 [10 mM], EGF, LY and PD treatments alone and combined in Nthy-ori 3-1 cells (a) vs. TPC-1 cells (b). Gene expression was analyzed by real-time qPCR. The histogram represented normalized data with GUSB gene in Nthy-ori 3-1, while the PPARγ expression data were normalized with β-Actin in TPC-1 cells. The expression of MUTYH was undetected in TPC-1 cells (five independent experiments). The results showed the average of three independent experiments. LY—LY294002; PD—PD98059; *—p < 0.05; **—p < 0.01; ***—p < 0.001 treated vs. quiescent cells; #—p < 0.05; ##—p < 0.01; ###—p < 0.001 cells with similar treatment.
Cells 11 00822 g003
Figure 4. EGFR (epidermal growth factor receptor, ERBB2 (Erb-B2 receptor tyrosine kinase 2), ERBB3 (Erb-B3 receptor tyrosine kinase 3) gene expression modulation under H2O2, EGF, LY and PD treatments alone and combined in Nthy-ori 3-1 cells (a) vs. TPC-1 cells (b). Gene expression was analyzed by Real-time qPCR. The histogram represented normalized data with GUSB gene, and the results showed the average of three independent experiments. LY—LY294002; PD—PD98059; *—p < 0.05, **—p < 0.01 ***—p < 0.001 treated vs. quiescent cells; #—p < 0.05, ###—p < 0.001 cells with similar treatment.
Cells 11 00822 g004
Figure 5. NRF2 (nuclear factor erythroid 2–related factor 2), HO1 (heme oxygenase 1), JUN/AP1 (Jun proto-oncogene, AP-1 transcription factor subunit) gene expression and IL8 (CXCL8, interleukin 8) modulation under H2O2, EGF, LY and PD treatments alone and combined in Nthy-ori 3-1 cells (a) vs. TPC-1 cells (b). Gene expression was analyzed by real-time qPCR. The histogram represented normalized data with GUSB gene in Nthy-ori 3-1, while NRF2 and HO1 expression data were normalized with β-Actin in TPC-1 cells. The results showed the average of three independent experiments. LY—LY294002; PD—PD98059; *—p < 0.05; **—p < 0.01; ***—p < 0.001 treated vs. quiescent cells; #—p < 0.05, ##—p < 0.01, ###—p < 0.001 cells with similar treatment.
Cells 11 00822 g005
Figure 6. Gene expression modulation of TPO (thyroid peroxidase) and ZEB-1 (zinc finger E-box binding homeobox 1) under H2O2, EGF, LY and PD treatments alone and combined. (a) Nthy-ori 3-1 cells, (b) TPC-1 cells. Gene expression was analyzed by real-time qPCR. The histogram represented normalized data with GUSB gene, and the results showed the average of three independent experiments. The expression of TPO was undetected in TPC-1 cells. LY—LY294002; PD—PD98059; *—p< 0.05 treated vs. quiescent cells; #—p < 0.05 cells with similar treatment.
Cells 11 00822 g006
Figure 7. MUTYH and OGG1 gene dosage. (a) Nthy-ori 3-1 cells, (b) TPC-1 cells. Gene dosage was performed by SYBR Green qRT-PCR. For both genes were selected two different genomic sequences. The samples were amplified in triplicate in three independent experiments. The gDNA amounts of the target genes were normalized by the ratio on median value of the b-Actin genomic reference gene from TPC-1 vs. Nthy-ori 3-1.
Cells 11 00822 g007
Figure 8. Gene expression cluster analysis by MeV4.9.0 in Nthy-ori 3-1 cells: (a) H2O2 treatments; (b) EGF treatments; (c) LY treatments; (d) PD treatments. The average linkage hierarchical clustering with Pearson correlation was used. The color scale at the top represents the log2 of every single gene expression value compared with housekeeping value ranging from −13 (green) to 4 (red). The trees presented here are the neighbor-joining trees based on gene expression variation in response to different treatments. LY—LY294002; PD—PD98059.
Cells 11 00822 g008
Figure 9. Protein expression and quantification in Nthy-ori 3-1 vs. TPC-1 cells. Nthy-ori 3-1 and TPC-1 cells were starved overnight and treated with, LY294002 (25 μM), PD98059 (50μM), EGF (50 ng/mL) alone and combined with H2O2 (10 mM). Western blotting analysis in Nthy-ori 3-1 cells (a) and in TPC-1 cells (b) determining the protein expression levels of p-EGFR, ErbB2, p-MAPK, p-AKT and OGG1. Results are representative of three independent experiments. Quiescent cells were treated with H2O2 and LY, PD, EGF alone or combined. LY—LY294002; PD—PD98059; kDa—protein molecular weight marker.
Cells 11 00822 g009
Figure 10. Protein expression quantification of ErbB pathway NThy-ori 3-1 vs. TPC-1 cells. Quantification of selected proteins (p-EGFR, ErbB2, p-MAPK, p-AKT) detected by WB in Nthy-ori3-1 and TPC-1 (Figure 9a,b). The expression of p-EGFR, was undetected in TPC-1 cells. The average expression levels of panel (a) and panel (b) were determined by densitometric analysis and calculated in relation to the β-Actin level. Quiescent cells were treated with H2O2 and LY, PD, EGF alone or combined. LY—LY294002; PD—PD98059.
Cells 11 00822 g010
Publisher’s Note: MDPI stays neutral with regard to jurisdictional claims in published maps and institutional affiliations.

