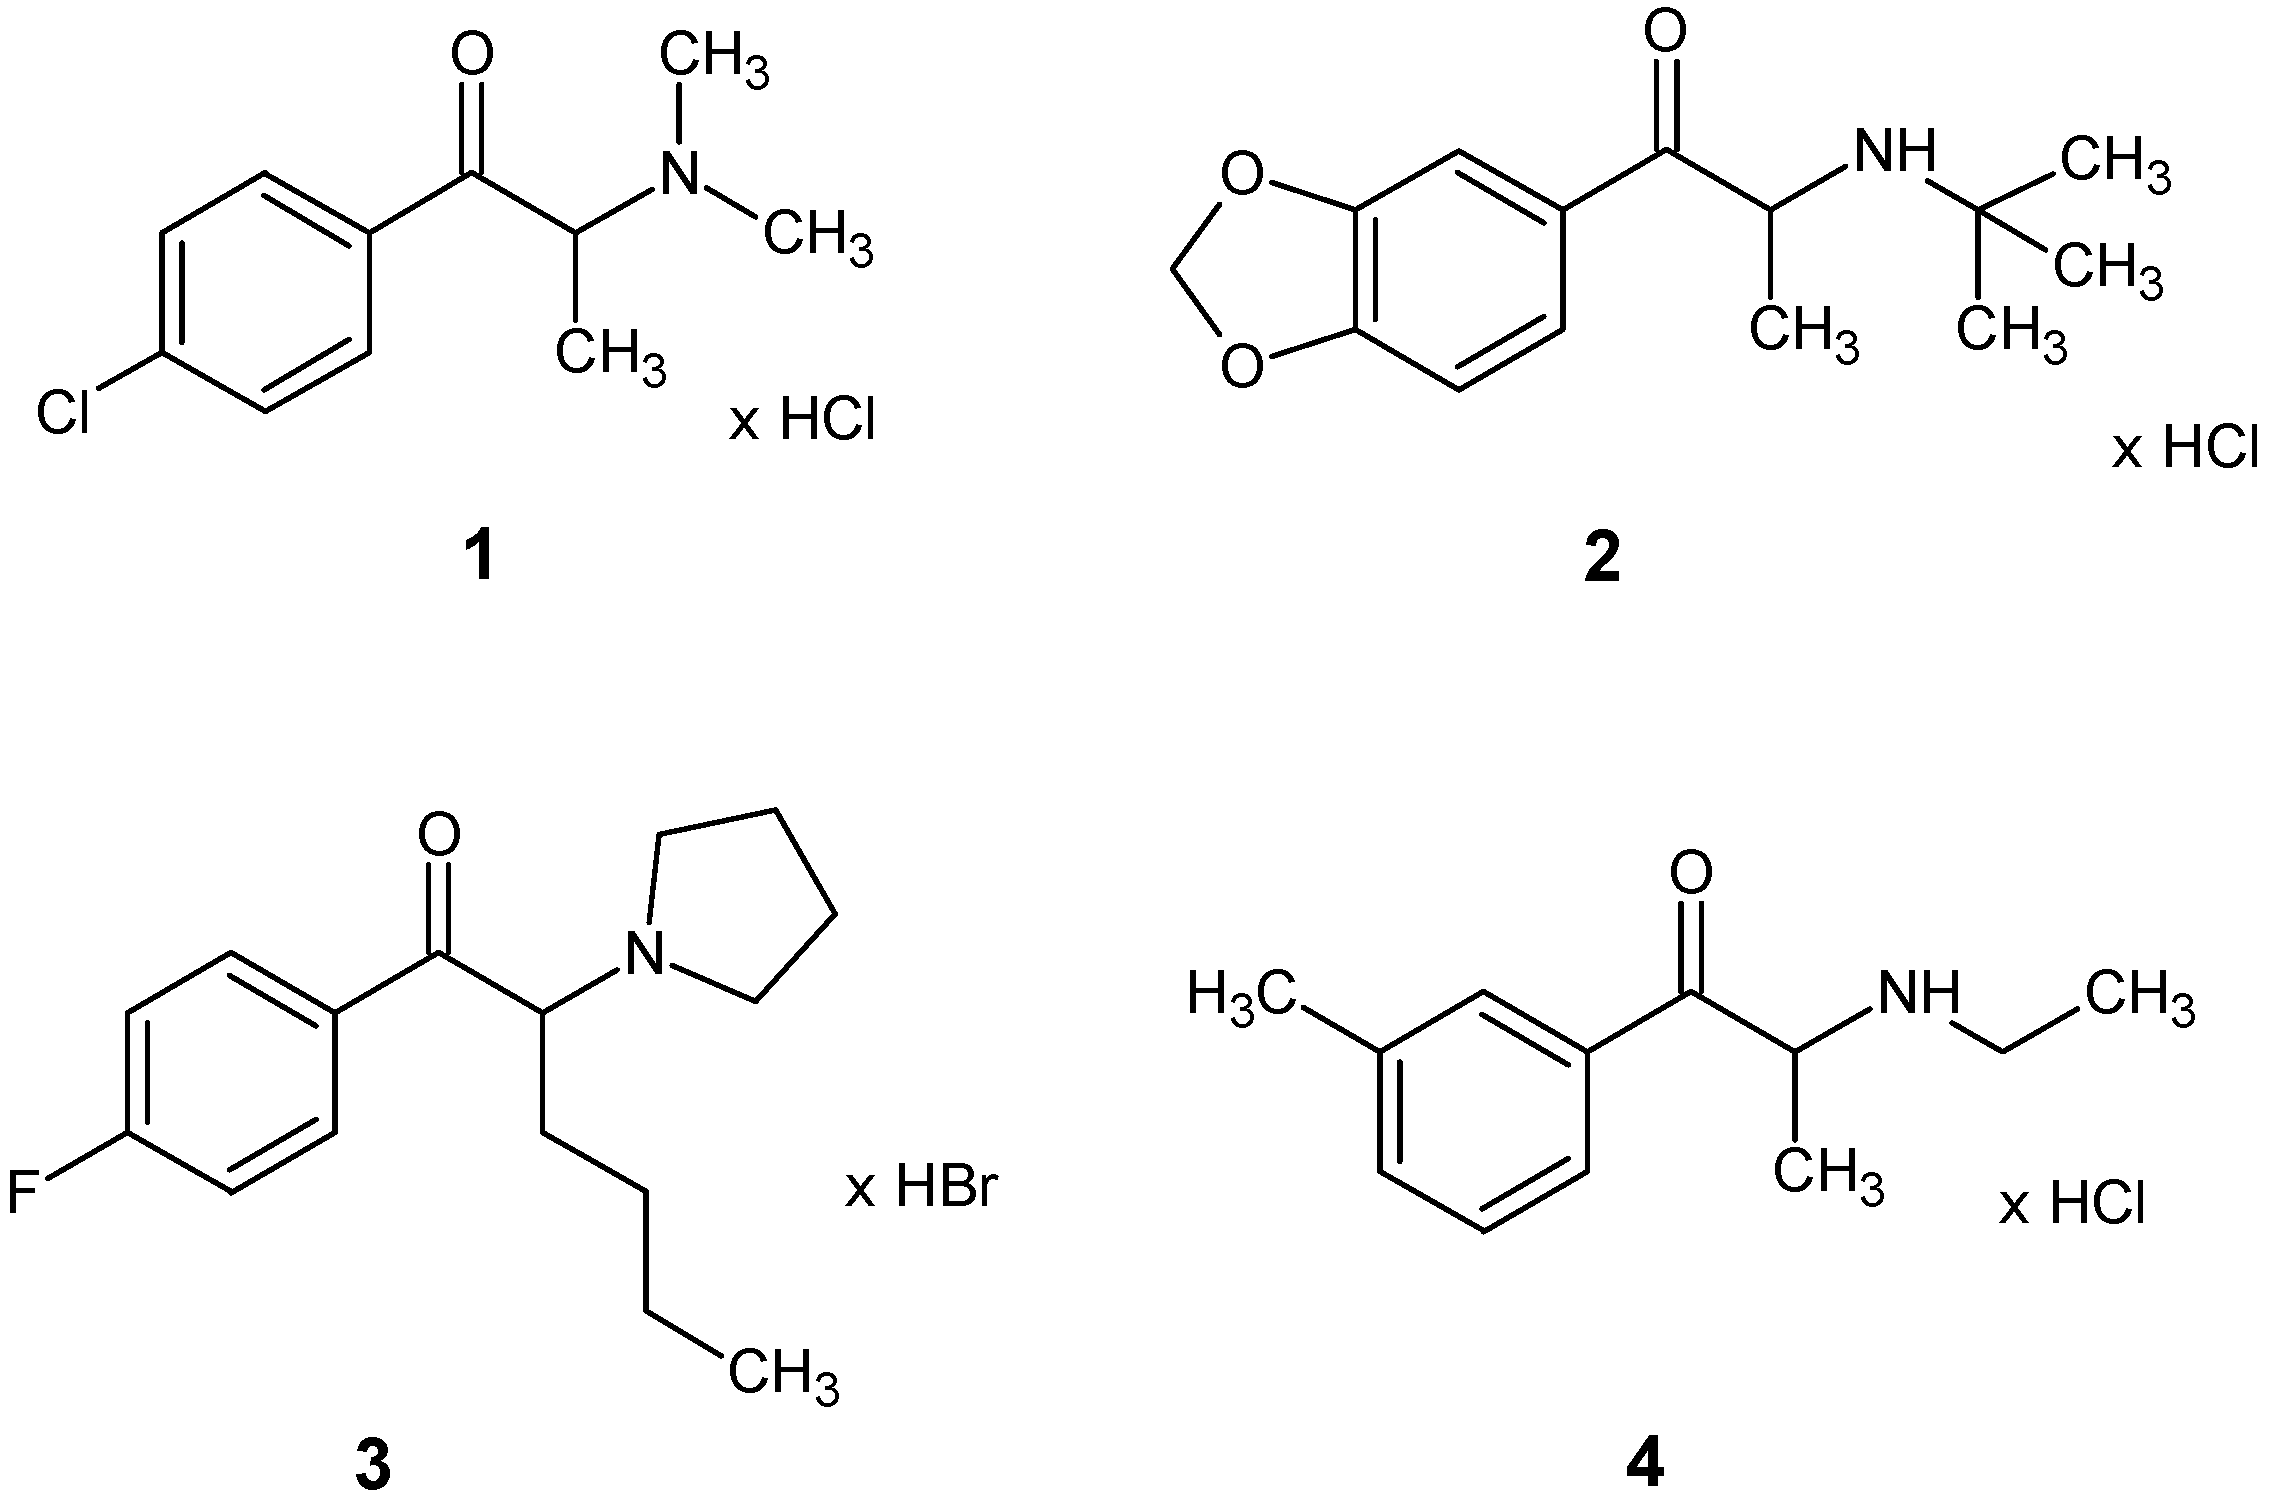
Crystal Structures and Spectroscopic Characterization of Four Synthetic Cathinones: 1-(4-Chlorophenyl)-2-(Dimethylamino)Propan-1-One (N-Methyl-Clephedrone, 4-CDC), 1-(1,3-Benzodioxol-5-yl)-2-(Tert-Butylamino)Propan-1-One (tBuONE, Tertylone, MDPT), 1-(4-Fluorophenyl)-2-(Pyrrolidin-1-yl)Hexan-1-One (4F-PHP) and 2-(Ethylamino)-1-(3-Methylphenyl)Propan-1-One (3-Methyl-Ethylcathinone, 3-MEC)


Abstract
:1. Introduction
2. Materials and Methods
2.1. Chemicals
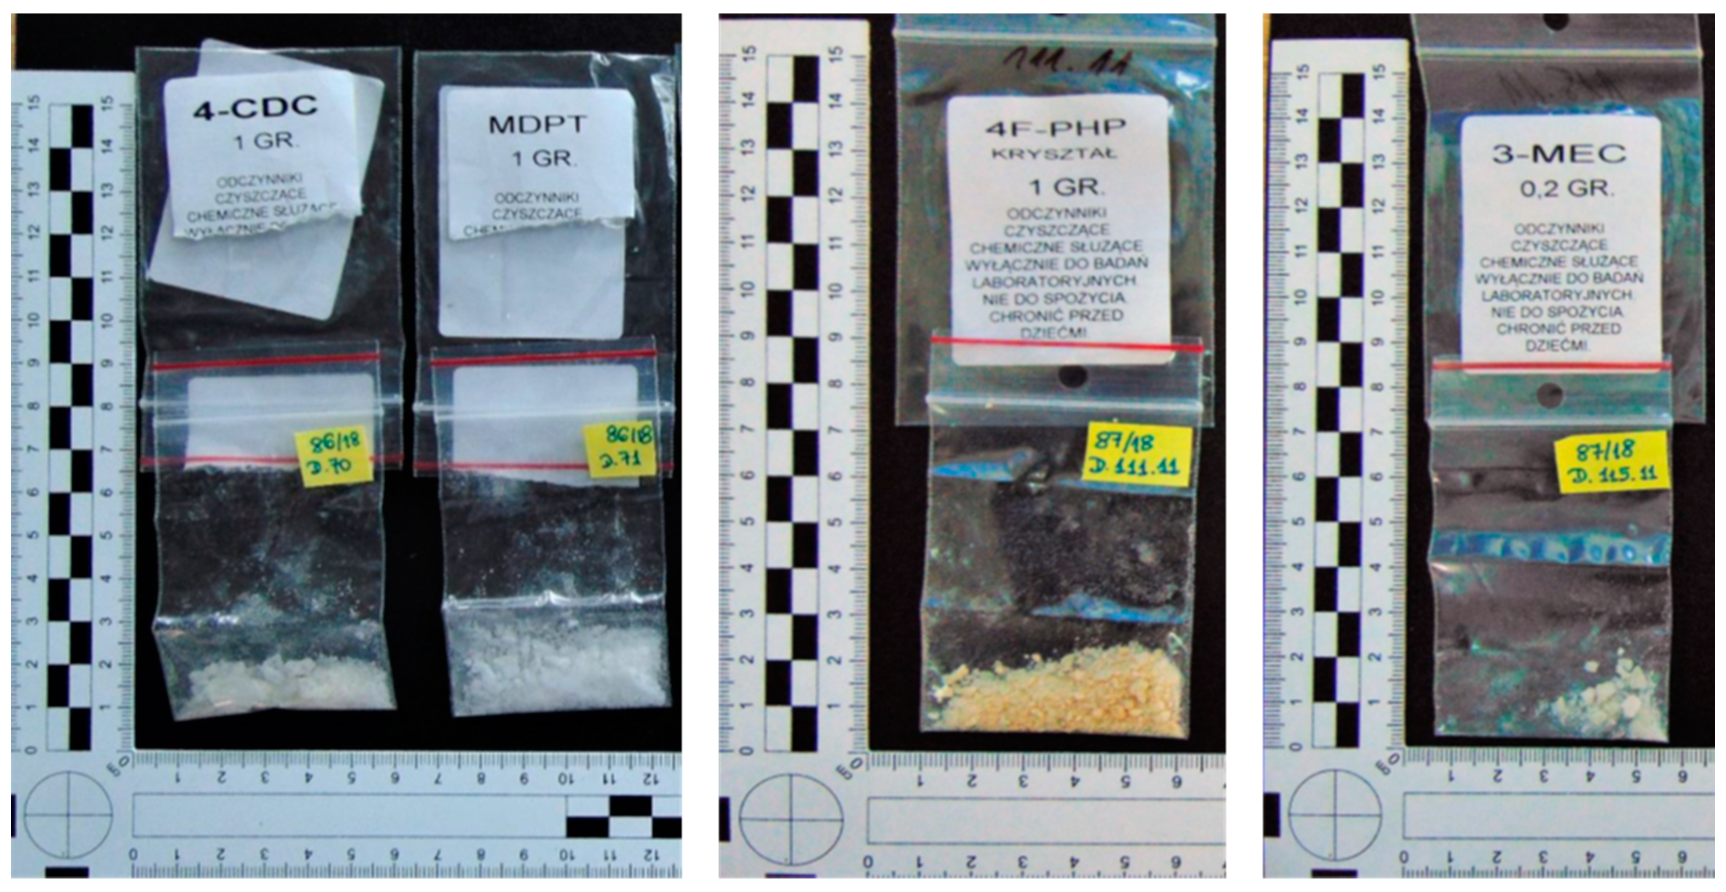
2.2. Samples
2.3. X-ray Crystallography
2.4. NMR Spectra
2.5. LC-MS/MS Analysis
2.6. GC-MS Analysis
3. Results and Discussion
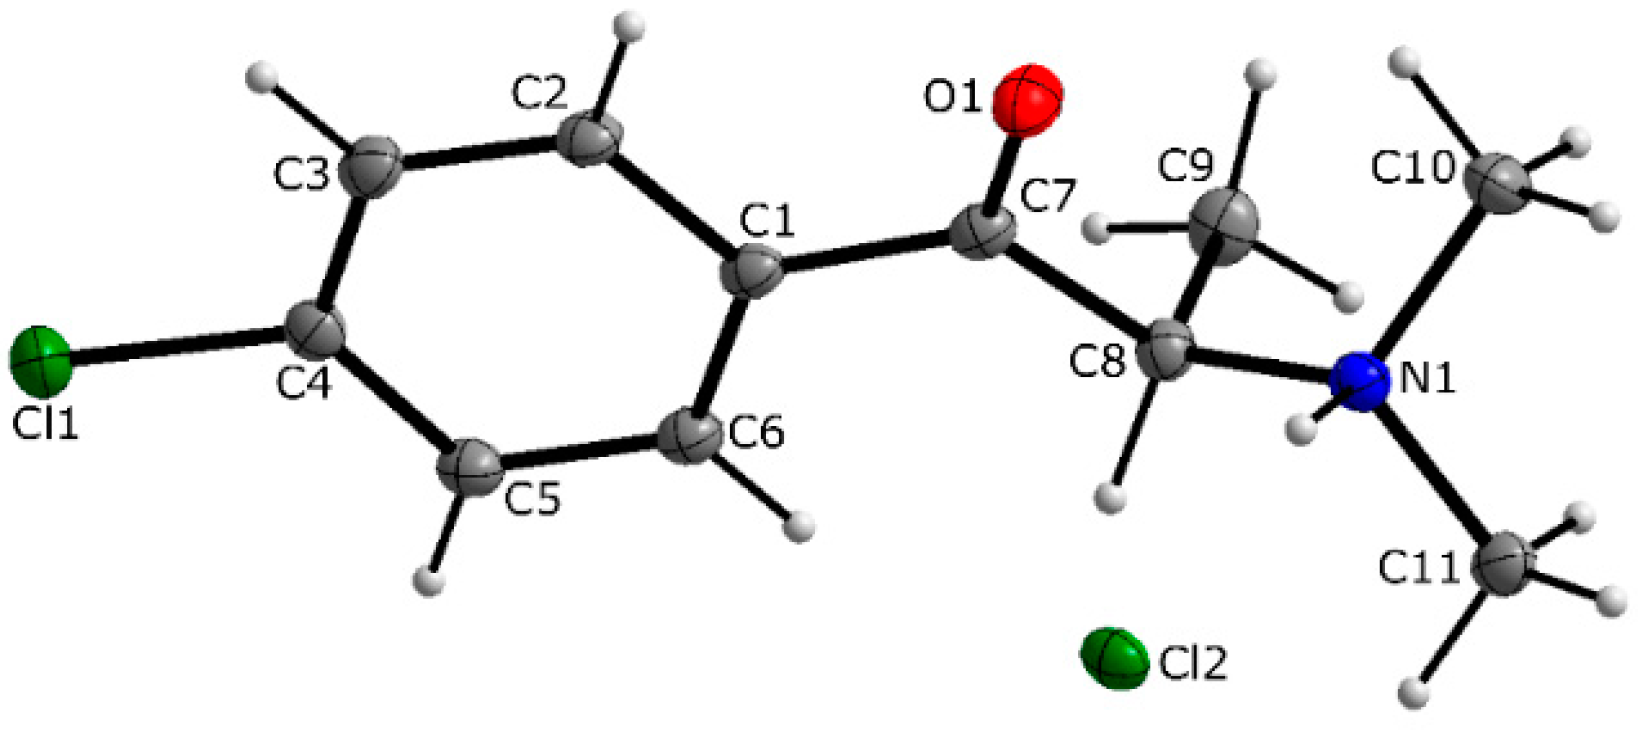
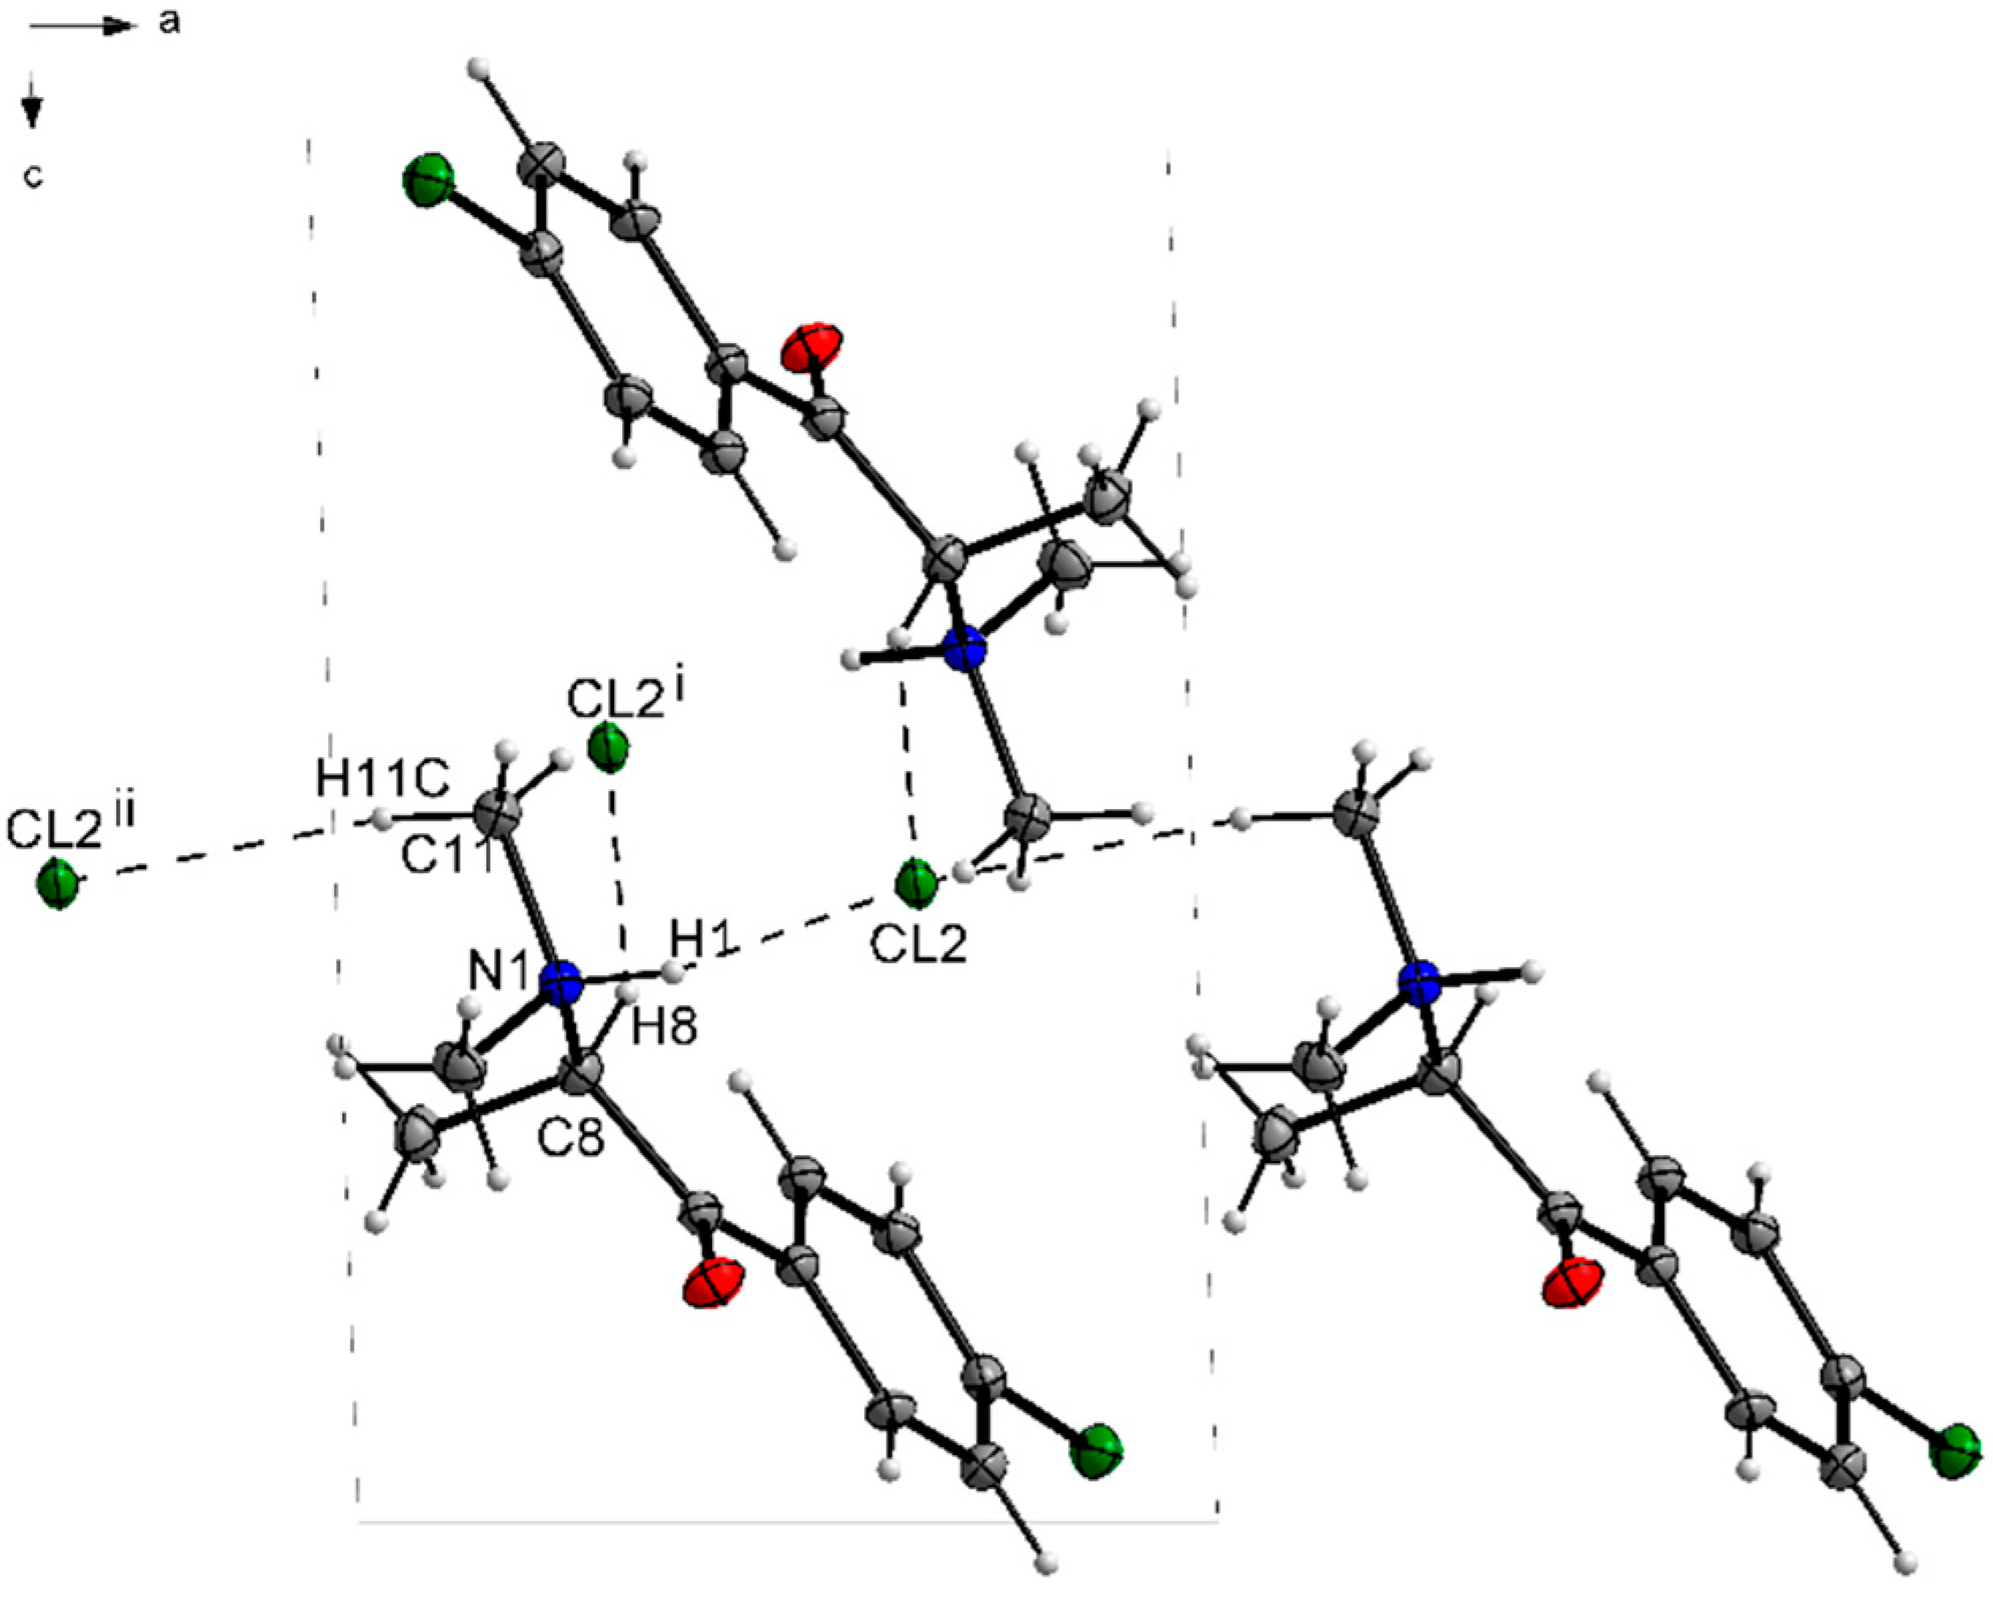
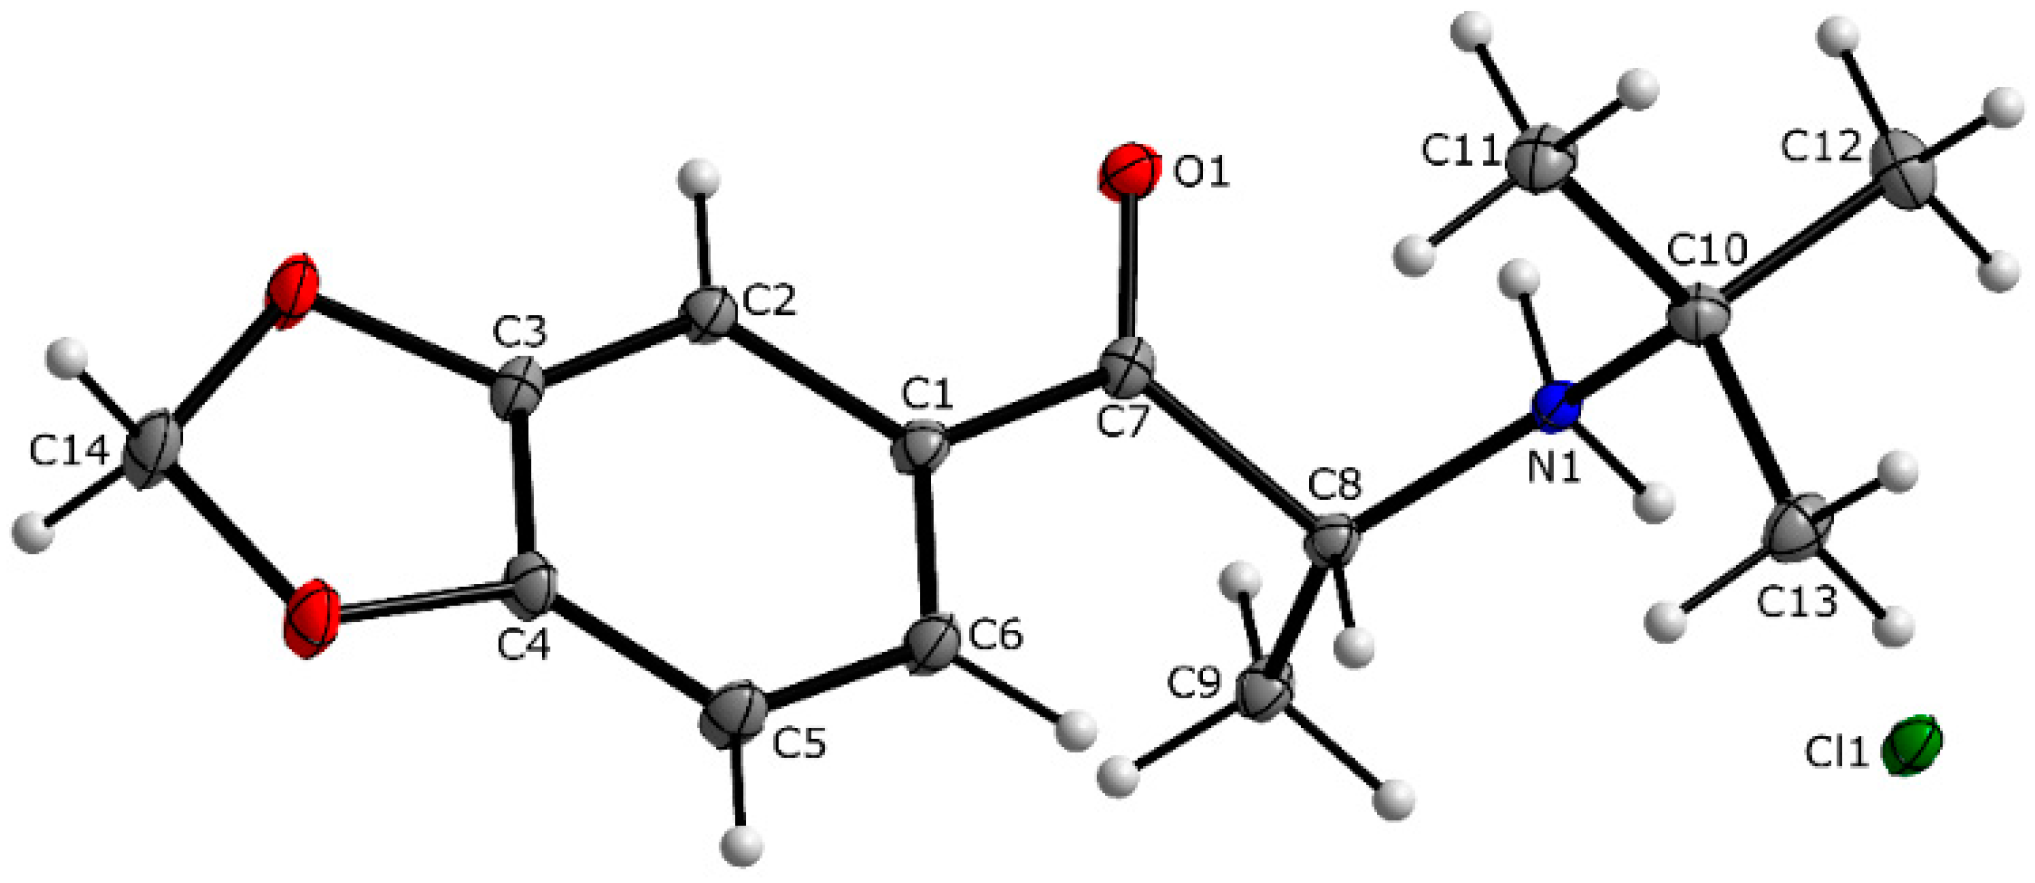
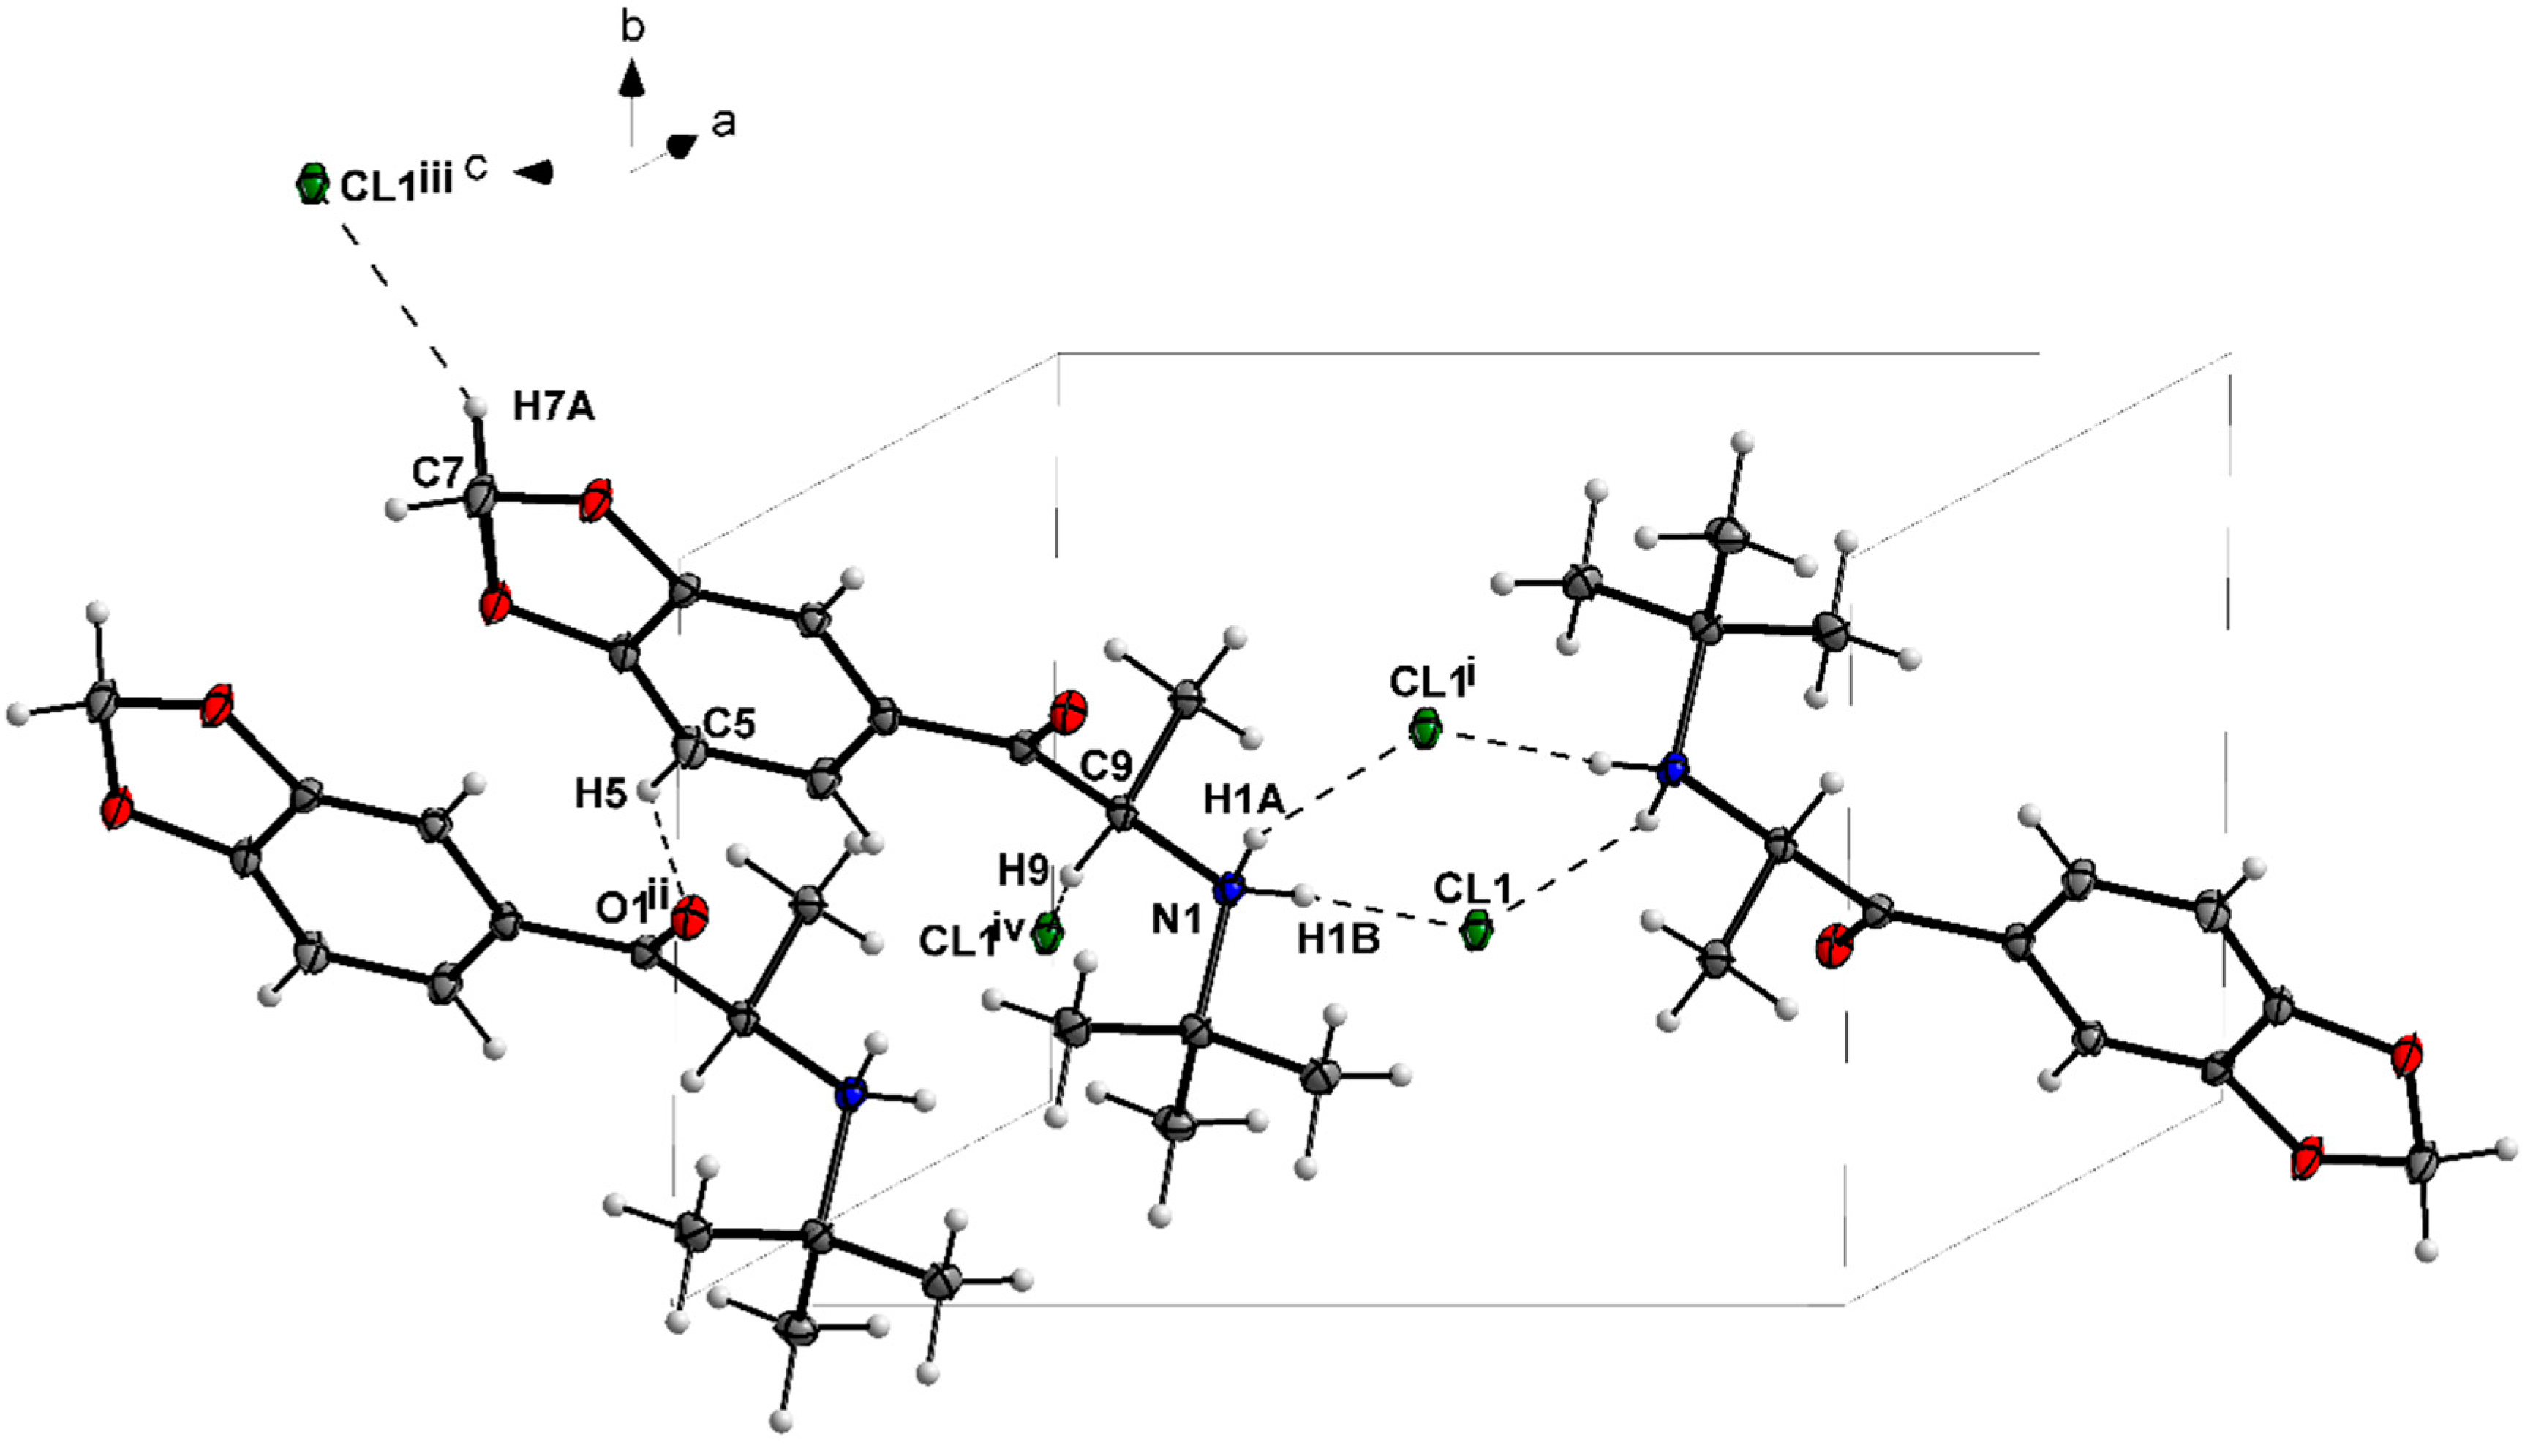
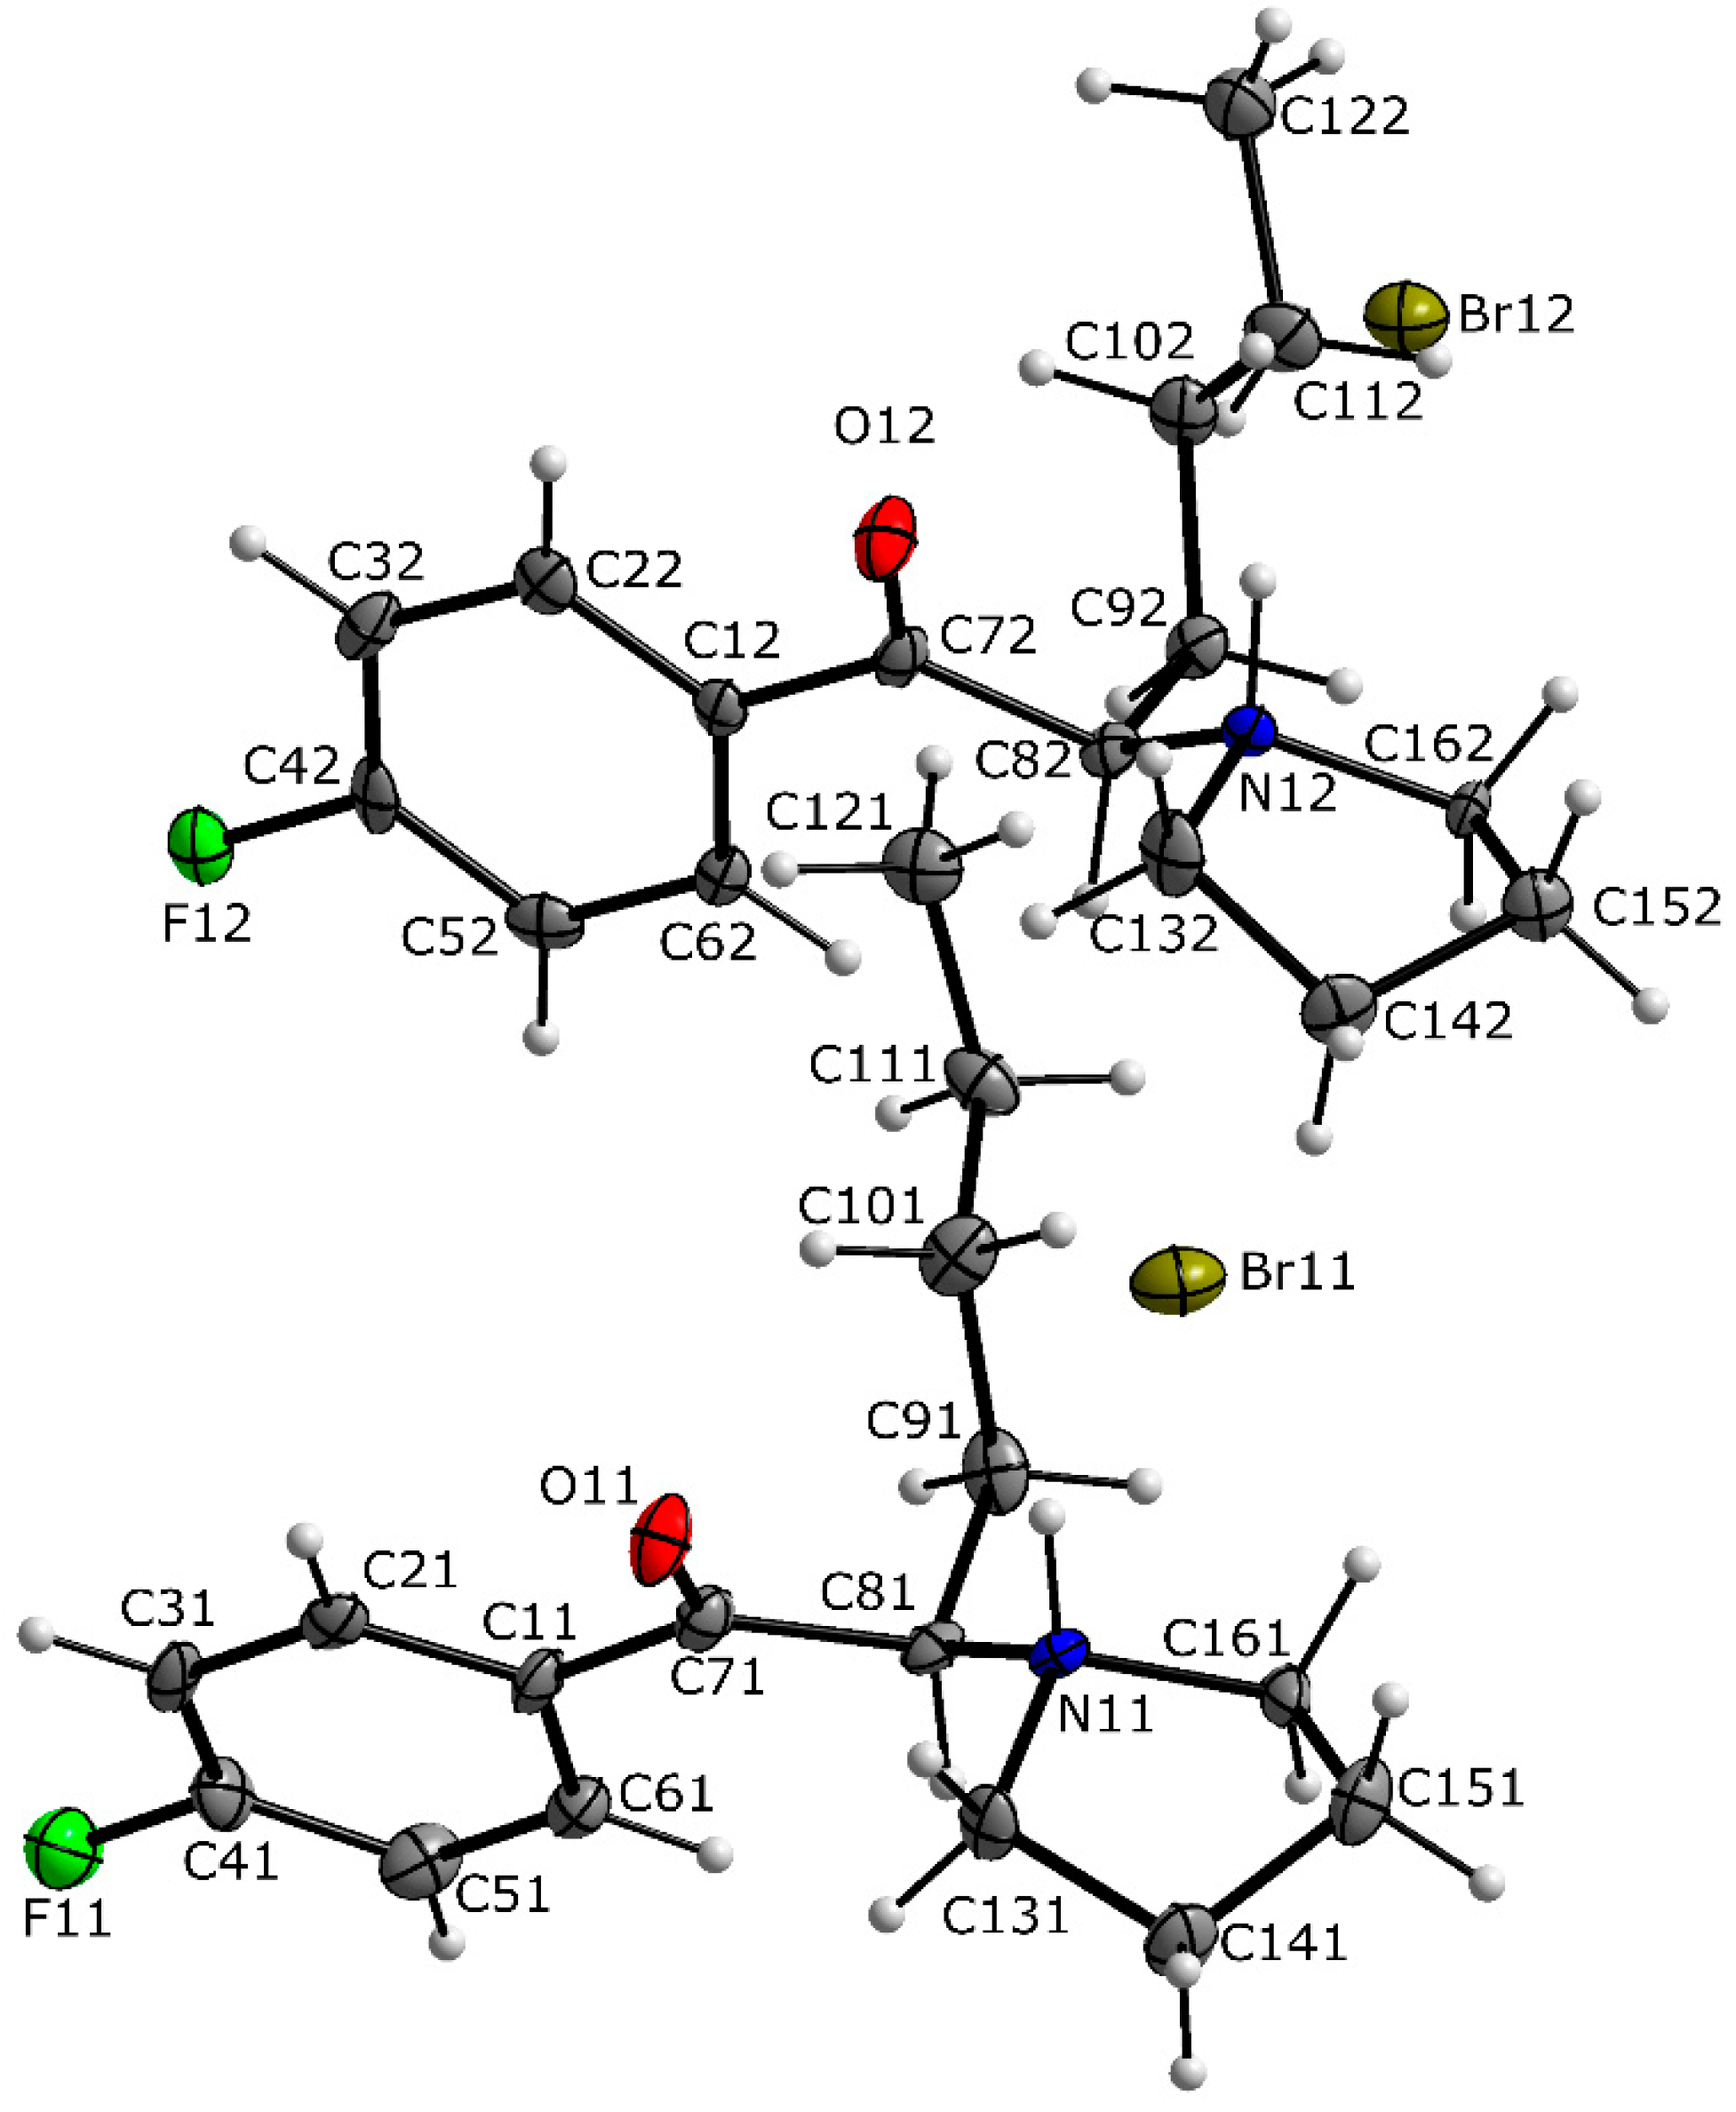
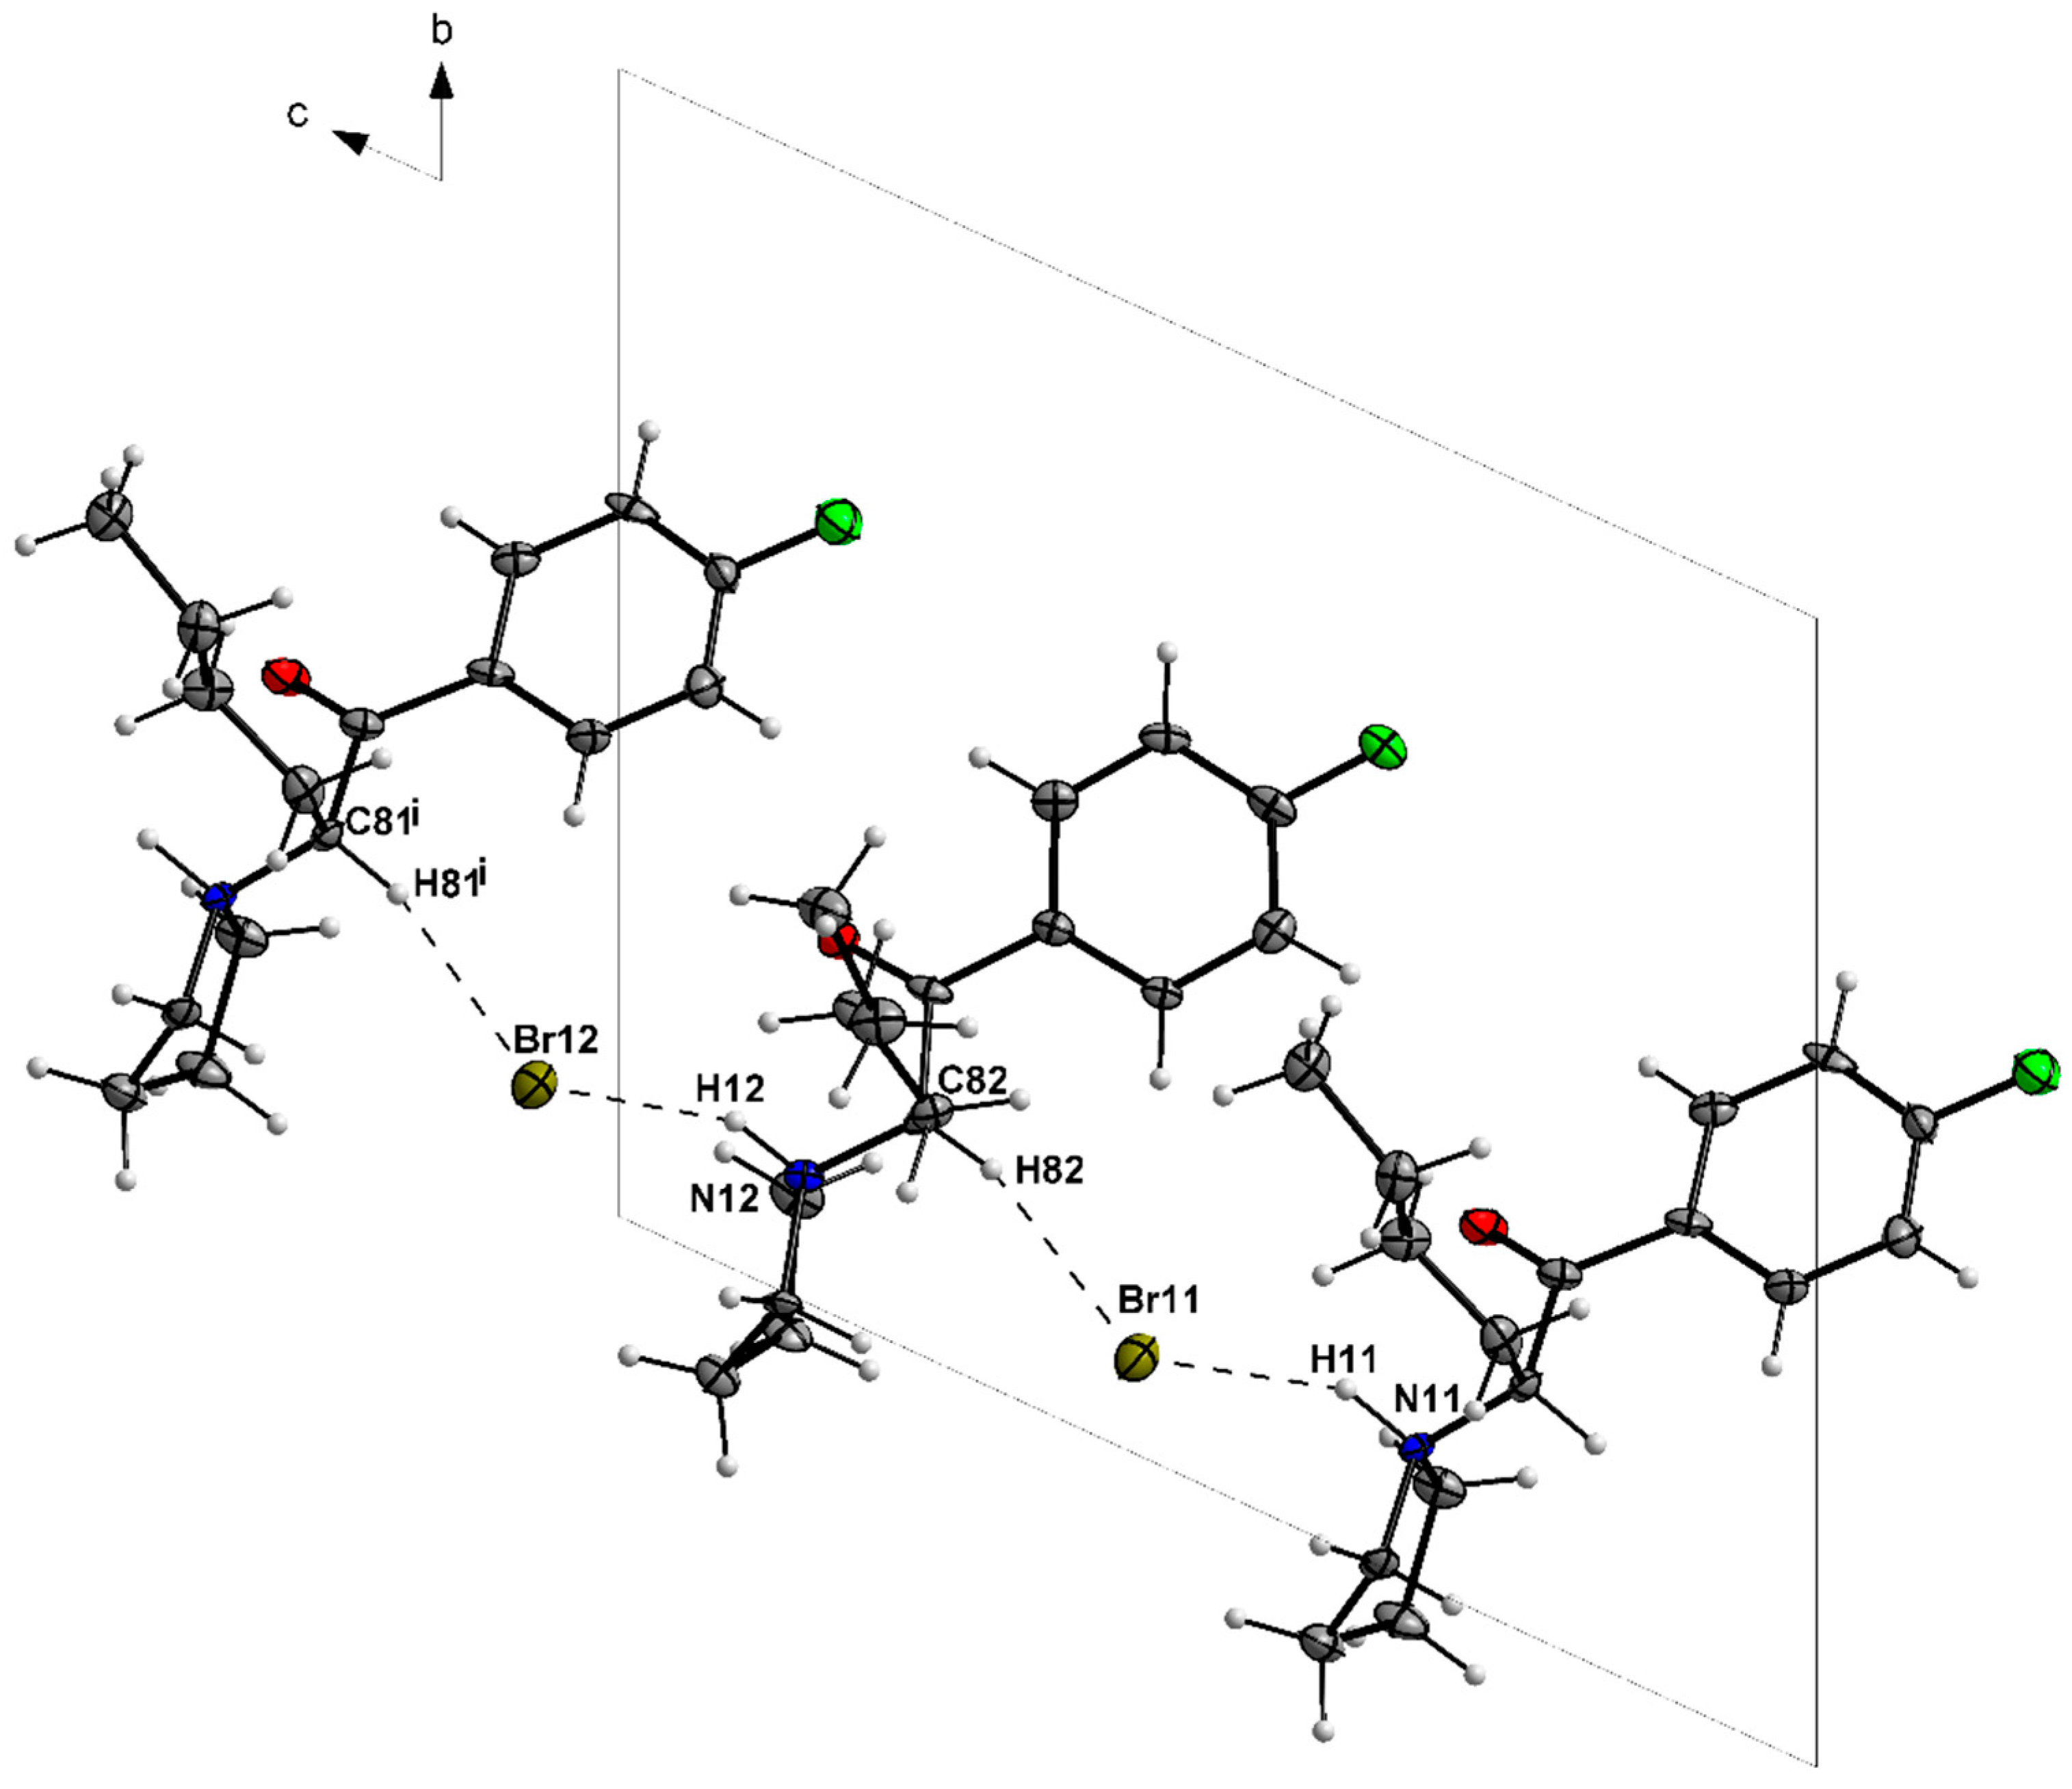
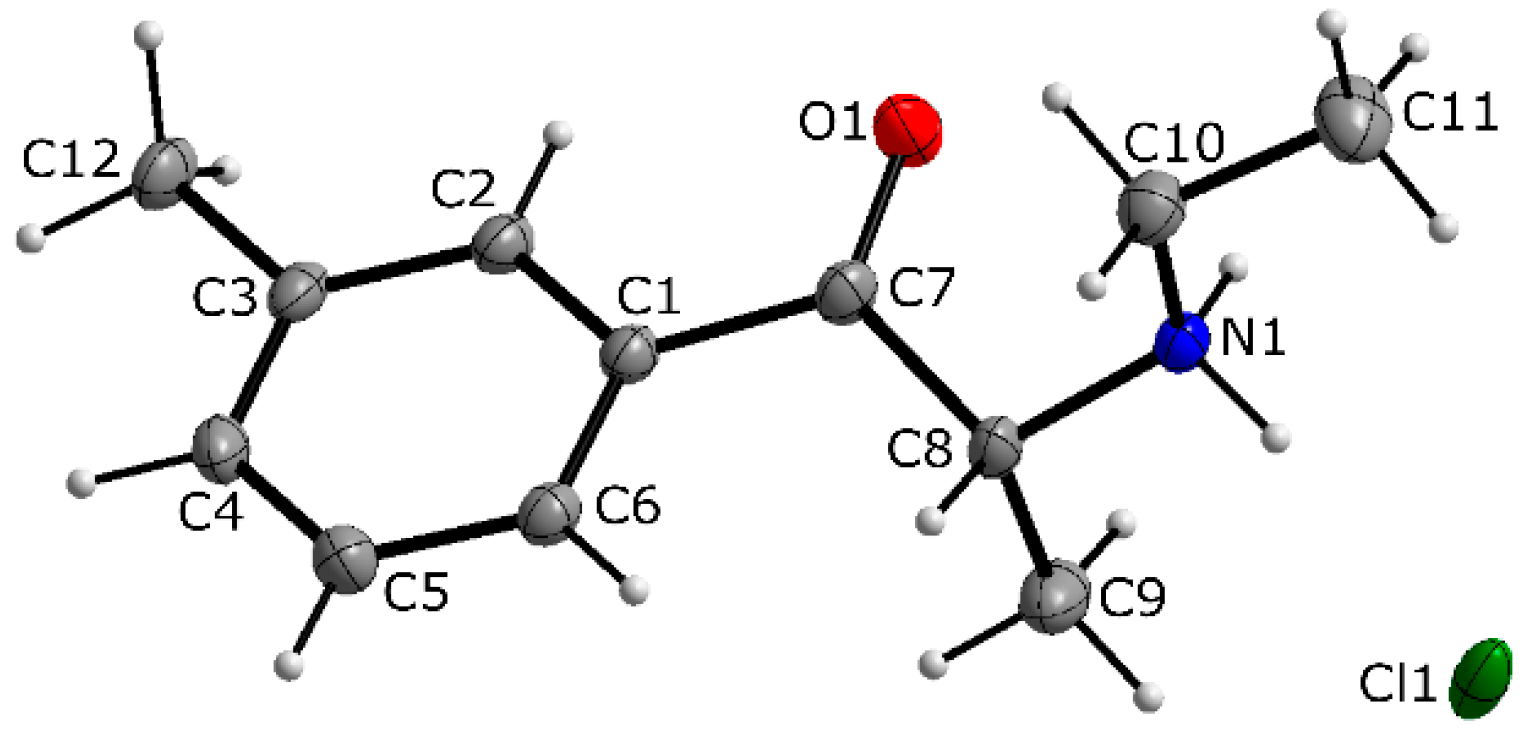
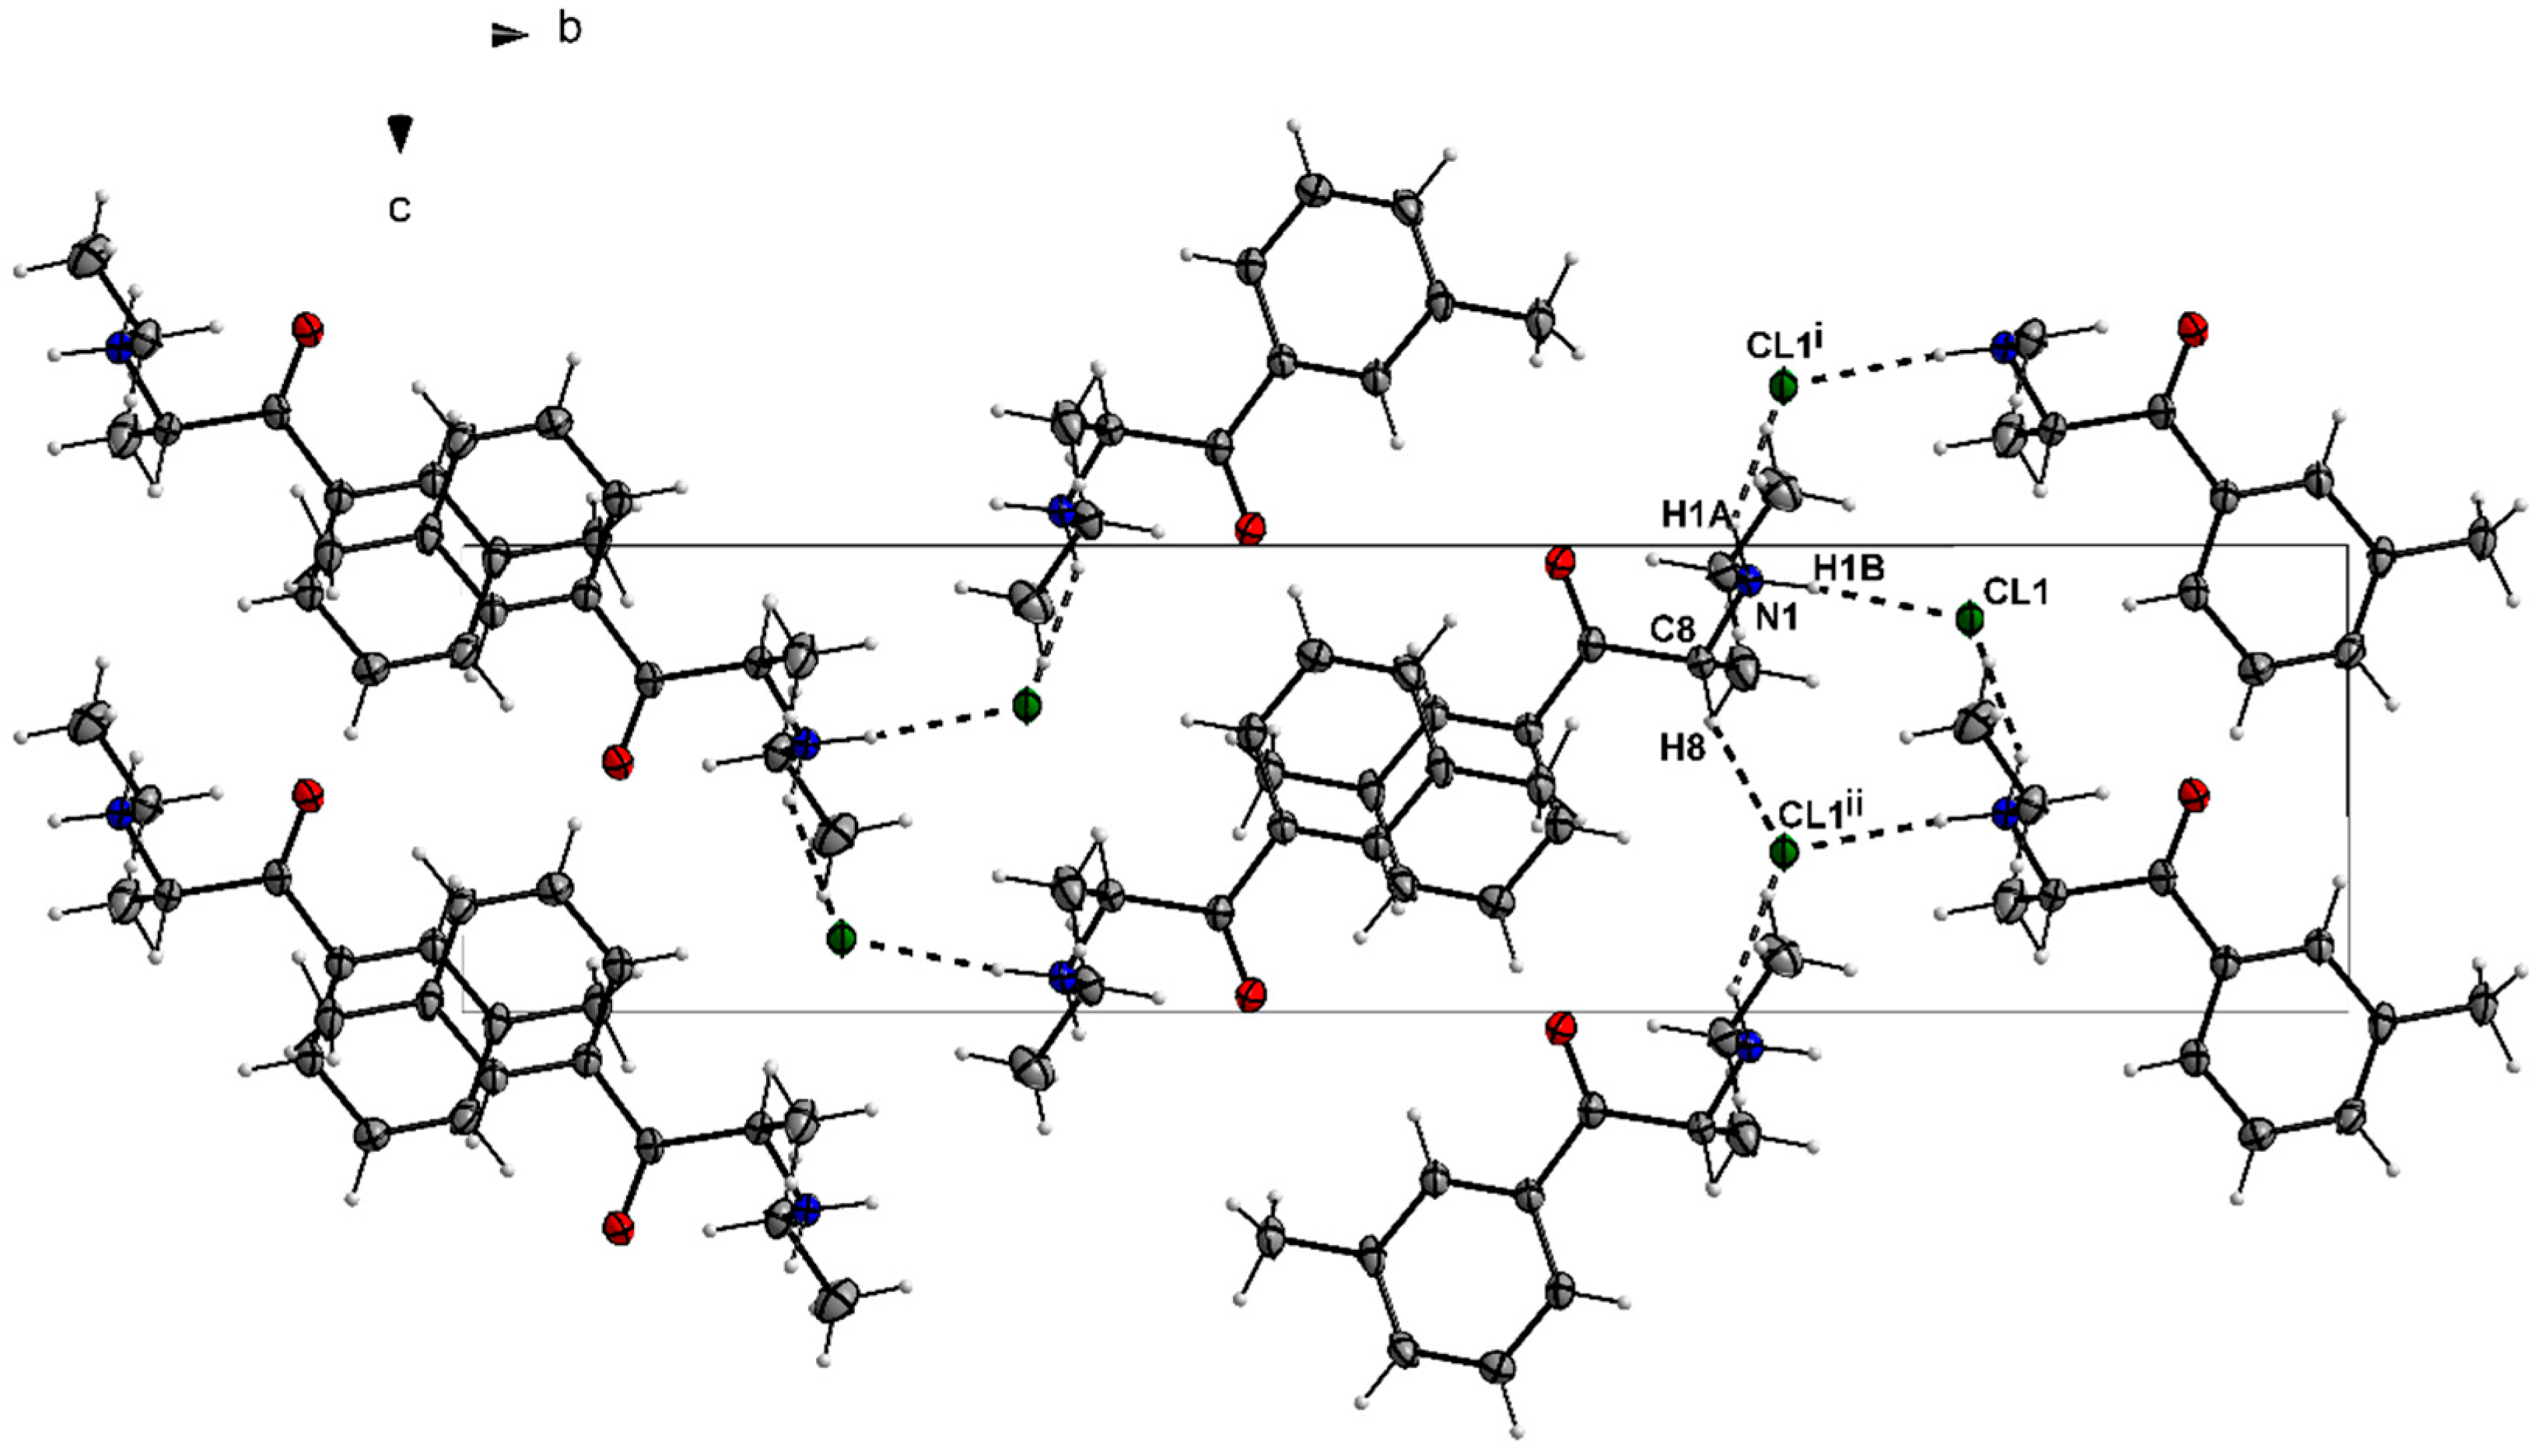
3.1. X-ray Crystallography
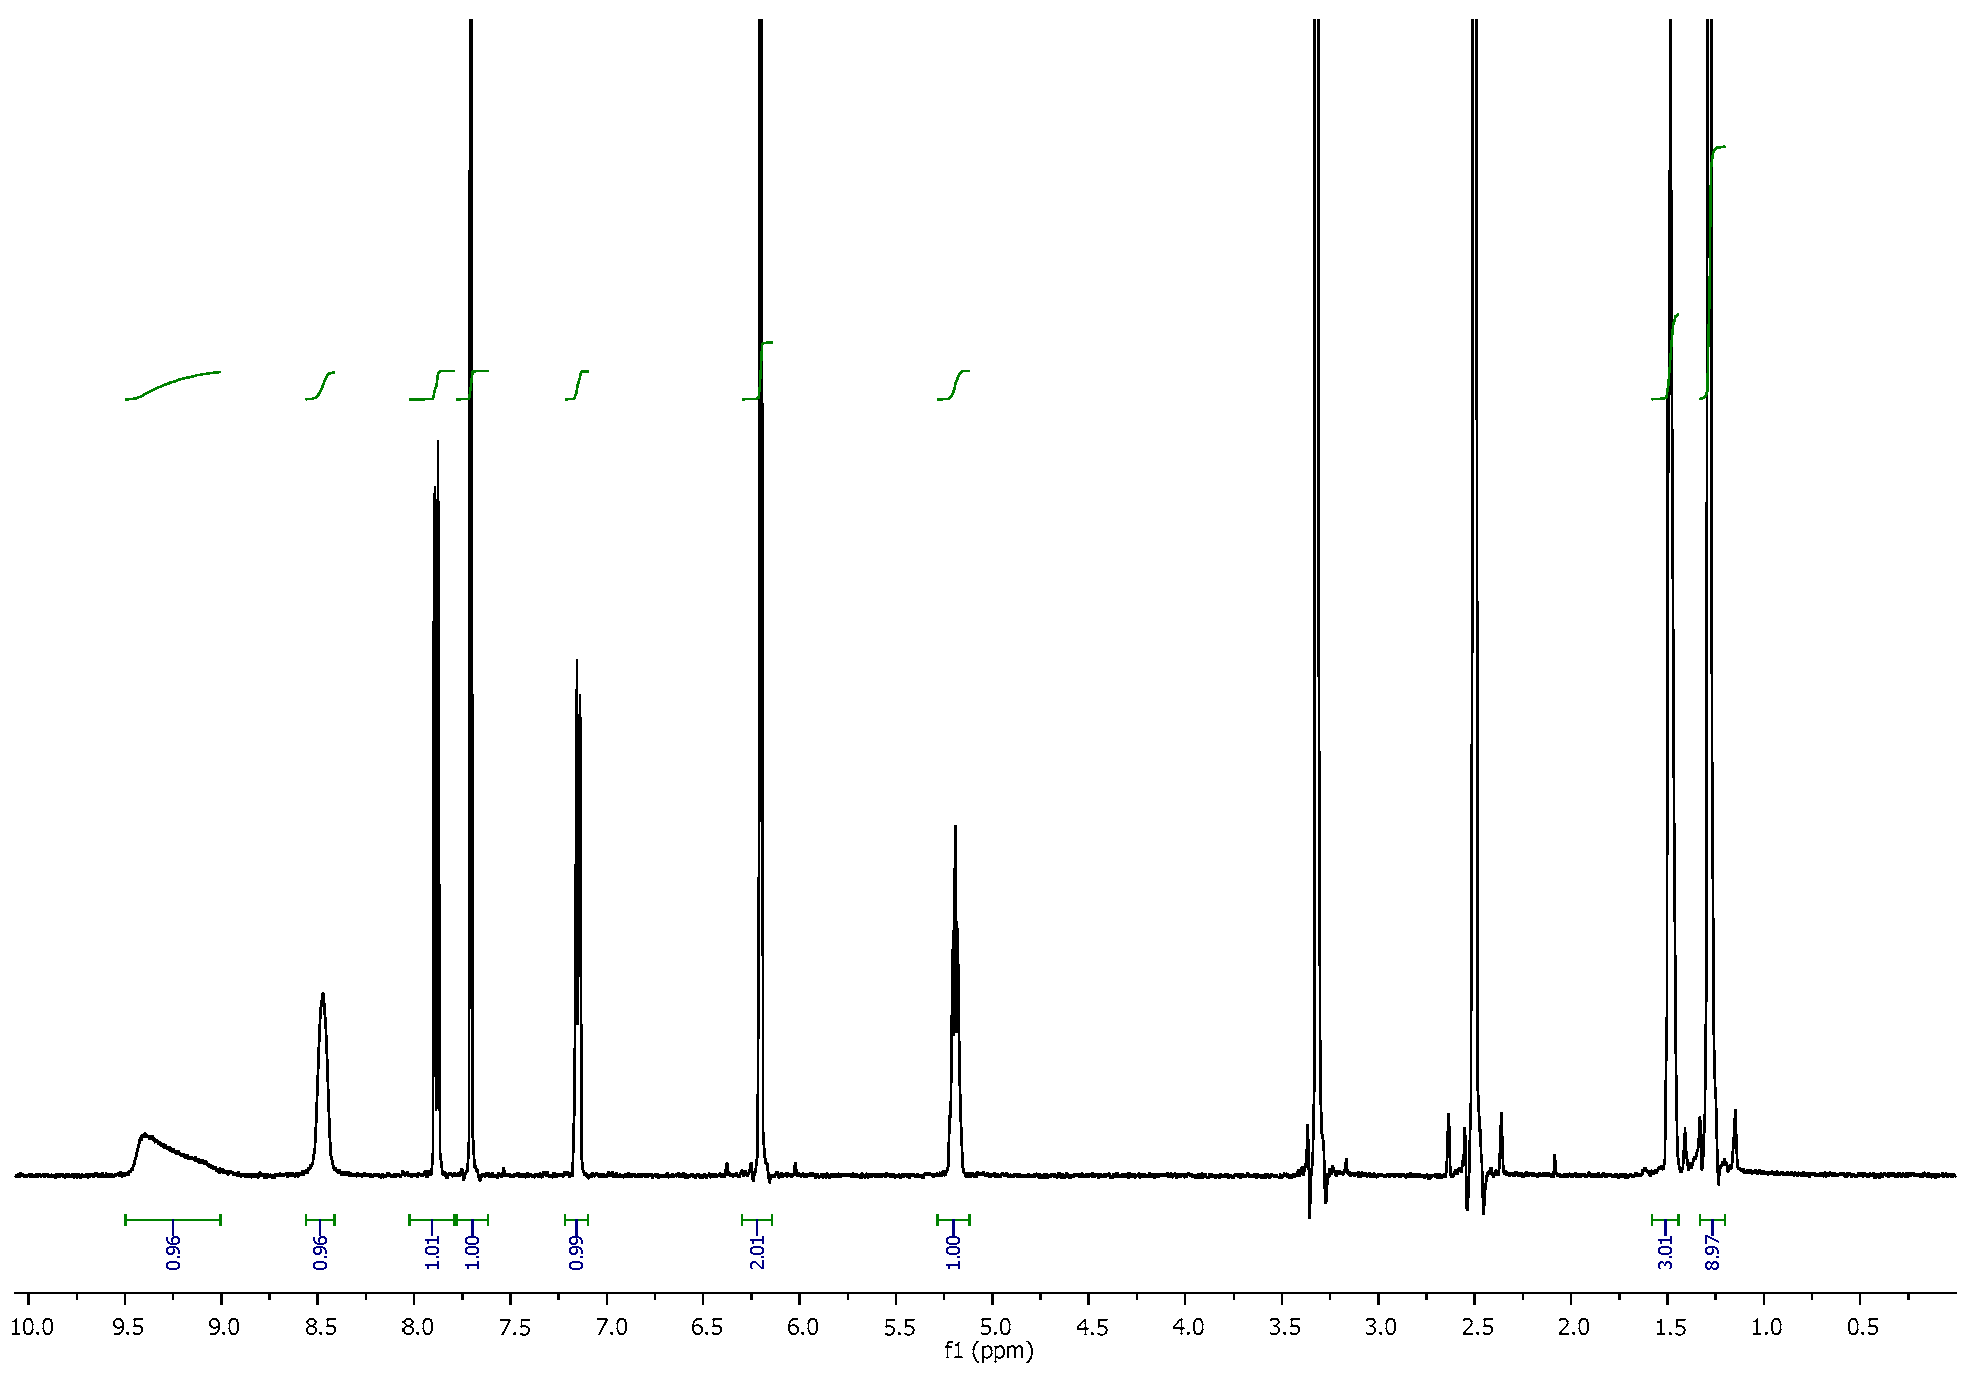
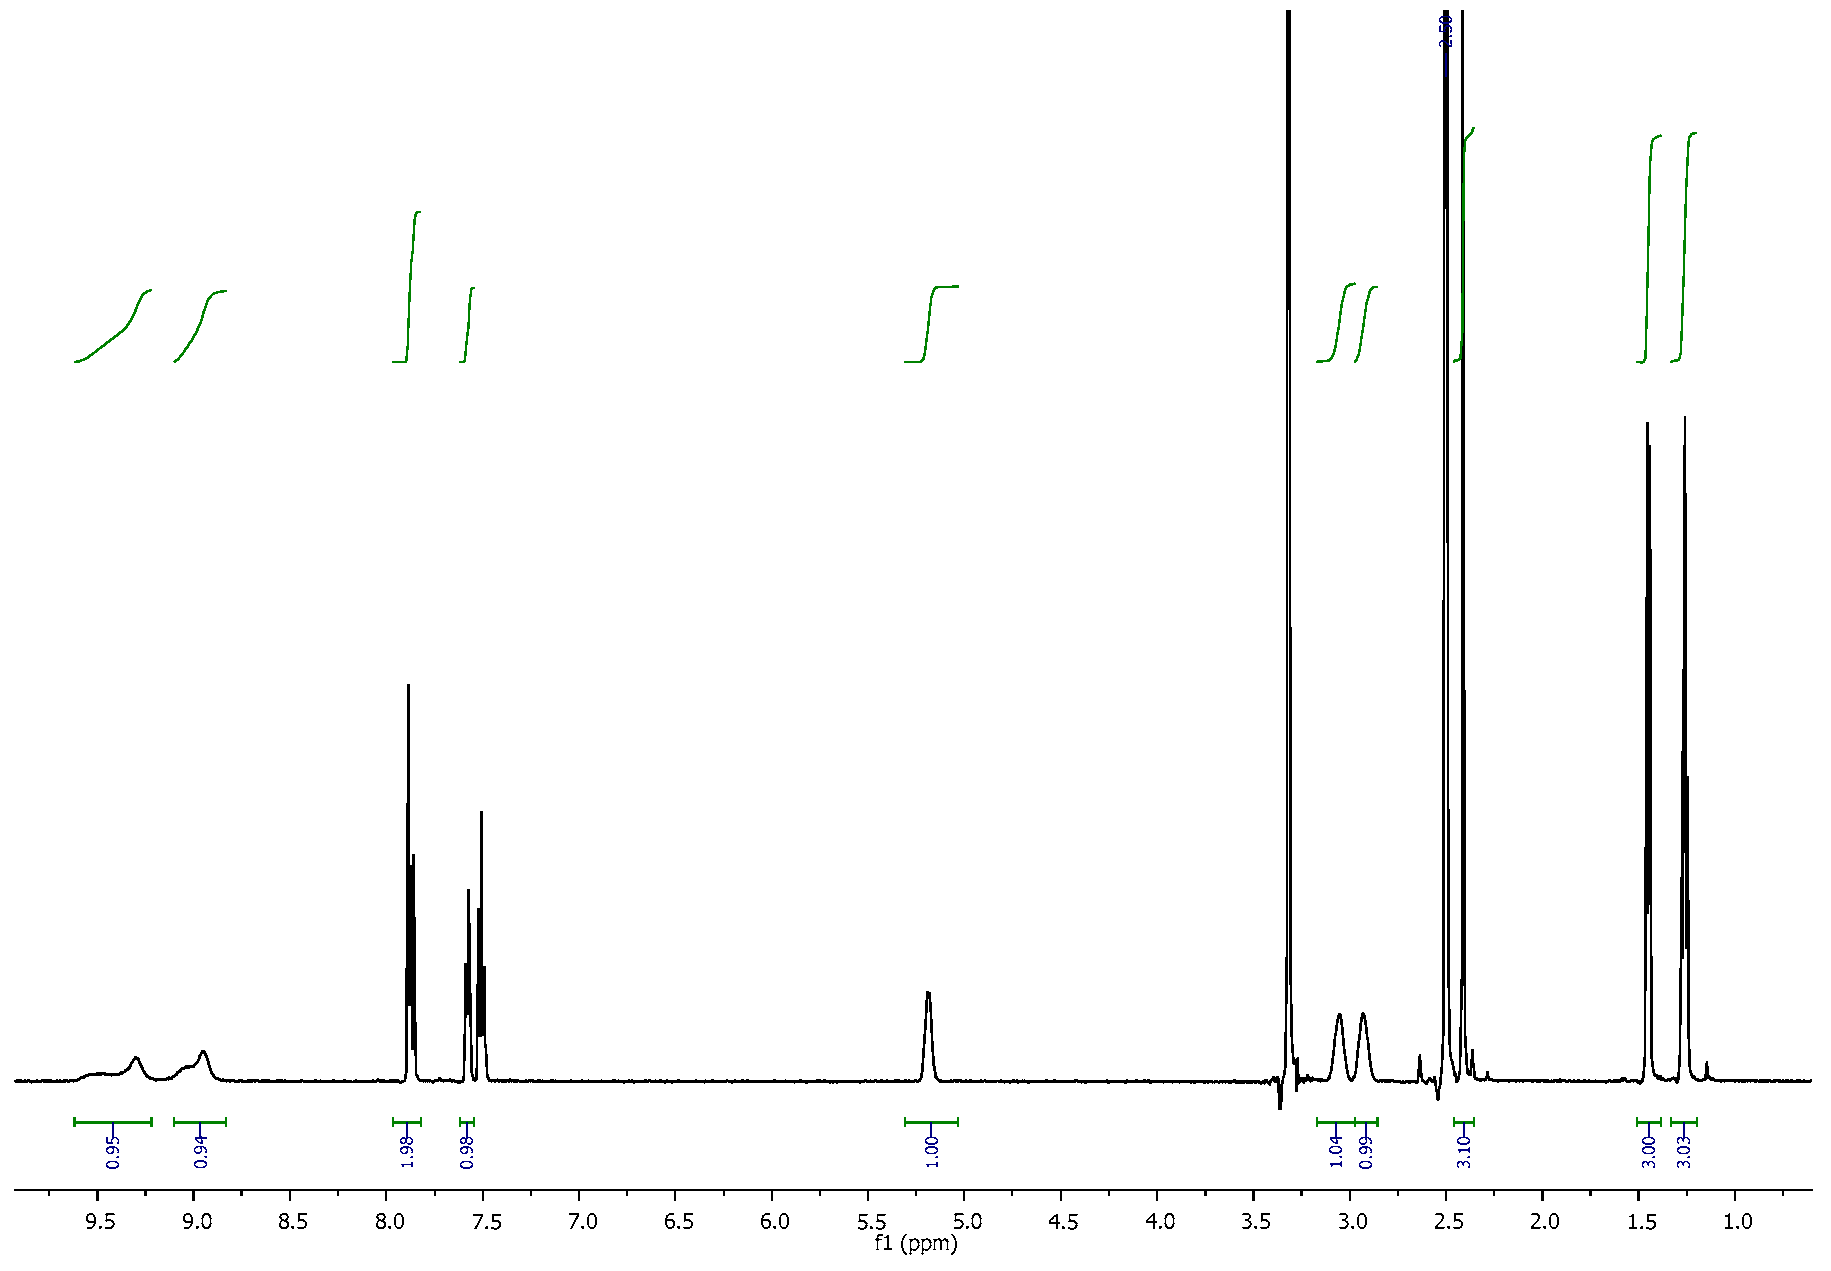
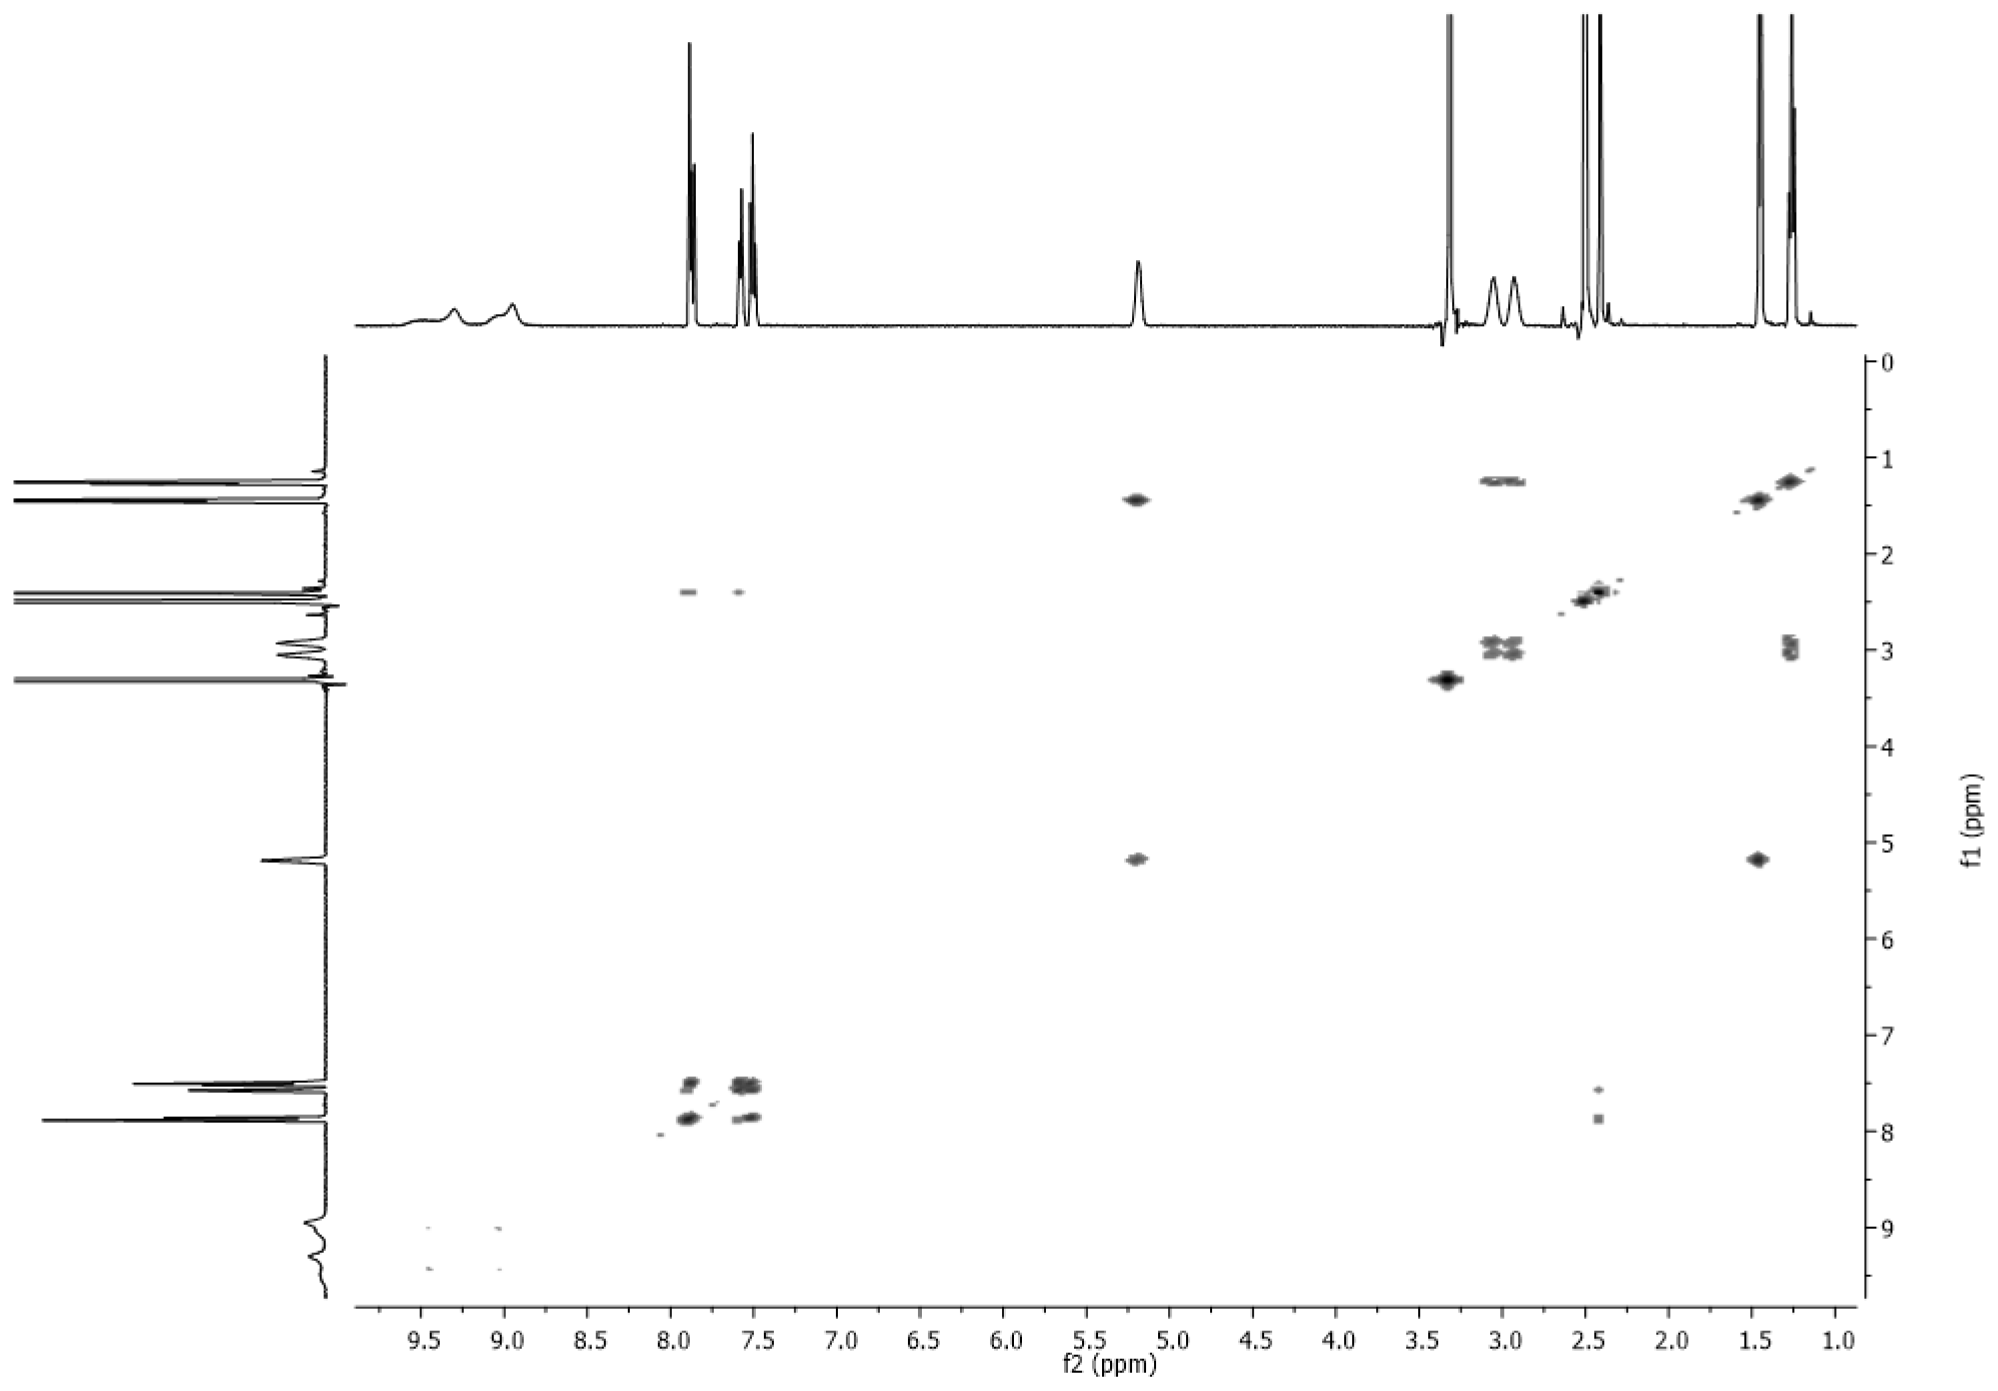
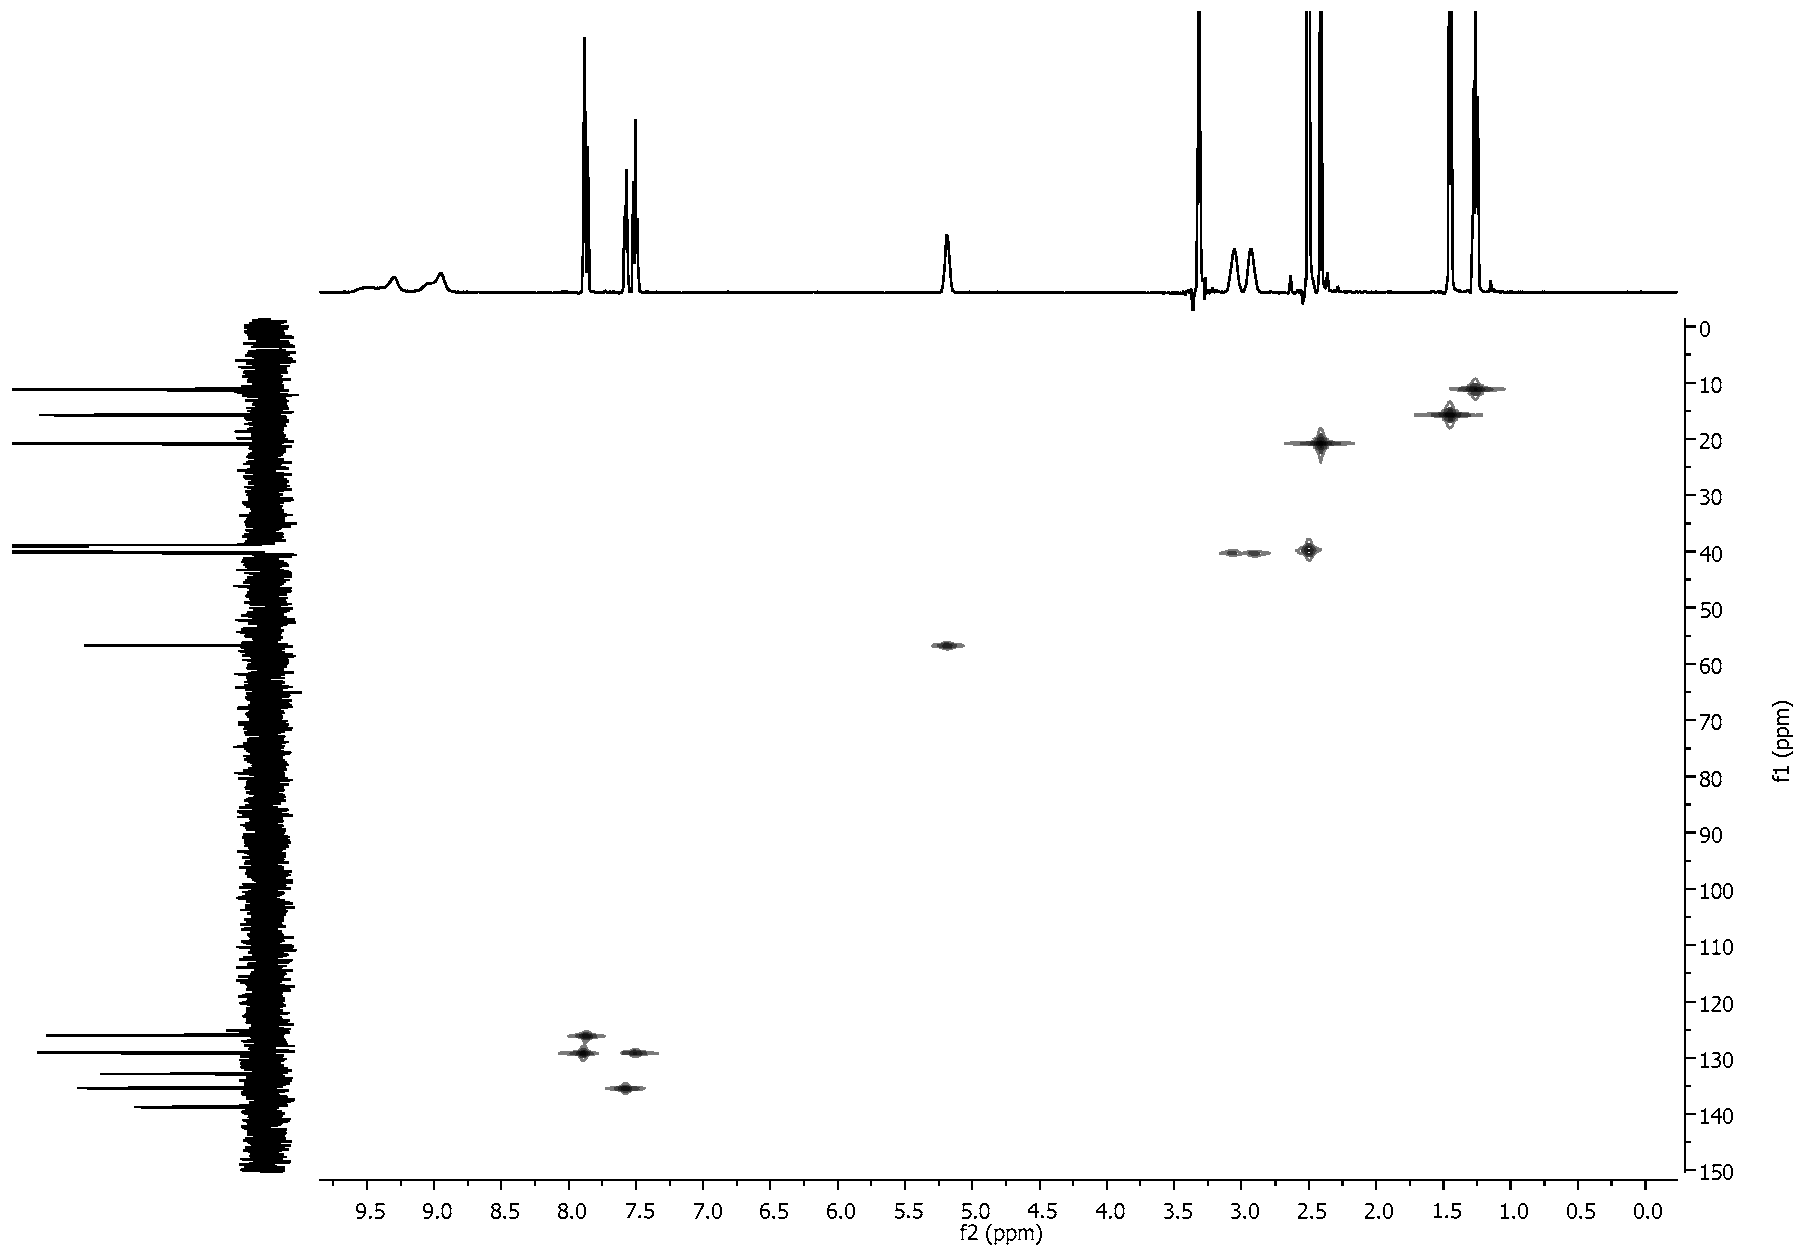
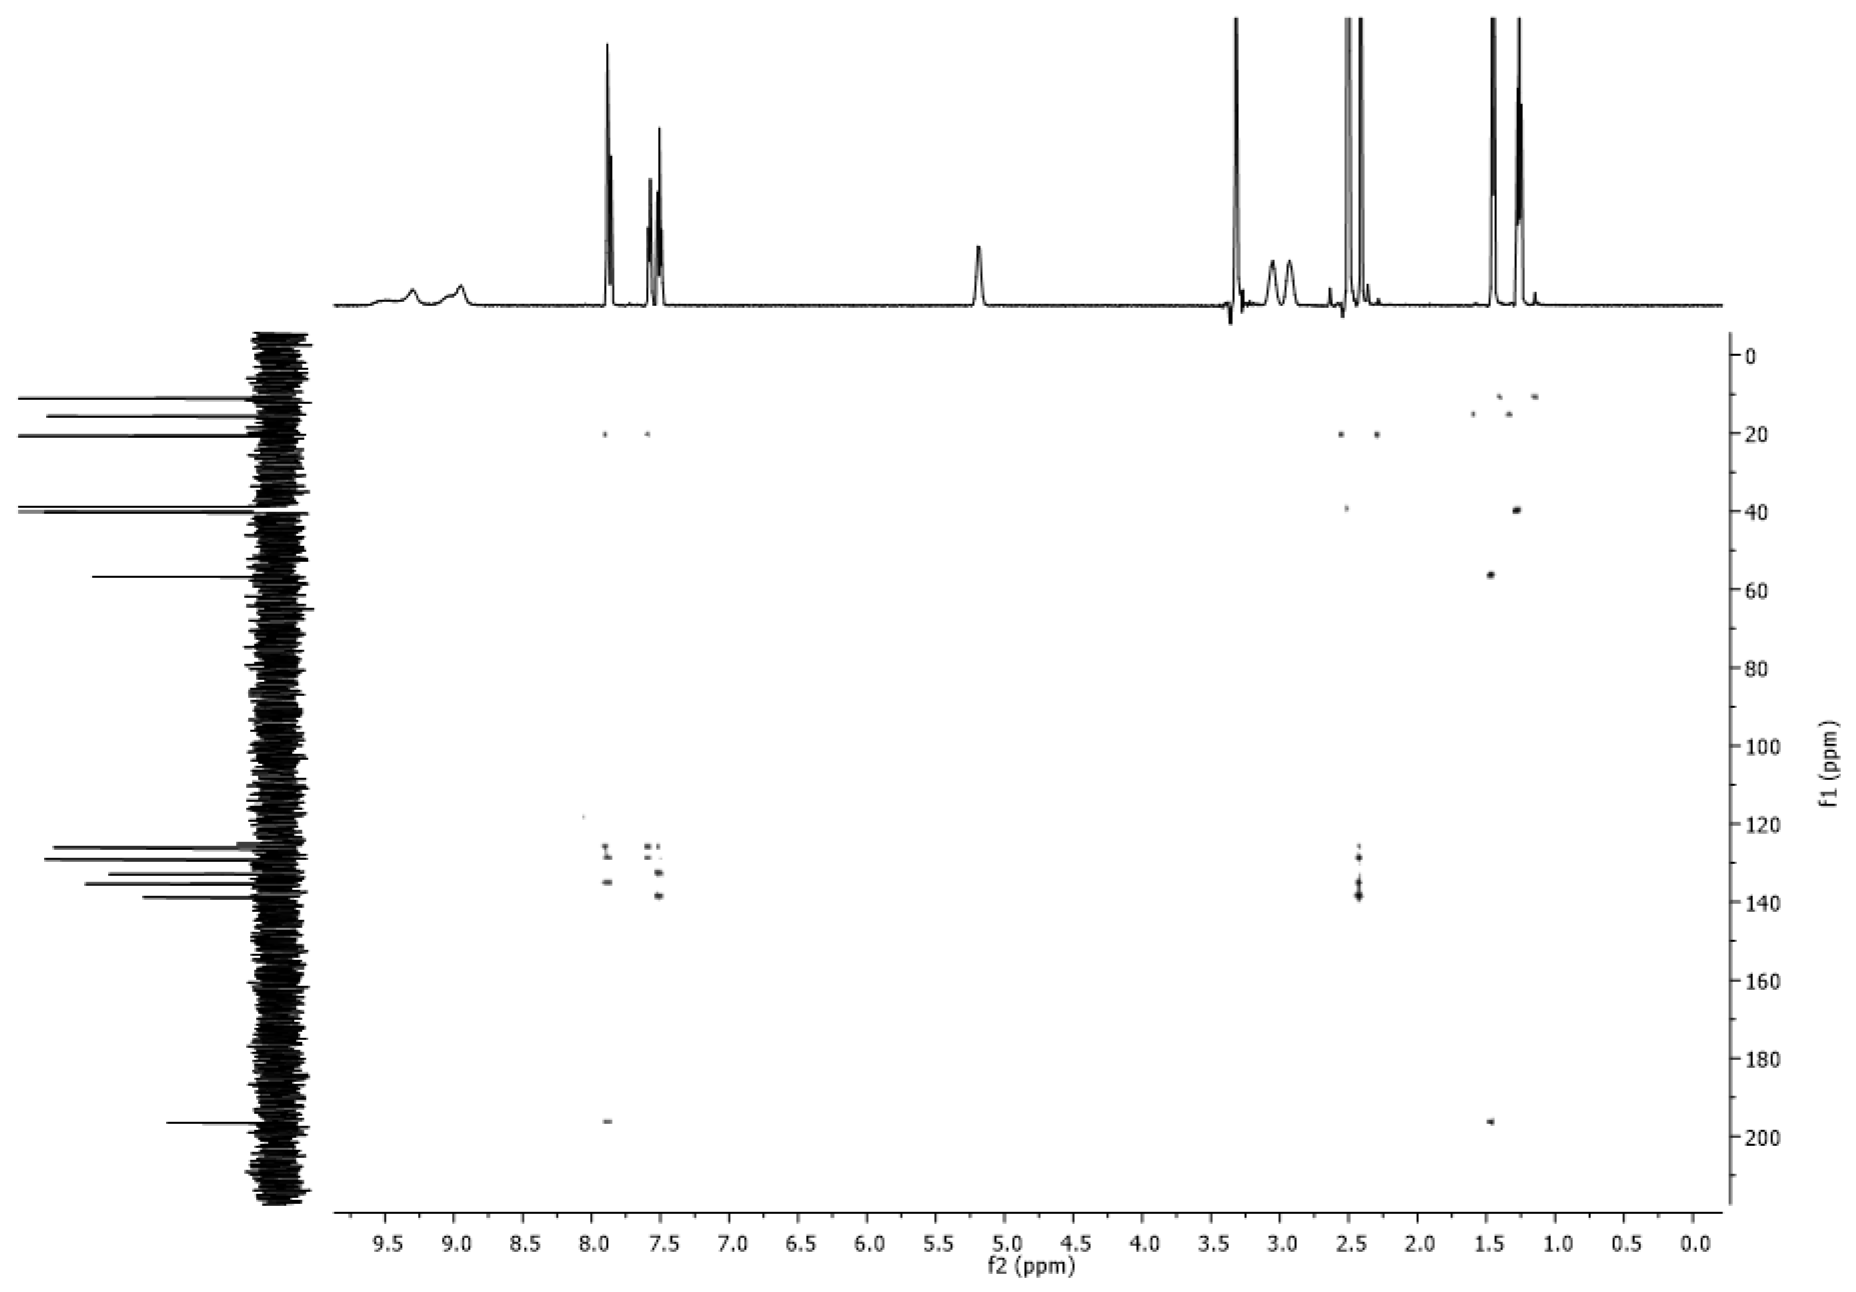
3.2. NMR Spectra
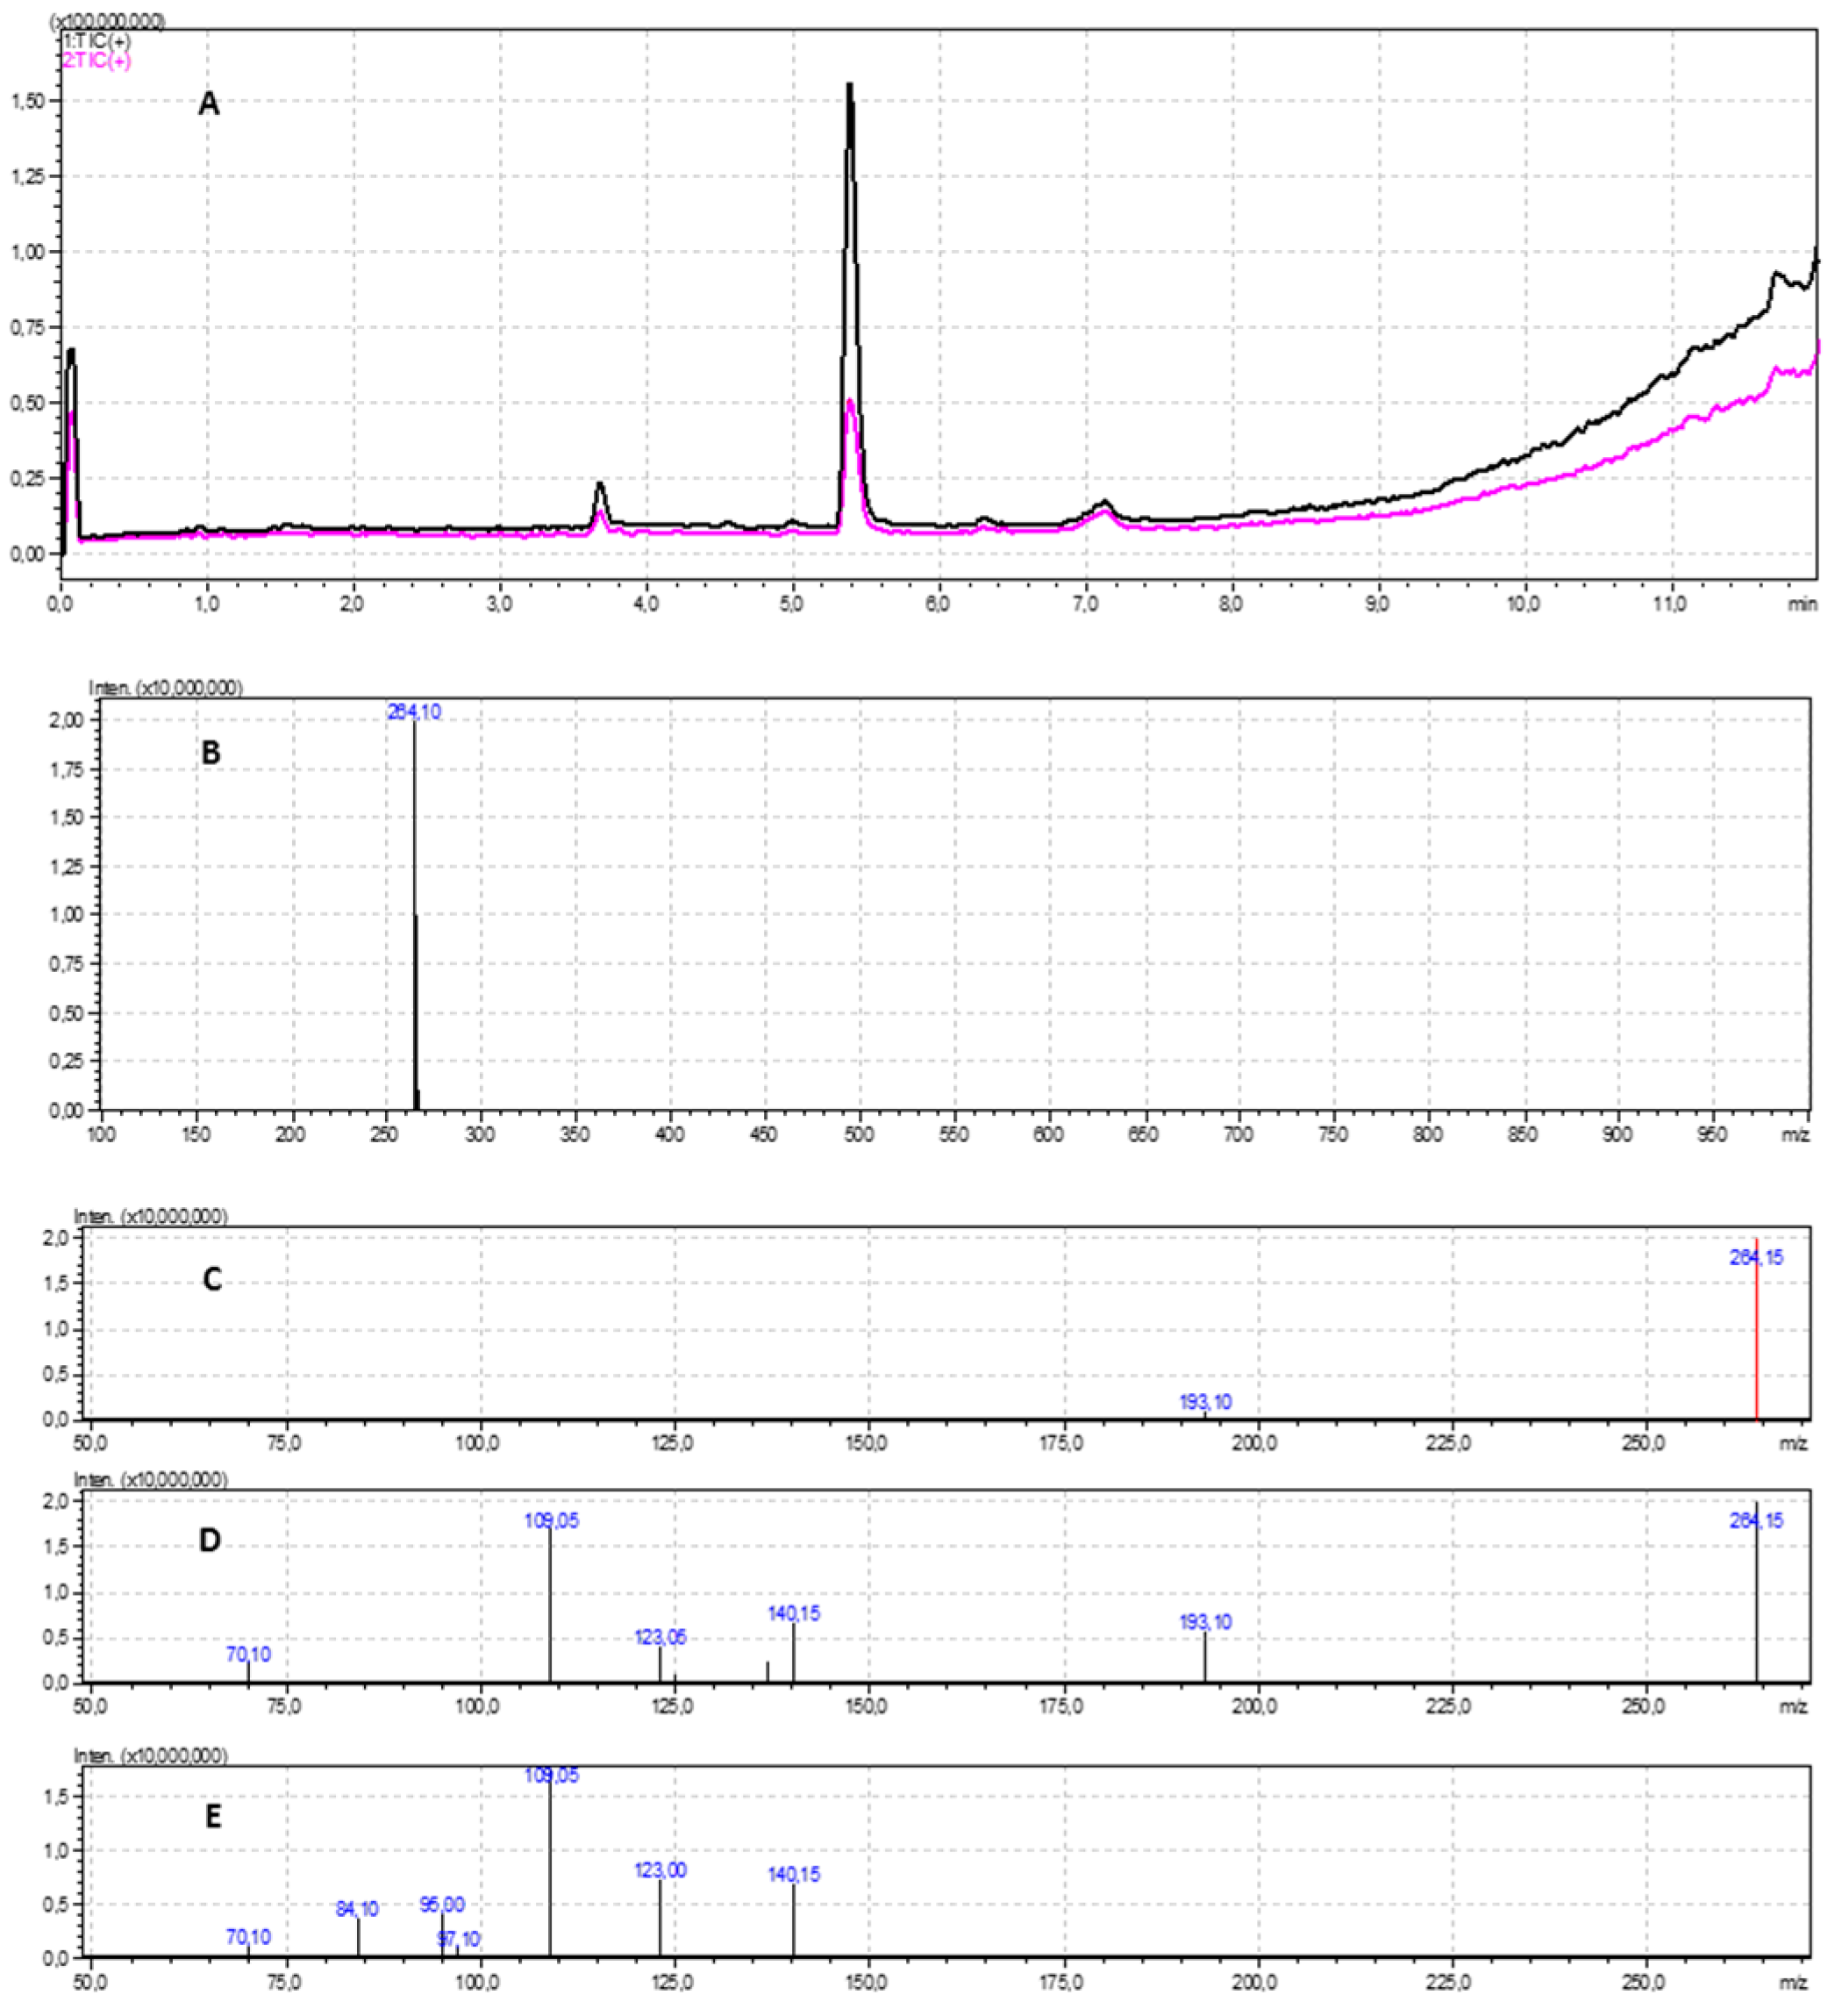
3.3. LC-MS/MS Analysis
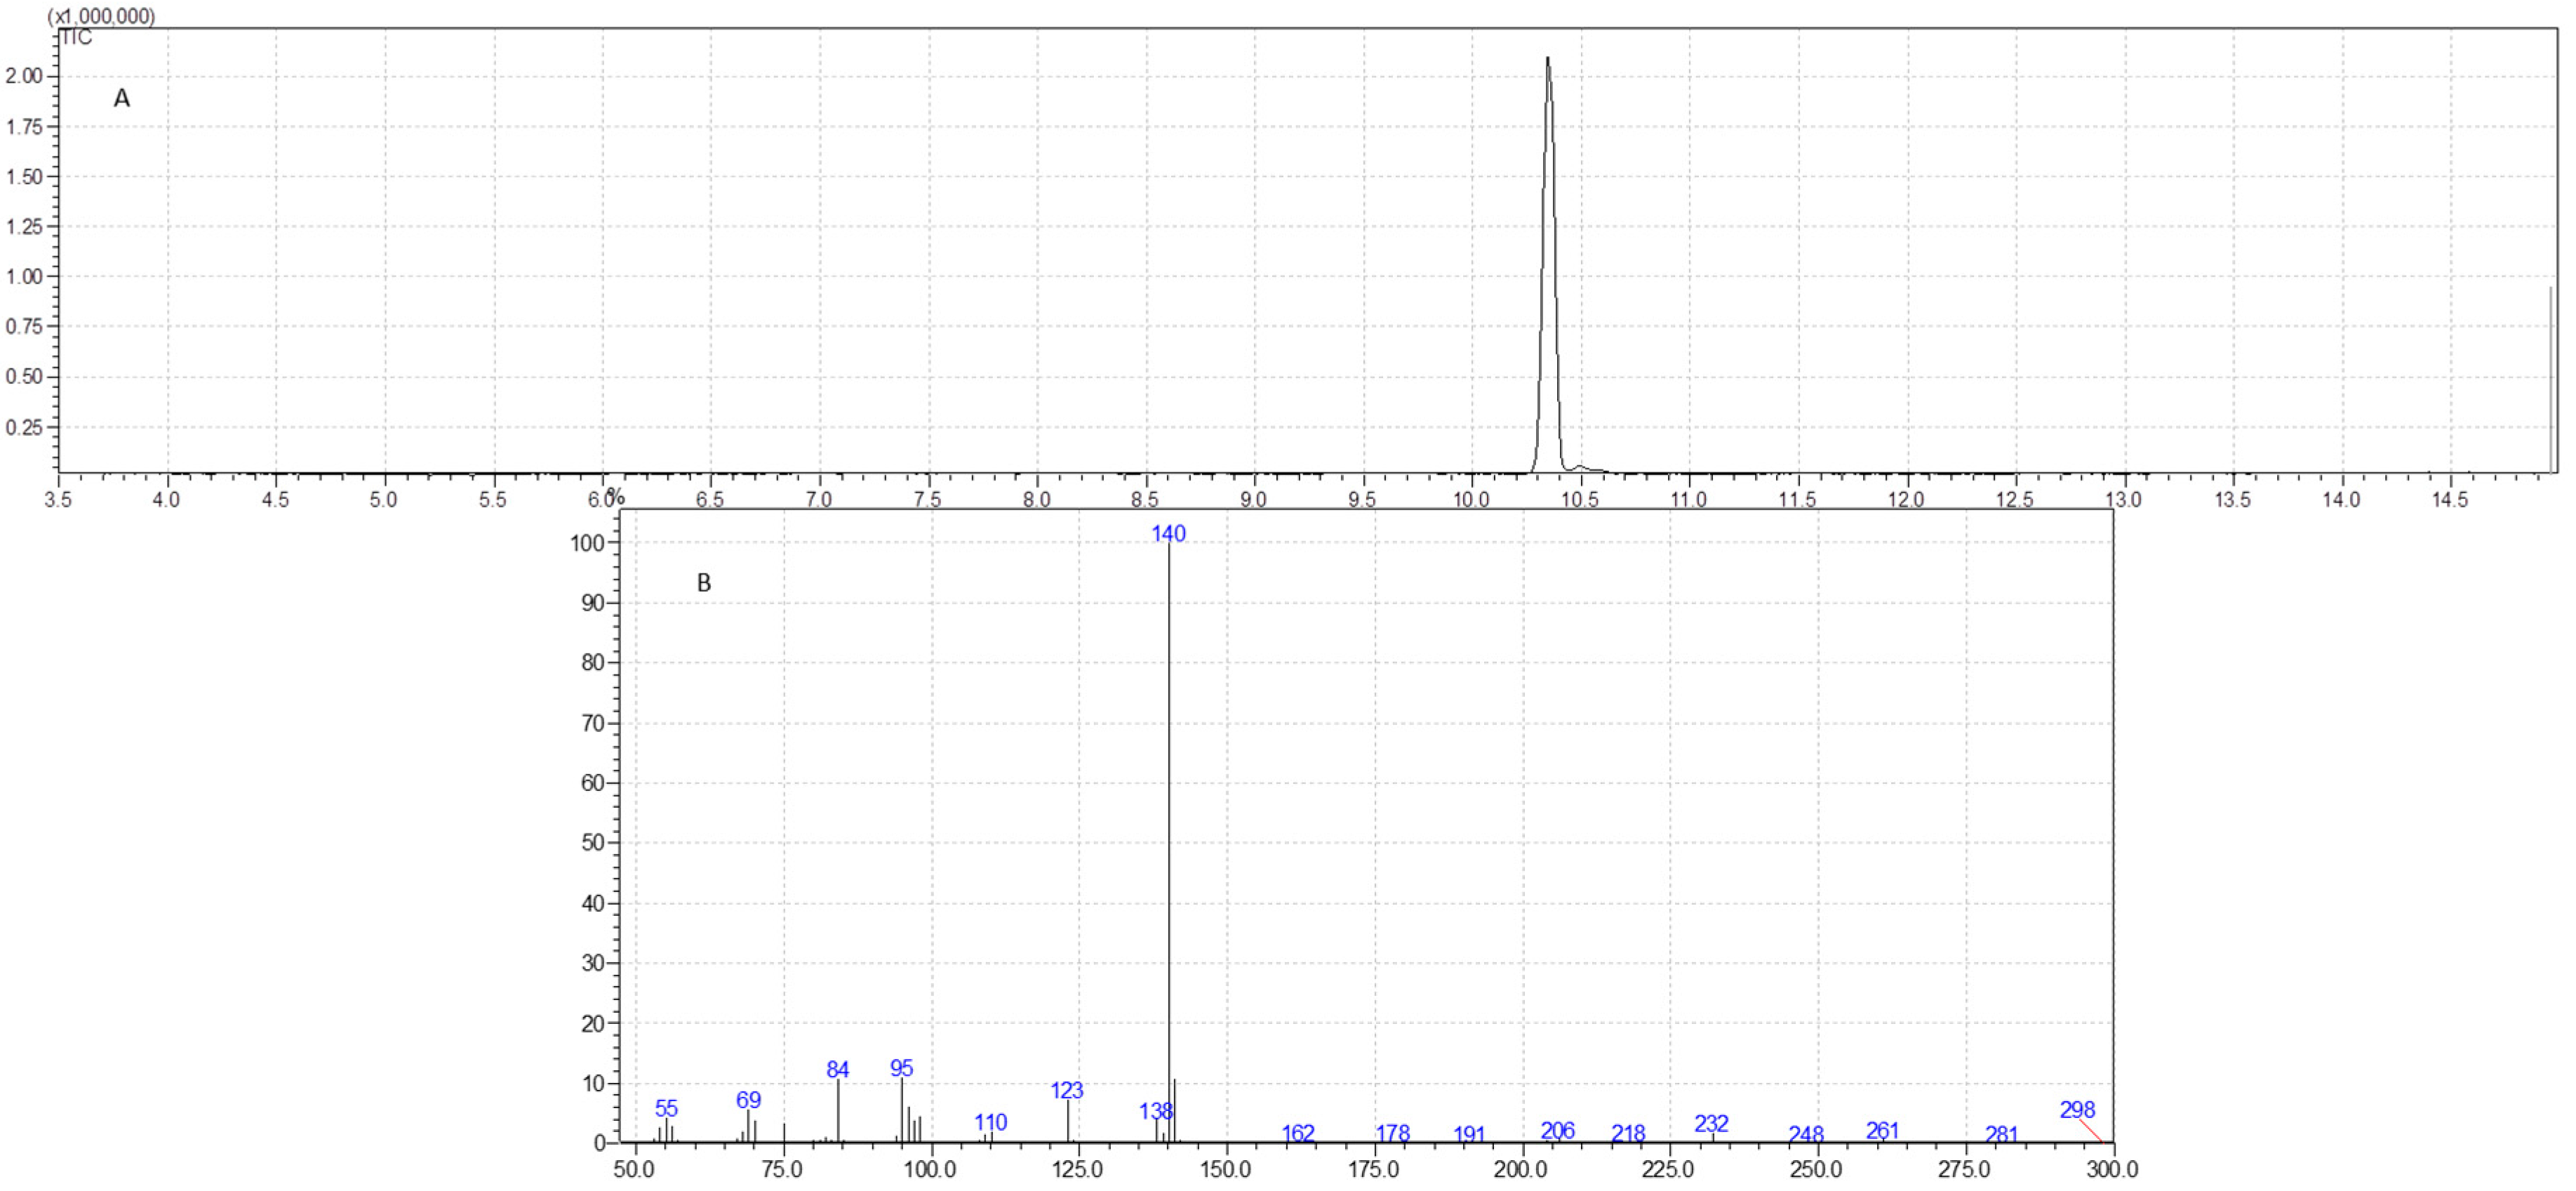
3.4. GC-MS Analysis
4. Conclusions
Supplementary Materials
Author Contributions
Funding
Compliance with ethical standards
Conflicts of Interest
Ethical approval
References
- EMCDDA. European Drug Report 2018: Trends and Developments. 2018. Available online: http://www.emcdda.europa.eu/system/files/publications/8585/20181816_TDAT18001ENN_PDF.pdf (accessed on 23 April 2019).
- Feyissa, A.M.; Kelly, J.P. A review of the neuropharmacological properties of khat. Prog. Neuro Psychopharmacol. Boil. Psychiatry 2008, 32, 1147–1166. [Google Scholar] [CrossRef] [PubMed]
- Simmler, L.D.; Buser, T.A.; Donzelli, M.; Schramm, Y.; Dieu, L.H.; Huwyler, J.; Chaboz, S.; Hoener, M.C.; Liechti, M.E. Pharmacological characterization of designer cathinones in vitro. Br. J. Pharmacol. 2013, 168, 458–470. [Google Scholar] [CrossRef] [PubMed]
- Kelly, J.P. Cathinone derivatives: A review of their chemistry, pharmacology and toxicology. Drug Test. Anal. 2011, 3, 439–453. [Google Scholar] [CrossRef] [PubMed]
- Majchrzak, M.; Celiński, R.; Kuś, P.; Kowalska Sajewicz, M. The newest cathinone derivatives as designer drugs: An analyticalband toxicological review. Forensic Toxicol. 2011, 36, 33–50. [Google Scholar] [CrossRef] [PubMed]
- Hyde, J.F.; Browning, E.; Adams, R. Synthetic Homologs of d,l-ephedrine. J. Am. Chem. Soc. 1928, 50, 2287–2292. [Google Scholar] [CrossRef]
- Valente, M.J.; Guedes de Pinho, P.; de Lourdes Bastos, M.; Carvalho, F.; Carvalho, M. Khat and synthetic cathinones: A review. Arch. Toxicol. 2014, 88, 15–45. [Google Scholar] [CrossRef] [PubMed]
- Trzybiński, D.; Niedziałkowski, P.; Ossowski, T.; Trynda, A.; Sikorski, A. Single-crystal X-ray diffraction analysis of designer drugs: Hydrochlorides of metaphedrone and pentedrone. Forensic Sci. Int. 2013, 232, 28–32. [Google Scholar] [CrossRef] [PubMed]
- Kuś, P.; Kusz, J.; Książek, M.; Pieprzyca, E.; Rojkiewicz, M. Spectroscopic characterization and crystal structures of two cathinone derivatives: N-ethyl-2-amino-1-phenylpropan-1-one (ethcathinone) hydrochloride and N-ethyl-2-amino-1-(4-chlorophenyl)propan-1-one (4-CEC) hydrochloride. Forensic Toxicol. 2017, 35, 114–124. [Google Scholar] [CrossRef]
- Camilleri, A.; Johnston, M.R.; Brennan, M.; Davis, S.; Caldicott, D.G. Chemical analysis of four capsules containing the controlled substance analogues 4-methylmethcathinone, 2-fluoromethamphetamine, α-phthalimidopropiophenone and N-ethylcathinone. Forensic Sci. Int. 2010, 197, 59–66. [Google Scholar] [CrossRef]
- Kolanoś, R.; Solis, E.; Sakloth, F.; De Felice, L.J.; Glennon, R.A. “Deconstruction” of the Abused Synthetic Cathinone Methylenedioxypyrovalerone (MDPV) and an Examination of Effects at the Human Dopamine Transporter. ACS Chem. Neurosci. 2013, 4, 1524–1529. [Google Scholar] [CrossRef]
- Matsuta, S.; Katagi, M.; Nishioka, H.; Kamata, H.; Sasaki, K.; Shima, N.; Kamata, T.; Miki, A.; Tatsuno, M.; Zaitsu, K.; et al. Structural characterization of cathinone-type designer drugs by EI mass spectrometry. Jpn. J. Forensic Sci. Technol. 2014, 19, 77–89. [Google Scholar] [CrossRef] [Green Version]
- Mikołajczyk, A.; Adamowicz, P.; Tokarczyk, B.; Sekuła, K.; Gieroń, J.; Wrzesień, W.; Stanaszek, R. Determination of N-ethylhexedrone, a new cathinone derivative, in blood collected from drivers—Analysis of three cases. Probl. Forensic Sci. 2017, 109, 53–63. [Google Scholar]
- Kuś, P.; Rojkiewicz, M.; Kusz, J.; Książek, M.; Sochanik, A. Spectroscopic characterization and crystal structures of four hydrochloride cathinones: N-ethyl-2-amino-1-phenylhexan-1-one (hexen, NEH), N-methyl-2-amino-1-(4-methylphenyl)-3-methoxypropan-1-one (mexedrone), N-ethyl-2-amino-1-(3,4-methylenedioxyphenyl)pentan-1-one (ephylone) and N-butyl-2-amino-1-(4-chlorophenyl)propan-1-one (4-chlorobutylcathinone). Forensic Toxicol. 2019, 37, 456–464. [Google Scholar] [CrossRef] [Green Version]
- Pauk, V.; Lemr, K. Forensic applications of supercritical fluid chromatography – Mass spectrometry. J. Chromatogr. B 2018, 1086, 184–196. [Google Scholar] [CrossRef]
- Schwaningera, A.E.; Meyerb, M.R.; Maurer, H.H. Chiral drug analysis using mass spectrometric detection relevant to research and practice in clinical and forensic toxicology. J. Chromatogr. A 2012, 1269, 122–135. [Google Scholar] [CrossRef]
- Spálovská, D.; Maříková, T.; Kohout, M.; Králík, F.; Kuchař, M.; Setnička, V. Methylone and pentylone: Structural analysis of new psychoactive substances. Forensic Toxicol. 2019, 37, 366–377. [Google Scholar] [CrossRef]
- Silva, B.; Pereira, J.A.; Cravo, S.; Araújo, A.M.; Fernandes, C.; Pinto, M.M.; de Pinho, P.G.; Remião, F. Multi-milligram resolution and determination of absolute configuration of pentedrone and methylone enantiomers. J. Chromatogr. B 2018, 1100, 158–164. [Google Scholar] [CrossRef]
- Jurásek, B.; Bartůněk, V.; Huber, S.; Kuchař, M. X-ray powder diffraction—A non-destructive and versatile approach for the identification of new psychoactive substances. Talanta 2019, 195, 414–418. [Google Scholar] [CrossRef]
- European Project Response to Challenges to Forensic Drugs Analyses. Analytical Report: 4-CDC. 2016. Available online: https://www.policija.si/apps/nfl_response_web/0_Analytical_Reports_final/4-CDC-ID-1908-18_report.pdf (accessed on 1 August 2019).
- European Project Response to Challenges to Forensic Drugs Analyses. Analytical Report: tBuONE. 2016. Available online: https://www.policija.si/apps/nfl_response_web/0_Analytical_Reports_final/tBuONE-ID-1378-15-report_final1.pdf (accessed on 1 August 2019).
- European Project Response to Challenges to Forensic Drugs Analyses.Analytical Report: 4F-PHP. 2016. Available online: https://www.policija.si/apps/nfl_response_web/0_Analytical_Reports_final/4F-PHP-ID-1302-15rpt081216.pdf (accessed on 1 August 2019).
- European Project Response to Challenges to Forensic Drugs Analyses. Analytical Report: 3-MEC. 2016. Available online: https://www.policija.si/apps/nfl_response_web/0_Analytical_Reports_final/3-MEC-ID-1724-16_report.pdf (accessed on 1 August 2019).
- Maas, A.; Sydow, K.; Madea, B.; Hess, C. Separation of ortho, meta and para isomers of methylmethcathinone (MMC) and methylethcathinone (MEC) using LC-ESI-MS/MS: Application to forensic serum samples. J. Chromatogr. B 2017, 1051, 118–125. [Google Scholar] [CrossRef]
- Apirakkan, O.; Frinculescu, A.; Shine, T.; Parkin, M.C.; Cilibrizzi, A.; Frascione, N.; Abbate, V. Analytical characterization of three cathinone derivatives,4-MPD, 4F–PHP and bk-EPDP, purchased as bulk powderfrom online vendors. Drug Test. Anal. 2018, 10, 372–378. [Google Scholar] [CrossRef]
- Wagmann, L.; Manier, S.K.; Eckstein, N.; Maurer, H.H.; Meyer, M.R. Toxicokinetic studies of the four new psychoactive substances 4-chloroethcathinone, N-ethylnorpentylone, N-ethylhexedrone, and 4-fluoro-alpha-pyrrolidinohexiophenone. Forensic Toxicol. 2019, 1–11. [Google Scholar] [CrossRef]
- CrysAlisPro; Agilent Technologies Inc.: Yarnton, Oxfordshire, UK.
- Sheldrick, G.M. Crystal structure refinement with SHELXL. Acta Crystallogr. Sect. C Struct. Chem. 2015, 71, 3–8. [Google Scholar] [CrossRef] [PubMed]
- Brandenburg, K. Diamond; Version 4.0; Crystal, Molecular Structure Visualization; Crystal Impact—K. Brandenburg & H. Putz Gbr: Bonn, Germany, 2009. [Google Scholar]


| 4-CDC | MDPT | 4F-PHP | 3-MEC | |
|---|---|---|---|---|
| Chemical formula | [C11H15ClNO]Cl | [C14H20NO3]Cl | [C16H23FNO]Br | [C12H18NO]Cl |
| Formula Mass | 248.14 | 285.76 | 344.26 | 227.72 |
| Crystal system | triclinic | triclinic | triclinic | monoclinic |
| a(Å) | 7.071(3) | 7.290(3) | 10.004(8) | 7.518(3) |
| b(Å) | 7.219(3) | 8.376(3) | 12.721(9) | 26.055(9) |
| c(Å) | 12.010(5) | 12.686(5) | 14.362(9) | 6.991(3) |
| α(°) | 74.83(3) | 101.54(3) | 65.14(4) | |
| β(°) | 86.72(3) | 98.01(3) | 86.52(5) | 113.09(4) |
| γ(°) | 85.16(3) | 97.50(3) | 78.95(5) | |
| Unit cell volume (Å3) | 589.2(4) | 741.5(5) | 1627(2) | 1259.7(9) |
| Temperature (K) | 100(2) | 100(2) | 100(2) | 100(2) |
| Space group | P-1 | P-1 | P-1 | P21/c |
| No. of formula units per unit cell, Z | 2 | 2 | 4 | 4 |
| Radiation type | MoKα | MoKα | MoKα | MoKα |
| Absorption coefficient, μ (mm−1) | 0.524 | 0.261 | 2.532 | 0.279 |
| No. of reflections measured | 6239 | 5035 | 12021 | 9302 |
| No. of independent reflections | 3536 | 3127 | 6019 | 3312 |
| Rint | 0.0349 | 0.0416 | 0.0683 | 0.0482 |
| Final R1 values (I > 2σ(I)) | 0.0487 | 0.0539 | 0.0937 | 0.0524 |
| Final wR(F2) values (I > 2σ(I)) | 0.1318 | 0.1367 | 0.2386 | 0.1310 |
| Final R1 values (all data) | 0.0523 | 0.0610 | 0.1417 | 0.0657 |
| Final wR(F2) values (all data) | 0.1389 | 0.1475 | 0.2975 | 0.1423 |
| D—H···A | D—H | H···A | D···A | D—H···A |
|---|---|---|---|---|
| N1—H1···Cl2 | 1.00 | 2.14 | 3.0386 (19) | 149 |
| C8—H8···Cl2i | 1.00 | 2.72 | 3.645 (2) | 154 |
| C11—H11C···Cl2ii | 0.98 | 2.72 | 3.654 (2) | 160 |
| D—H···A | D—H | H···A | D···A | D—H···A |
|---|---|---|---|---|
| N1—H1A···Cl1i | 0.91 | 2.36 | 3.178 (2) | 150 |
| N1—H1B···Cl1 | 0.91 | 2.24 | 3.149 (2) | 175 |
| C5—H5···O1ii | 0.95 | 2.54 | 3.364 (3) | 145 |
| C14—H14A···Cl1iii | 0.99 | 2.75 | 3.569 (3) | 141 |
| C8—H8···Cl1iv | 1.00 | 2.70 | 3.523 (3) | 140 |
| D—H···A | D—H | H···A | D···A | D—H···A |
|---|---|---|---|---|
| N11—H11···Br11 | 1.00 | 2.30 | 3.199 (6) | 149 |
| C81—H81···Br12i | 1.00 | 2.64 | 3.591 (8) | 159 |
| N12—H12···Br12 | 1.00 | 2.25 | 3.167 (6) | 152 |
| C82—H82···Br11 | 1.00 | 2.61 | 3.565 (8) | 160 |
| D—H···A | D—H | H···A | D···A | D—H···A |
|---|---|---|---|---|
| N1—H1A···Cl1i | 0.91 | 2.30 | 3.106 (2) | 148 |
| N1—H1B···Cl1 | 0.91 | 2.20 | 3.1067 (17) | 174 |
| C8—H8···Cl1ii | 1.00 | 2.51 | 3.482 (2) | 163 |
© 2019 by the authors. Licensee MDPI, Basel, Switzerland. This article is an open access article distributed under the terms and conditions of the Creative Commons Attribution (CC BY) license (http://creativecommons.org/licenses/by/4.0/).
Share and Cite
Siczek, M.; Siczek, M.; Szpot, P.; Zawadzki, M.; Wachełko, O. Crystal Structures and Spectroscopic Characterization of Four Synthetic Cathinones: 1-(4-Chlorophenyl)-2-(Dimethylamino)Propan-1-One (N-Methyl-Clephedrone, 4-CDC), 1-(1,3-Benzodioxol-5-yl)-2-(Tert-Butylamino)Propan-1-One (tBuONE, Tertylone, MDPT), 1-(4-Fluorophenyl)-2-(Pyrrolidin-1-yl)Hexan-1-One (4F-PHP) and 2-(Ethylamino)-1-(3-Methylphenyl)Propan-1-One (3-Methyl-Ethylcathinone, 3-MEC). Crystals 2019, 9, 555. https://doi.org/10.3390/cryst9110555
Siczek M, Siczek M, Szpot P, Zawadzki M, Wachełko O. Crystal Structures and Spectroscopic Characterization of Four Synthetic Cathinones: 1-(4-Chlorophenyl)-2-(Dimethylamino)Propan-1-One (N-Methyl-Clephedrone, 4-CDC), 1-(1,3-Benzodioxol-5-yl)-2-(Tert-Butylamino)Propan-1-One (tBuONE, Tertylone, MDPT), 1-(4-Fluorophenyl)-2-(Pyrrolidin-1-yl)Hexan-1-One (4F-PHP) and 2-(Ethylamino)-1-(3-Methylphenyl)Propan-1-One (3-Methyl-Ethylcathinone, 3-MEC). Crystals. 2019; 9(11):555. https://doi.org/10.3390/cryst9110555
Chicago/Turabian StyleSiczek, Marta, Miłosz Siczek, Paweł Szpot, Marcin Zawadzki, and Olga Wachełko. 2019. "Crystal Structures and Spectroscopic Characterization of Four Synthetic Cathinones: 1-(4-Chlorophenyl)-2-(Dimethylamino)Propan-1-One (N-Methyl-Clephedrone, 4-CDC), 1-(1,3-Benzodioxol-5-yl)-2-(Tert-Butylamino)Propan-1-One (tBuONE, Tertylone, MDPT), 1-(4-Fluorophenyl)-2-(Pyrrolidin-1-yl)Hexan-1-One (4F-PHP) and 2-(Ethylamino)-1-(3-Methylphenyl)Propan-1-One (3-Methyl-Ethylcathinone, 3-MEC)" Crystals 9, no. 11: 555. https://doi.org/10.3390/cryst9110555