1. Introduction
Access to water, sanitation, and hygiene (WaSH) in schools is important for human health and well-being. Some of these benefits have yet to be fully achieved in low- and middle-income countries, due to low WaSH coverage. Proposed targets and indicators for the Sustainable Development Goals (SDGs) seek universal access to WaSH in non-household settings, such as schools and health care facilities [
1,
2,
3,
4]. Inadequate WaSH in schools results in adverse health outcomes among children including infectious, gastrointestinal, neuro-cognitive and psychological illnesses [
5]. Inadequate WaSH conditions have been reported to reduce educational outcomes in children by contributing to absenteeism [
6,
7,
8,
9] and impaired cognitive abilities [
10,
11,
12]. Bartlett summarized the impact of unsanitary conditions and diarrheal disease on child malnutrition and mental and social development, including IQ, school achievement levels, working memory, and behavioral problems [
11]. The quality of sanitation facilities in schools can impact attendance rates of girls, especially once they have started to menstruate [
13], while a more recent literature review found inconclusive evidence on the subject [
14].
Improving WaSH in schools is linked to multiple benefits. A national study in India using longitudinal data demonstrated that latrine provision resulted in increased enrollment and a higher number of students passing exams [
15]. Broader impacts on communities are reflected in studies such as that of O’Reilly
et al. who identified that 14% of parents reported treating their water after a school-based WaSH intervention, compared with 6% at baseline, suggesting that children can transfer hygiene behaviors learned at schools to their households and to other members of their family [
7,
9,
16].
Because of these health and educational benefits, national governments and multilateral agencies such as the United Nations Children’s Fund (UNICEF) have emphasized frequent monitoring of WaSH key indicators in schools to target resources and programmatic interventions to improve coverage [
2]. In Nicaragua, a low-income country in Latin America, national actors including the Ministries of Education and Health and international donors have partnered to improve WaSH in schools by incorporating the Child-Friendly and Healthy Schools Initiative (CFHS), an initiative that provides a comprehensive protective environment to support quality education, into national policy [
17]. While Nicaragua has shown a commitment to improving WaSH in schools by adopting these policies, a basic monitoring system on WaSH in schools in Nicaragua still needs improvement, especially in collecting disaggregated data at the local level.
In 2012, UNICEF Nicaragua collaborated with the Ministry of Education (MINED), regional and municipal Secretariats of Education, and the Regional Government’s Directorate for WaSH to conduct a survey of WaSH in schools in 12 municipalities. The objectives were to: assess WaSH conditions in schools (to identify priority needs and to provide a baseline from which to measure the effectiveness of interventions); and analyze associations between variables (to determine possible solutions for improving conditions and informing future planning, programs, and research).
3. Results
3.1. General Characteristics
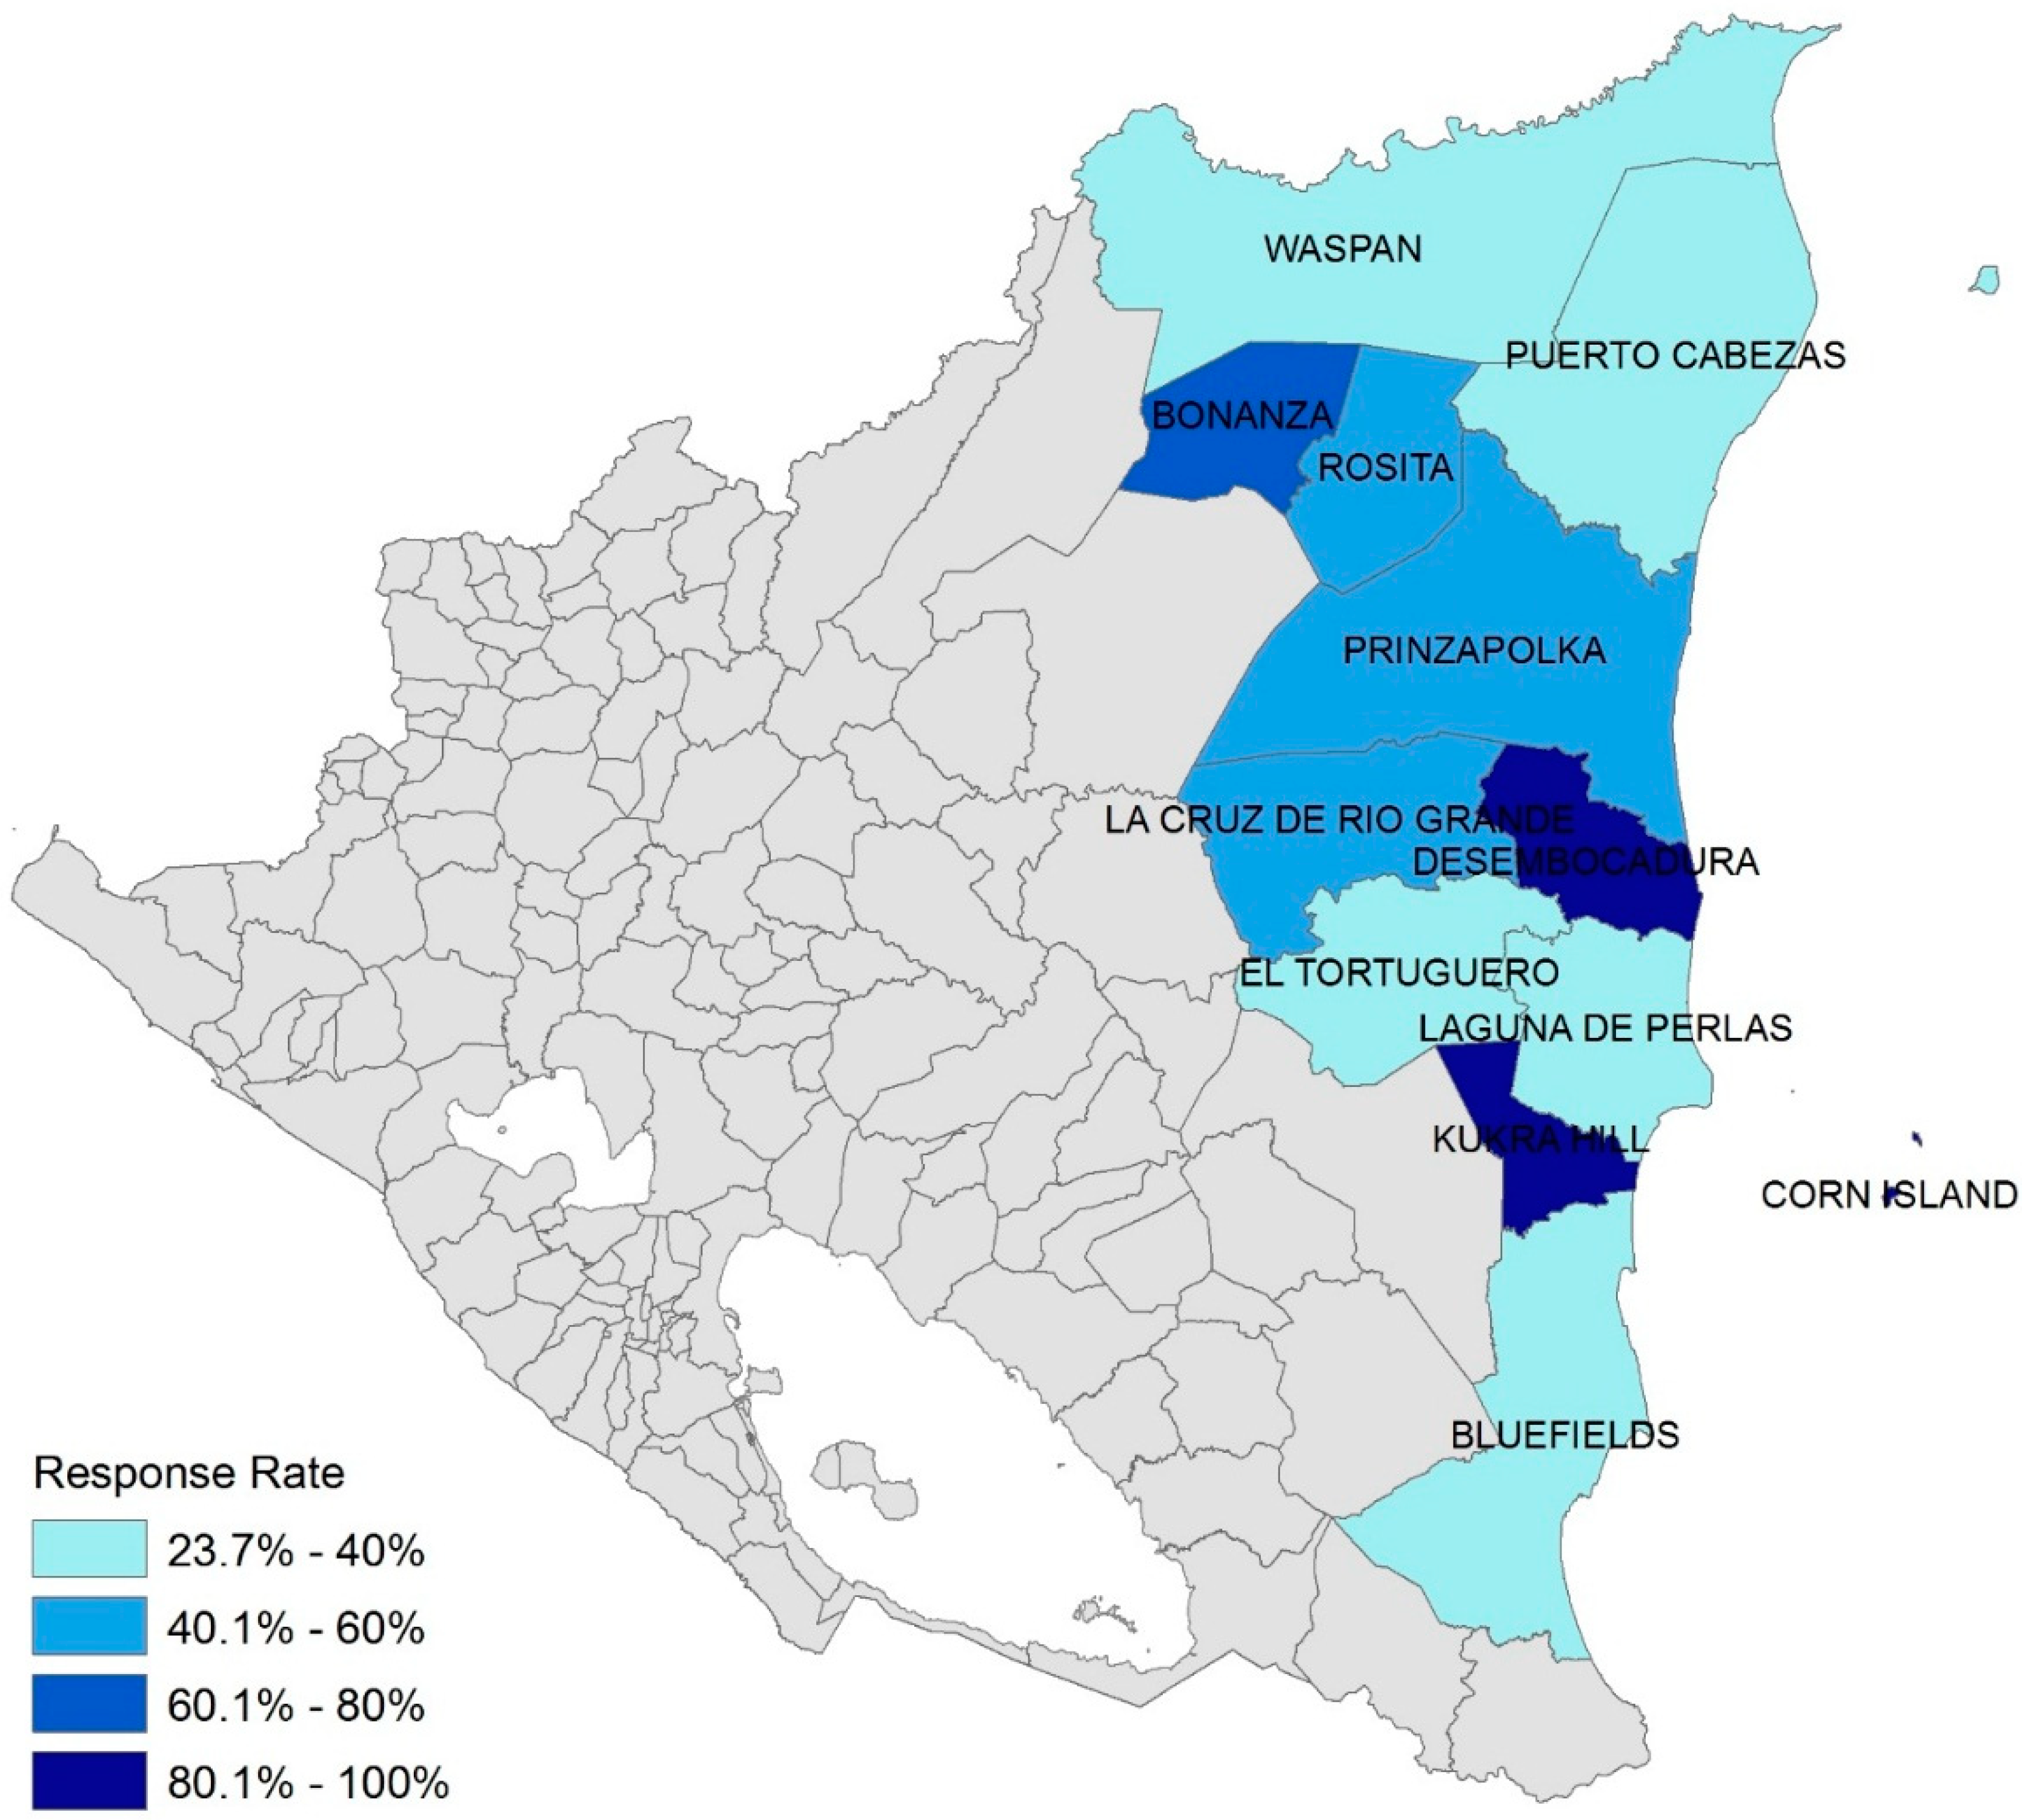
Surveys were completed and returned by 526 schools (43% response rate). These included: 10 preschool, 162 preschool and primary, 255 primary only, 36 secondary only, 42 with all levels, and 31 unspecified schools. The returned surveys had varying levels of completeness, with lower response rates for certain municipalities and questions. Whenever a percentage is reported, the number of respondents is provided for reference either in the text or in a table.
Figure 1 shows the geographic location of the survey municipalities and indicates the response rate by municipality, with darker colors representing higher response rates. The survey responses from areas with low response rates may not be representative of the entire school population.
Primary schools accounted for 83.7% of survey responses, while secondary schools accounted for 6.9%, and schools including both primary and secondary levels made up 9.4% of responses. Based on survey results, schools in low density rural areas were predominantly primary schools (95%), with rural village areas having 73% and urban having 65% primary schools (n = 491, p < 0.001).
Table 2 and
Table 3 indicate that there are substantial differences between schools in urban, rural village, and low density rural areas. Schools in rural areas tended to be newer, have fewer students and classrooms, and were mostly primary schools. For example, urban areas had larger schools with a median of 282.5 students and 6 classrooms, while rural village (median = 70 students, 2 classrooms) and low-density rural areas (median = 32 students, 1 classroom) had much smaller schools with fewer students.
Rural village and low density rural areas had a higher proportion of schools aged between 0–10 years as compared to urban areas. In these rural areas, the older the school building, the more likely it was to have water infrastructure: 64% of schools more than 20 years old had water infrastructure, while 53% of schools 11–20 years and 27% of schools 0–10 years old had water infrastructure (n = 345, p < 0.001). In urban areas, the school buildings in the middle age range (11–20 years old) had the lowest percentage of water infrastructure. In low density rural areas, the school buildings aged 0–10 years had significantly fewer sanitation facilities (49%) than schools more than 10 years old (69%), (n = 220, p < 0.01).
Figure 1.
Survey response rate by municipality.
Figure 1.
Survey response rate by municipality.
Table 2.
School characteristics based on survey responses.
Table 2.
School characteristics based on survey responses.
| Factor | Low Density Rural | Rural Village | Urban | Total |
|---|
| % | n * | % | n * | % | n * |
|---|
| Total Schools by Urban-Rural Setting † | 53% | 267 | 29% | 148 | 17% | 87 | 502 |
| School Type | Primary | 95% | 250 | 73% | 108 | 65% | 53 | 411 |
| Secondary | 2% | 6 | 10% | 15 | 16% | 13 | 34 |
| Multiple/All Grade Levels | 2% | 6 | 16% | 24 | 20% | 16 | 46 |
| School Building Age | 0–10 Years | 67% | 172 | 46% | 60 | 40% | 32 | 264 |
| 11–20 Years | 25% | 65 | 37% | 48 | 22% | 18 | 131 |
| >20 Years | 8% | 21 | 18% | 23 | 38% | 31 | 75 |
| School Size | Median (Mean) # of Students (n = 239) | 23.8 (27.3) | 30.0 (46.3) | 55.2 (67.6) | 27.4 (40.0) |
| Median (Mean) # of Classrooms (n = 392) | 1 (1.55) | 2 (3.13) | 6 (6.58) | 2 (2.86) |
Table 3.
Urban-rural patterns in select variables of wash in schools.
Table 3.
Urban-rural patterns in select variables of wash in schools.
| Factor | Low Density Rural | Rural Village | Urban | Total | p-Value † |
|---|
| % Yes | n * | % Yes | n * | % Yes | n * |
|---|
| Water in Schools |
| | Water Infrastructure at School (working and damaged) | 28% | 230 | 58% | 137 | 68% | 75 | 442 | <0.001 |
| Of schools w/water infrastructure, % functioning | 77% | 64 | 65% | 79 | 82% | 51 | 194 | 0.062 |
| Of schools w/damaged water infrastructure, % carry | 40% | 15 | 46% | 28 | 44% | 9 | 52 | 0.921 |
| Of schools w/o water infrastructure, % carry | 47% | 166 | 34% | 58 | 38% | 24 | 248 | 0.213 |
| Functioning Water Infrastructure | 21% | 230 | 37% | 137 | 56% | 75 | 442 | <0.001 |
| Water Carried to Schools (in case no water infrastructure or damaged) | 37% | 230 | 24% | 137 | 17% | 75 | 442 | 0.002 |
| No Access to Water (in case no water infrastructure or damaged) | 42% | 230 | 39% | 137 | 27% | 75 | 442 | 0.056 |
| Water Treatment | 50% | 101 | 71% | 58 | 83% | 36 | 195 | <0.001 |
| Water Filter for Rain Water | 28% | 53 | 21% | 43 | 15% | 26 | 122 | 0.405 |
| Water Inspections by Government Officials | 9% | 128 | 21% | 82 | 27% | 52 | 262 | 0.004 |
| Students Drink from a Shared Cup | 48% | 129 | 37% | 79 | 34% | 38 | 246 | 0.151 |
| Sanitation in Schools |
| | Sanitation Facilities | 56% | 226 | 73% | 113 | 79% | 62 | 401 | <0.001 |
| Sanitation Facilities Used | 70% | 126 | 67% | 82 | 82% | 49 | 257 | 0.183 |
| Disuse due to: Poor Conditions | 44% | 55 | 52% | 46 | 57% | 14 | 115 | 0.446 |
| Disuse due to: Latrines Full | 36% | 55 | 24% | 46 | 21% | 14 | 115 | 0.446 |
| Disuse due to: Not accustomed | 15% | 55 | 9% | 46 | 7% | 14 | 115 | 0.446 |
| Toilets with Lid | 19% | 154 | 23% | 113 | 35% | 68 | 335 | 0.038 |
| Gender Separated Toilets | 24% | 165 | 44% | 119 | 49% | 72 | 356 | <0.001 |
| Latrines Cleaned Several Times/Week | 35% | 144 | 32% | 95 | 55% | 58 | 268 | <0.01 |
| Hygiene in Schools |
| | Handwashing Stations | 11% | 239 | 25% | 139 | 32% | 74 | 452 | <0.001 |
| Students Wash Hands w/ Soap | 22% | 183 | 25% | 111 | 42% | 57 | 351 | 0.01 |
| General Hygiene Awareness Program | 35% | 209 | 52% | 133 | 65% | 69 | 411 | <0.001 |
| Environ. Health Training (past 3 years) | 19% | 210 | 21% | 128 | 64% | 69 | 407 | <0.001 |
| Personal Hygiene Training (past 3 years) | 22% | 215 | 29% | 126 | 54% | 69 | 410 | <0.001 |
| Training follows FECSA Methodology | 10% | 194 | 11% | 115 | 13% | 69 | 378 | 0.822 |
| No Training Program in Past 3 Years | 54% | 203 | 33% | 126 | 18% | 71 | 400 | <0.001 |
| General School Action Plan | 60% | 206 | 68% | 101 | 91% | 67 | 374 | <0.001 |
| Hygiene in School Action Plan | 56% | 124 | 78% | 69 | 77% | 61 | 254 | 0.001 |
| Community Involvement |
| | Parent Association | 93% | 258 | 87% | 141 | 94% | 80 | 479 | 0.080 |
| Teacher Association | 23% | 222 | 30% | 123 | 51% | 70 | 415 | <0.001 |
| Student Association | 59% | 248 | 56% | 130 | 76% | 75 | 453 | 0.012 |
| Parents Participate in WaSH in School | 30% | 142 | 47% | 86 | 31% | 52 | 280 | 0.034 |
| Teachers Participate in WaSH in School | 31% | 131 | 60% | 75 | 50% | 46 | 252 | <0.001 |
3.2. Water in Schools
Less than half of schools had access to water infrastructure (piped connections, boreholes, and wells with hand pumps or electric pumps) (43%, n = 456). As shown in
Table 3, the percentage of schools with water infrastructure varied significantly between urban and rural locations, with 28% in low density rural areas, 58% in rural villages and 68% in urban areas (
p < 0.001). Carrying water to the school was the most common type of water access in low density rural areas.
Of the 197 schools with water infrastructure, 52 (26%) reported that the water system was non-functional (i.e., damaged or not functioning properly). The highest percentage of non-functional water systems was in rural villages (35%), while low density rural areas had 23% non-functional water systems, and urban areas had 18% non-functionality. Thus, when accounting for water system functionality, 32% of schools had functional water systems, 30% had water carried to school from an outside source, and 38% had no access to water (n = 456).
We conducted a logistic regression to test whether infrastructure age was associated with functionality. Not surprisingly, the results showed that of schools with water infrastructure, newer water infrastructure (0–5 years in age) was more likely to be functioning than older infrastructure (over 5 years in age), (OR 3.4; 95% CI: 1.2–10.0; p = 0.02). A separate logistic regression showed that the odds that water infrastructure was functioning at a school with teacher involvement in water infrastructure planning and maintenance were 2.3 (95% CI: 0.97–5.4; p = 0.0599) times the odds at a school without teacher involvement, when urban-rural location was controlled for, though the result was narrowly not significant. When age of infrastructure is added to the logistic regression model, teacher involvement is even less statistically significant.
School directors were asked whether water at the school was treated prior to consumption by students, by a clay filter, chlorination, the SODIS method, any other method, or no treatment. Of the 77 “other” responses, 68 were “I don’t know”. This means that 24% of respondents were uncertain or did not know if the water at their school was treated. For this reason, the “other method” category was excluded from analysis. Water treatment followed a similar urban-rural pattern as water infrastructure, ranging from 50% of schools in low density rural areas to 71% of schools in rural villages and 83% of schools in urban areas that had water treatment (n = 195, p < 0.001). A separate question asked directors at schools where rain water was collected, whether that water was filtered or purified. Of the 134 respondents, 29 (22%) responded that a filter or purification was used.
School directors provided information on whether health authorities had tested the school water. Government health inspections of school water quality also follow an urban-rural trend, with urban schools and schools with water infrastructure being inspected more than schools in low-density rural areas. Based on school director responses, water quality had been tested by government health officials at 27% of urban schools, 21% of rural village schools, and 9% of low density rural schools (n = 262, p = 0.004). These water quality data were not available for analysis in this article.
Children may drink water from a shared cup while at school. Though not statistically significant, the percentage of schools where survey respondents reported that students drink from a shared cup varied between 48% in low density rural areas and 34% in urban areas (p = 0.151).
3.3. Sanitation in Schools
In the study area, 64% of schools had improved sanitation facilities on premises (n = 412), but 28% of schools with sanitation facilities reported that they were not used. School directors reported that facilities were not in use due to poor conditions (47%), full latrines (29%), people not accustomed to using them (13%) and other reasons (11%) (n = 118). Based on a logistic regression, schools with sanitation infrastructure 0–5 years in age were more likely to have sanitation infrastructure that was in use than schools aged 6–10 years (OR 2.4; 95% CI: 1.2–5.1; p < 0.05) and even more so than schools over 10 years in age (OR 3.7; 95 CI: 1.6–8.9; p < 0.01).
Of schools with toilets, 19%, 23% and 35% had lids (n = 335) in low density rural, rural village, and urban areas respectively and 5% of all schools had toilet paper (n = 327). Of schools with sanitation, the majority, 70%, had water-less latrines, 17% of schools had a latrine system using water, 8% used a septic-system, 2% were connected to a community sewer system, and 3% reported “other” (n = 307).
Following patterns in water infrastructure, the percentage of schools with sanitation infrastructure exhibited rural-urban differences with coverage of 56% in low density rural, 73% in rural village, and 79% in urban schools (n = 401, p < 0.001). The percentage of schools with gender-separated toilets was significantly lower in low density rural schools (24%) than in rural village schools (44%) and urban schools (49%) (n = 356, p < 0.001). Of the schools with sanitation facilities, 52% of low density rural schools (n = 126) had only one toilet, as compared to 22% in rural village schools (n = 76) and 15% in urban schools (n = 47).
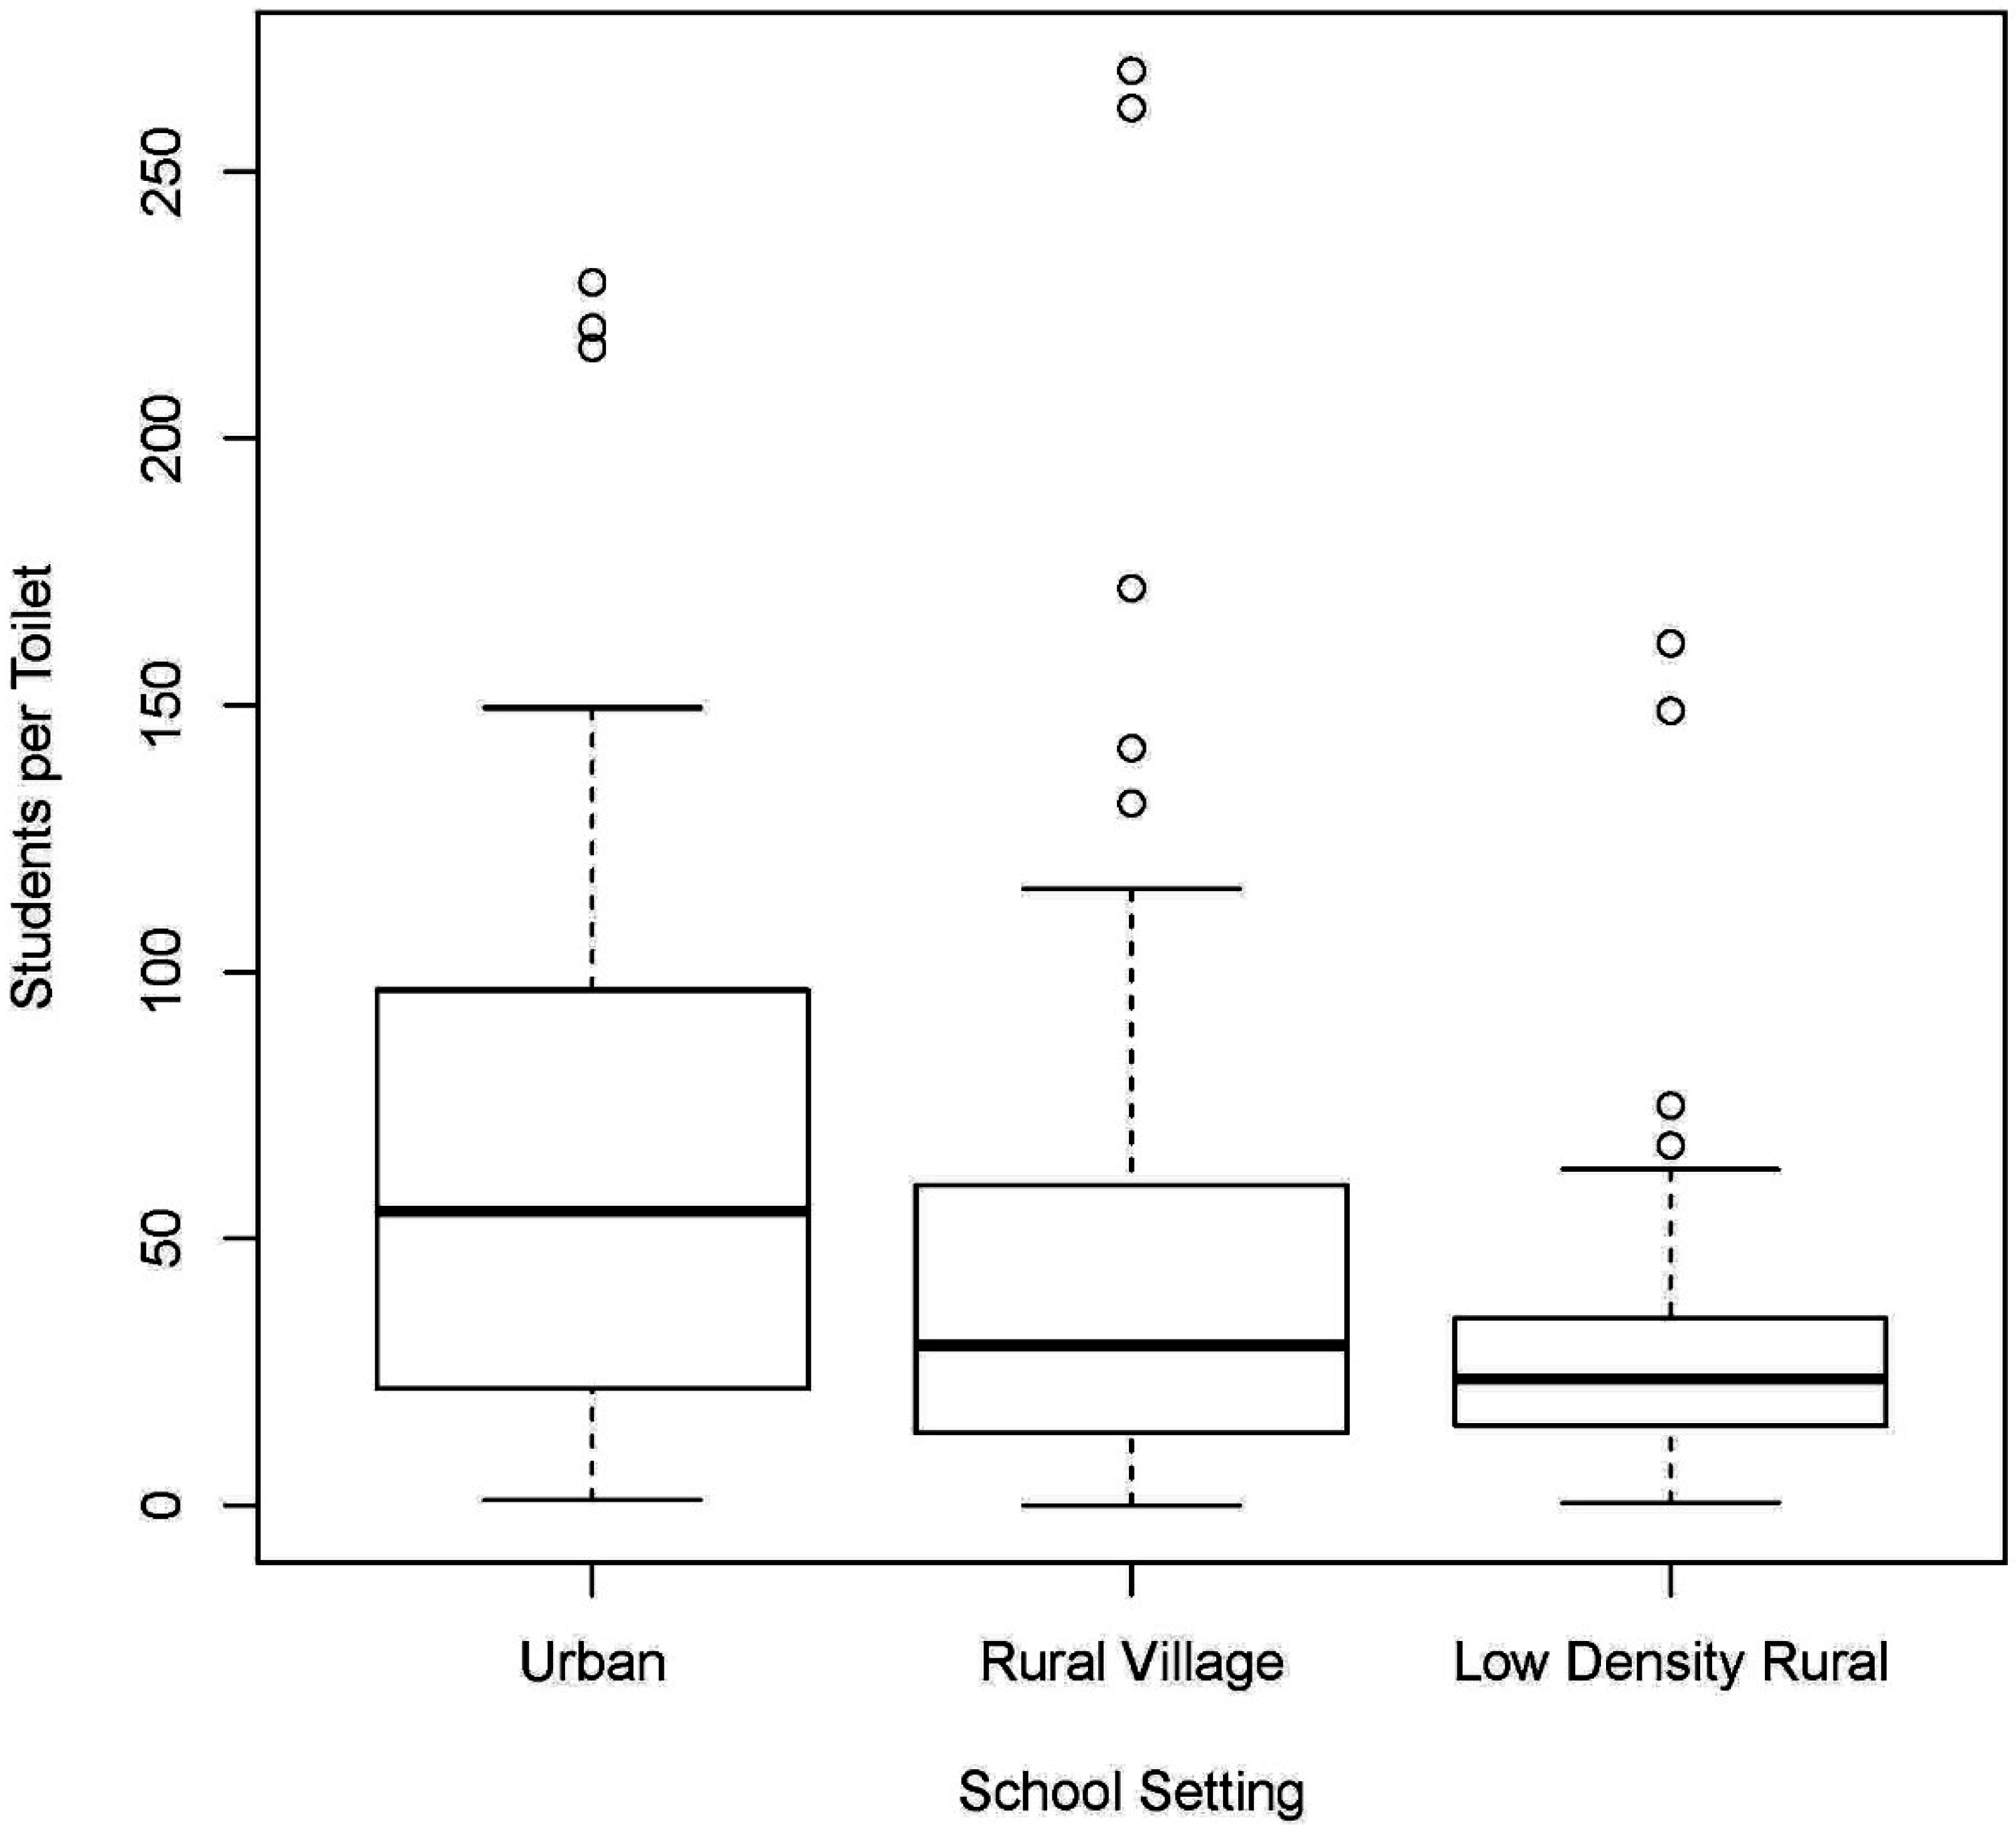
Urban areas had significantly higher student-to-toilet ratios than rural areas, as shown in
Figure 2. These ratios are based on the number of toilet seats at each school. In schools with at least one toilet, the median student to toilet ratio was 55 for urban, 30 for rural village, and 24 for low density rural areas. Based on MINED policy, Nicaragua’s standard is a maximum of 30 students per toilet [
21]. Thus, based on the median, schools in urban areas did not meet this standard. However, this ratio does not include schools without sanitation infrastructure which also do not meet Nicaragua’s school sanitation goals. If schools without any toilets are included in the calculation, the median student to toilet ratio was 73 for urban, 66 for rural village, and 63 for low density rural areas. The student-to-toilet ratio was lowest in primary level only schools. There was no significant difference in the percentage of schools with toilets separated by gender between secondary and primary schools, after controlling for rural-urban location.
A higher proportion of urban schools had cleaning of sanitation facilities several times per week, while rural areas had a higher proportion of schools with once per week or less frequent cleaning (p < 0.01). Toilet facilities were cleaned several times per week in 55% of urban schools and 32% and 35% of rural village and low density rural schools, respectively (n = 297). Irrespective of urban-rural location, more frequent sanitation facility cleaning was associated with personal hygiene education within the past three years at the school, presence of a teachers association, and school cleaning supply budget. Though narrowly not significant, the odds of a school with personal hygiene training having sanitation facility cleaning several times per week were 1.8 (95% CI: 0.99–3.3; p = 0.053) times the odds of a school without such training. Additionally, schools with teachers associations were more likely to have sanitation facility cleaning several times per week than schools without a teachers association (OR 1.8; 95% CI: 1.0–3.2; p < 0.05). Finally, schools with a dedicated cleaning supply budget were more likely to have sanitation facility cleaning several times per week than schools without such a budget (OR 1.2; 95% CI: 1.03–11.1; p < 0.05). Of the 224 schools with cleaning supplies for sanitation facilities, only 10% had a dedicated budget, while 90% of schools had supplies donated by the families of students.
Figure 2.
Student to toilet ratio for schools with at least one toilet, by school setting.
Figure 2.
Student to toilet ratio for schools with at least one toilet, by school setting.
3.4. Hygiene in Schools
The survey investigated the implementation of three separate hygiene training programs at schools. The proportion of schools implementing each of the three programs differed significantly between urban and rural locations. The most significant disparities were noted on whether a school had environmental health training in the past three years. Only 19% of low density rural and 21% of rural village schools had such a program, as compared to 64% of urban schools (n = 407,
p < 0.001). Personal hygiene training at the school within the past three years followed a similar pattern, with such a program being present in 22% of low density rural, 29% of rural village and 54% of urban schools, respectively (n = 410,
p < 0.001). During the 2012 school year, 35% of low density rural, 52% of rural village and 65% of urban schools implemented a general hygiene awareness program for students and teachers at the school (n = 411,
p < 0.001). However, 288 out of 389 responding schools (74%) had never heard of the FECSA methodology, and of the 196 schools with hygiene programs, only 22% were using FECSA. The proportion of schools using the FECSA methodology did not differ between rural and urban areas. Overall, 41% of schools did not implement any of the hygiene programs discussed in the survey (n = 414). This does reflect urban-rural discrepancies (
Table 3). Fifty-four percent of low density rural schools lacked a hygiene program compared to 33% of rural village and 18% of urban schools without a program. (n = 400,
p < 0.001).
Logistic regression indicated that schools with a personal hygiene training in the past three years were more likely to have teacher participation in water infrastructure planning and maintenance as compared to schools without a personal hygiene training (OR 2.3; 95% CI: 1.3–4.3; p < 0.01). However, environmental health training and a general hygiene awareness program were not significantly associated with teacher participation.
While 91% of urban schools had a general school action plan (not hygiene-specific), this percentage was lower in rural villages (68%) and only 60% in low density rural areas (n = 374, p < 0.001). Of the 254 schools with action plans, 77% of urban and 78% of rural village schools included a component on hygiene training in the action plan. In contrast, 56% of low density rural schools included this component in their action plan (p < 0.01). Schools with a hygiene component in the school action plan were more likely to implement at least one type of hygiene training program in the past three years than schools without a hygiene component in the action plan (OR 3.8; 95% CI: 2.0–7.6; p < 0.0001).
Hand washing practices were limited at the surveyed schools: 81% of schools did not have hand washing stations (n = 464) and of schools where hands were washed, 74% washed hands without soap (n = 362). Soap availability differed between rural and urban schools. Forty-two percent of urban schools had a budget or community support to provide soap, as compared to 25% of rural village and 22% of low density rural schools (n = 350, p < 0.01). Of the 95 schools with soap, 95% acquired the soap from parents of students, rather than through a dedicated budget.
4. Discussion
The findings of this study are consistent with evidence on WaSH in schools in other countries and highlight several common WaSH in schools challenges. This study provides evidence of the low WaSH in schools coverage in Nicaragua’s RACCN and RACCS regions. The analysis of WaSH in schools data from disadvantaged regions of Nicaragua indicates that water coverage at schools was significantly lower than sanitation coverage, across both urban and rural areas. Conditions are likely worse than specified in the survey. For example, not all improved water sources are necessarily free of fecal contamination, so access to “safe” water coverage may in fact be lower than reported in this survey since water quality testing was not conducted [
22,
23]. Access to water services and the quality of water varies by season and water quality is typically worse in the wet season [
24]. Stored water quality is generally much worse than water from the source leading to further contamination that was not considered in this analysis [
25].
In low density rural areas with no direct access to water at school, many parents and students assist with bringing water to the school from other locations. Additionally, survey results showed that over 90% of sanitation cleaning supplies and soap for hand washing, were contributed by student families. Parents, and possibly the broader community, may be able to play an important role in addressing WaSH needs in schools. When school budgets do not allow for improvement in WaSH in schools, parents might be able to provide resources to ensure a healthy and safe school environment. However, such a strategy also puts an undue burden on poor communities to pay extra, and can thus act to further increase inequality and undermine sustainability.
In terms of sanitation, most urban schools and half of rural village schools did not meet the national student-to-toilet standard. To improve this ratio, implementers might focus their efforts on building more urinals for boys which are cheaper than toilet blocks, are longer lasting, and allow more resources to be used for building latrines for girls [
26]. Toilet blocks separated by gender are low (ranging from 24% in low density rural to 49% in urban areas). This may result in girls not attending school due to lack of privacy when using the toilet, lack of cleaning materials, lack of soap for hand washing and when menstruating [
27]. Other studies have also found that pubescent girls are going to school in environments that are not gender sensitive and lack adequate facilities and supplies [
28]. An investment in separate latrines for girls may boost girls’ attendance [
8,
15].
A lack of hand washing infrastructure and resources in schools also has adverse effects on school-aged children. Lack of water and soap for hand washing can increase the spread of diseases among students. We found that 81% of schools did not have hand washing stations and students at 71% of schools washed their hands solely with water. It should be noted that the presence of hand washing facilities does not necessarily indicate a higher prevalence of hand washing [
29]. Nonetheless, studies indicate that the potential for long-term behavior change in students to form a sustained habit of properly washing hands is undermined by unreliable availability of soap and water [
30,
31].
Another challenge identified by survey respondents was maintenance. Survey data showed that older water and sanitation systems were less likely to be functional than newer infrastructure. Of schools that reported that toilets were not in use, the most common reason given was poor conditions, while the second most common reason was full latrines. These two reasons are related to the maintenance of sanitary facilities, which has been shown to have an impact on school absence. For example, in a cross-sectional study in Kenya, children who attended primary schools with better maintained latrines were less likely to have had a recent absence [
32]. We found three factors that were associated with sanitation facility cleaning several times per week: personal hygiene training at the school, teachers association at the school, and a school cleaning supply budget. Similarly, Chatterley
et al. (2014) found that conditions needed for the sustainable management of sanitation facilities in Bangladeshi schools included not only financial support and quality construction, but also “incentivizing conditions,” such as a sanitation champion, a teacher with roles and responsibilities for sanitation maintenance, and/or school management committee involvement in sanitation [
33]. Recommended actions from a study in Ethiopia on the impact of WaSH in schools on learning included: “establishing effective school sanitation clubs, raising parent awareness through education, (and) strengthening sector collaboration and advocacy on relationships between education and WaSH” [
34].
This survey included questions to assess some of the six enabling environment domains for sustainability of WaSH in schools: financial capacity; accountability; technical feasibility and availability; community support; school leadership and management; and student engagement [
35]. In terms of school leadership and management, results indicated that a hygiene component in the school action plan was associated with at least on hygiene training program at the school. Additionally, a teachers association at the school was significantly related to presence of water and sanitation infrastructure, sanitation facility cleaning several times per week, and at least one hygiene training program at the school.
Results also indicated that teacher involvement in school water planning and maintenance was associated with the presence of a teacher association or a hygiene program at the school. While more evidence is necessary to identify the causal pathway of this relationship, the results could provide insight into how teacher involvement in WaSH in schools can be increased. For example, the presence of a teachers association can provide the organizational structure and peer support to establish a school water and sanitation management committee. Alternatively, hygiene training at the school can increase teacher awareness of the importance of water and sanitation maintenance and spur participation in such activities, and vice versa. The potential benefits that teachers, parents and community members can contribute to WaSH in schools, as well as the mechanisms of such contribution, should be studied further, both in Nicaragua and within other cultural contexts in other countries.
Inequalities in WaSH access persist between urban and rural regions and at sub-national levels which is consistent with studies in other countries on inequalities in access to WaSH, including those on water access in schools [
36,
37]. Water and sanitation systems in rural areas tended to be less functional than those in urban areas, also urban areas had better access to WaSH operations and maintenance [
38,
39]. There are several possible reasons for low coverage and inequalities in coverage. These include insufficient funds and/or inadequate allocation of school budget to provide WaSH in schools, insufficient funds for operations and maintenance and the difficulty of maintenance technicians to reach low density rural schools. Future studies and monitoring efforts might explore the relationship between sustainability factors and the role of the enabling environment in maintaining sustainability [
40].
4.1. Priorities for Monitoring
This survey was intended to gather baseline information on WaSH at the school level, as there was a lack of systematic and standardized data reporting from schools to regional and national governments. Because of the lack of a system of monitoring and surveillance, the government and donors may not have been aware of the low WaSH coverage and urban-rural disparity in the access and quality of WaSH in schools in these regions that the survey revealed.
One example of a lack of data was that schools did not regularly (i.e., at fixed time intervals) nor frequently report student attendance to municipal MINED offices. Thus, the survey requested that school principals estimate monthly student absences due to health. As most schools did not keep records on absence rates, the estimates might have been inaccurate. While we found a significant statistical relationship between prolonged student absences from school that lacked water infrastructure, we did not report these findings due to the unreliability of the variable. A future study with more accurate tracking of reasons for school absences may assist in determining the validity and strength of a relationship between WaSH in schools and student absences.
Two key issues of survey design emerged from our analysis: question validity and questions with the potential for response bias. Validity is the degree to which the question measures what it claims to measure, while response bias can occur in self-reported surveys due to participants’ beliefs and motivations which may produce inaccurate or untruthful responses. This survey included questions that were important to assess WaSH in schools, but were not summarized in this article due to these issues of reliability. In addition to student absences, excluded variables included one on water quality, one on community involvement, and two on student and teacher hand washing habits.
For example, survey results showed that 82% of school directors reported that students had a habit of washing hands while at school at least once per day. However, this is not likely indicative of actual hand washing rates, since self-report of hand washing behavior has been shown to be biased and consistently produce much higher rates than those reported from observed behavior [
29]. Alternatively, directly observing hand washing behavior can be intrusive, expensive, and has potential for observation bias [
29]. In response to these issues, studies have pointed to the need for the use of “leading indicators”, that are less susceptible to response bias, when monitoring WaSH in schools [
29,
34].
Additionally, this survey asked school directors to take a water sample and describe its physical characteristics (e.g., smell, color, and particulates). However, these are considered invalidated measures of microbial water quality. Instead, microbial water tests by trained individuals at random samples of schools could provide more accurate information on water quality. This survey indicated that very few schools had water quality tested by government officials. Increased resources or alternative actors for water quality monitoring should be considered.
While conducting a census of schools was ambitious, areas with low response rates might not have been accurately represented by the survey data. Future studies might use a random sample of schools and send enumerators to the school sites to spot check and validate WaSH conditions reported by questionnaires. One option could be to deploy “rapid surveys”, with fewer questions and a smaller sample size, as an alternative to long-format surveys and can be used to study a specific research question in a smaller geographic area. Studies might also use mobile devices as monitoring instruments to collect geospatial data points. With geolocation, monitoring data can be linked to other data sets to provide additional covariates for analysis which will provide further value and more robust analyses.
Monitoring allows the national government and donors to conduct program evaluation, planning, policy development and assess regulatory compliance [
2]. Results of analysis of monitoring data can be used for advocacy to appropriately allocate a country’s resources and leverage the resources of donors and partners. A possible solution would be the widespread use of an educational management information system [
18]. This system should incorporate standardized, robust indicators [
2].
This study demonstrates the value from evaluation of monitoring data. First, we were able to obtain more value from monitoring data by using statistical tools to evaluate the data and identify significant findings for use by policy makers and practitioners. Second, it allowed us to understand impact and identify specific ways in which to improve performance. Third, evaluation of the monitoring data enabled us to derive learnings by identifying problems to drive further improvement in data collection. Though this survey was carried out in Nicaragua, the lessons learned on monitoring methodology can apply to data collection efforts in different regions around the world.
4.2. Limitations
The original survey had a number of limitations. Self-reported surveys may suffer from reporting bias. Respondents may have reported a better WaSH status to give a favorable impression or reported worse conditions to attract resources for their school. The survey would have benefited from random spot check visitations by survey personnel. The survey instrument was pre-tested, with municipal representatives from educational agencies, rather than with school principals. There were cases where answers to certain questions contradicted answers of other questions, indicating a lack of understanding of all questions or low quality of data entry.
Not all the questions were answered by all respondents. Not all of the survey questions aligned identically with internationally used indicators such as the improved/unimproved water source classification. There is a potential for non-response bias, as the response rate for the survey was 43%. The absence of disaggregated socio-economic, demographic, and geographic data for all 1229 schools that received the survey, prevented analysis to indicate whether the responding schools were representative of the entire school population. WaSH coverage may in fact be lower as harder-to-reach schools may not have responded. The lack of reliability and validity of certain questions, such as student absence rates due to illness, provided unusable data, and thus conclusions and recommendations for those subjects couldn’t be made.
Despite its limitations, this study is one of the first sources of data revealing the status of WaSH in schools in disadvantaged regions of Nicaragua and one of the first sub-national studies on the status of WaSH in schools in the published literature. The study fills a major information gap, providing a preliminary baseline for more frequent monitoring.


 ,
, 

