Article

Social Determinants of Health-Related Quality of Life among Residents in Zhejiang and Qinghai, China

1
Center for Health Policy Studies, Department of Social Medicine, School of Public Health, Zhejiang University School of Medicine, 866 Yuhangtang Road, Hangzhou 310058, China
2
Medical College, Hangzhou Normal University, Hangzhou 310058, China
3
The Johns Hopkins Bloomberg School of Public Health, Baltimore, MD 21218, USA
*
Author to whom correspondence should be addressed.
Int. J. Environ. Res. Public Health 2019, 16(8), 1314; https://doi.org/10.3390/ijerph16081314
Submission received: 2 March 2019 / Revised: 6 April 2019 / Accepted: 10 April 2019 / Published: 12 April 2019

Abstract

:
Social determinants are closely related to health and play a significant role in shaping the quality of life of a population. This study aimed to explore the differences in HRQoL (health-related quality of life) scores of residents in the eastern province of Zhejiang and the western province of Qinghai and probe factors affecting the HRQoL among the two populations. A sample of 4210 residents from a cross-sectional survey was included in the analysis. The EQ-5D-3L instrument was used to measure the HRQoL of residents. A Chi-square test and a t-test were used to examine the differences between different variables and analysis of variance (ANOVA) with interaction effects was used to analyze factors associated with the HRQoL between the two provinces. Residents’ EQ-5D index score (EQ VAS score) was 0.963 (82.71) and 0.962 (81.51), respectively, in Zhejiang and Qinghai. Generally, residents in Qinghai displayed significantly worse HRQoL scores than those in Zhejiang. The differences between the two regions lay on mobility, pain/discomfort, and anxiety/depressions. In both regions, an increased education level and being employed were most strongly associated with a positive HRQoL; increased age and presence of chronic diseases were most strongly associated with a negative HRQoL. When formulating health policies, the significant health disparities between western and eastern provinces must be given greater consideration. The health of vulnerable groups should be particularly focused on to improve the observed health disparities.

1. Introduction

Disparities in population health exist not only between countries, but also within a country [1]. Several social determinants, such as economic stability, education, social context, and health care, are closely related to health. Several studies have reported regional differences as an important factor related to health status and showed that inequalities in health status exist between different regions and areas [2].
As the world continues to experience an epidemiologic transition from an infectious disease burden to a more chronic disease burden, health-related quality of life (HRQoL) is gaining increased traction in fields of population health measurements [3,4,5]. With the development of social economies and the improvement of living standards, peoples’ concepts of health are changing continuously. Indeed, the World Health Organization (WHO) in 1948 went to the extent of defining health as, “a state of complete physical, mental and social well-being and not merely the absence of disease or infirmity” [6]. As a result, the measurement of health status has been a field of constant evolution. Indeed, such variables are reflected by the WHO’s definition of quality of life as “an individual’s perception of the state of life in the context of the culture and value systems in which they live” [7]. With these changing norms of quality of life, concepts, such as HRQoL, have materialized. HRQoL was defined as including five domains: Death and duration of life, impairment, health perceptions, opportunity (capacity for health), and functional status [8]. It includes physical and mental health perceptions (e.g., energy level, mood) and their correlates—including health risks and conditions, functional status, social support, and socioeconomic status. It reveals aspects of physical, mental, social, and emotional health. HRQoL can more closely reflect the subjective aspects of quality of life than measures, such as life expectancy. This study focused on the EuroQol five-dimensional (EQ-5D) scale, a standardized HRQOL questionnaire developed by the EuroQol Group to provide a simple, convenient, and generic measure of health for clinical and economic appraisal.
The social determinants of health are the conditions in which people are born, grow, live, work, and age. These circumstances are shaped by the distribution of money, power, and resources at global, national, and local levels. The social determinants of health are mostly responsible for health inequities—the unfair and avoidable differences in health status seen within and between countries [9]. Different social determinants of health play a significant role in shaping the quality of life of a population. However, importantly, the impact of many of these social determinants of health on quality of life may be directly influenced by aspects of the certain region or province people are residing in. For example, regions with strong social or economic support systems (as a result of greater political or economic capital) may work to mitigate the effect of factors, such as age or socio-economic status, on quality of life (as compared to regions without this safety net in which these determinants may have a greater role in influencing quality of life). China, with the world’s largest population, has various regional differences in standards of living, culture, and customs. Given the previously established links between certain health and social determinants, such as regional economy, culture, social environments, customs, socioeconomic status, living conditions, and behavior [10,11,12,13,14,15], the differences in these various social characteristics between different provinces in China can likewise be expected to have an influence on population health and quality of life between the two provinces.
Two examples of Chinese provinces with stark differences in various social and economic sectors are the provinces of Zhejiang and Qinghai. Zhejiang is an easterly province located on the southeast coast of China while Qinghai is a westerly province located in the northwest. Both provinces display stark differences in population density, culture, economic status, and social infrastructure. Zhejiang and Qinghai have a total population of 55.9 million and 5.93 million, respectively. Per capita gross domestic product (GDP) in Zhejiang was 84,528 RMB while in Qinghai it was 43,380 RMB [16]. Since these are two different geographic provinces in China with differing structural features, residents are very likely to have different HRQoL scores and, importantly, different influencing social factors need to be identified in different regions for better interventions for a better quality of life. To the best of our knowledge, no study had compared the HRQoL of ordinary people between an eastern and western province in China specifically [17,18,19,20,21].
This study aimed to take Zhejiang and Qinghai as two cases to compare the HRQoL status of ordinary people between two regions, and to explore factors associated with HRQoL in these two respective regions. Based on the literature, we hypothesize that there is a significant difference between the two provinces and that certain social determinants will indeed show differing levels of influence between Zhejiang and Qinghai due to the systematic structural, social, and cultural differences between these provinces. By identifying the social determinants that are more associated with HRQoL in one province over the other, we are seeking to provide insights into more targeted interventions to improve the quality of life in different regions in China.

2. Materials and Methods

2.1. Study Sample

Our study sample was derived from a health service household survey of residents in Zhejiang and Qinghai. A multi-stage stratified cluster random sampling method was used to obtain 4901 participants during 2016 and 2017.
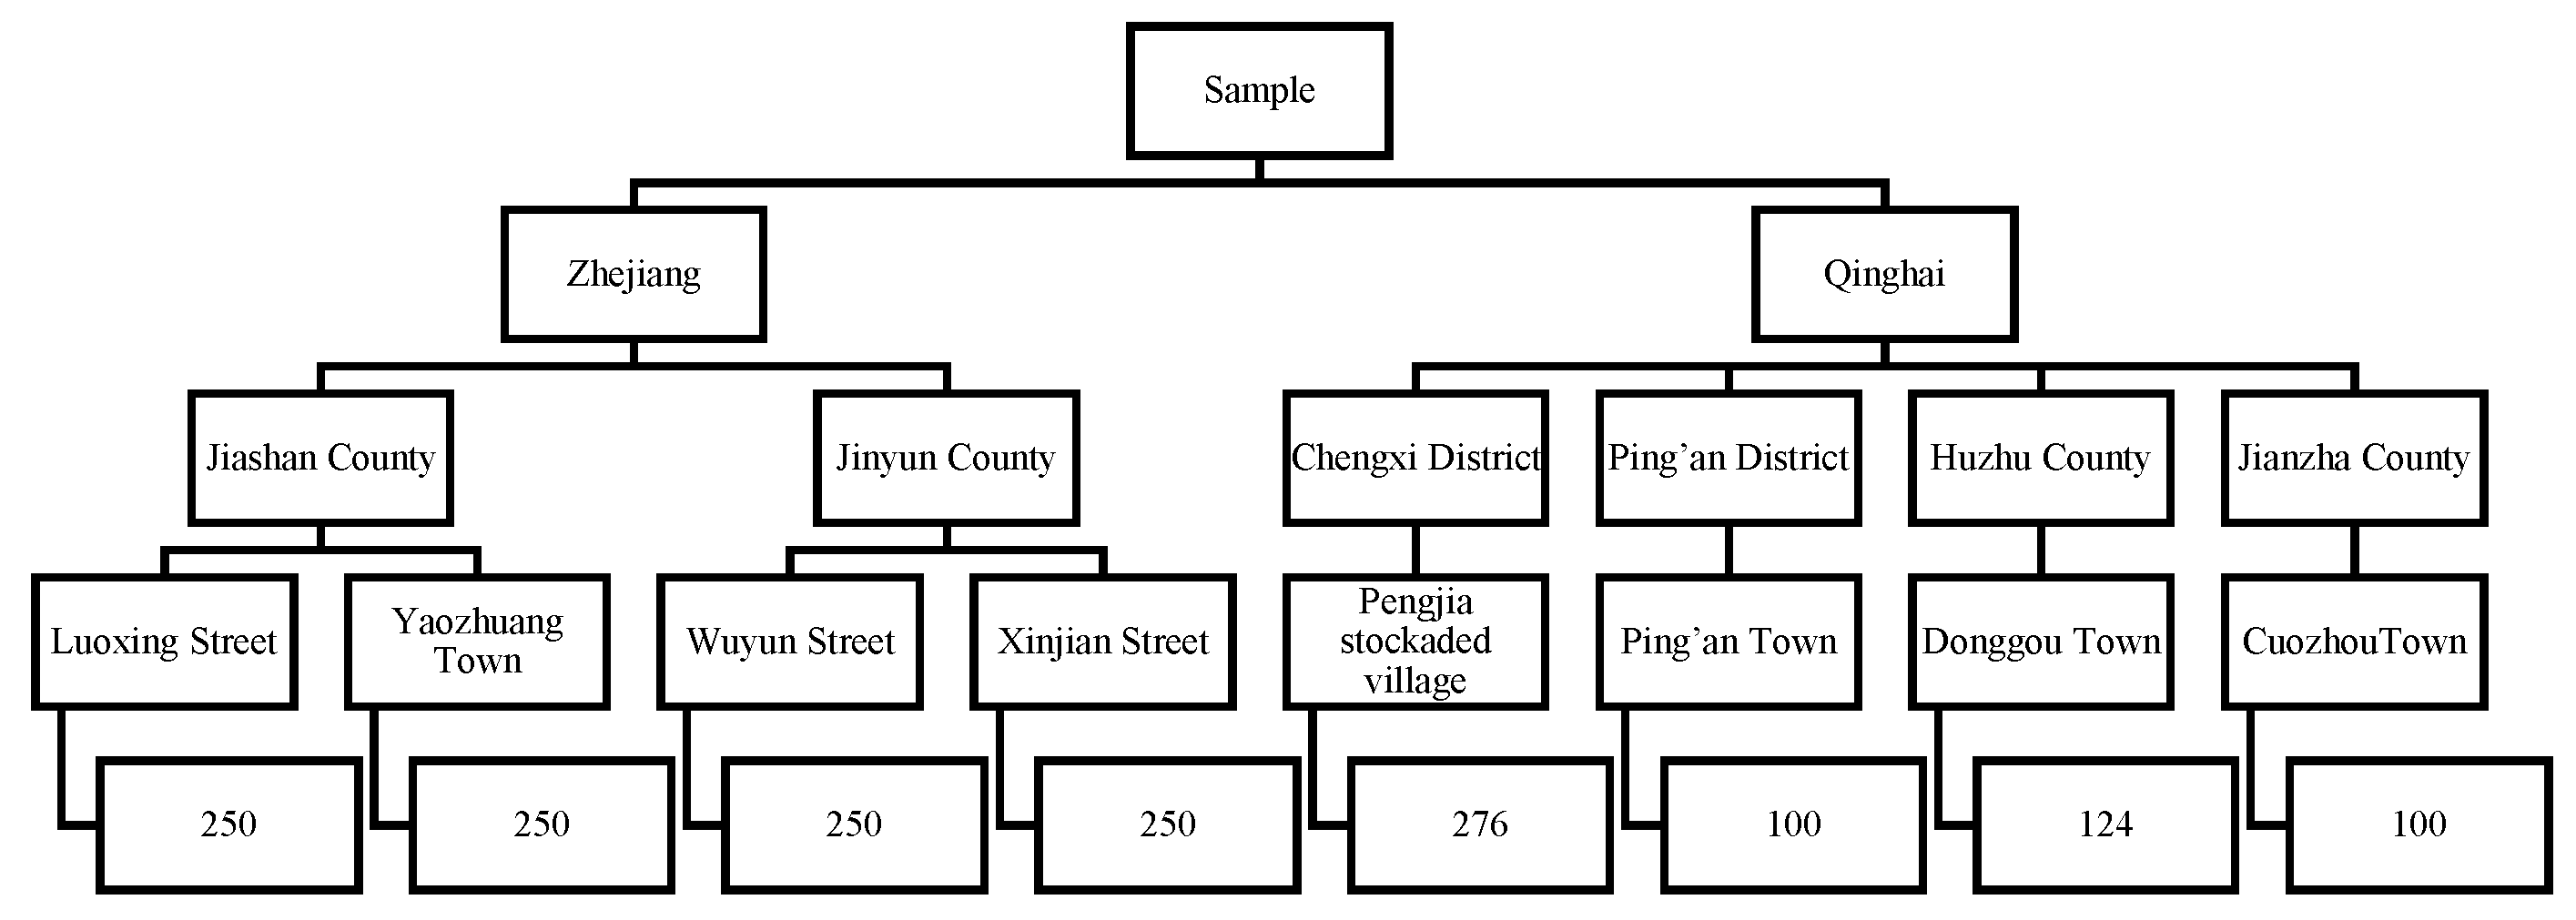
The sample was derived from the resident population in the region, including the residents living in the region for the past six months and migrant populations living in the region for more than half of each year. All ages were considered in the study sample. Multi-stage stratified cluster random sampling was used to select samples. First, Zhejiang and Qinghai were selected from half of the wealthiest and least wealthy provinces, respectively. Second, for both Zhejiang and Qinghai, counties were divided into two groups based on per capita wealth. In Zhejiang, one county was selected from each of the subgroups: Jiashan County (higher per capita wealth) and Jinyun County (lower per capita wealth). In Qinghai, due to the low per-county population density, two counties were selected from each of the subgroups: Chengxi district, Ping’an district (higher per capita wealth) and Huzhu county, Jianzha county (lower per capita wealth). Next, for each county, a town was randomly selected from an urban area and a street or town was randomly selected from a rural area. Finally, a sample of households was taken from each town/street. For this study, the characteristics of individual household residents from this household population were analyzed. A diagram of the described sampling method with the sample size is displayed in Figure 1.

2.2. Data Collection

Face-to-face interviews were conducted by trained investigators who used the health service household questionnaire in the survey. The questionnaire included individual socioeconomic status, demographic characteristics, residents’ health status (EQ-5D), and utilization of health services. Each questionnaire included a section of the standard EQ-5D-3L survey. The investigators were trained as a group on uniform standards and passed the coincidence examination. According to the requirements of the EQ-5D scale with regard to practical applications, residents were required to be 15 years of age or older and answer the questions by themselves [22]. The investigators were local personnel chosen by health-affiliated departments, such as the local health commission and the local center for disease control and prevention. After obtaining informed consent, all members of a household were interviewed in their homes individually. They were told to answer truthfully and that there was no right or wrong answer. Quality control was performed by the professors and students of Zhejiang University. Ethical approval was obtained from the institutional review board of Zhejiang University School of Medicine (2015022). Participant data remained anonymous throughout the research process.
This study only used the general household, individual variables, and the EQ-5D information. This information included (1) household’s data: Household income; (2) individual demographic and socioeconomic data: Age, sex, marital status, ethnic group, residence, basic insurance, the status of chronic diseases, education level, and occupational status; (3) individual self-reported health status based on the EQ-5D descriptive system and visual analogue scale (VAS).

2.3. HRQoL Evaluation Instrument

The 3-level version of EQ-5D was introduced in 1990 by the EuroQol Group. It essentially consists of 2 parts: The EQ-5D descriptive system and the EQ visual analogue scale (EQ VAS). Value sets were generated using the time trade-off (TTO) valuation technique.

2.3.1. EQ-5D-3L Descriptive System

The EQ-5D-3L descriptive system comprises the following five dimensions: Mobility, self-care, usual activities, pain/discomfort, and anxiety/depression. Each dimension has 3 levels: No problems, some problems, and extreme problems. The patient is asked to indicate his/her health state by ticking the box next to the most appropriate statement in each of the five dimensions. This decision results in a 1-digit number that expresses the level selected for that dimension. The digits for the five dimensions can be combined into a 5-digit number that describes the patient’s health state. The digits for the five dimensions can be combined into a 5-digit number that describes the patient’s health state. Based on the calculation using the Chinese EQ-5D scale utility value integral system, the EQ-5D index score ranges from −0.149 to 1.00.

2.3.2. EQ VAS

The EQ VAS records the residents’ self-rated health on a vertical visual analogue scale where the endpoints are labelled ‘best imaginable health state’—100 and ‘worst imaginable health state’—0. The VAS can be used as a quantitative measure of health outcome that reflects the patient’s own judgement.

2.4. Analysis Methods

In the survey, the residents interviewed were in all age groups. Due to the requirement of participants being aged 15 years or older and providing responses to the EQ-5D section by themselves, a sample of 4231 was included. Data was further excluded if there were missing values for sex, age, ethnic group, residence, marital status, education level, employment, household income, health insurance, and chronic diseases, or the 5 dimensions of the EQ-5D or EQ VAS score. After the process of data cleaning, the effective sample size was 4210. Among them, 2530 were from Zhejiang and 1680 were from Qinghai. All data was corroborated using EpiData version 3.1 (The EpiData Association, Odense, Denmark), and then analyzed with R version 3.4.3 (R Foundation for Statistical Computing, Vienna, Austria). The significance level was p < 0.05.

2.4.1. EQ-5D Calculation

The EQ-5D health utility value was calculated using the Chinese EQ-5D scale utility value integration system. The utility value integration system is shown in Table 1. C is a constant term, and MO2, SC2, UA2, PD2, and AD2 indicate that if mobility, self-care ability, daily activity, pain/discomfort, and anxiety/depression are at level 2, the value, 1, is assumed, and the other level is 0; MO3, SC3, UA3, PD3, and AD3 indicate that the above dimensions are 1 when at level 3 and 0 at others; N3 indicates that at least 1 of the 5 dimensions is 1 when at level 3. According to the results of Table 1, the utility values of all 243 health states can be calculated. The answers to the EQ-5D-3L questionnaire in this survey were converted into a utility index score through this Chinese general population-based EQ-5D-3L social value set. Details of the calculation were described previously [23]. The higher the EQ-5D index score and EQ VAS score, the better is the respondent’s HRQoL.

2.4.2. Analysis of Influencing Factors of HRQoL

The differences between different variables, including demographic variables and the five dimensions of the EQ-5D health status, in Zhejiang and Qinghai were evaluated using the Chi-square test. For continuous variables, a t-test was conducted. Considering the significantly different sociodemographic characteristics in the two regions, an analysis of variance (ANOVA) with interaction effects and simple effects tests were used to analyze the influencing factors. Also, a procedure for alpha adjustment using Bonferroni’s procedure was performed. In measuring HRQoL, an individual’s subjective health feelings may be more reflective of an individual’s health level. Also, considering that there is no difference in the EQ-5D index score between Zhejiang and Qinghai, we focused on the influencing factors of the EQ VAS score. The results of the initial ANOVA model were used to determine statistically significant interaction terms of the province and sociodemographic variables, which were then the focus of a further pairwise comparison analysis.
We chose the variables based on the conducted literature review. Independent variables in the model include sex, age, ethnic group, residence, marital status, education level, occupation, income, basic health insurance, and conditions of chronic diseases. The variable coding can be seen in Table 2. As for income groups, residents were ranked from lowest to highest by their annual income and divided into five groups of equal size: The lowest income group had an income level below 5000 RMB; the second group from 5001 to 10,000 RMB; the third group from 10,001 to 20,000 RMB; the fourth group from 20,001 to 32,000 RMB; and the fifth and highest income group 32,001 from RMB and above.

3. Results

3.1. Demographic Characteristics of the Sample

The characteristics of the study sample are summarized in Table 2. In the sample, there were 2088 males (49.6%) and 2122 females (50.4%) in total. The mean age was 46.08 (±17.455). Of the residents, 88.6% were Han and the rest were other ethnic groups, including Tu, Tujia, Tibetan, Hui, Miao, etc. Among them, almost half lived in rural areas and half lived in urban areas. With respect to marital status, 3180 (75.5%) of them were married, 726 (17.2%) of them were never married, and 304 (7.2%) of them were divorced or widowed. Per capita household income was calculated and divided into five groups, with most people being categorized in the middle groupings. With regards to educational status, most people obtained a highest education level of junior middle school, followed by primary school, and individuals with college and above levels only accounting for 8.6% of the study population. Among them, worker/clerk and farmer accounted for more than half (57.2%) of the total population. In terms of basic health insurance, 97.9% residents enrolled in the basic health insurance. Of the residents, 15.3% had chronic diseases (Table 2). Overall, residents in Zhejiang and Qinghai have significant differences in age, ethnic group, residence, marital status, per capita household income, education, employment, and conditions of chronic diseases.

3.2. Health Profiles and EQ VAS Score

In terms of the EQ-5D index score and EQ VAS score, there was a significant difference in the EQ VAS score, but this difference was not found in the EQ-5D single summary index (Table 3). In other words, residents in Zhejiang and Qinghai indeed displayed differences in health status, but more through a patient’s own assessment of health status rather than the general population health.
Furthermore, although there was no difference in the overall EQ-5D index score, there were still differences in the five dimensions of health. Table 3 also shows the horizontal components of each dimension and compares the differences between Zhejiang and Qinghai. It can be seen that residents in Qinghai have a higher proportion of moderate/severe problems than residents in Zhejiang in terms of mobility and anxiety/depression. In pain/discomfort, people in Qinghai had more severe problems, and people in Zhejiang had more moderate problems. According to the results of the Chi-square test, the differences in the composition of the above three components between residents in Zhejiang and Qinghai were statistically significant.
With regards to the difference of the EQ VAS score between the two regions, the EQ VAS score by sociodemographic variables were reported (Table 4). The mean EQ-VAS scores were 82.71 (13.05) for residents in Zhejiang and 81.51 (13.92) for residents in Qinghai overall, indicating that the HRQOL of residents in Zhejiang was better than that of Qinghai (p < 0.01). Moreover, in most subgroup analyses (only the variables with statistical significance are displayed), the EQ-VAS scores of residents in Zhejiang were higher than those of residents in Qinghai with statistically significant differences. Only residents in Zhejiang who earned more than 20,001 Yuan annually (p < 0.05) had lower EQ-VAS scores compared with the residents in Qinghai in that category (Table 4).

3.3. Factors Influencing HRQoL

The results of the analysis of variance (ANOVA) with interaction effects model created are summarized in Table 5. Looking at the socio-demographic variables across the total study population, an increase in education level was strongly associated with an improved EQ VAS score. Being employed was significantly associated with a higher EQ VAS score compared with those unemployed. Residents living in rural areas had a better health status than those in urban areas. Residents who were covered by basic insurance had a worse health status than those who were not. Aging and having chronic diseases were significantly negatively associated with health status in the two regions. As age increased, people’s health status grew worse.
Of the nine interaction terms (between the binary province variable and the socio-demographic variables) included in the model displayed in Table 5, only three interaction variables were statistically significant and selected for further analysis: Province × ethnic group, province × marital status, and province × income. With these significant interaction terms, pairwise comparisons were conducted both between different levels within each socio-demographic variable in each respective province (Table 6) and the value of each level within each socio-demographic variable between the two provinces (Table 7).
In Zhejiang, we found that residents who were not of Han ethnicity or divorced/widowed had significantly lower EQ VAS scores. Among the residents in Qinghai, having a higher income was significantly associated with higher EQ-VAS scores (Table 6). When compared by province, people who were divorced/widowed, had a household income between 20,001 and 32,000 yuan per year, or a household income higher than 32,000 yuan per year had significantly lower EQ VAS scores in Zhejiang than in Qinghai (Table 7).

4. Discussion

With continuous improvements in life expectancy, the examination of other indicators, such as HRQoL, of residents in China is being explored by health-related researchers. Health disparities widely exist among different regions in China [24].
In this study, we examined and compared the HRQoL measured by the EQ-5D 3L questionnaire and explored factors influencing discrepancies in quality of life in Zhejiang and Qinghai. The results provide useful policy suggestions to the regional population health in China. Although it was found that the trend in the EQ VAS scores showed statistically significant relationships, no significance in the EQ-5D index scores was found. As expected, the health status of residents in Zhejiang was better than in Qinghai.
From the results of the study, among the five dimensions in residents in Zhejiang and Qinghai, the most prevalent problems are pain/discomfort and anxiety/depression, and these results are aligned with the results of the Fifth National Health Service Survey in China and other research results in China, but are significantly lower than that in the United States, Britain, or Australia, which may be related to the different levels of economic development in the different countries. Moreover, after comparing the two regions, we found that the proportion of residents in Qinghai who have self-reported problems in the dimensions of mobility and anxiety/depression are significantly higher than that of residents in Zhejiang. In terms of pain/discomfort, residents of both populations display a need for future targeted interventions; in Zhejiang, there are more residents with moderate problems, but fewer residents with severe problems in Zhejiang, which may indicate that residents with moderate problems may become more severe later in Zhejiang, while the Qinghai population displayed a higher proportion of severe problems. Anxiety/depression reflects problems in the areas of psychology, and residents in Qinghai displayed more severe psychological problems than residents in Zhejiang.
The mean EQ VAS score of residents in Zhejiang was significantly higher than residents in Qinghai. The mean of the EQ-5D score of residents in Qinghai was lower than residents in Zhejiang (albeit without statistical significance). These results indicate that the HRQoL of residents in Zhejiang is better than that of residents in Qinghai. These findings can be explained by the fact that Qinghai and Zhejiang have a significant difference in socioeconomic development, which has a large correlation with respondents’ health status. Indeed, these results shed crucial light onto why residents in Zhejiang display metrics of significantly higher quality of life than those in Qinghai.
According to the results of the analysis of variance (ANOVA) with interaction effects and pairwise comparisons of simple effects, there is a significant positive correlation between socioeconomic status and HRQoL in these two areas. The higher the income level, the higher the level of education, and the more employed, the better the HRQoL. Thus, this study suggests the need for further development of public policies that are conducive to the poor, narrowing the poverty gap, and at the same time raising the overall level of national education. Age is also one of the important factors affecting HRQoL. The health of people over the age of 15 was shown to gradually decline with increases in age, which is consistent with the expected assumption. Basic health insurance policies for residents should continue to be given more attention because of the possible impact on the health status of residents. Notably, the condition of chronic diseases of residents always has an impact on residents’ health status. This indicates that the status of physical health is still a notable problem and residents need to pay attention to individual health behaviors, such as drinking, smoking, physical activity, and diet. Specifically, in Zhejiang, we found that residents who were not of the Han ethnic group, and were divorced or widowed had significantly lower EQ VAS scores. The health status of the majority Han ethnic group was better than minority groups, indicating that minorities are in a relatively disadvantaged state of health in Zhejiang. Among residents in Qinghai, having a higher income was significantly associated with higher EQ-VAS scores, which indicates policies should still focus on improving the economic level and income in Qinghai. When compared by province, residents in Zhejiang who were divorced or widowed had significantly lower EQ VAS scores than residents in Qinghai. Residents with a higher income had lower EQ VAS scores in Zhejiang than Qinghai, which indicates that measures taken to improve household income levels may help to improve the quality of life among residents in Qinghai to a greater extent than residents in Zhejiang. Compared to other similar studies, several factors were also found to be significant social determinants of quality of life in other jurisdictions and sub populations. A study conducted in Iran showed that determinants of HRQoL included monthly household income, post-secondary education, age, marriage status, and having chronic diseases [25]. A study conducted in China using a short form 36 health survey questionnaire (SF-36) questionnaire to evaluate HRQoL in the general population showed that risk factors included aging, past history of chronic disease, occupations, such as farming and being a student, and gender, while protective factors included marriage and higher education [26]. However, in this study, it must be noted that the EQ VAS score is a relatively subjective evaluation indicator for health status and the difference in health in practical terms is still worthy of further investigation.
These results have some important implications for population health in China. First, not only physical health, but also mental health should be noted, especially in the western area. Also, different places have different health profiles and a different proportion of risk factors, which should be treated in corresponding ways.
There are also some key limitations of this study. First, as a cross-sectional study, it is difficult to establish correlational or causational relationships due to the weak strength of the data in comparison with longitudinal formats. Second, when compared by different regions, we should consider that the EQ-5D value may have a ceiling effect and the definition of the top and bottom anchors on the EQ VAS is vague [27].
In addition, the results of HRQoL in our study were similar to former studies conducted in China, supporting the consistency of our data [2,17,18,20,21]. From a global context, much of the HRQoL results were observed to be higher or lower depending on the socio-demographic variables compared to studies conducted in settings, such as the U.S., Europe, and Vietnam [28,29,30]. However, as noted, making inter-country comparisons is an area that needs to be further investigated given the high levels of subjectivity associated with the HRQoL measure. Since the EQ-5D instrument is a self-perceived health status measure, it may vary among people not only by their actual health status, but also by different cultural backgrounds, by the expectations of their health status, and by the education level of the population. Therefore, people with different nationalities and cultural backgrounds with the same health status may still give their health status a different rating [31].

5. Conclusions

The HRQoL of residents in Zhejiang was better than that of residents in Qinghai. Residents in Qinghai had a higher proportion of health problems than residents in Zhejiang in terms of mobility and anxiety/depression. The main common factors affecting HRQoL include age, residence, occupation, education, and the condition of chronic diseases. To improve the HRQoL of residents, raising the education level and improving the quality and accessibility of health services are two important measures. Also, between different regions, slightly different interventions should be considered, for example, the improvement of income level is an independent positive factor influencing residents in Qinghai. In addition, apart from improving the accessibility of medical services, it is also important to strengthen interventions in psychological issues, especially in a western region, like Qinghai.

Author Contributions

Conceptualization, Y.G., H.Z., and H.D.; Methodology, Y.G. and H.D.; Formal analysis, Y.G. and H.D.; Investigation, Y.G., M.H., J.W., S.G., X.Z., X.H., X.S., H.Z., and H.D.; Data curation, Y.G., M.H., J.W., S.G., X.Z., X.H., X.S., and H.Z.; Writing—original draft preparation, Y.G.; Writing—review and editing, Y.G., H.D., and S.H.A.; Supervision, H.D.; Project administration, H.Z.; Funding acquisition, H.D.

Funding

This study was funded by the National Natural Science Foundation of China grant (grant number 71573229).

Acknowledgments

We thank the valuable help from health-related departments including local Disease Control Center and local Health Administration Department in Zhejiang province and Qinghai province in the data collection and quality control. We would also like to thank the anonymous reviewers, for their constructive comments and valuable suggestions.

Conflicts of Interest

The authors declare no conflict of interest. The funders had no role in the design of the study; in the collection, analyses, or interpretation of data; in the writing of the manuscript, or in the decision to publish the results.

References

  1. Tunstall, H.V.; Shaw, M.; Dorling, D. Places and health. J. Epidemiol. Community Health 2004, 58, 6–10. [Google Scholar] [CrossRef] [Green Version]
  2. Sun, S.; Chen, J.; Johannesson, M.; Kind, P.; Xu, L.; Zhang, Y.; Burstrom, K. Regional differences in health status in China: Population health-related quality of life results from the National Health Services Survey 2008. Health Place 2011, 17, 671–680. [Google Scholar] [CrossRef] [Green Version]
  3. Omran, A.R. The epidemiologic transition: A theory of the epidemiology of population change. Milbank Q. 2005, 83, 731–757. [Google Scholar] [CrossRef] [PubMed]
  4. Guyatt, G.H.; Feeny, D.H.; Patrick, D.L. Measuring health-related quality of life. Ann. Intern. Med. 1993, 118, 622–629. [Google Scholar] [CrossRef]
  5. Murray, C.J.; Salomon, J.A.; Mathers, C.D.; Lopez, A.D.; World Health Organization. Summary Measures of Population Health: Concepts, Ethics, Measurement and Applications; World Health Organization: Geneva, Switzerland, 2002; pp. 501–503. [Google Scholar]
  6. World Health Organization. Health is a state of complete physical, mental and social well-being and not merely the absence of disease or infirmity. In International Health Conference; World Health Organization: New York, NY, USA, 1946; pp. 19–22. [Google Scholar]
  7. The WHOQOL Group. The World Health Organization quality of life assessment (WHOQOL): Position paper from the World Health Organization. Soc. Sci. Med. 1995, 41, 1403–1409. [Google Scholar] [CrossRef] [Green Version]
  8. Patrick, D.; Erickson, P. Health Status and Health Policy: Quality of Life in Health Care Evaluation and Resource Allocation; Oxford University Press: New York, NY, USA, 1993. [Google Scholar]
  9. World Health Organization. About Social Determinants of Health. Available online: https://www.who.int/social_determinants/sdh_definition/en/ (accessed on 26 March 2019).
  10. Huong, N.T.; Ha, L.T.H.; Tien, T.Q. Determinants of health-related quality of life among elderly: Evidence from Chi Linh Town, Vietnam. Asia Pac. J. Public Health 2017, 29, 84S–93S. [Google Scholar] [CrossRef] [PubMed]
  11. Karyani, A.K.; Rashidian, A.; Sefiddashti, S.E.; Sari, A.A. Self-reported health-related quality of life (HRQoL) and factors affecting HRQoL among individuals with health insurance in Iran. Epidemiol. Health 2016, 38, e2016046. [Google Scholar] [CrossRef]
  12. Didarloo, A.; Alizadeh, M. Health-related quality of life and its determinants among women with diabetes mellitus: A cross-sectional analysis. Nurs. Midwifery Stud. 2016, 5, e28937. [Google Scholar]
  13. Pappa, E.; Chatzikonstantinidou, S.; Chalkiopoulos, G.; Papadopoulos, A.; Niakas, D. Health-related quality of life of the roma in greece: The role of socio-economic characteristics and housing conditions. Int. J. Environ. Res. Public Health 2015, 12, 6669. [Google Scholar] [CrossRef]
  14. Houben-van Herten, M.; Bai, G.; Hafkamp, E.; Landgraf, J.M.; Raat, H. Determinants of health-related quality of life in school-aged children: A general population study in the Netherlands. PLoS ONE 2015, 10, e0125083. [Google Scholar]
  15. Abdin, E.; Subramaniam, M.; Vaingankar, J.A.; Luo, N.; Chong, S.A. Measuring health-related quality of life among adults in Singapore: Population norms for the EQ-5D. Qual. Life Res. 2013, 22, 2983–2991. [Google Scholar] [CrossRef]
  16. National Bureau of Statistics of China. China Statistical Yearbook; China Statistics Press: Beijing, China, 2017.
  17. Rao, Y.; Xu, X.; Liu, D.; Reis, C.; Newman, I.M.; Qin, L.; Sharma, M.; Shen, J.; Zhao, Y. Health-Related Quality of Life in Patients with Arthritis: A Cross-Sectional Survey among Middle-Aged Adults in Chongqing, China. Int. J. Environ. Res. Public Health 2018, 15, 768. [Google Scholar] [CrossRef]
  18. Huang, W.; Yu, H.; Liu, C.; Liu, G.; Wu, Q.; Zhou, J.; Zhang, X.; Zhao, X.; Shi, L.; Xu, X. Assessing health-related quality of life of chinese adults in heilongjiang using EQ-5D-3L. Int. J. Environ. Res. Public Health 2017, 14, 224. [Google Scholar] [CrossRef]
  19. Hajian-Tilaki, K.; Heidari, B.; Hajian-Tilaki, A. Health related quality of life and its socio-demographic determinants among Iranian elderly people: A population based cross-sectional study. J. Caring Sci. 2017, 6, 39. [Google Scholar] [CrossRef]
  20. Sun, S.; Chen, J.; Kind, P.; Xu, L.; Zhang, Y.; Burström, K. Experience-based VAS values for EQ-5D-3L health states in a national general population health survey in China. Qual. Life Res. 2015, 24, 693–703. [Google Scholar] [CrossRef]
  21. Liu, X.; Duan, S.; Wu, Y.; Ye, C.; Wang, J.; Dong, H. Comparative Study on Health-Related Quality of Life of Farmers and Workers. Value Health 2014, 17, A755–A756. [Google Scholar] [CrossRef]
  22. Wang, H.; Kindig, D.A.; Mullahy, J. Variation in Chinese population health related quality of life: Results from a EuroQol study in Beijing, China. Qual. Life Res. 2005, 14, 119–132. [Google Scholar] [CrossRef]
  23. Liu, G.G.; Wu, H.; Li, M.; Gao, C.; Luo, N. Chinese time trade-off values for EQ-5D health states. Value Health 2014, 17, 597–604. [Google Scholar] [CrossRef]
  24. Sun, S.; Chn, J.; Johannesson, M.; Kind, P.; Xu, L.; Zhang, Y.; Burstrom, K. Population health status in China: EQ-5D results, by age, sex and socio-economic status, from the National Health Services Survey 2008. Qual. Life Res. 2011, 20, 309–320. [Google Scholar] [CrossRef]
  25. Rezaei, S.; Hajizadeh, M.; Kazemi, A.; Khosravipour, M.; Khosravi, F.; Rezaeian, S. Determinants of health-related quality of life in Iranian adults: Evidence from a cross-sectional study. Epidemiol. Health 2017, 39, e2017038. [Google Scholar] [CrossRef]
  26. Zhu, Y.; Wang, Q.; Chen, K.; Luo, X.; Tang, F. Predictors of health-related quality of life in the general population. Chin. J. Behav. Med. Brain Sci. 2009, 18, 254–259. [Google Scholar]
  27. Anderson, R.T.; Aaronson, N.; Leplege, A.; Wilkin, D. International Use and Application of Generic Health-Related Quality of Life Instruments. In Quality of Life and Pharmacoeconomics in Clinical Trials, 2nd ed.; Lippincott-Raven: Philadelphia, PA, USA, 1996; pp. 613–632. [Google Scholar]
  28. Nguyen, L.H.; Tran, B.X.; Le, Q.N.H.; Tran, T.T.; Latkin, C.A. Quality of life profile of general Vietnamese population using EQ-5D-5L. Health Qual. Life Outcomes 2017, 15, 199. [Google Scholar] [CrossRef] [Green Version]
  29. Vahidnia, F.; Stramer, S.L.; Kessler, D.; Shaz, B.; Leparc, G.; Krysztof, D.E.; Glynn, S.A.; Custer, B. Recent viral infection in US blood donors and health-related quality of life (HRQOL). Qual. Life Res. 2017, 26, 349–357. [Google Scholar] [CrossRef]
  30. Whynes, D.K. Correspondence between EQ-5D health state classifications and EQ VAS scores. Health Qual. Life Outcomes 2008, 6, 94. [Google Scholar] [CrossRef]
  31. Torrance, G.W.; Feeny, D.; Furlong, W. Visual Analog Scales: Do They have a Role in the Measurement of Preferences for Health States? SAGE Publications: Thousand Oaks, CA, USA, 2001. [Google Scholar]
Figure 1. Sampling and sample size.
Ijerph 16 01314 g001
Table 1. Chinese EuroQol five-dimensional (EQ-5D) scale utility value integral system.
CMO2MO3SC2SC3UA2UA3PD2PD3AD2AD3N3
0.0390.0990.2460.1050.2080.0740.1930.0920.2360.0860.2050.022
Table 2. Characteristics of the sample.
CharacteristicTotal (n = 4210)Zhejiang (n = 2530)Qinghai (n = 1680)p
Sex (%) 0.743
 Male2088 (49.6)1260 (49.8)828 (49.3)
 Female2122 (50.4)1270 (50.2)852 (50.7)
Age (Mean/SD)46.08 (17.46)47.98 (17.44)43.21 (17.08)
Age group (%) <0.001
 15–552 (13.1)250 (9.9)302 (18.0)
 25–635 (15.1)370 (14.6)265 (15.8)
 35–771 (18.3)461 (18.2)310 (18.5)
 45–967 (23.0)582 (23.0)385 (22.9)
 55–618 (14.7)401 (15.8)217 (12.9)
 65 or more667 (15.8)466 (18.4)201 (12.0)
Ethnic group (%) <0.001
 Han3732 (88.6)2493 (98.5)1239 (73.8)
 Others478 (11.4)37 (1.5)441 (26.3)
Residence (%) <0.001
 Rural2382 (56.6)1550 (61.3)832 (49.5)
 Urban1828 (43.4)980 (38.7)848 (50.5)
Marital status (%) <0.001
 Never married726 (17.2)342 (13.5)384 (22.9)
 Married3180 (75.5)2012 (79.5)1168 (69.5)
 Divorced or widowed304 (7.2)176 (7.0)128 (7.6)
Average household income (%) <0.001
 ≤5000955 (22.7)223 (8.8)732 (43.6)
 5001–814 (19.3)348 (13.8)466 (27.7)
 10,001–1007 (23.9)715 (28.3)292 (17.4)
 20,001–594 (14.1)496 (19.6)98 (5.8)
 >32,000840 (20.0)748 (29.6)92 (5.5)
Education (%) <0.001
 Below primary school466 (11.1)156 (6.2)310 (18.5)
 Primary school943 (22.4)649 (25.7)294 (17.5)
 Junior middle school1322 (31.4)810 (32.0)512 (30.5)
 Senior middle school728 (17.3)433 (17.1)295 (17.6)
 Junior College391 (9.3)239 (9.4)152 (9.0)
 College and above360 (8.6)243 (9.6)117 (7.0)
Employment status (%) <0.001
 Administrator and professional664 (15.8)471 (18.6)193 (11.5)
 Worker/Clerk1266 (30.1)892 (35.3)374 (22.3)
 Farmer1143 (27.1)503 (19.9)640 (38.1)
 Student301 (7.1)123 (4.9)178 (10.6)
 Unemployed or semi-employed601 (14.3)318 (12.6)283 (16.8)
 Other235 (5.6)223 (8.8)12 (0.7)
Basic health insurance (%) 0.394
 Yes4120 (97.9)2472 (97.7)1648 (98.1)
 No90 (2.1)58 (2.3)32 (1.9)
Chronic diseases (%) <0.001
 Yes645 (15.3)341 (13.5)304 (18.1)
 No3565 (84.7)2189 (86.5)1376 (81.9)
Table 3. Five dimensions of EQ-5D and visual analogue scale (VAS) score.
EQ-5D & VASZhejiang (n = 2530)Qinghai (n = 1680)p
Mobility (%) <0.05
 No problem2424 (95.8)1596 (95.0)
 Moderate problems100 (4.0)70 (4.2)
 Severe problems6 (0.2)14 (0.8)
Self-care (%) 0.179
 No problem2472 (97.7)1633 (97.2)
 Moderate problems49 (1.9)34 (2.0)
 Severe problems9 (0.4)13 (0.8)
Usual activities (%) 0.065
 No problem2428 (96.0)1605 (95.5)
 Moderate problems84 (3.3)51 (3.0)
 Severe problems18 (0.7)24 (1.4)
Pain/discomfort (%) <0.001
 No problem2163 (85.5)1529 (91.0)
 Moderate problems352 (13.9)127 (7.6)
 Severe problems15 (0.6)24 (1.4)
Anxiety/depressions (%) <0.05
 No problem2404 (95.0)1563 (93.0)
 Moderate problems118 (4.7)107 (6.4)
 Severe problems8 (0.3)10 (0.6)
EQ-5D index score (mean/SD)0.963 (0.104)0.962 (0.125)0.869
EQ VAS score (mean/SD)82.71 (13.05)81.51 (13.92)<0.01
Table 4. Health-related quality of life by sociodemographic variables.
VariablesZhejiangQinghaip
Sex (Mean/SD)
 Male83.21 (12.985)81.91 (13.223)<0.05
 Female82.23 (13.106)81.12 (14.557)0.067
Age group (Mean/SD)
 15–92.18 (9.607)88.89 (8.671)<0.001
 25–89.51 (8.284)87.08 (12.140)<0.01
 35–86.39 (9.709)83.18 (11.630)<0.001
 45–82.55 (11.303)80.56 (13.303)<0.05
 55–78.87 (11.779)75.30 (14.086)<0.01
 65 or more72.10 (15.052)69.03 (15.089)<0.05
Residence (Mean/SD)
 Rural82.81 (13.488)80.88 (14.056)<0.01
 Urban82.57 (12.339)82.13 (13.761)0.474
Marital status (Mean/SD)
 Never married90.68 (11.218)86.55 (12.272)<0.001
 Married82.25 (12.229)80.69 (13.612)<0.01
 Divorced or widowed72.51 (16.350)73.87 (16.195)0.474
Average household income (Mean/SD)
 ≤500079.10 (15.689)78.50 (15.406)0.608
 5001–83.21 (15.277)83.65 (11.859)0.647
 10,001–82.79 (13.414)83.17 (13.810)0.687
 20,001–82.62 (12.146)85.87 (7.767)<0.05
 >32,00083.55 (10.991)84.73 (11.752)0.336
Employment status (Mean/SD)
 Administrator and professional84.62 (10.484)83.86 (12.489)0.425
 Worker/Clerk84.72 (11.790)84.88 (11.922)0.824
 Farmer78.39 (13.836)78.27 (13.942)0.885
 Student92.24 (10.580)89.38 (8.508)<0.05
 Unemployed or semi-employed76.31 (15.369)78.16 (16.302)0.151
 Other84.30 (11.868)73.33 (17.233)<0.01
Basic health insurance (Mean/SD)
 Yes82.62 (13.055)81.37 (13.967)<0.01
 No86.72 (12.409)88.44 (8.747)0.491
Table 5. ANOVA on the influencing factors and interacting factors. Dependent variable: VAS Score.
SourceType III Sum of SquaresdfMean SquareFp Value
Corrected Model231,605.525534369.91634.530<0.001
Intercept1,008,209.79511,008,209.7957966.578<0.001
Province × Sex3.69813.6980.0290.864
Province × Age group512.1605102.4320.8090.543
Province × Ethnic group613.8411613.8414.850<0.05
Province × Residence155.7881155.7881.2310.267
Province × Marital status1808.8592904.4307.147<0.01
Province × Income2098.0804524.5204.145<0.01
Province × Education1318.7895263.7582.0840.064
Province × Occupation1271.4145254.2832.0090.074
Province × Basic insurance260.1731260.1732.0560.152
Province × Chronic diseases145.1161145.1161.1470.284
Province267.6851267.6852.1150.146
Sex9.18119.1810.0730.788
Age group30,361.42356072.28547.981<0.001
Ethnic group319.2361319.2362.5230.112
Residence556.2321556.2324.395<0.05
Marital status847.1112423.5563.347<0.05
Income1046.4084261.6022.0670.082
Education5660.31351132.0638.945<0.001
Occupation2361.3525472.2703.732<0.01
Basic insurance647.4971647.4975.116<0.05
Chronic diseases31,920.800131,920.800252.229<0.001
Error525,962.3524156126.555
Total29,226,556.0004210
Corrected Total757,567.8764209
R Squared = 0.306 (Adjusted R Squared = 0.297); A Bonferroni’s procedure was performed.
Table 6. Pairwise comparisons of interaction factors influencing the EQ VAS score (classified by province).
ProvincePairsMean DifferenceStd. Error95% CIp Value
Zhejiang
Ethnic groupOther-Han−3.7901.882(−7.480, −0.100)<0.05
Marital Status Not married-Married1.2150.998(−1.175, 3.605)0.670
Not married-Divorced or widowed4.9801.347(1.754, 8.205)<0.01
Married-Divorced or widowed3.7640.941(1.511, 6.018)<0.001
Income ≤5000-5,001–0.1750.986(−2.593, 2.943)1.000
≤5000-10,001–0.9180.906(−1.627, 3.463)1.000
≤5000-20,001–0.8580.962(−1.845, 3.561)1.000
≤5000->32,0001.5630.985(−1.202, 4.329)1.000
5001–-10,001–0.7430.748(−1.357, 2.842)1.000
5001–-20,001–0.6830.811(−1.596, 2.961)1.000
5001–->32,0001.3880.818(−0.910, 3.686)0.900
10,001-20,001–−0.0600.666(−1.930, 1.811)1.000
10,001->32,0000.6450.654(−1.191, 2.482)1.000
20,001->32,0000.7050.692(−1.237, 2.648)1.000
Qinghai
Ethnic groupOther-Han0.6140.675(−0.710, 1.938)0.363
Marital StatusNot married-Married−2.4181.019(−4.858, 0.022)0.053
Not married-Divorced or widowed−2.5531.469(−6.071, 0.964)0.246
Married-Divorced or widowed−0.1361.118(−2.813, 2.542)1.000
Income≤5000-5001–−3.0170.750(−5.215, −1.000)<0.001
≤5000-10,001–−2.4430.893(−4.951, 0.065)0.063
≤5000-20,001–−4.7131.354(8.514, −0.911)<0.01
≤5000->32,000−4.3731.394(−8.288, −0.458)<0.05
5001–-10,001–0.6640.861(−1.754, 3.083)1.000
5001–-20,001–−1.6061.322(−5.319, 2.107)1.000
5001–->32,000−1.2661.364(−5.098, 2.566)1.000
10,001-20,001–−2.2701.346(−6.051, 1.511)0.919
10,001->32,000−1.9301.384(−5.816, 1.956)1.000
20,001->32,0000.3401.645(−4.280, 4.960)1.000
Table 7. Pairwise comparisons of interaction factors influencing the EQ VAS score (compared by province).
Independent VariablesMean Difference (Zhejiang-Qinghai)Std. Error95% CIp Value
Ethnic group
 Other−4.7872.452(−9.595, 0.021)0.051
 Han−0.3831.517(−3.357, 2.592)0.801
Marital status
 Not married1.1372.037(−2.856, 5.130)0.577
 Married−2.4961.803(−6.031, 1.039)0.166
 Divorced or widowed−6.3962.188(−10.686, −2.105)<0.01
Income
 ≤50001.0461.938(−2.755, 4.846)0.590
 5001–−2.2371.927(−6.015, 1.541)0.246
 10,001–−2.3161.931(−6.101, 1.470)0.231
 20,001–−4.5252.136(−8.714, −0.337)<0.05
 >32,000−4.8912.144(−9.094, −0.687)<0.05

