Evaluation of Vitamin D Fractions in Obese Hypertensive Patients

 , ,
, ,
Abstract
:1. Introduction
2. Materials and Methods
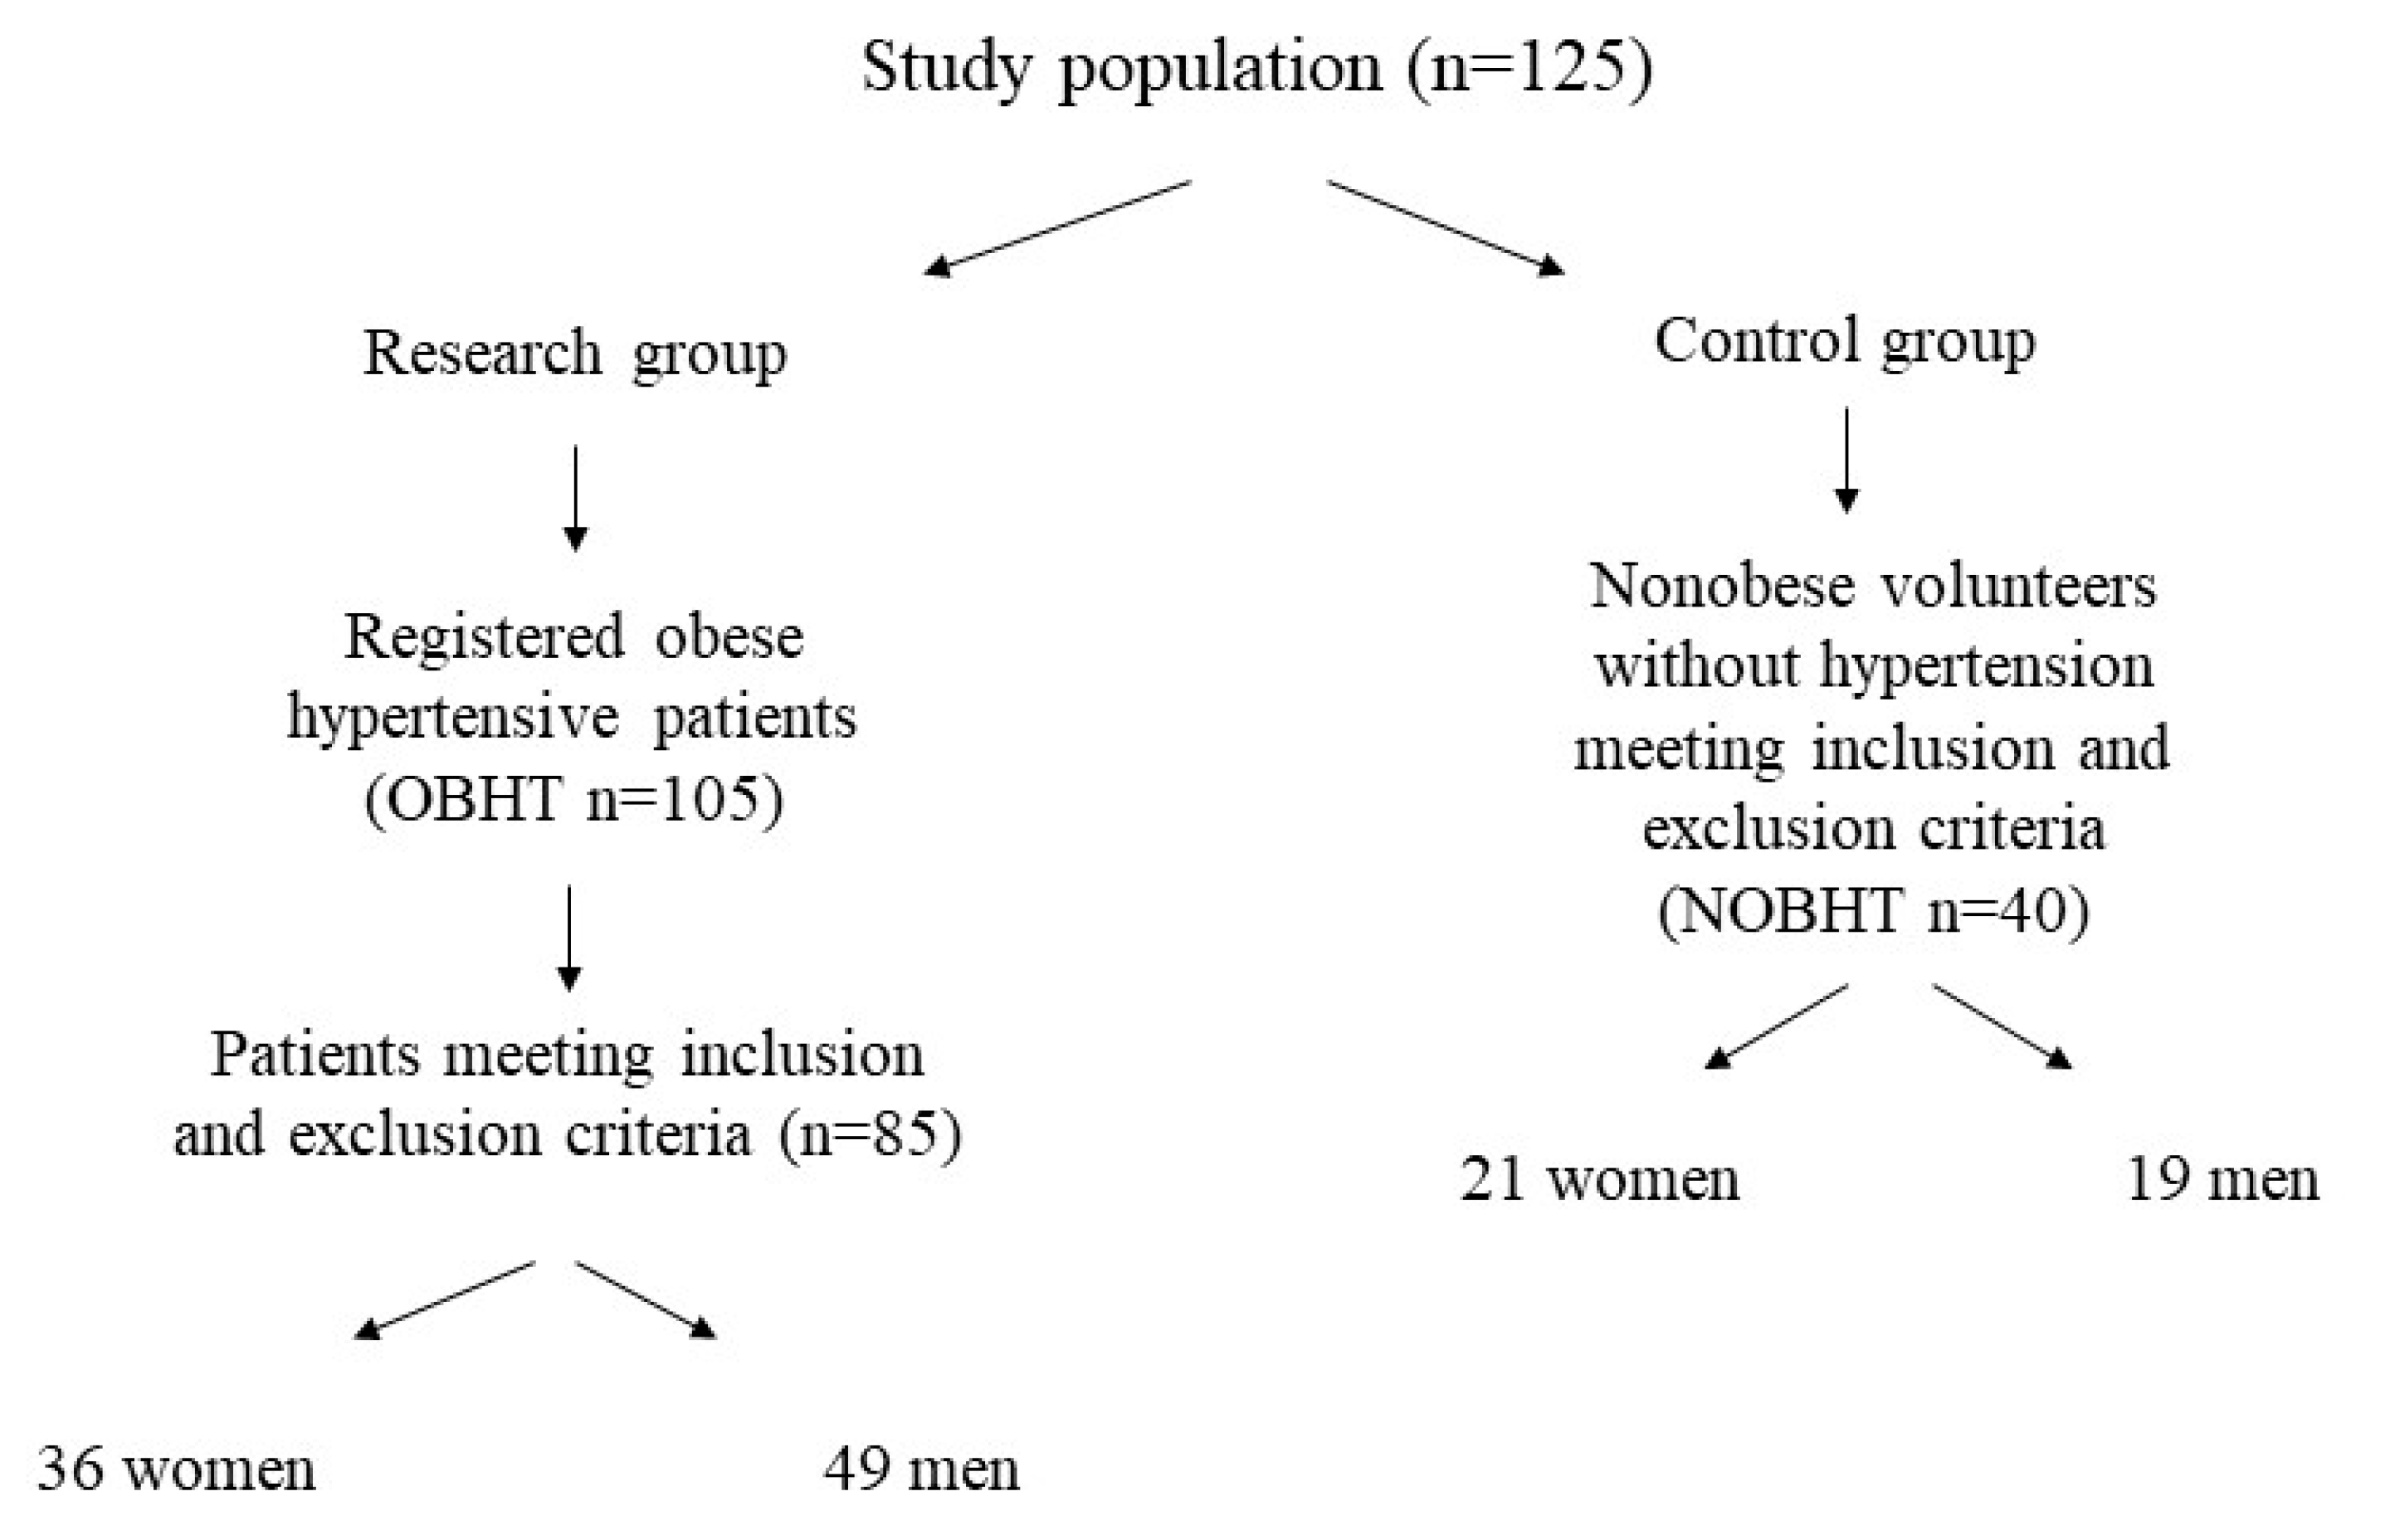
2.1. Research Group
2.2. Anthropometric and Blood Pressure Measurements
2.3. Biochemical Measurements and Calculations
2.4. Statistical Analysis
3. Results
4. Discussion
5. Conclusions
Author Contributions
Funding
Conflicts of Interest
References
- Rafiq, S.; Jeppesen, P.B. Body Mass Index, vitamin D, and type 2 diabetes: A systematic review and meta-analysis. Nutrients 2018, 10, 1182. [Google Scholar] [CrossRef] [Green Version]
- Wang, H.; Chen, W.; Li, D.; Yin, X.; Zhang, X.; Olsen, N.; Zheng, S.G. Vitamin D and chronic diseases. Aging Dis. 2017, 8, 346–353. [Google Scholar] [CrossRef] [Green Version]
- Ritterhouse, L.L.; Lu, R.; Shah, H.B.; Robertson, J.M.; Fife, D.A.; Maecker, H.T.; Du, H.; Fathman, C.G.; Chakravarty, E.F.; Scofield, R.H.; et al. Vitamin D deficiency in a multiethnic healthy control cohort and altered immune response in vitamin D deficient European-American healthy controls. PLoS ONE 2014, 9, e94500. [Google Scholar] [CrossRef] [PubMed]
- Yang, Y.; Rogers, K.; Wardle, R.; El-Khoury, J.M. High-throughput measurement of 25-hydroxyvitamin D by LC–MS/MS with separation of the C3-epimer interference for pediatric populations. Clin. Chim. Acta 2016, 454, 102–106. [Google Scholar] [CrossRef] [PubMed]
- Tsuprykov, O.; Chen, X.; Hocher, C.F.; Skoblo, R.; Lianghong, Y.; Hocher, B. Why should we measure free 25(OH) vitamin D? J. Steroid Biochem. Mol. Biol. 2018, 180, 87–104. [Google Scholar] [CrossRef] [PubMed]
- Chun, R.F.; Peercy, B.E.; Orwoll, E.S.; Nielson, C.M.; Adams, J.S.; Hewison, M. Vitamin D and DBP: The free hormone hypothesis revisited. J. Steroid Biochem. Mol. Biol. 2014, 144, 132–137. [Google Scholar] [CrossRef] [Green Version]
- Pereira-Santos, M.; Costa, P.R.; Assis, M.; Santos, C.A.; Santos, D.B. Obesity and vitamin D deficiency: A systematic review and meta-analysis. Obes. Rev. 2015, 16, 341–349. [Google Scholar] [CrossRef]
- Szabó, B.; Tabák, A.G.; Toldy, E.; Szekeres, L.; Szili, B.; Bakos, B.; Balla, B.; Kósa, J.P.; Lakatos, P.; Takács, I. The role of serum total and free 25-hydroxyvitamin D and PTH values in defining vitamin D status at the end of winter: A representative survey. J. Bone Miner. Metab. 2017, 35, 83–90. [Google Scholar] [CrossRef]
- Alagacone, S.; Verga, E.; Verdolini, R.; Saifullah, S.M. The association between vitamin D deficiency and the risk of resistant hypertension. Clin. Exp. Hypertens. 2020, 42, 177–180. [Google Scholar] [CrossRef]
- Tamez, H.; Kalim, S.; Thadhani, R.I. Does vitamin D modulate blood pressure? Curr. Opin. Nephrol. Hypertens. 2013, 22, 204–209. [Google Scholar] [CrossRef] [Green Version]
- Williams, B.; Mancia, G.; Spiering, W.; Agabiti Rosei, E.; Azizi, M.; Burnier, M.; Clement, D.L.; Coca, A.; De Simone, G.; Dominiczak, A.; et al. 2018 ESC/ESH Guidelines for the management of arterial hypertension. Eur. Heart J. 2018, 39, 3021–3104. [Google Scholar] [CrossRef] [PubMed]
- Mancia, G.; Fagard, R.; Narkiewicz, K.; Redón, J.; Zanchetti, A.; Böhm, M.; Christiaens, T.; Cifkova, R.; De Backer, G.; Dominiczak, A.; et al. 2013 ESH/ESC Guidelines for the management of arterial hypertension: The Task Force for the management of arterial hypertension of the European Society of Hypertension (ESH) and of the European Society of Cardiology (ESC). J. Hypertens. 2013, 31, 1281–1357. [Google Scholar] [CrossRef] [PubMed] [Green Version]
- Knopfholz, J.; Disserol, C.C.; Pierin, A.J.; Schirr, F.L.; Streisky, L.; Takito, L.L.; Ledesma, P.M.; Faria-Neto, J.R.; Olandoski, M. Validation of the Friedewald formula in patients with metabolic syndrome. Cholesterol 2014, 2014, 261878. [Google Scholar] [CrossRef] [PubMed] [Green Version]
- Bikle, D.D.; Gee, E.; Halloran, B.; Kowalski, M.A.; Ryzen, E.; Haddad, J.G. Assessment of the free fraction of 25-hydroxyvitamin D in serum and its regulation by albumin and the vitamin D-binding protein. J. Clin. Endocrinol. Metab. 1986, 63, 954–959. [Google Scholar] [CrossRef]
- Vermeulen, A.; Verdonck, L.; Kaufman, J.M. A critical evaluation of simple methods for the estimation of free testosterone in serum. J. Clin. Endocrinol. Metab. 1999, 84, 3666–3672. [Google Scholar] [CrossRef]
- Holick, M.F.; Binkley, N.C.; Bischoff-Ferrari, H.A.; Gordon, C.M.; Hanley, D.A.; Heaney, R.P.; Murad, M.H.; Weaver, C.M. Endocrine Society. Evaluation, treatment, and prevention of vitamin D deficiency: An Endocrine Society Clinical Practice Guideline. J. Clin. Endocrinol. Metab. 2011, 96, 1911–1930. [Google Scholar] [CrossRef] [Green Version]
- Kim, H.J.; Misuk, J.; Junghan, S.; Hee-Won, M.; Mina, H. Clinical utility of measurement of vitamin D-binding protein and calculation of bioavailable vitamin D in assessment of vitamin D status. Ann. Lab. Med. 2017, 37, 34–38. [Google Scholar] [CrossRef]
- Pelczyńska, M.; Grzelak, T.; Sperling, M.; Bogdański, P.; Pupek-Musialik, D.; Czyżewska, K. Impact of 25-hydroxyvitamin D, free and bioavailable fractions of vitamin D, and vitamin D binding protein levels on metabolic syndrome components. Arch. Med. Sci. 2016, 13, 745–752. [Google Scholar] [CrossRef]
- Jackson, J.L.; Judd, S.E.; Panwar, B.; Howard, V.J.; Wadley, V.G.; Jenny, N.S.; Gutiérreza, O.M. Associations of 25-hydroxyvitamin D with markers of inflammation, insulin resistance and obesity in black and white community-dwelling adults. J. Clin. Transl. Endocrinol. 2016, 5, 21–25. [Google Scholar] [CrossRef] [Green Version]
- Rolim, M.C.; Santos, B.M.; Conceição, G.; Rocha, P.N. Relationship between vitamin D status, glycemic control and cardiovascular risk factors in Brazilians with type 2 diabetes mellitus. Diabetol. Metab. Syndr. 2016, 8, 77. [Google Scholar] [CrossRef] [Green Version]
- Walsh, J.S.; Evans, A.L.; Bowles, S.; Naylor, K.E.; Jones, K.S.; Schoenmakers, I.; Jacques, R.M.; Eastell, R. Free 25-hydroxyvitamin D is low in obesity, but there are no adverse associations with bone health. Am. J. Clin. Nutr. 2016, 103, 1465–1471. [Google Scholar] [CrossRef] [PubMed] [Green Version]
- Ding, C.; Gao, D.; Wilding, J.; Trayhurn, P.; Bing, C. Vitamin signalling in adipose tissue. Br. J. Nutr. 2012, 108, 1915–1923. [Google Scholar] [CrossRef] [PubMed] [Green Version]
- Mutt, S.J.; Hyppönen, E.; Saarnio, J.; Järvelin, M.R.; Herzig, K.H. Vitamin D and adipose tissue—More than storage. Front. Physiol. 2014, 5, 228. [Google Scholar] [CrossRef] [PubMed] [Green Version]
- Vanlint, S. Vitamin D and obesity. Nutrients 2013, 5, 949–956. [Google Scholar] [CrossRef] [Green Version]
- Sollid, S.T.; Hutchinson, M.Y.; Berg, V.; Fuskevag, O.M.; Figenschau, Y.; Thorsby, P.M.; Jorde, R. Effects of vitamin D binding protein phenotypes and vitamin D supplementation on serum total 25(OH)D and directly measured free 25(OH)D. Eur. J. Endocrinol. 2016, 174, 445–452. [Google Scholar] [CrossRef] [Green Version]
- Oleröd, G.; Hultén, L.M.; Hammarsten, O.; Klingberg, E. The variation in free 25-hydroxy vitamin D and vitamin D-binding protein with season and vitamin D status. Endocr. Connect. 2017, 6, 111–120. [Google Scholar] [CrossRef] [Green Version]
- Bouillon, R. Free or total 25OHD as marker for vitamin D status. J. Bone Miner. Res. 2016, 31, 1128–1136. [Google Scholar] [CrossRef] [Green Version]
- Drincic, A.T.; Armas, L.A.; Van Diest, E.E.; Heaney, R.P. Volumetric dilution, rather than sequestration best explains the low vitamin D status of obesity. Obesity 2012, 20, 1444–1448. [Google Scholar] [CrossRef]
- Pannu, P.K.; Calton, E.K.; Soares, M.J. Calcium and vitamin D in obesity and related chronic disease. Adv. Food Nutr. Res. 2016, 77, 57–100. [Google Scholar]
- Pannu, P.K.; Zhao, Y.; Soares, M.J. Reductions in body weight and percent fat mass increase the vitamin D status of obese subjects: A systematic review and metaregression analysis. Nutr. Res. 2016, 36, 201–213. [Google Scholar] [CrossRef]
- Witham, M.D.; Dove, F.J.; Dryburgh, M.; Sugden, J.A.; Morris, A.D.; Struthers, A.D. The effect of different doses of vitamin D3 on markers of vascular health in patients with type 2 diabetes: A randomized controlled trial. Diabetologia 2010, 53, 2112–2119. [Google Scholar] [CrossRef] [PubMed] [Green Version]
- Jeong, H.Y.; Park, K.M.; Lee, M.J.; Yang, D.H.; Kim, S.H.; Lee, S.Y. Vitamin D and hypertension. Electrolytes Blood Press. 2017, 15, 1–11. [Google Scholar] [CrossRef] [PubMed] [Green Version]
- Legarth, C.; Grimm, D.; Wehland, M.; Bauer, J.; Krüger, M. The impact of vitamin D in the treatment of essential hypertension. Int. J. Mol. Sci. 2018, 19, 455. [Google Scholar] [CrossRef] [Green Version]
- Oh, J.; Weng, S.; Felton, S.K.; Bhandare, S.; Riek, A.; Butler, B.; Proctor, B.M.; Petty, M.; Chen, Z.; Schechtman, K.B.; et al. 1,25(OH)2 vitamin D inhibits foam cell formation and suppresses macrophage cholesterol uptake in patients with type 2 diabetes mellitus. Circulation 2009, 120, 687–698. [Google Scholar] [CrossRef] [PubMed] [Green Version]
- Mozos, I.; Marginean, O. Links between vitamin D deficiency and cardiovascular diseases. BioMed Res. Int. 2015, 2015, 109275. [Google Scholar] [CrossRef]
- Miñambres, I.; Sanchez-Quesada, J.L.; Pérez, A. Vitamin D deficiency and metabolic syndrome: Any link with statin intolerance and adipokines dysregulation? A response. Clin. Lipidol. 2017, 12, 7. [Google Scholar] [CrossRef]
- Rafiq, S.; Jeppesen, P.B. Is hypovitaminosis D related to incidence of type 2 diabetes and high fasting glucose level in healthy subjects: A systematic review and meta-analysis of observational studies. Nutrients 2018, 10, 59. [Google Scholar] [CrossRef] [Green Version]
- Tosunbayraktar, G.; Bas, M.; Kut, A.; Buyukkaragoz, A.H. Low serum 25(OH)D levels are assocıated to hıgher BMI and metabolic syndrome parameters in adult subjects in Turkey. Afr. Health Sci. 2015, 15, 1161–1169. [Google Scholar] [CrossRef] [Green Version]
- Kwon, H.N.; Lim, H. Relationship between serum vitamin D status and metabolic risk factors among Korean adults with prediabetes. PLoS ONE 2016, 11, e0165324. [Google Scholar] [CrossRef] [Green Version]
- Lee, C.J.; Iyer, G.; Liu, Y.; Kalyani, R.R.; Bamba, N.; Ligon, C.B.; Varma, S.; Mathioudakis, N. The effect of vitamin D supplementation on glucose metabolism in type 2 diabetes mellitus: A systematic review and meta-analysis of intervention studies. J. Diabetes Complicat. 2017, 31, 1115–1126. [Google Scholar] [CrossRef]
- Jorde, R. The Role of Vitamin D binding protein, total and free 25-hydroxyvitamin d in diabetes. Front. Endocrinol. 2019, 10, 79. [Google Scholar] [CrossRef] [PubMed]
- Delle Monache, S.; Di Fulvio, P.; Iannetti, E.; Valerii, L.; Capone, L.; Nespoli, M.G.; Bologna, M.; Angelucci, A. Body mass index represents a good predictor of vitamin D status in women independently from age. Clin. Nutr. 2019, 38, 829–834. [Google Scholar] [CrossRef] [PubMed]
- Chiang, J.M.; Stanczyk, F.Z.; Kanaya, A.M. Vitamin D levels, body composition, and metabolic factors in Asian Indians: Results from the metabolic syndrome and atherosclerosis in South Asians living in America pilot study. Ann. Nutr. Metab. 2018, 72, 223–230. [Google Scholar] [CrossRef] [PubMed]


| Parameter (Unit) | OBHT (n = 85) | NOBNHT (n = 40) | p Value |
|---|---|---|---|
| Age (year) | 46.9 ± 8.5 | 42.4 ± 7.4 | 0.089 |
| Body weight (kg) | 112.3 ± 22.2 | 72.5 ± 14.6 | <0.001 |
| Height (cm) | 173 ± 9.0 | 171 ± 10.0 | 0.239 |
| Waist circumference (cm) | 117.9 ± 14.4 | 83.4 ± 10.8 | <0.001 |
| Hip circumference (cm) | 119.1 ± 12.9 | 99.6 ± 6.6 | <0.001 |
| BMI (kg/m2) | 37.4 ± 6.2 | 24.6 ± 3.1 | <0.001 |
| Body fat mass (%) | 42.8 ± 8.4 | 24.7 ± 6.1 | <0.001 |
| Body lean mass (%) | 57.2 ± 8.4 | 75.3 ± 6.1 | <0.001 |
| Water content in the body (%) | 40.7 ± 5.0 | 54.8 ± 5.3 | <0.001 |
| SBP (mmHg) | 150 (140; 160) | 124 (106; 132.5) | <0.001 * |
| DBP (mmHg) | 95 (87; 105) | 80 (74.5; 90.25) | <0.001 * |
| TC (mmol/L) | 5.5 ± 1.3 | 5.3 ± 0.8 | 0.275 |
| HDL (mmol/L) | 1.1 (0.9; 1.3) | 1.8 (1.3; 1.9) | <0.001 * |
| LDL (mmol/L) | 3.6 ± 1.2 | 3.3 ± 0.8 | 0.192 |
| TG (mmol/L) | 2.1 (1.6; 2.6) | 1.0 (0.8; 1.4) | <0.001 * |
| FBG (mmol/L) | 5.7 (5.2; 6.1) | 5.0 (4.6; 5.4) | <0.001 * |
| Albumin (μmol/L) | 624.9 ± 35.1 | 660.8 ± 38.3 | <0.001 |
| VDBP (μmol/L) | 6.6 (5.1; 9.1) | 7.8 (6.7; 9.2) | 0.042 |
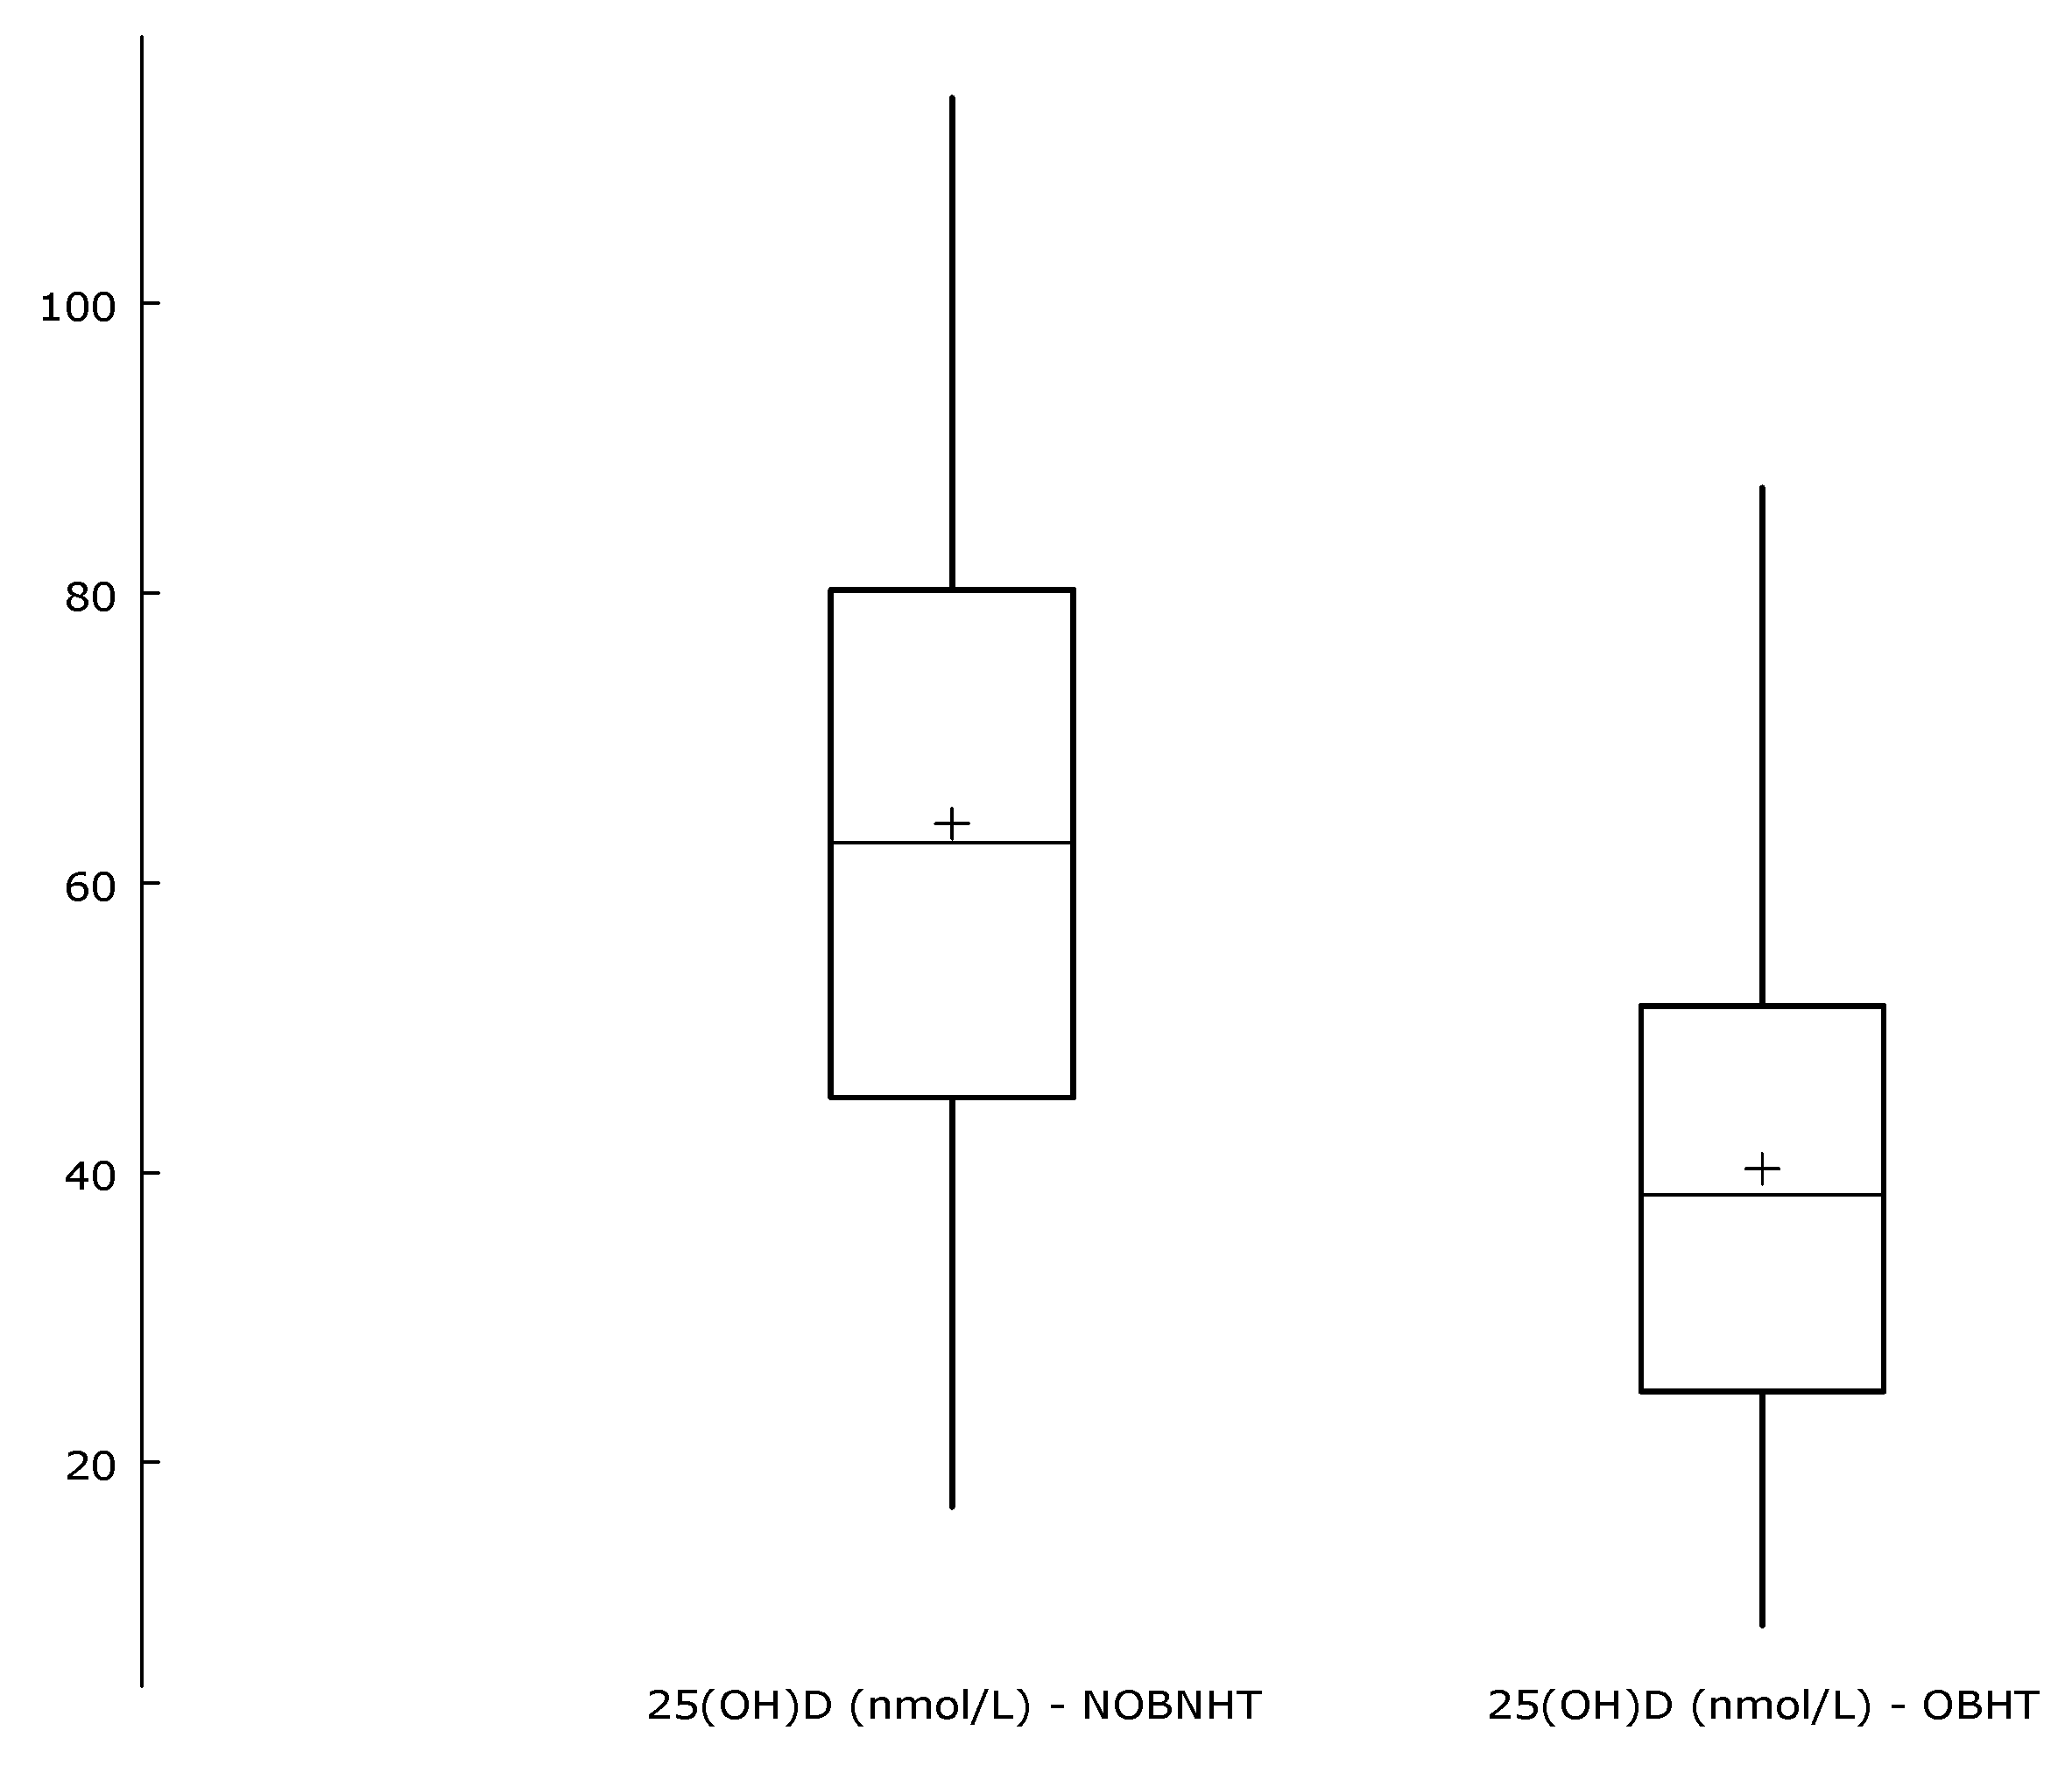
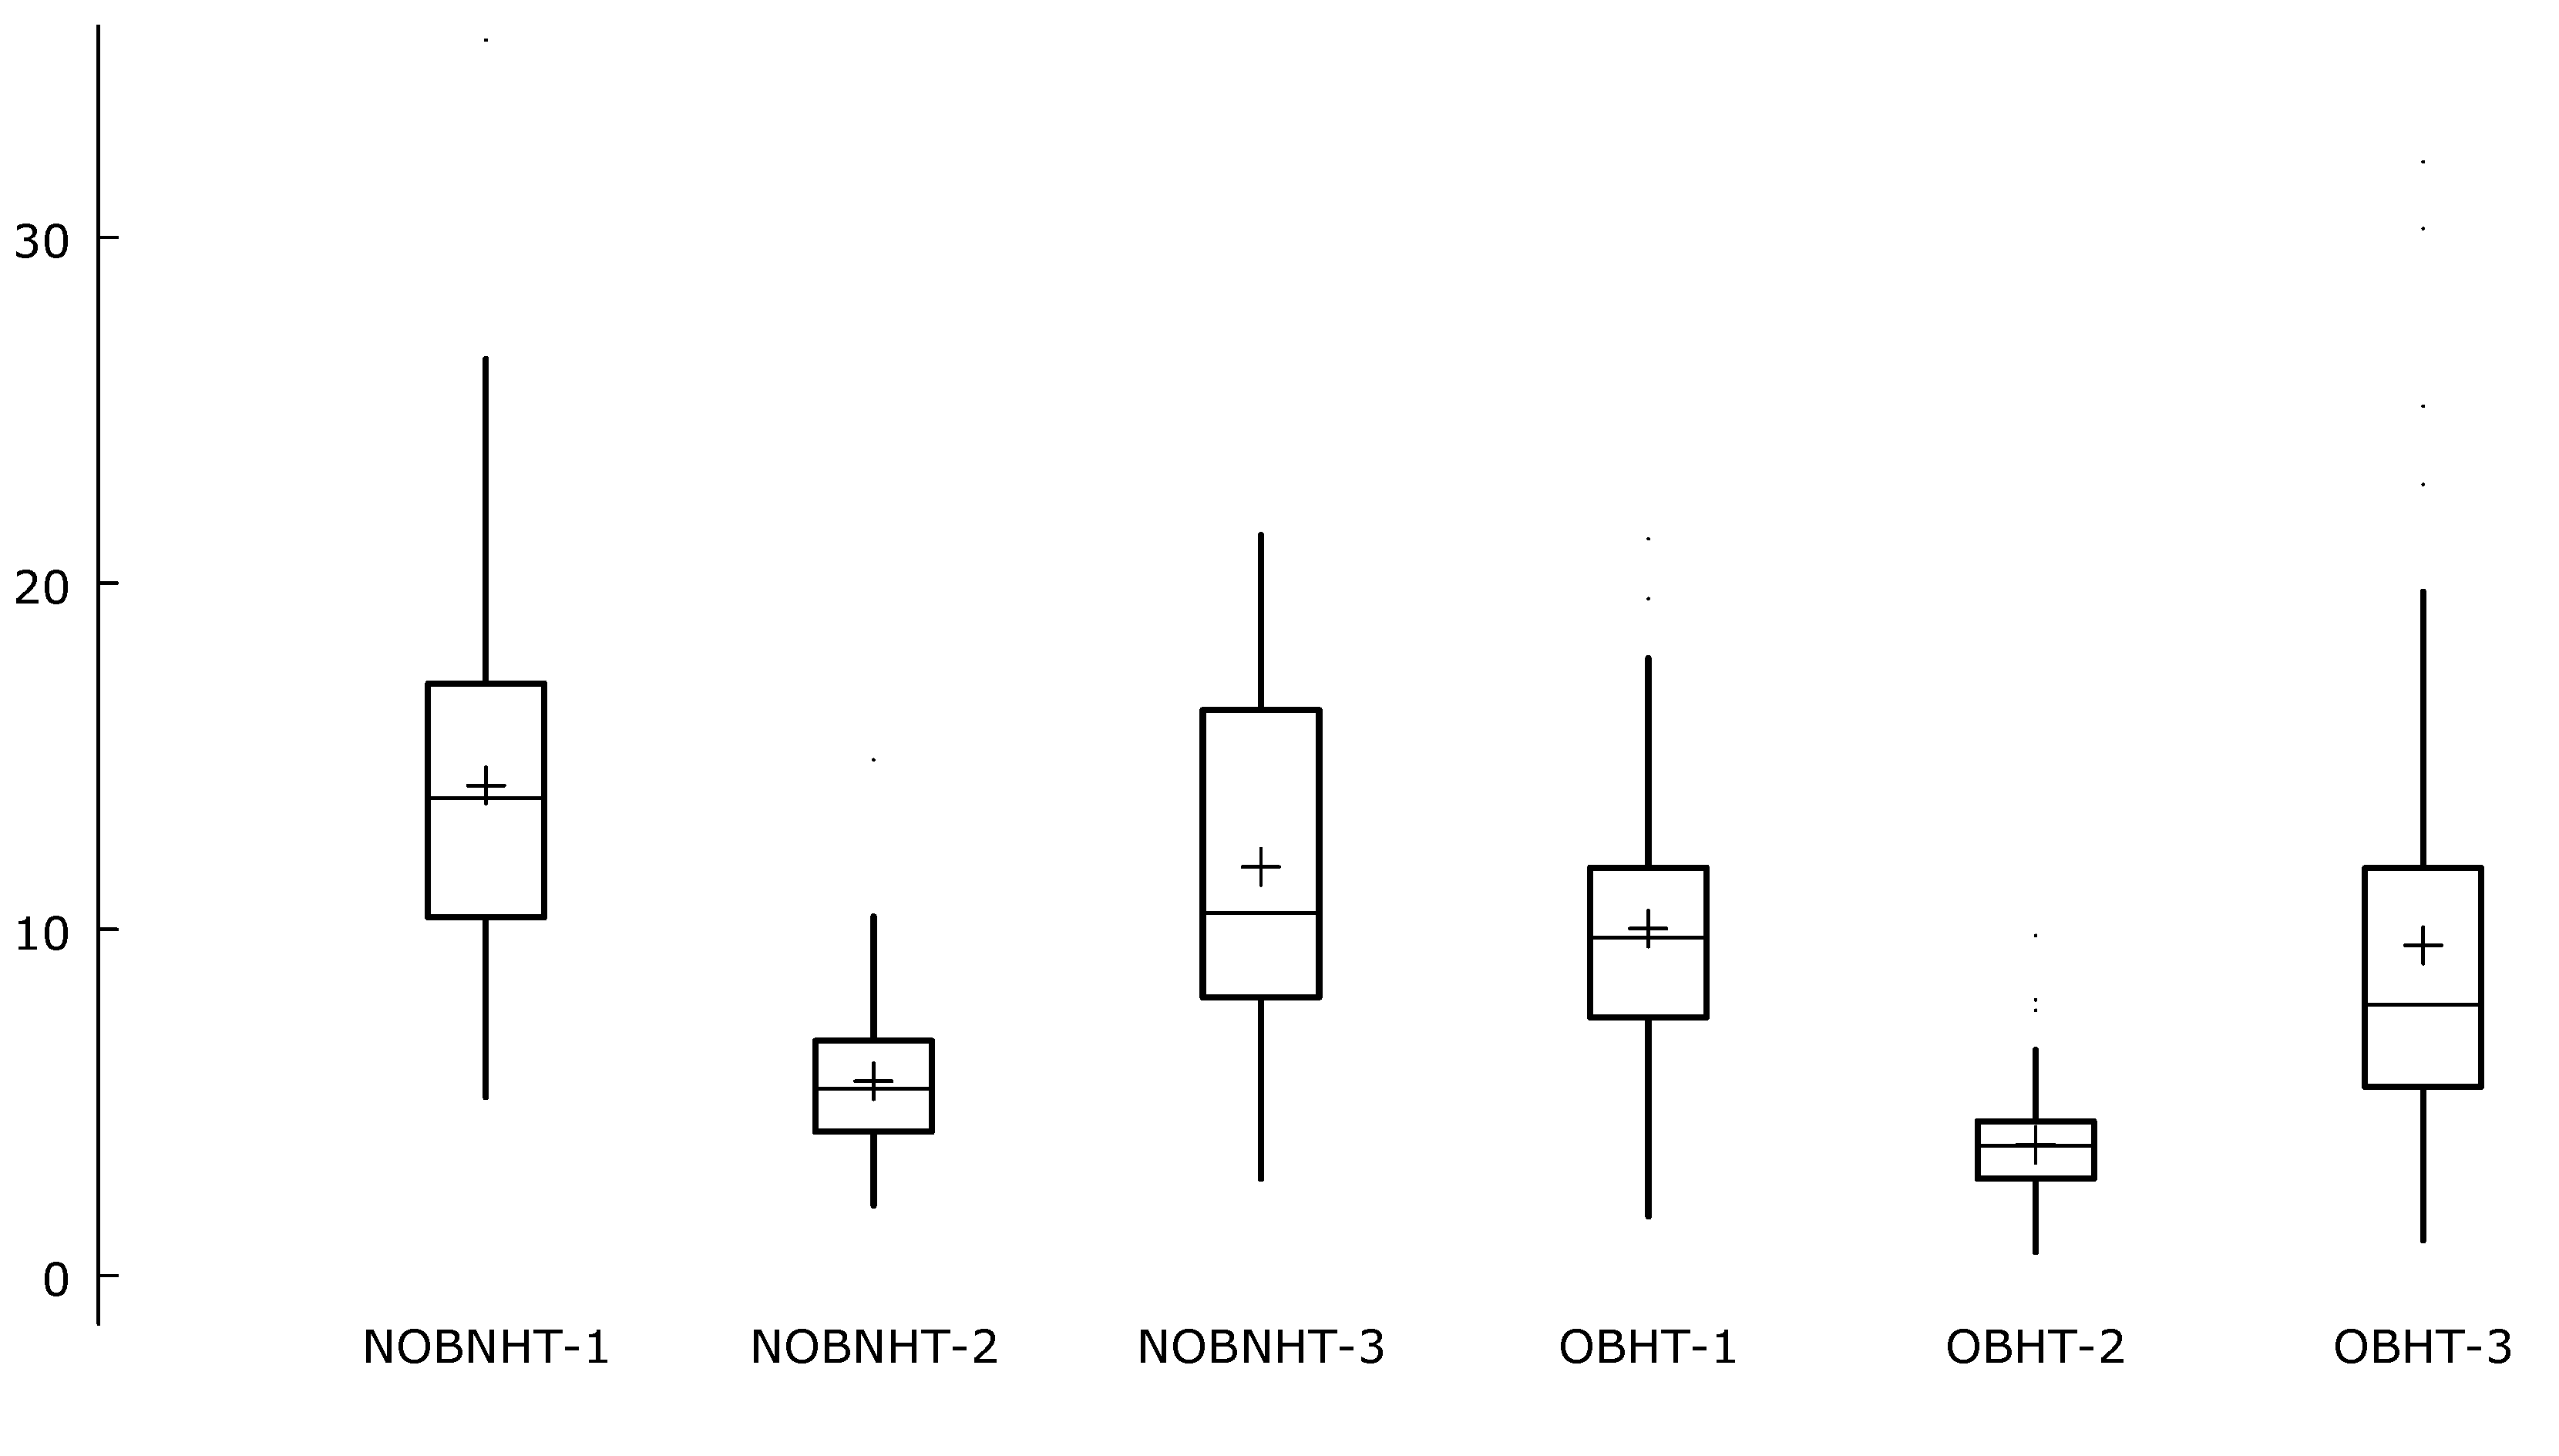
| Parameter (Unit) | OBHT (n = 85) | NOBNHT (n = 40) | p Value |
|---|---|---|---|
| 25(OH)D (nmol/L) | 40.6 ± 18.0 | 64.1 ± 22.3 | <0.001 |
| Directly measured free25(OH)D (pmol/L) | 9.8 (7.5;11.5) | 13.8 (10.3;16.8) | <0.001 |
| Bio25(OH)D (nmol/L) | 3.7 (2.8;4.4) | 5.4 (4.2;6.7) | <0.001 |
| Calculated free25(OH)D (pmol/L) | 7.8 (5.5;11.6) | 10.5 (8.1;16.3) | 0.002 |
| Parameter (Unit) | Body Weight (kg) | Waist Circumference (cm) | BMI (kg/m2) | HDL (mmol/L) | TG (mmol/L) | FBG (mmol/L) | ||||||
|---|---|---|---|---|---|---|---|---|---|---|---|---|
| rp/rs * | p | rp/rs * | p | rp/rs * | p | rp/rs * | p | rp/rs * | p | rp/rs * | p | |
| 25(OH)D (nmol/L) | −0.42 | 0.001 | −0.47 | 0.001 | −0.46 | 0.001 | 0.44 * | 0.001 | −0.34 | 0.001 | −0.26 | 0.004 |
| Directly measured free25(OH)D (pmol/L) | −0.29 | 0.001 | −0.33 | 0.001 | −0.36 | 0.001 | 0.29 * | 0.001 | −0.26 | 0.004 | −0.26 | 0.004 |
| Bio25(OH)D (nmol/L) | −0.30 | 0.001 | −0.34 | 0.001 | −0.37 | 0.001 | 0.28 * | 0.001 | −0.27 | 0.002 | −0.25 | 0.004 |
| Calculated free25(OH)D (pmol/L) | −0.19 * | 0.036 | −0.26 * | 0.004 | −0.26 * | 0.004 | 0.34 * | 0.001 | −0.35 * | 0.001 | −0.17 * | 0.055 |
© 2020 by the authors. Licensee MDPI, Basel, Switzerland. This article is an open access article distributed under the terms and conditions of the Creative Commons Attribution (CC BY) license (http://creativecommons.org/licenses/by/4.0/).
Share and Cite
Pelczyńska, M.; Grzelak, T.; Sperling, M.; Kręgielska-Narożna, M.; Bogdański, P.; Czyżewska, K. Evaluation of Vitamin D Fractions in Obese Hypertensive Patients. Int. J. Environ. Res. Public Health 2020, 17, 1660. https://doi.org/10.3390/ijerph17051660
Pelczyńska M, Grzelak T, Sperling M, Kręgielska-Narożna M, Bogdański P, Czyżewska K. Evaluation of Vitamin D Fractions in Obese Hypertensive Patients. International Journal of Environmental Research and Public Health. 2020; 17(5):1660. https://doi.org/10.3390/ijerph17051660
Chicago/Turabian StylePelczyńska, Marta, Teresa Grzelak, Marcelina Sperling, Matylda Kręgielska-Narożna, Paweł Bogdański, and Krystyna Czyżewska. 2020. "Evaluation of Vitamin D Fractions in Obese Hypertensive Patients" International Journal of Environmental Research and Public Health 17, no. 5: 1660. https://doi.org/10.3390/ijerph17051660