COVID-19 Spread in Saudi Arabia: Modeling, Simulation and Analysis


Abstract
:1. Introduction
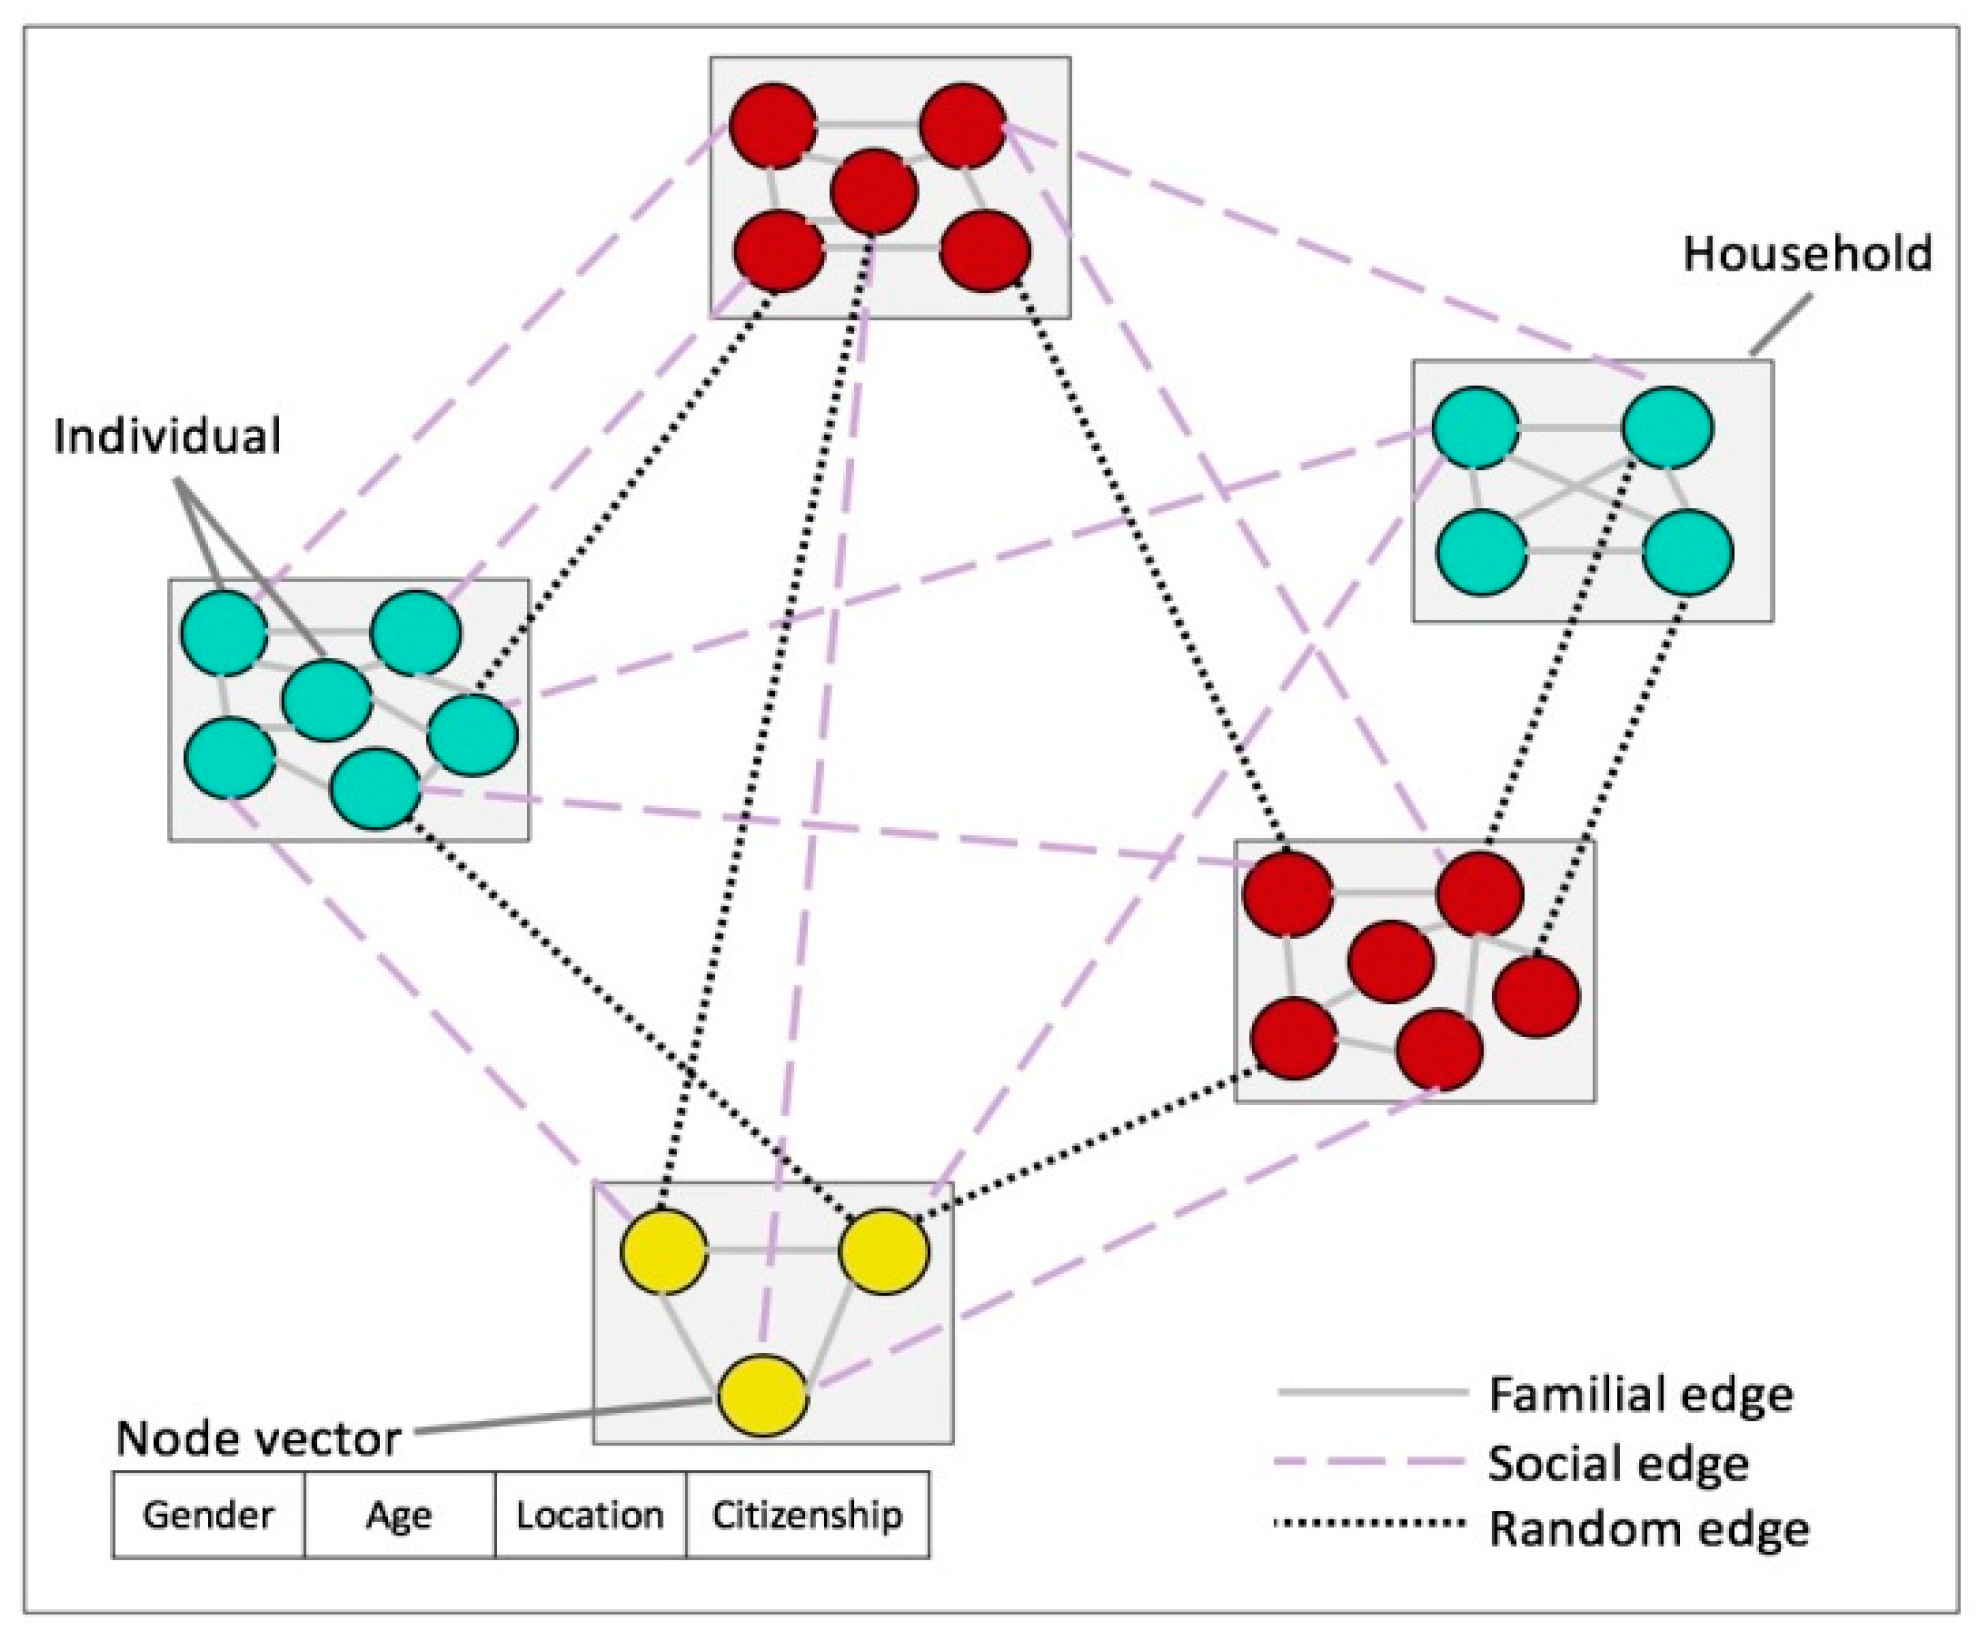
- We built a model for contact networks that captures the social properties and dynamics intrinsic to Saudi Arabia’s society. A set of attributes was defined for each node (representing each individual), including age, gender, nationality, and location. This is important as network structure and node attributes are crucial factors in the COVID-19 epidemic spreading process.
- We built a network simulation model of the spread of COVID-19 in Saudi Arabia using the widely adopted SIR model. Using our network simulations, we analyzed the processes by which COVID-19 spreads.
- We analyzed the effectiveness of the response of Saudi authorities using our network simulations.
- We predicted the future dynamics of the disease in Saudi Arabia under different scenarios.
- We investigated the effectiveness of different vaccination strategies.
2. Literature Review
3. Method
3.1. Contact Network Generation
| Algorithm 1 Contact network generation | |
| 1: | Create household clusters (complete graphs) with given average sizes |
| 2: | |
| 3: | for each pair of non-neighboring nodes u, v do |
| 4: | if then {T is the node pairs similarity threshold} |
| 5: | with probability |
| 6: | |
| 7: | else |
| 8: | if then |
| 9: | with probability |
| 10: | |
| 11: | else |
| 12: | with probability |
| 13: | |
| 14: | for each do |
| 15: | if then |
| 16: | with probability |
| 17: | else |
| 18: | if then |
| 19: | with probability |
| 20: | else |
| 21: | with probability |
3.2. Data
3.3. Simulation
4. Results
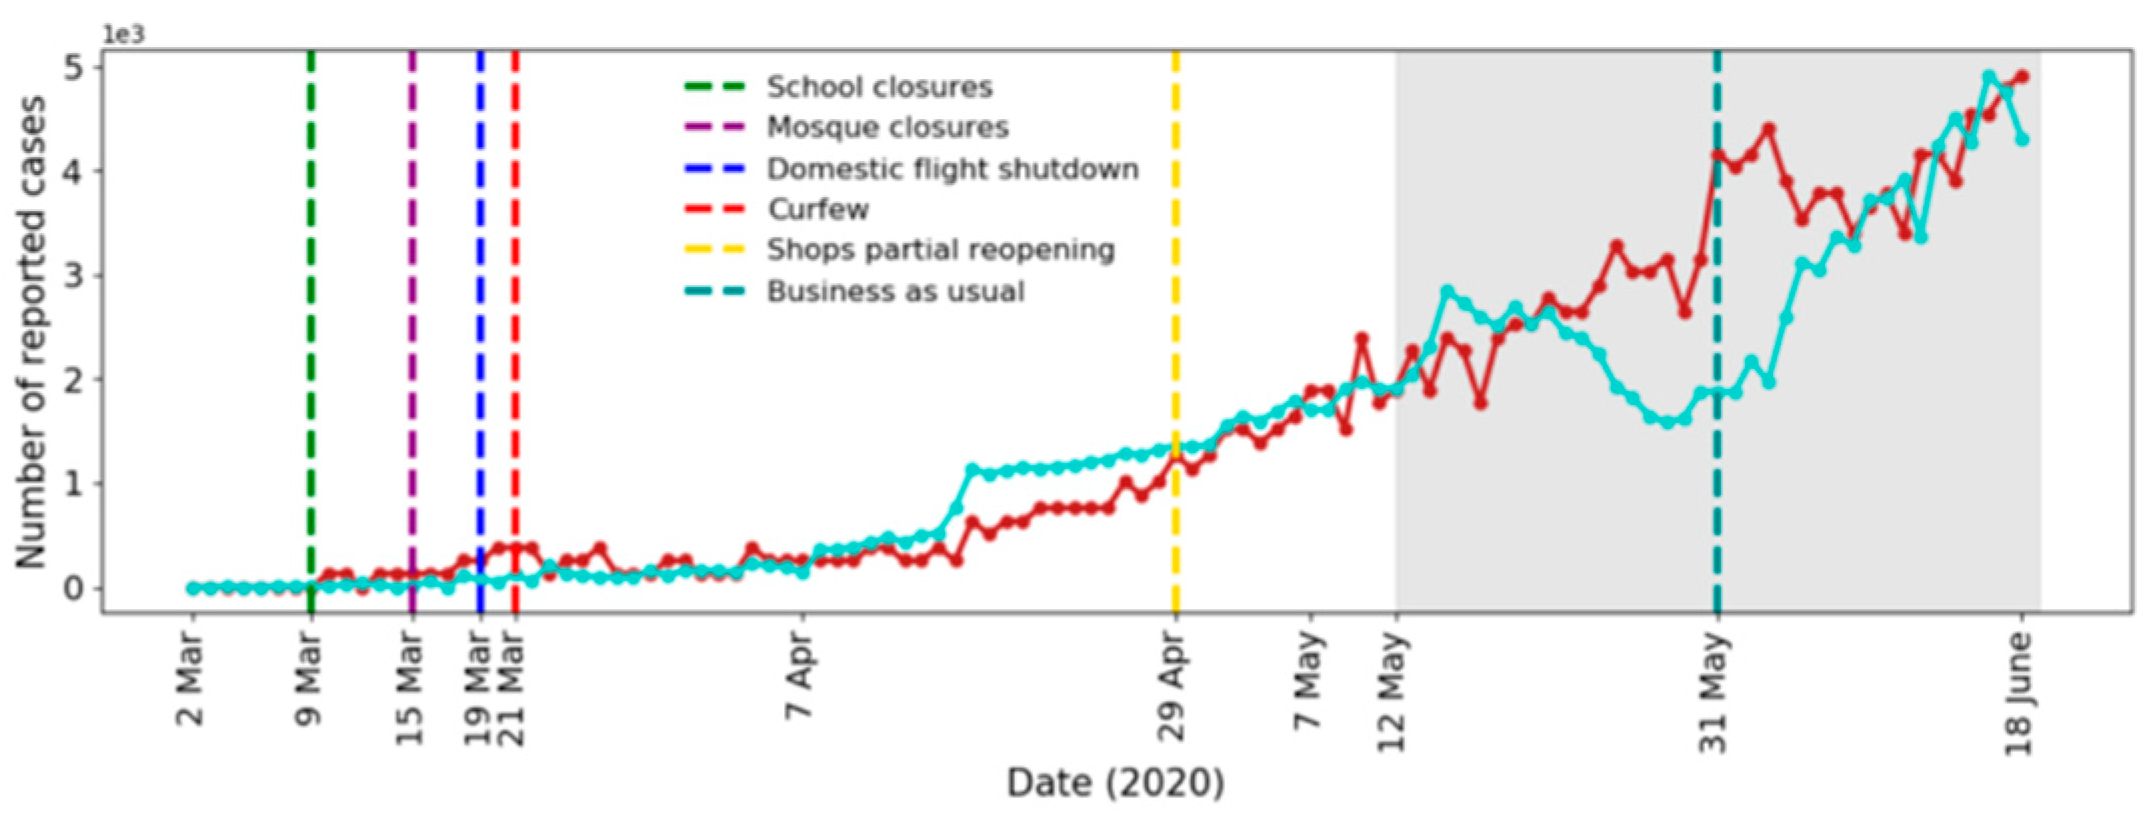
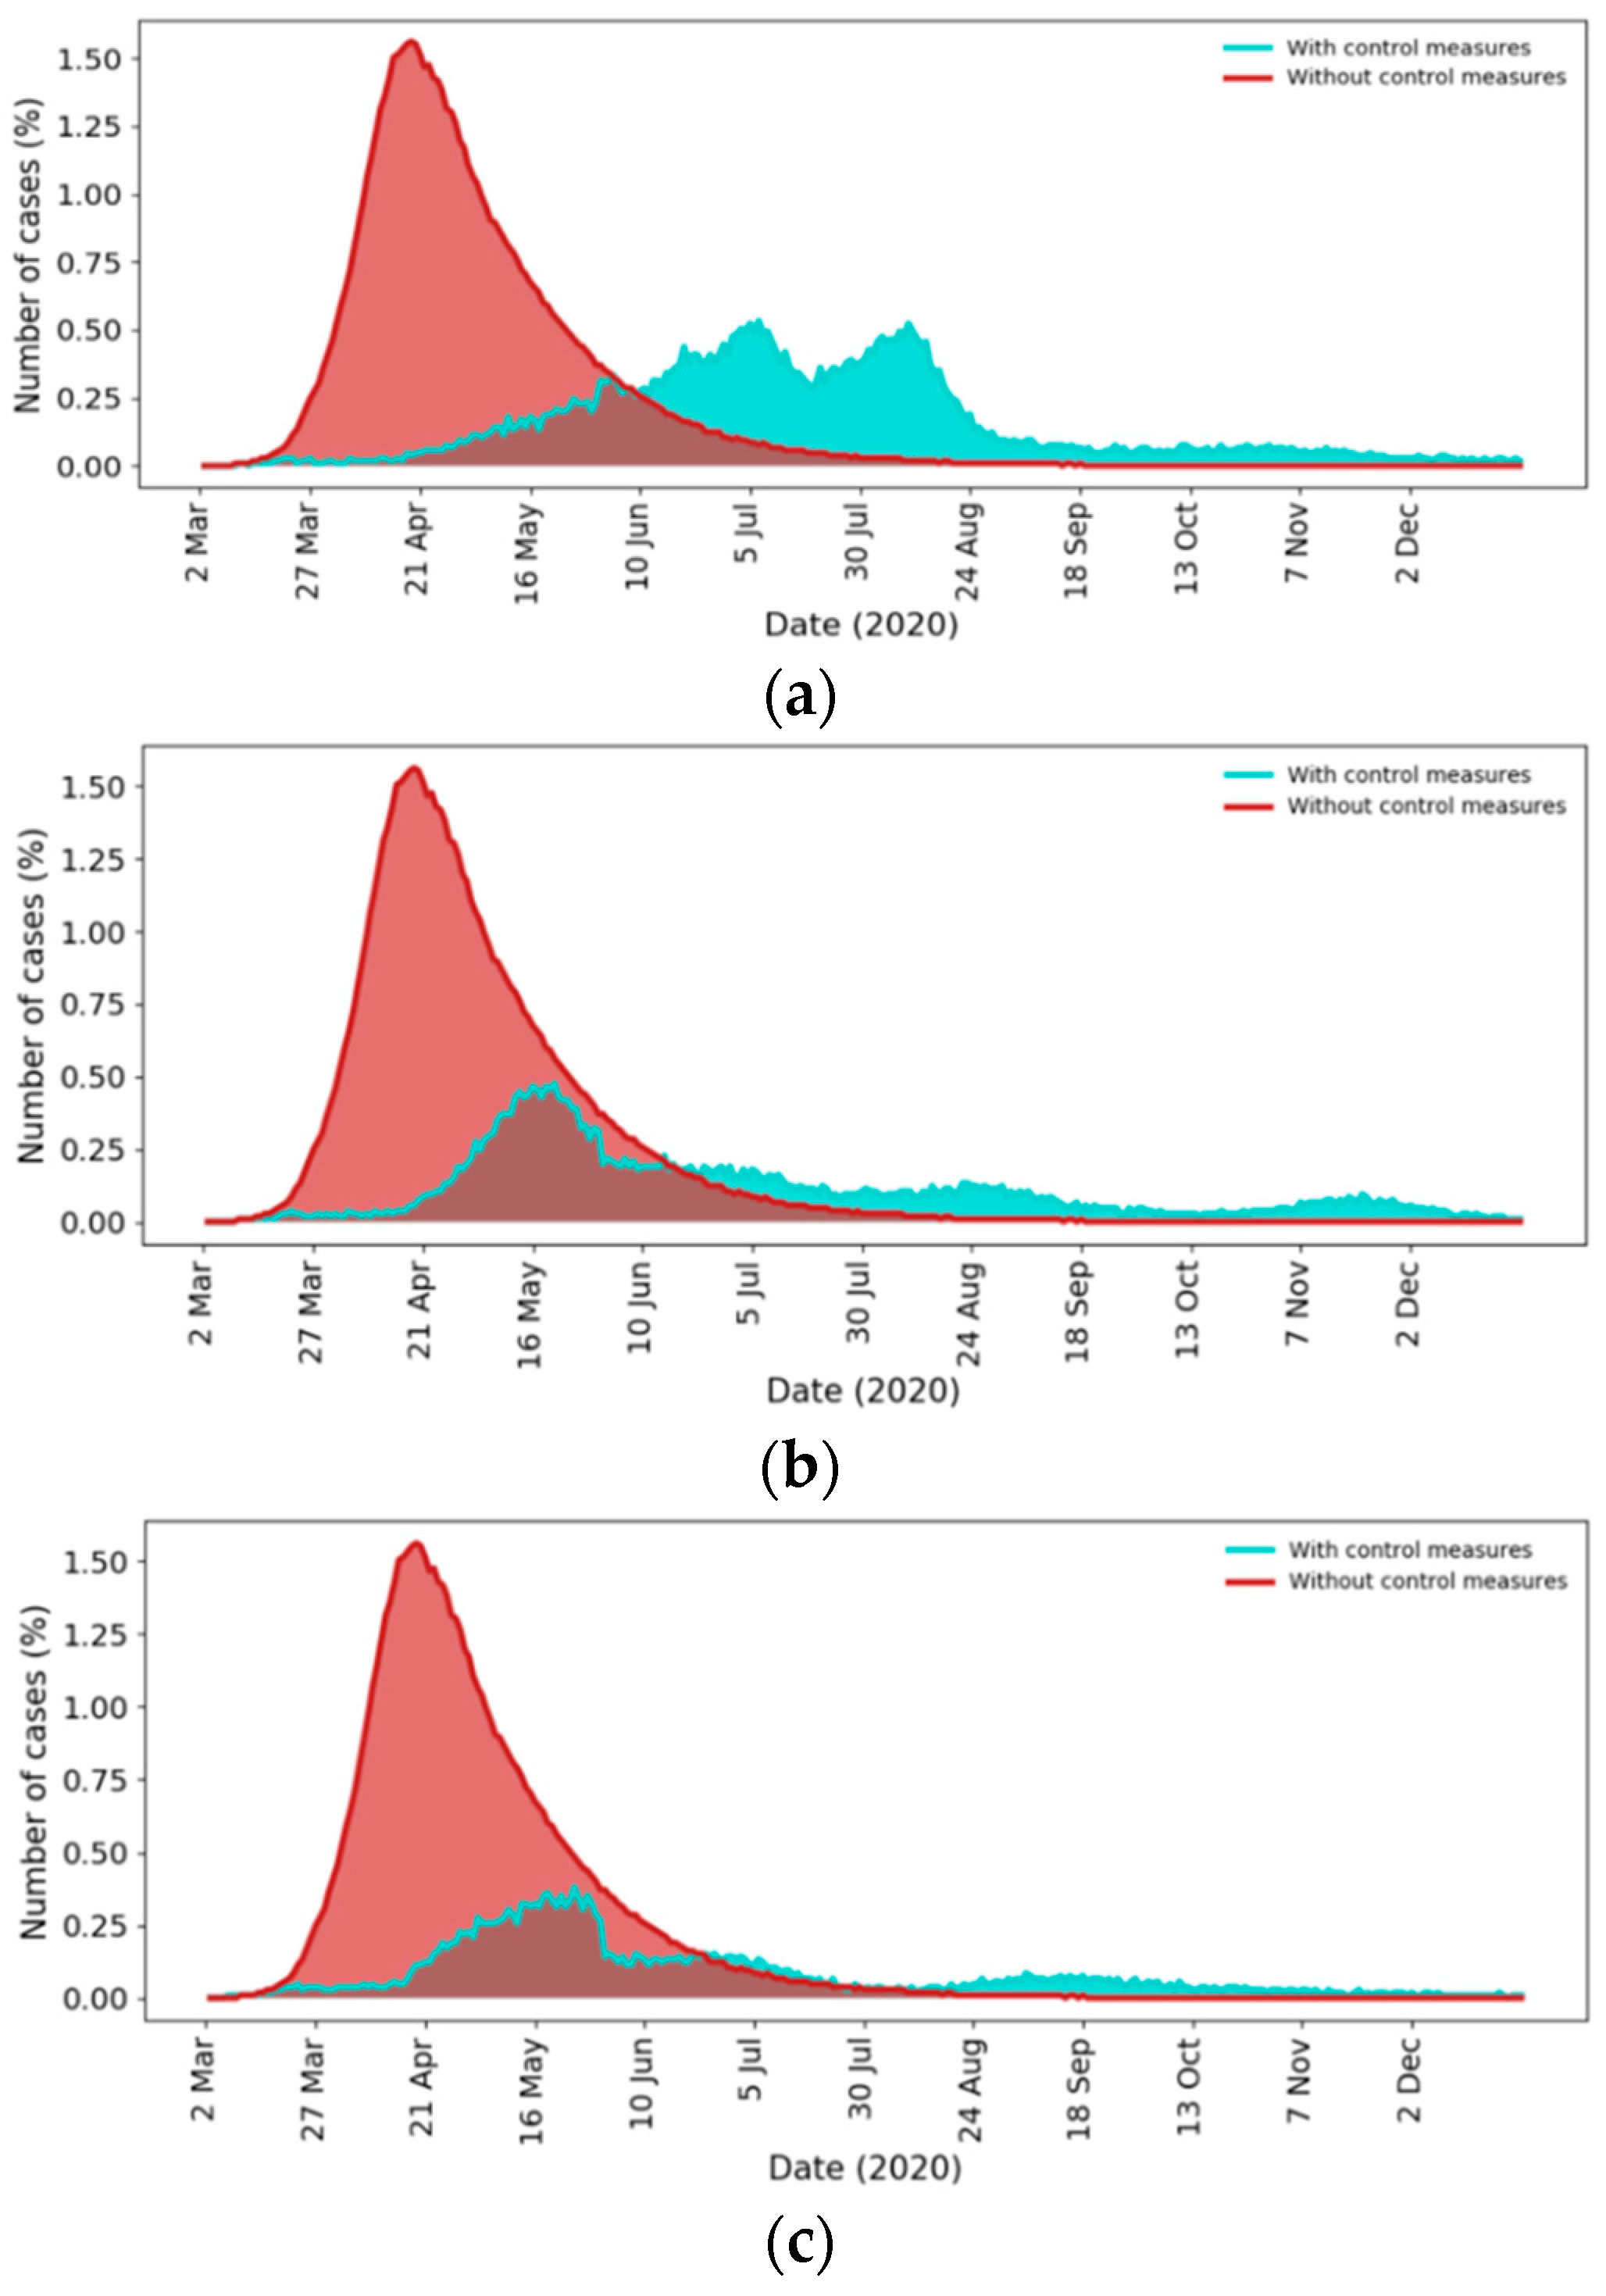
4.1. Effect of Control Measures
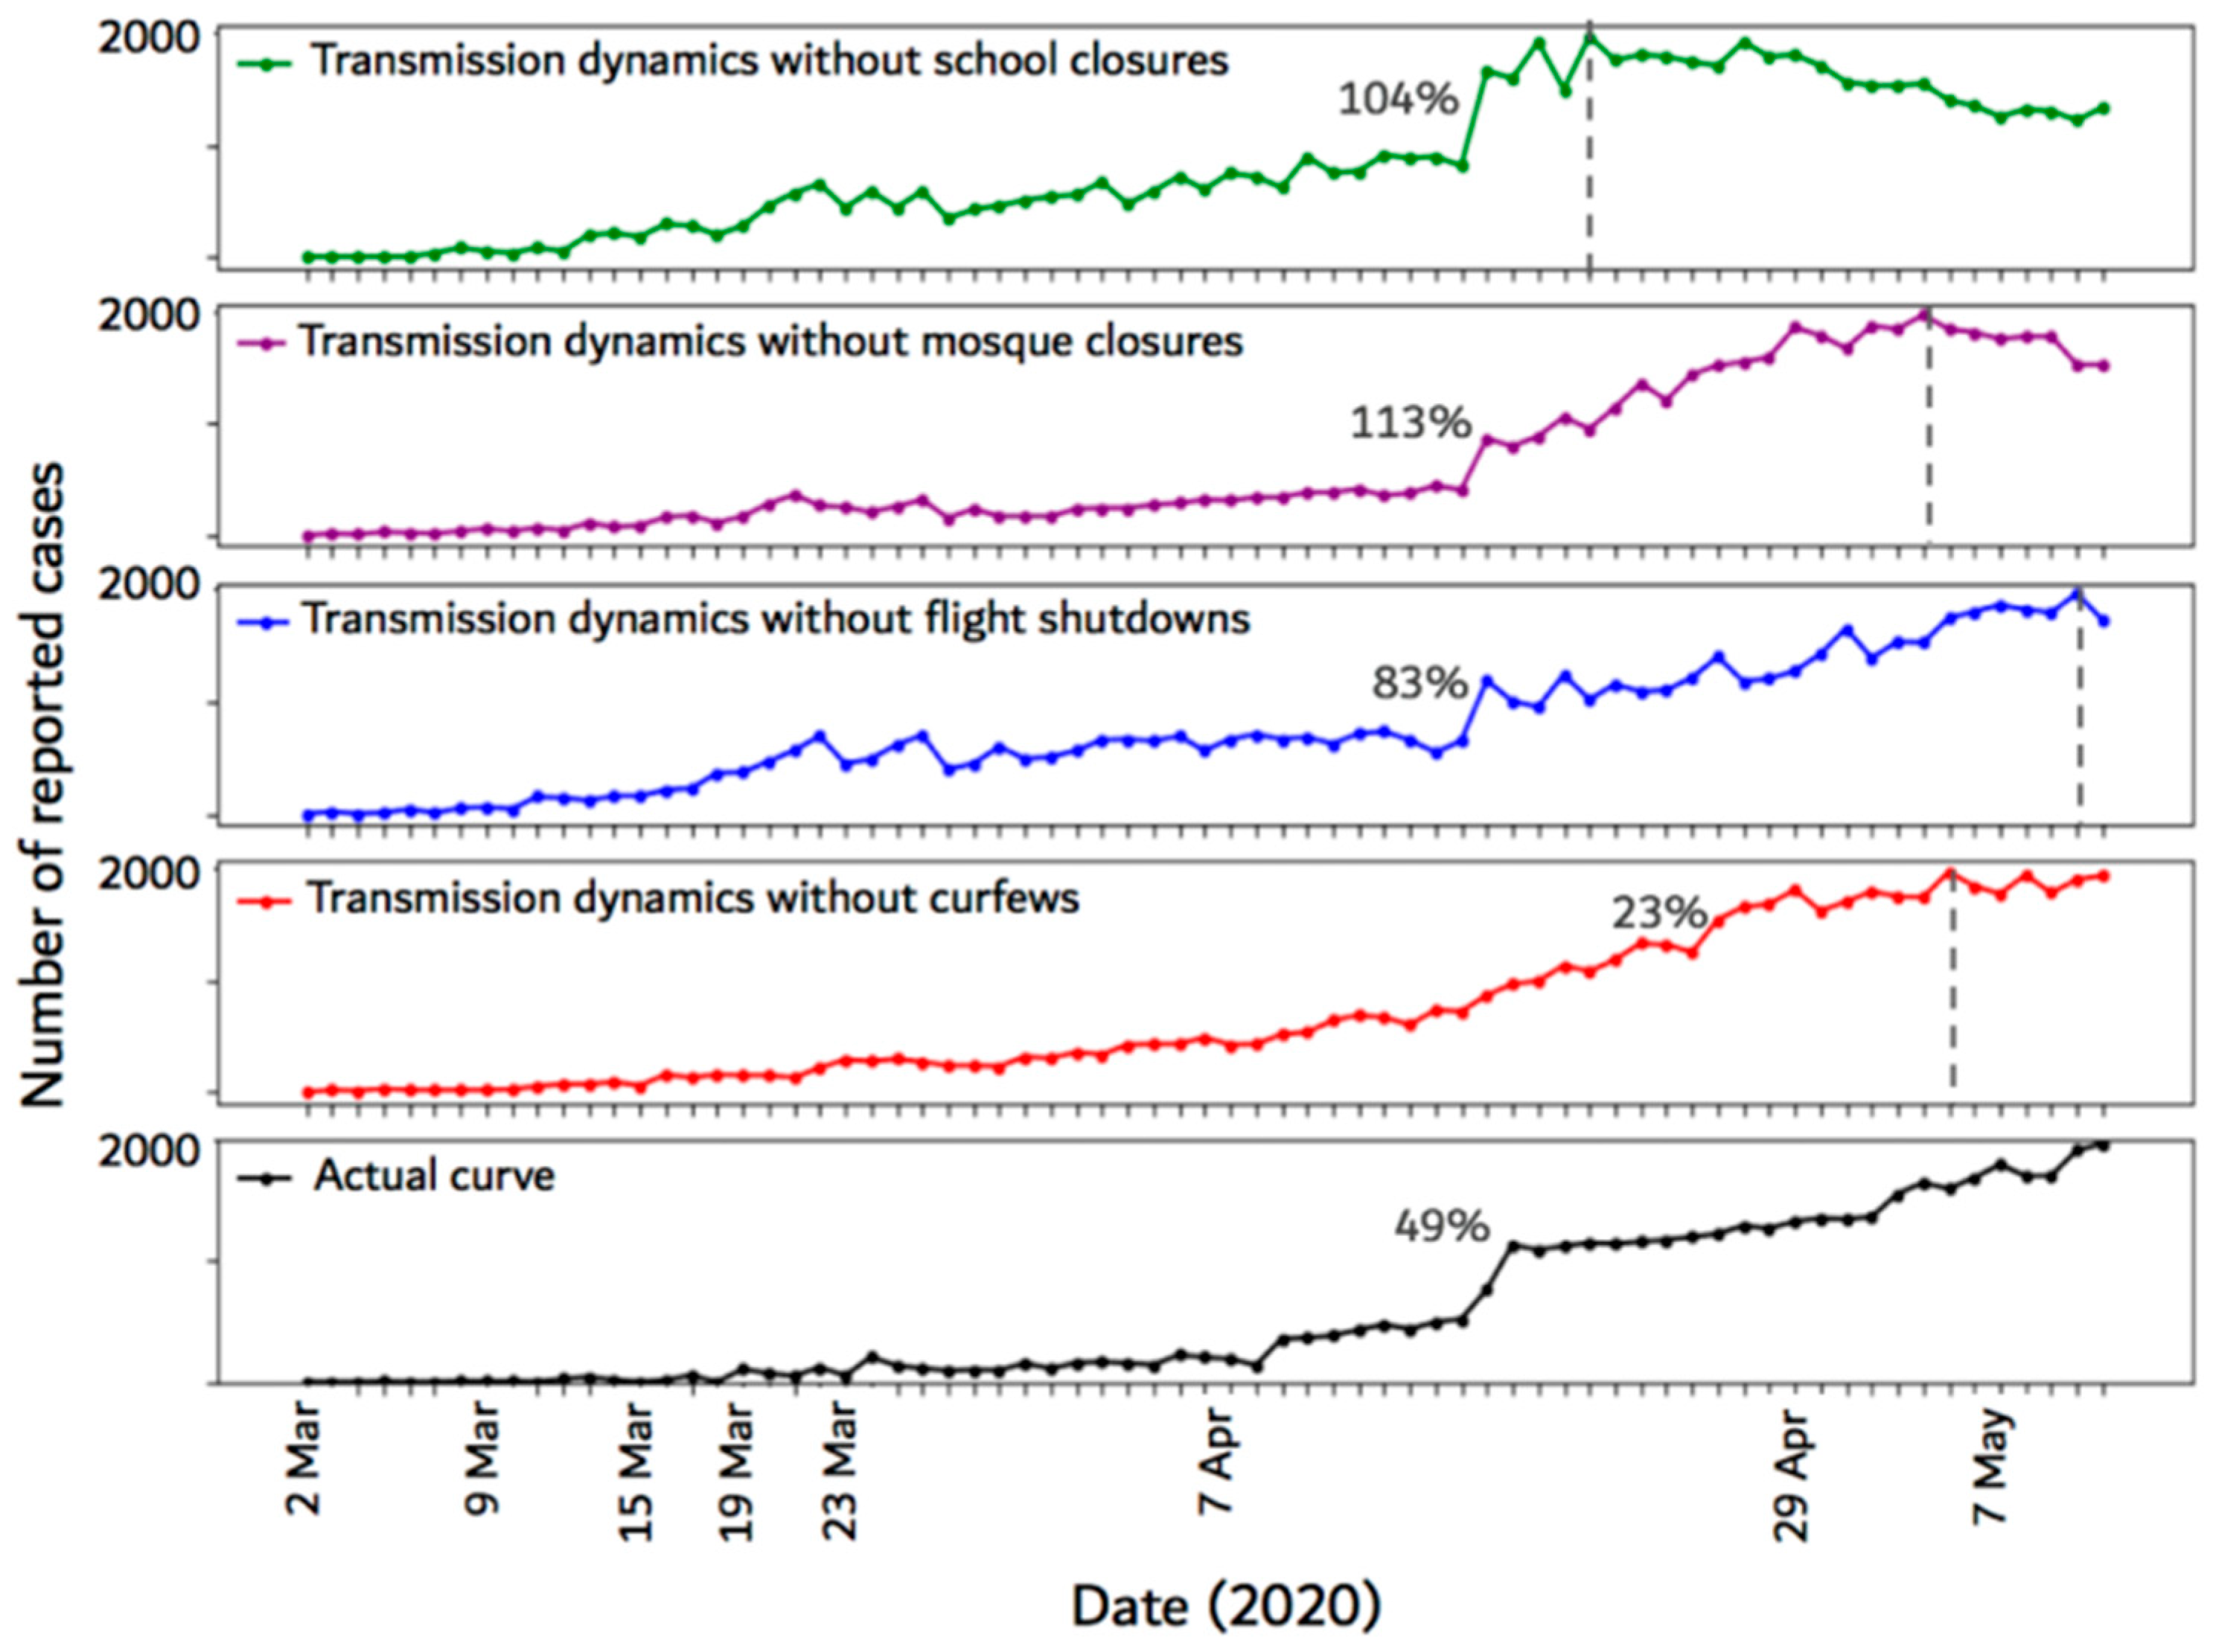
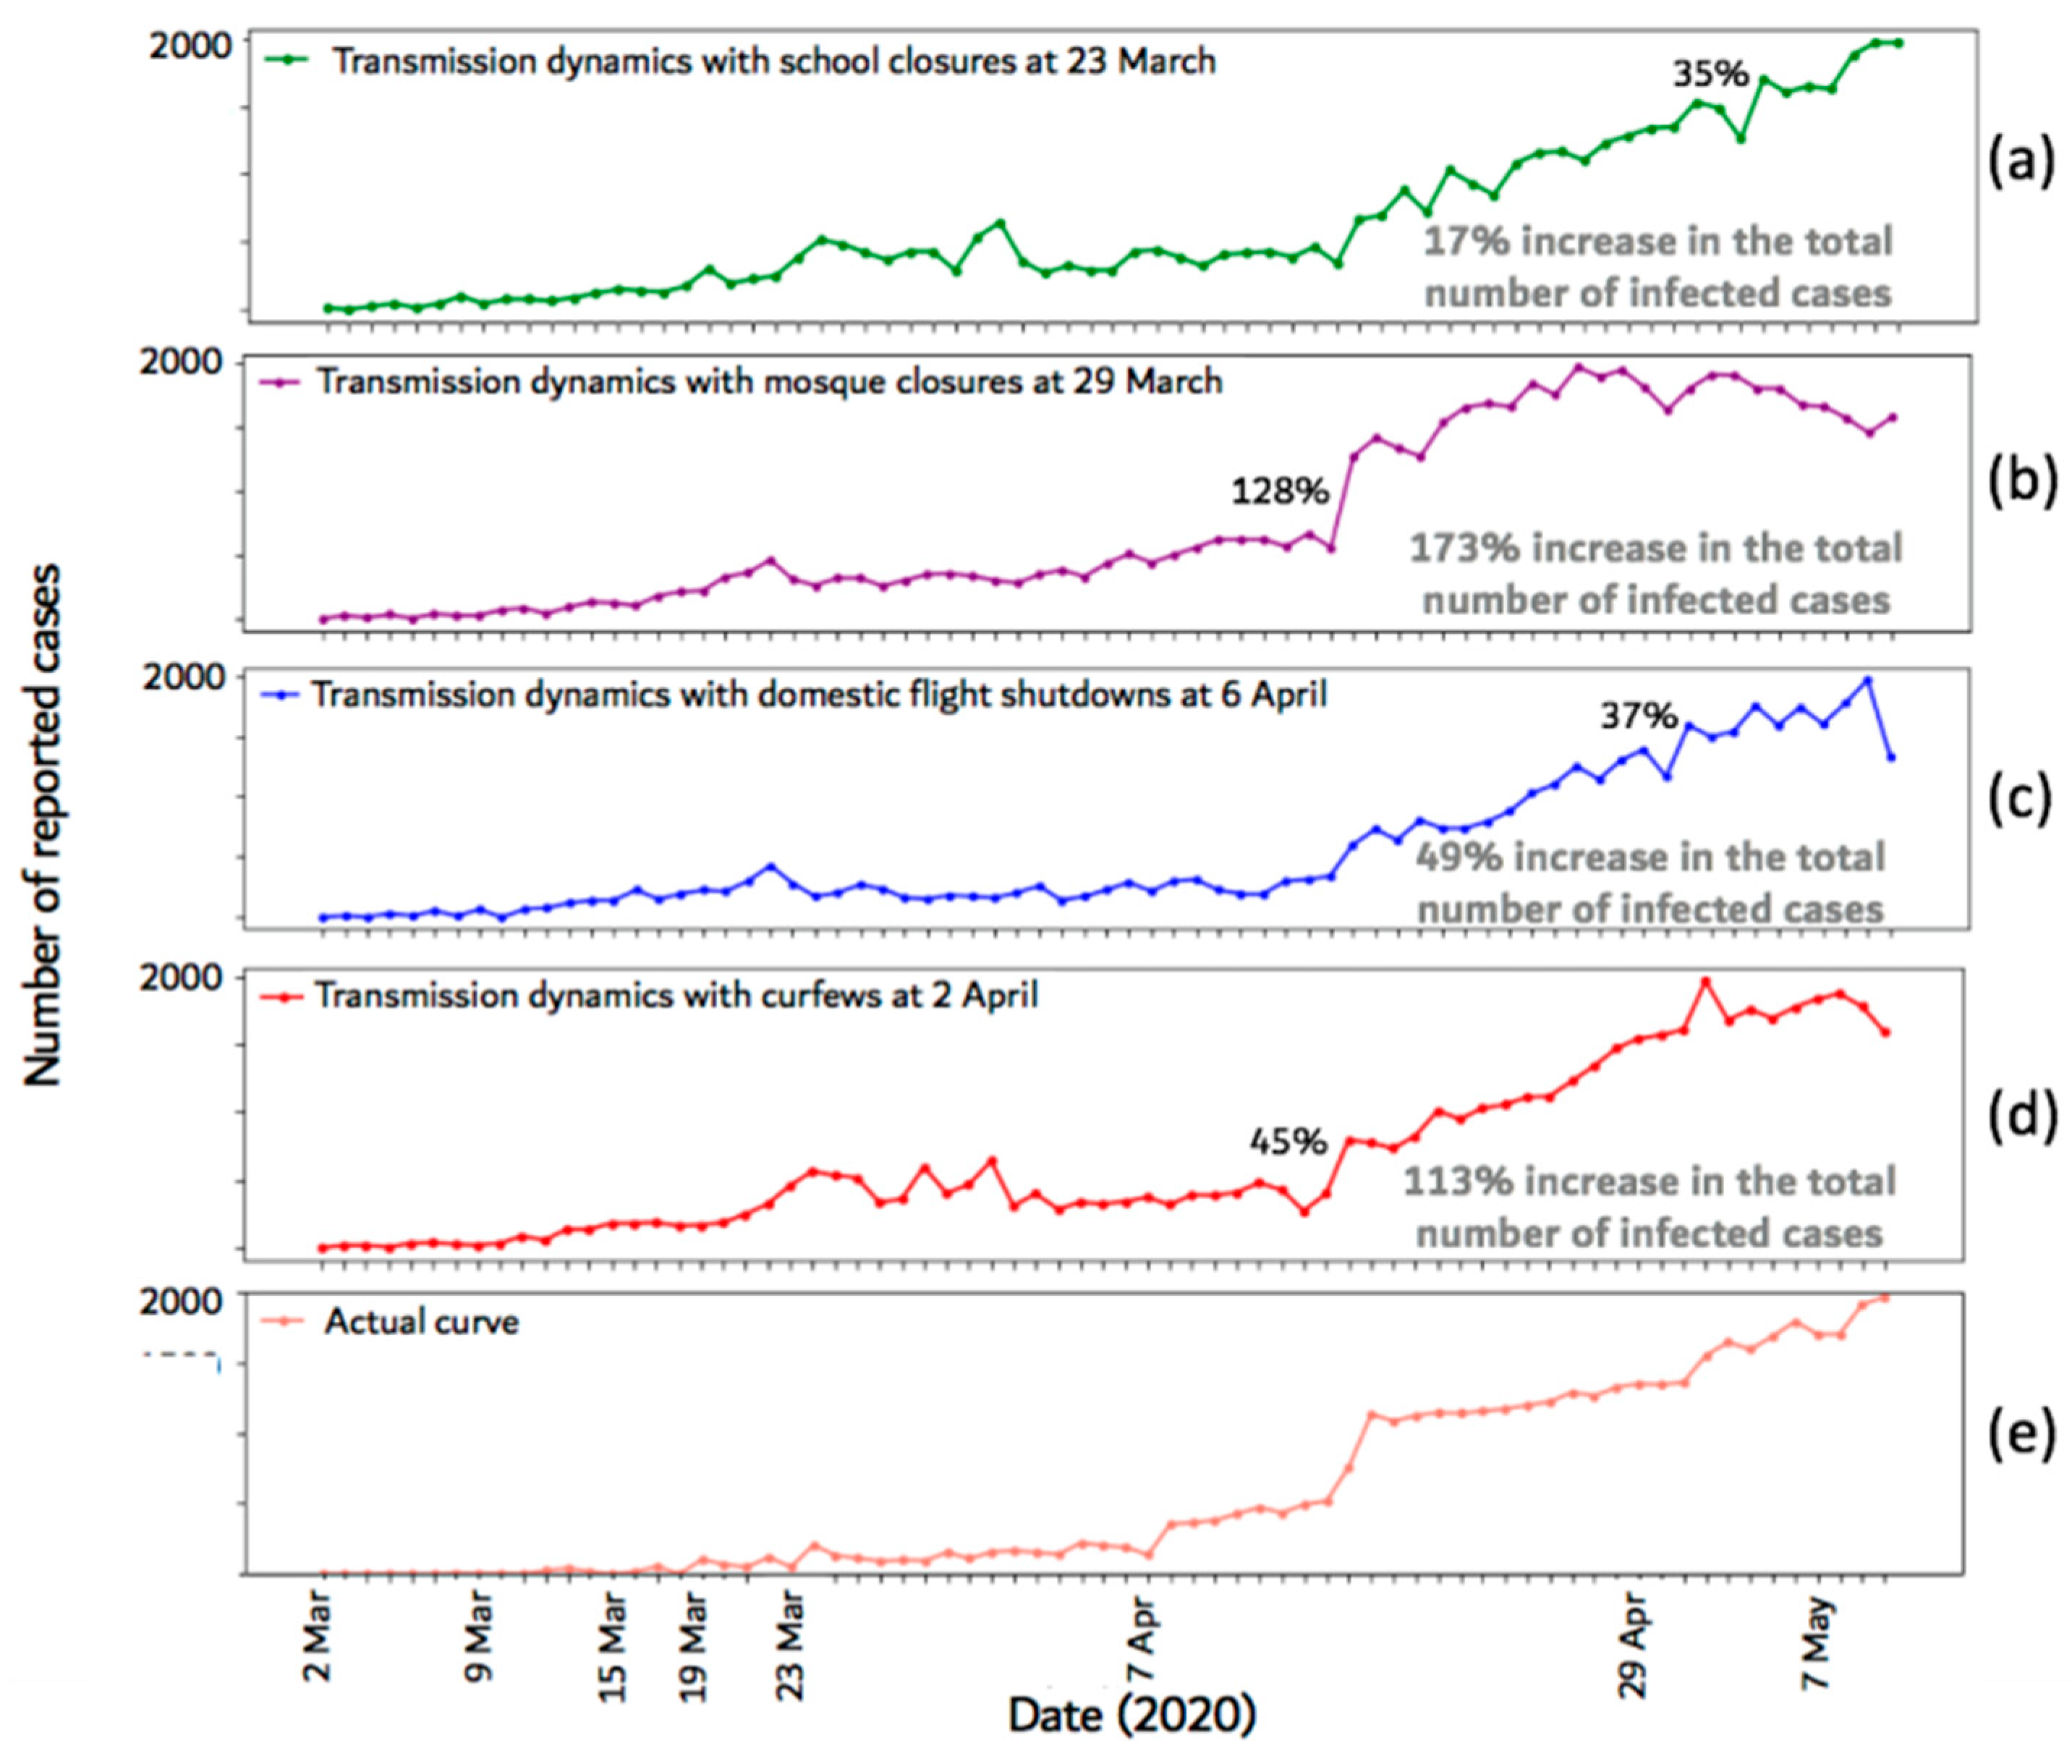
4.2. Effect of Control Measure Timing
4.3. Outbreak Prediction
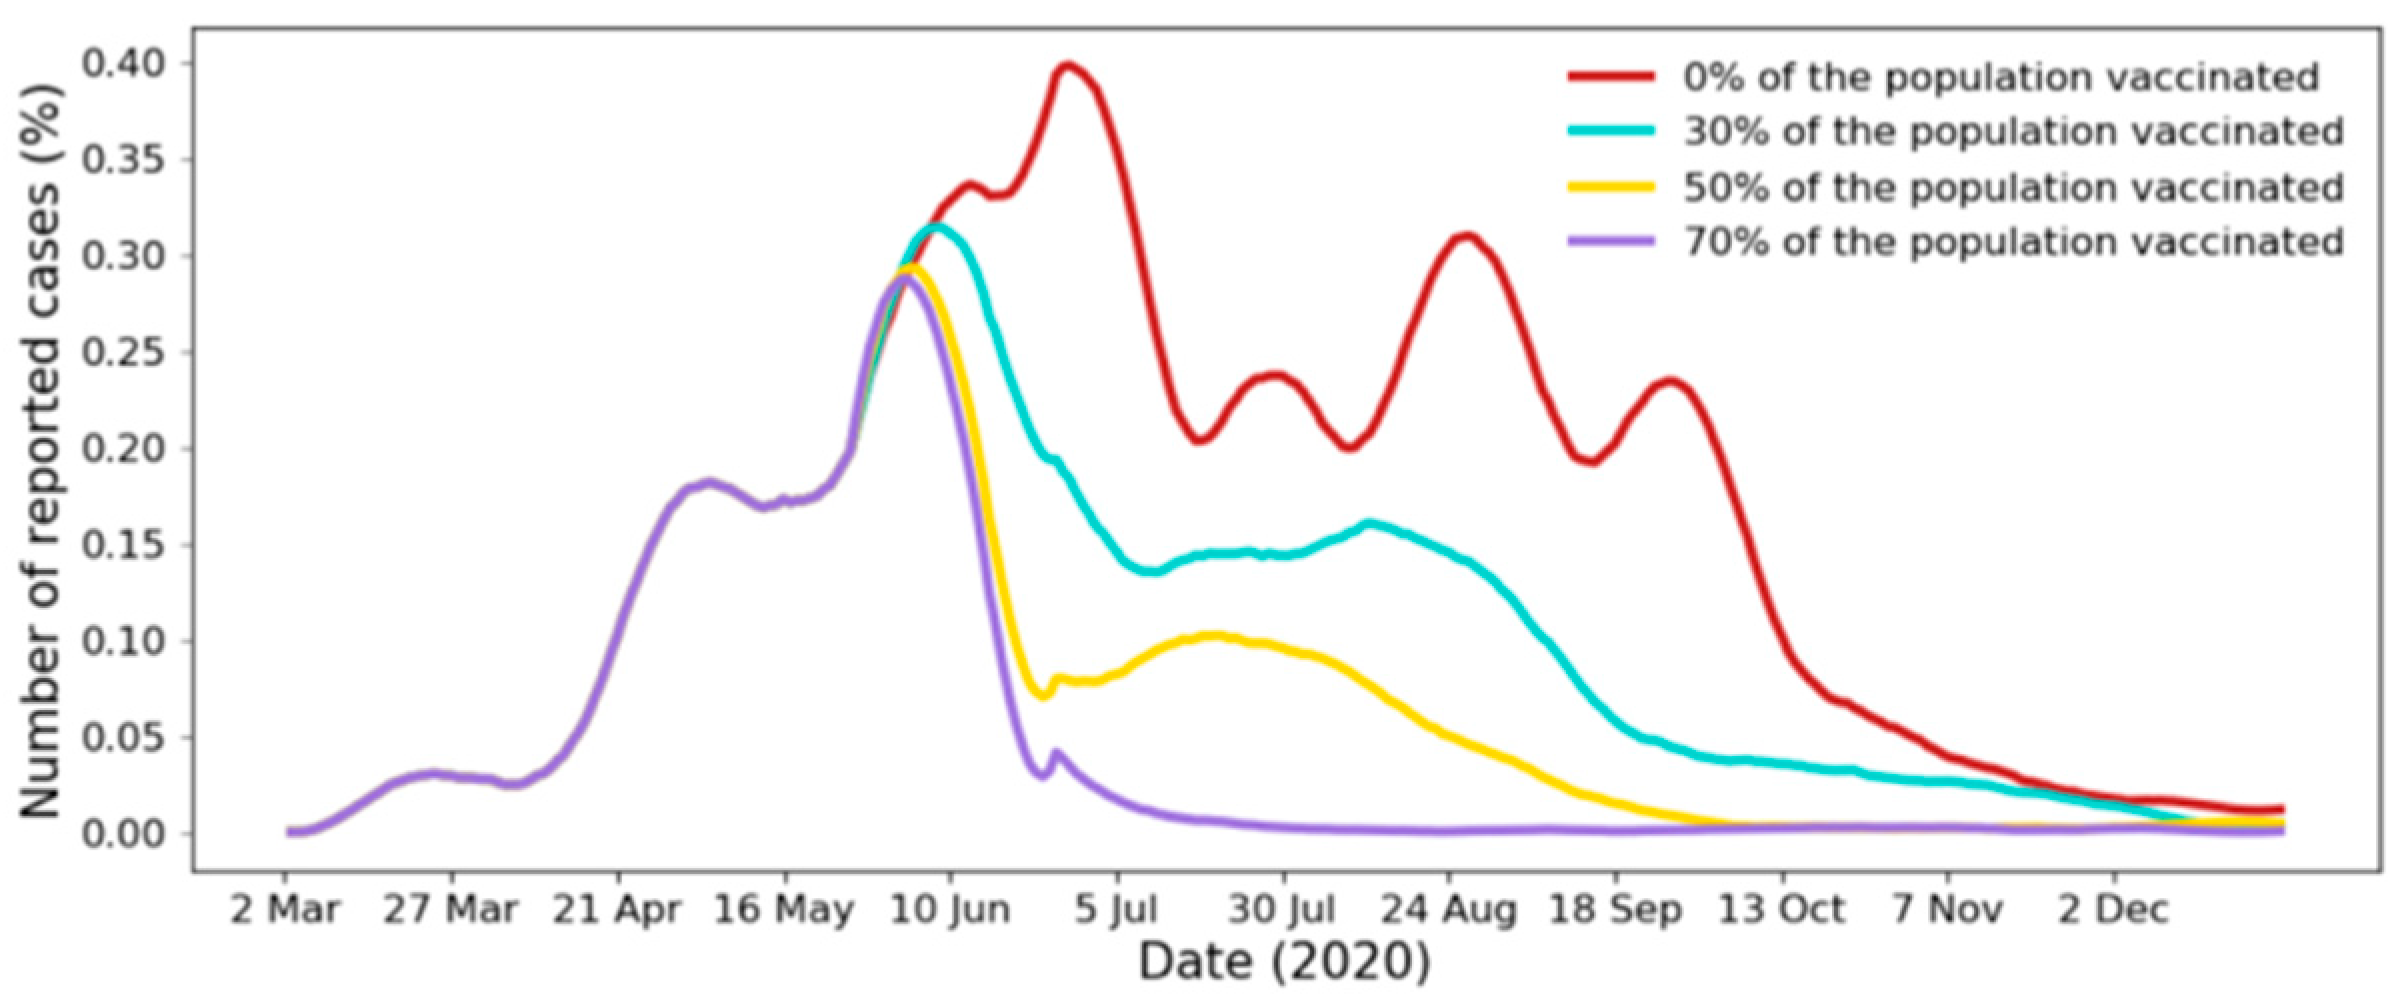
4.4. Effect of Vaccination
5. Discussion
5.1. Effect of Control Measures
5.2. Effect of Control Measure Timing
5.3. Outbreak Prediction
5.4. Effect of Vaccination
5.5. Limitations
6. Conclusions
Author Contributions
Funding
Acknowledgments
Conflicts of Interest
Appendix


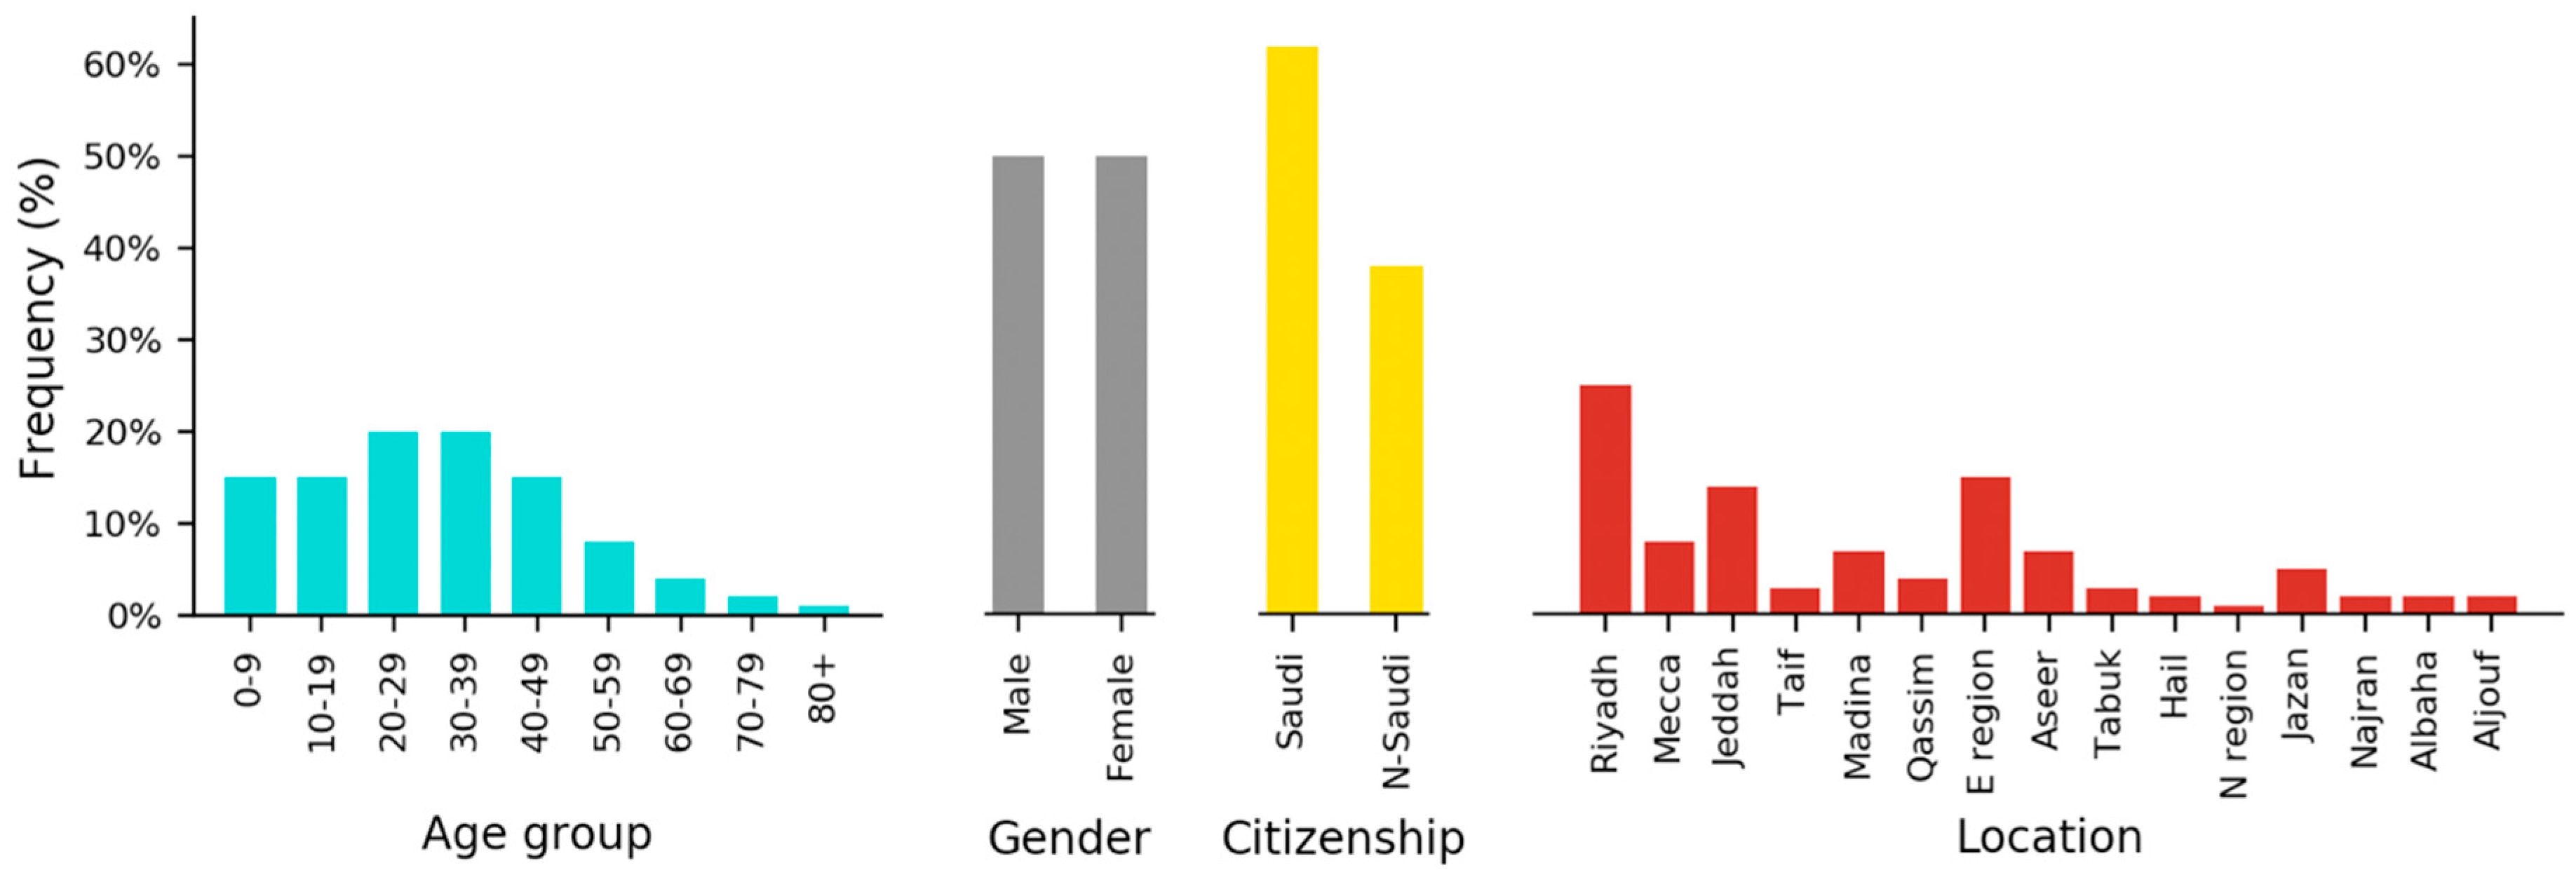
| Attribute | Values | Percent |
|---|---|---|
| Age group | 0–9 | 15% |
| 10–19 | 15% | |
| 20–29 | 20% | |
| 30–39 | 20% | |
| 40–49 | 15% | |
| 50–59 | 8% | |
| 60–69 | 4% | |
| 70–79 | 2% | |
| 80+ | 1% | |
| Gender | Male | 50% |
| Female | 50% | |
| Citizenship | Saudi | 62% |
| Non Saudi | 38% | |
| Location | Riyadh | 25% |
| Mecca | 8% | |
| Jeddah | 14% | |
| Taif | 3% | |
| Madina | 7% | |
| Qassim | 4% | |
| Eastern region | 15% | |
| Aseer | 7% | |
| Tabuk | 3% | |
| Hail | 2% | |
| Northern region | 1% | |
| Jazan | 5% | |
| Najran | 2% | |
| Albaha | 2% | |
| Aljouf | 2% |

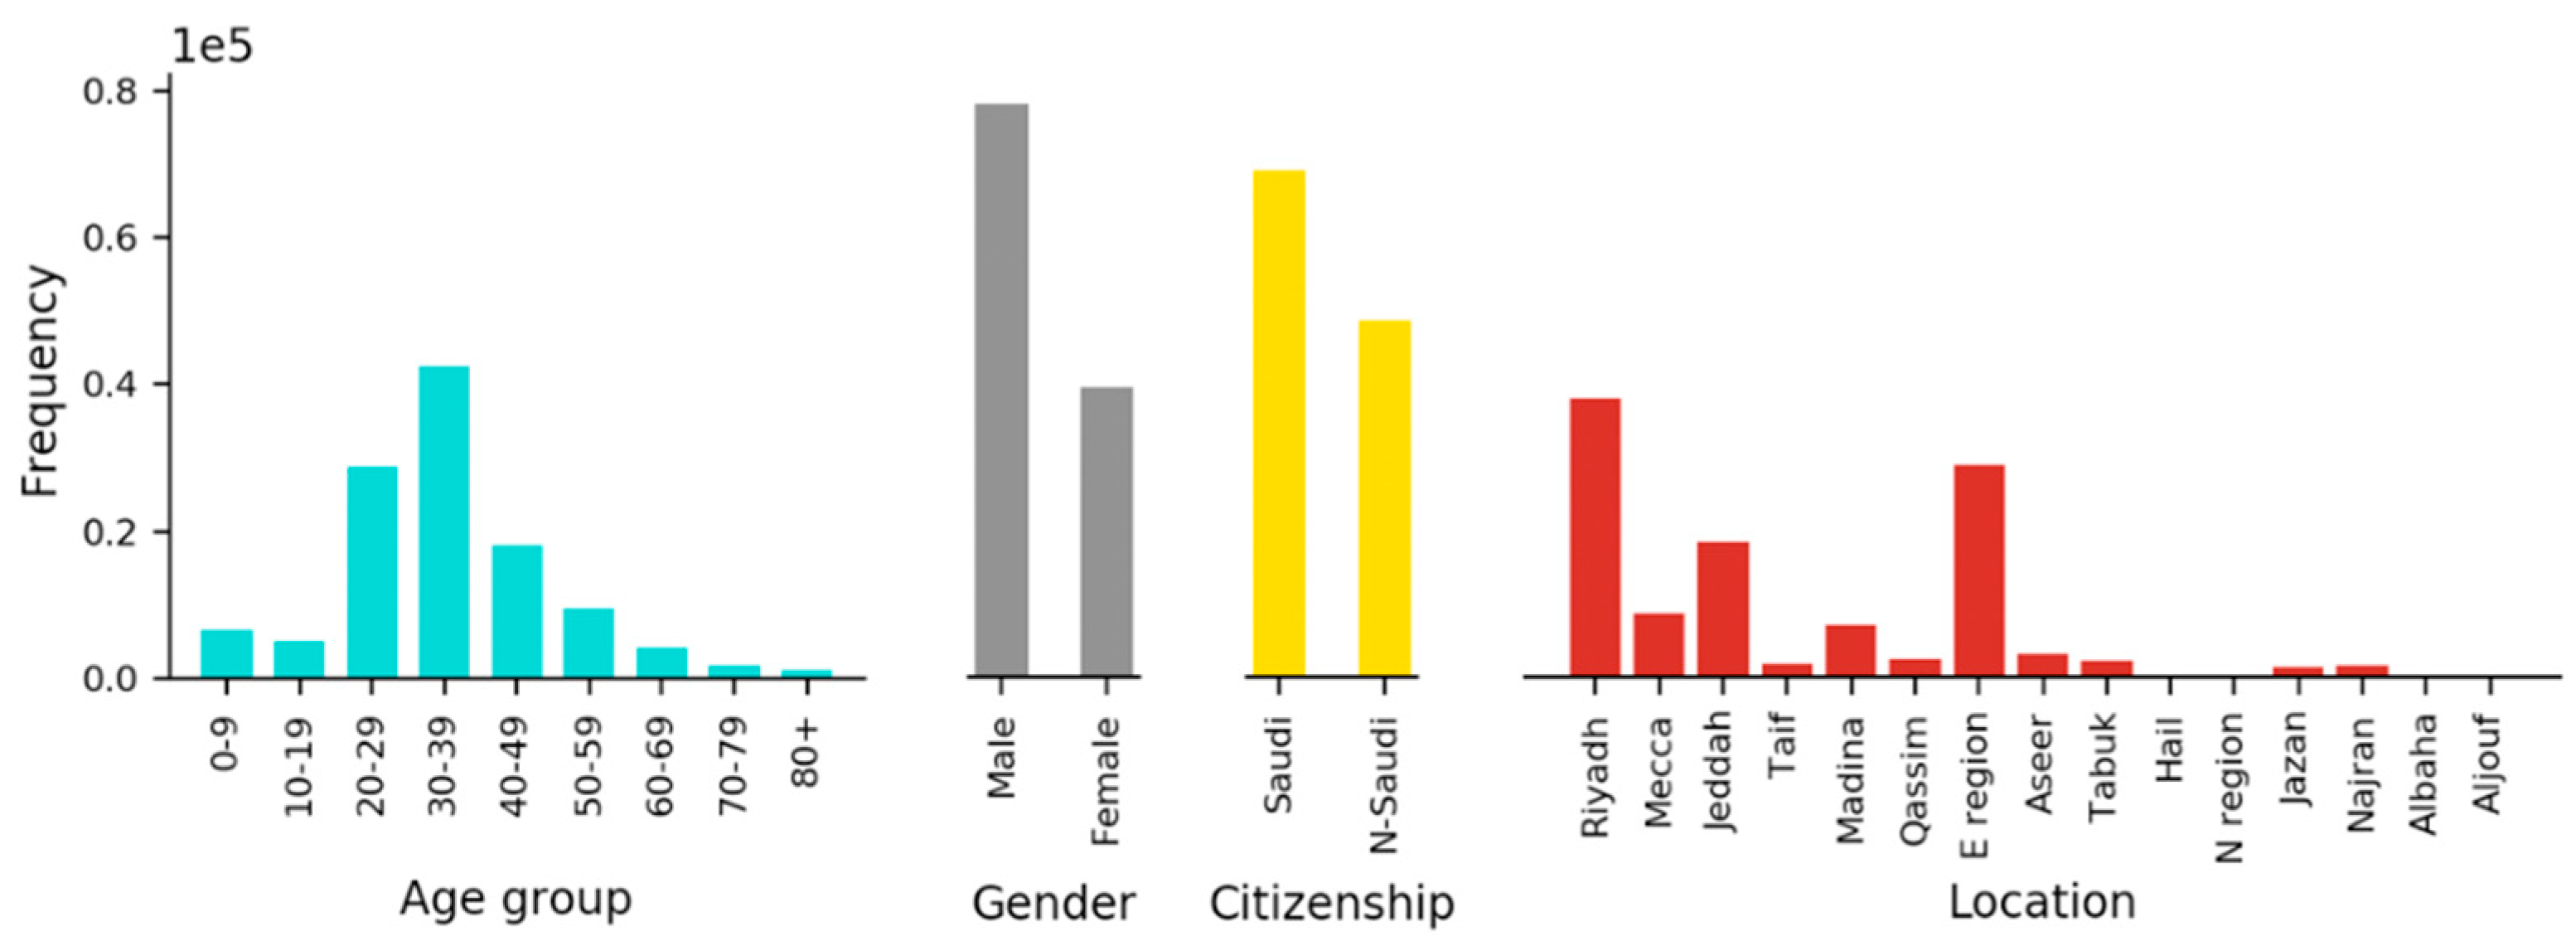
| Attribute | Value | Number of Individuals |
|---|---|---|
| Data size | 117,840 | |
| Age | 0–9 | 6601 |
| 10–19 | 5123 | |
| 20–29 | 28,785 | |
| 30–39 | 42,506 | |
| 40–49 | 18,226 | |
| 50–59 | 9382 | |
| 60–69 | 4232 | |
| 70–79 | 1813 | |
| 80+ | 1172 | |
| Gender | Male | 78,197 |
| Female | 39,643 | |
| Citizenship | Saudi | 69,126 |
| Non-Saudi | 48,715 | |
| Location | Riyadh | 38,142 |
| Mecca | 8813 | |
| Jeddah | 18,486 | |
| Taif | 2028 | |
| Madina | 7270 | |
| Qassim | 2675 | |
| Eastern region | 28,971 | |
| Aseer | 3249 | |
| Tabuk | 2420 | |
| Hail | 117 | |
| Northern region | 500 | |
| Jazan | 1502 | |
| Najran | 1711 | |
| Albaha | 454 | |
| Aljouf | 502 | |
| Test result | Positive | 9855 |
| Negative | 107,985 |

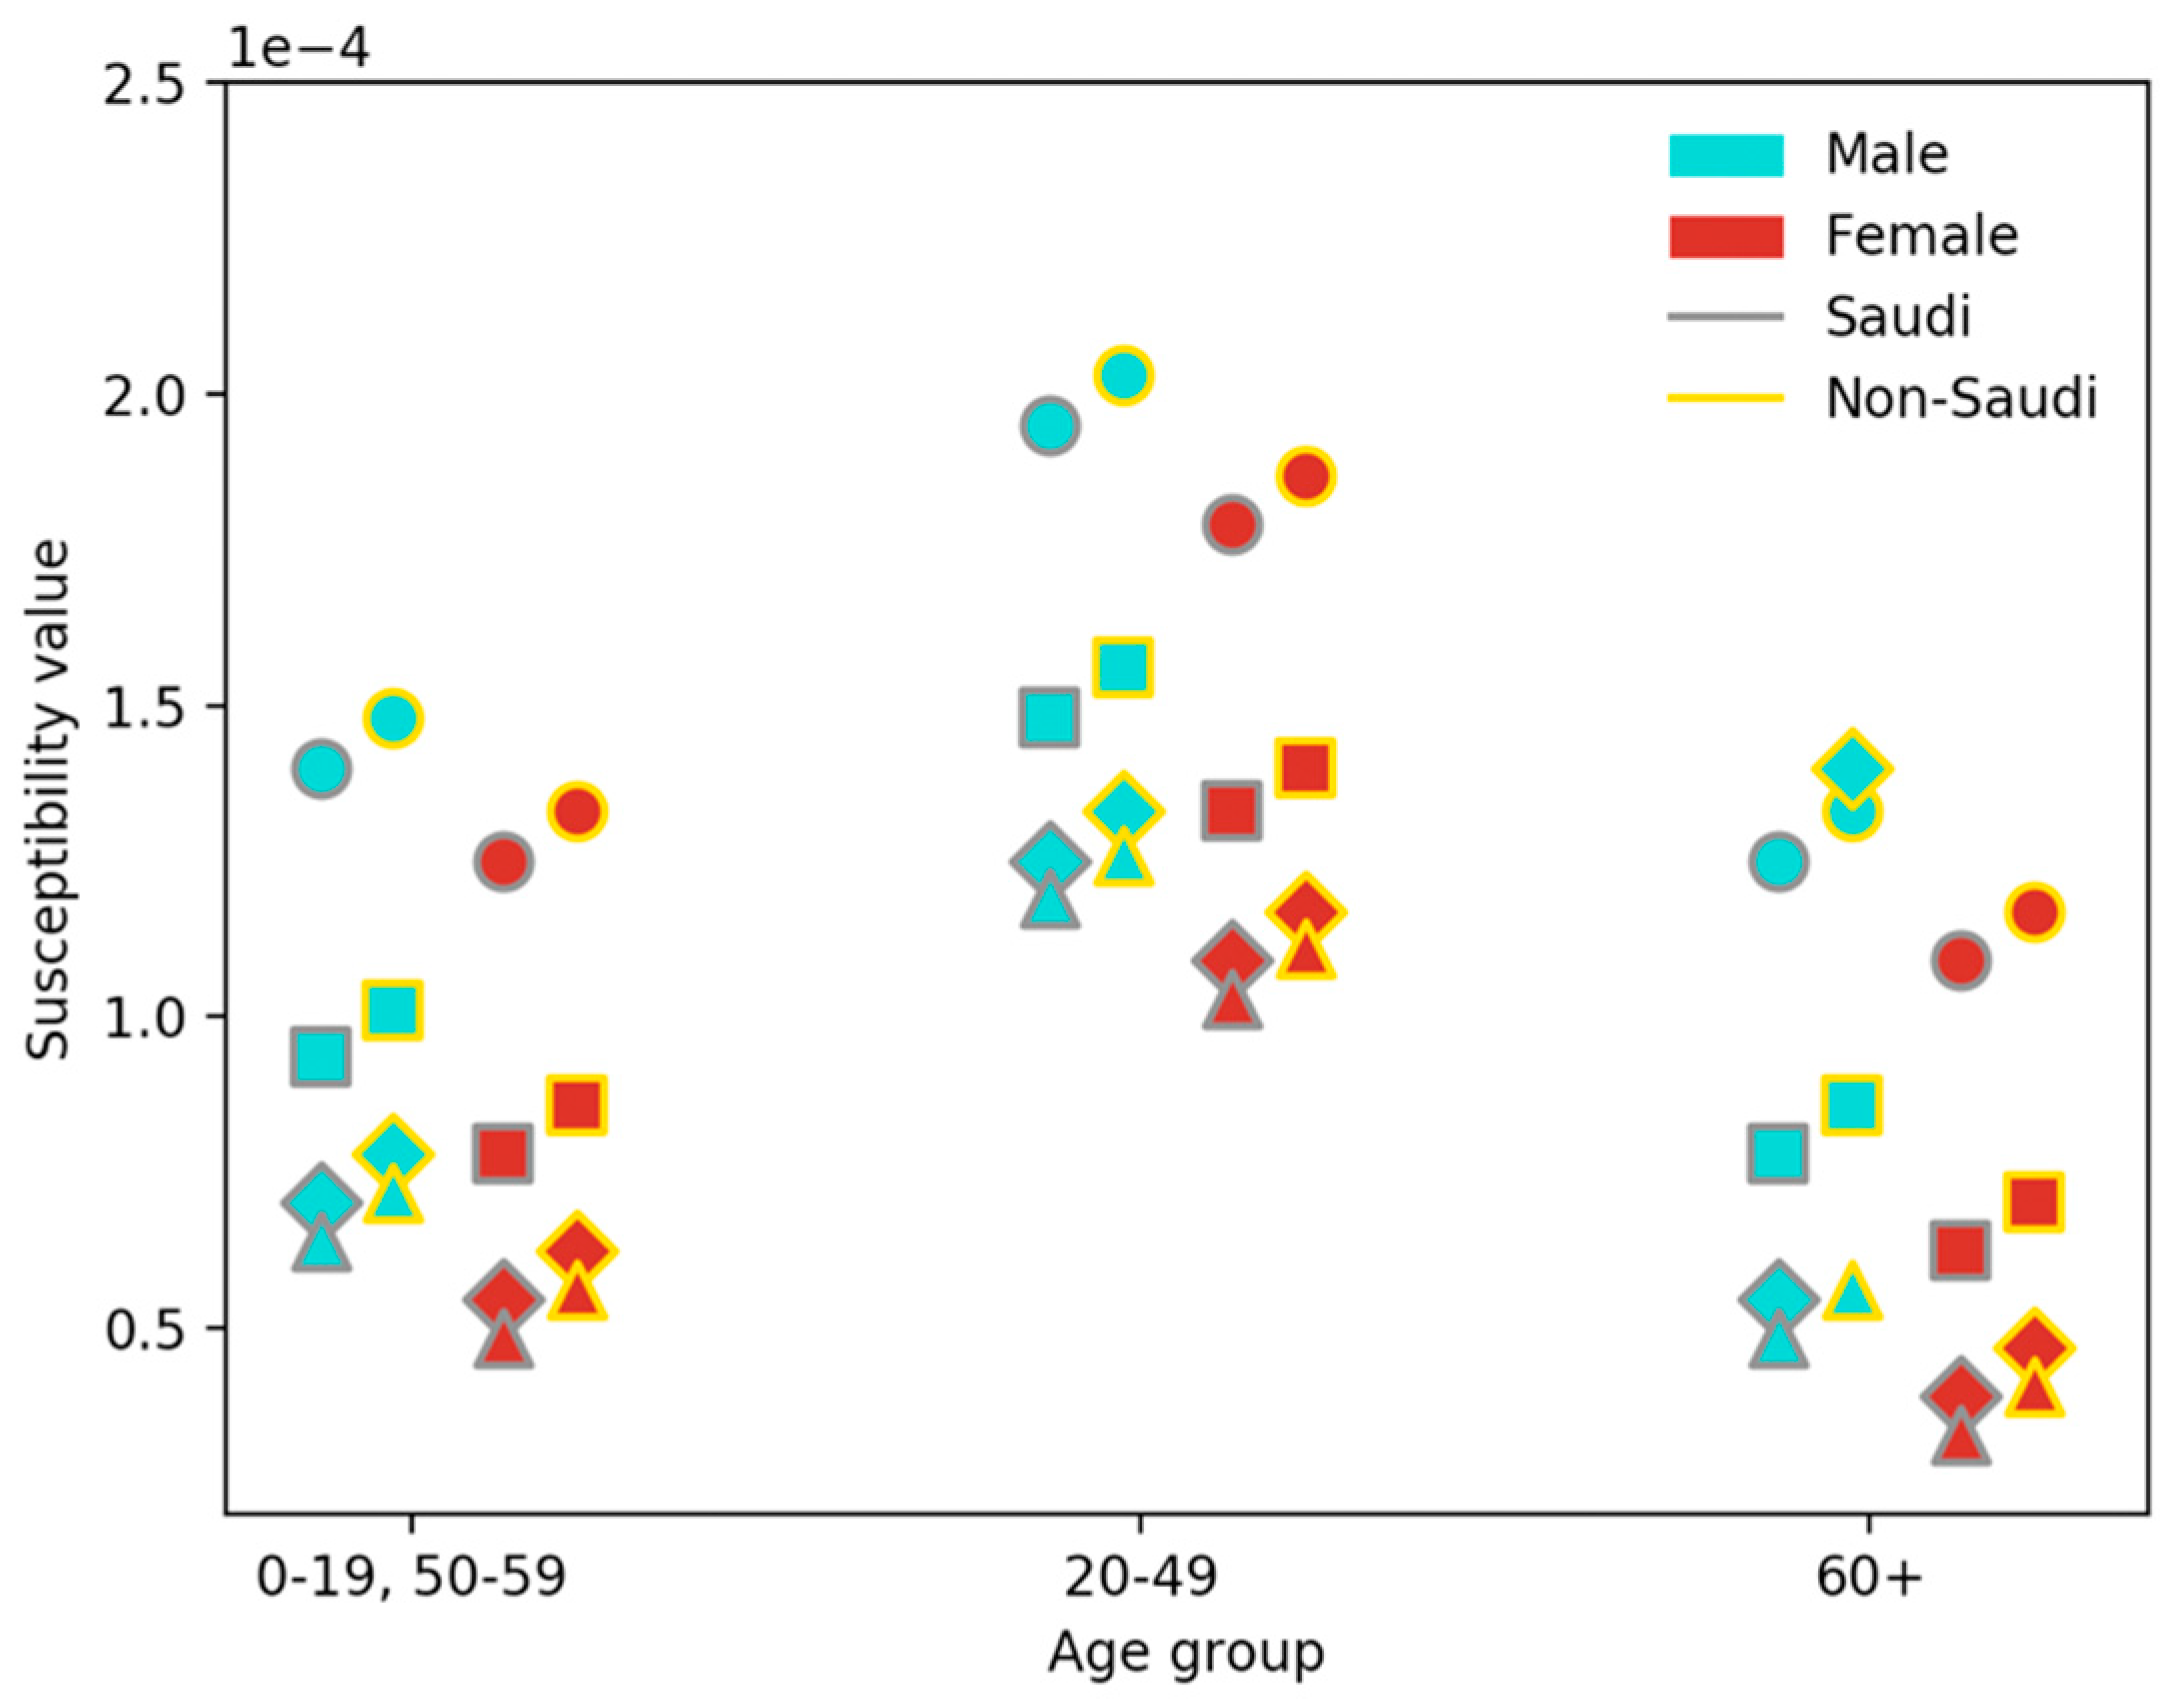
| Gender | Citizenship | Age Group | Location | Node Susceptibility Value |
|---|---|---|---|---|
| Male | Saudi | 0–19, 50–59 | Riyadh, Mecca, Jeddah, Eastern Reg. | 1.40 × 10−04 |
| Madina | 9.36 × 10−05 | |||
| Taif, Qassim, Aseer, Tabuk, Jazan, Najran | 7.02 × 10−05 | |||
| Hail, Northern Reg., Albaha, Aljouf | 6.40 × 10−05 | |||
| 20–49 | Riyadh, Mecca, Jeddah, Eastern Reg. | 1.95 × 10−04 | ||
| Madina | 1.48 × 10−04 | |||
| Taif, Qassim, Aseer, Tabuk, Jazan, Najran | 1.25 × 10−04 | |||
| Hail, Northern Reg., Albaha, Aljouf | 1.19 × 10−04 | |||
| ≥60 | Riyadh, Mecca, Jeddah, Eastern Reg. | 1.25 × 10−04 | ||
| Madina | 7.80 × 10−05 | |||
| Taif, Qassim, Aseer, Tabuk, Jazan, Najran | 5.46 × 10−05 | |||
| Hail, Northern Reg., Albaha, Aljouf | 4.84 × 10−05 | |||
| Non-Saudi | 0–19, 50–59 | Riyadh, Mecca, Jeddah, Eastern Reg. | 1.48 × 10−04 | |
| Madina | 1.01 × 10−04 | |||
| Taif, Qassim, Aseer, Tabuk, Jazan, Najran | 7.80 × 10−05 | |||
| Hail, Northern Reg., Albaha, Aljouf | 7.18 × 10−05 | |||
| 20–49 | Riyadh, Mecca, Jeddah, Eastern Reg. | 2.03 × 10−04 | ||
| Madina | 1.56 × 10−04 | |||
| Taif, Qassim, Aseer, Tabuk, Jazan, Najran | 1.33 × 10−04 | |||
| Hail, Northern Reg., Albaha, Aljouf | 1.26 × 10−04 | |||
| ≥60 | Riyadh, Mecca, Jeddah, Eastern Reg. | 1.33 × 10−04 | ||
| Madina | 8.58 × 10−05 | |||
| Taif, Qassim, Aseer, Tabuk, Jazan, Najran | 24 × 10−05 | |||
| Hail, Northern Reg., Albaha, Aljouf | 5.62 × 10−05 | |||
| Female | Saudi | 0–19, 50–59 | Riyadh, Mecca, Jeddah, Eastern Reg. | 1.25 × 10−04 |
| Madina | 7.80 × 10−05 | |||
| Taif, Qassim, Aseer, Tabuk, Jazan, Najran | 5.46 × 10−05 | |||
| Hail, Northern Reg., Albaha, Aljouf | 4.84 × 10−05 | |||
| 20–49 | Riyadh, Mecca, Jeddah, Eastern Reg. | 1.79 × 10−04 | ||
| Madina | 1.33 × 10−04 | |||
| Taif, Qassim, Aseer, Tabuk, Jazan, Najran | 1.09 × 10−04 | |||
| Hail, Northern Reg., Albaha, Aljouf | 1.03 × 10−04 | |||
| ≥60 | Riyadh, Mecca, Jeddah, Eastern Reg. | 1.09 × 10−04 | ||
| Madina | 6.24 × 10−05 | |||
| Taif, Qassim, Aseer, Tabuk, Jazan, Najran | 3.90 × 10−05 | |||
| Hail, Northern Reg., Albaha, Aljouf | 3.28 × 10−05 | |||
| Non-Saudi | 0–19, 50–59 | Riyadh, Mecca, Jeddah, Eastern Reg. | 1.33 × 10−04 | |
| Madina | 8.58 × 10−05 | |||
| Taif, Qassim, Aseer, Tabuk, Jazan, Najran | 6.24 × 10−05 | |||
| Hail, Northern Reg., Albaha, Aljouf | 5.62 × 10−05 | |||
| 20–49 | Riyadh, Mecca, Jeddah, Eastern Reg. | 1.87 × 10−04 | ||
| Madina | 1.40 × 10−04 | |||
| Taif, Qassim, Aseer, Tabuk, Jazan, Najran | 1.17 × 10−04 | |||
| Hail, Northern Reg., Albaha, Aljouf | 1.11 × 10−04 | |||
| ≥60 | Riyadh, Mecca, Jeddah, Eastern Reg. | 1.17 × 10−04 | ||
| Madina | 7.02 × 10−05 | |||
| Taif, Qassim, Aseer, Tabuk, Jazan, Najran | 4.68 × 10−05 | |||
| Hail, Northern Reg., Albaha, Aljouf | 4.06 × 10−05 |
References
- Benvenuto, D.; Giovanetti, M.; Vassallo, L.; Angeletti, S.; Ciccozzi, M. Application of the ARIMA model on the COVID-2019 epidemic dataset. Data Brief 2020, 105340. [Google Scholar] [CrossRef] [PubMed]
- Yang, Z.; Zeng, Z.; Wang, K.; Wong, S.S.; Liang, W.; Zanin, M.; Liu, P.; Cao, X.; Gao, Z.; Mai, Z.; et al. Modified SEIR and AI prediction of the epidemics trend of COVID-19 in China under public health interventions. J. Thorac. Dis. 2020, 12, 165. [Google Scholar] [CrossRef] [PubMed]
- Lin, Q.; Zhao, S.; Gao, D.; Lou, Y.; Yang, S.; Musa, S.S.; Wang, M.H.; Cai, Y.; Wang, W.; Yang, L.; et al. A conceptual model for the coronavirus disease 2019 (COVID-19) outbreak in Wuhan, China with individual reaction and governmental action. Int. J. Infect. Dis. 2020, 93, 211–216. [Google Scholar] [CrossRef] [PubMed]
- Tang, B.; Wang, X.; Li, Q.; Bragazzi, N.L.; Tang, S.; Xiao, Y.; Wu, J. Estimation of the transmission risk of the 2019-nCoV and its implication for public health interventions. J. Clin. Med. 2020, 9, 462. [Google Scholar] [CrossRef] [Green Version]
- Fanelli, D.; Piazza, F. Analysis and forecast of COVID-19 spreading in China, Italy and France. Chaos Solitons Fractals 2020, 134, 109761. [Google Scholar] [CrossRef]
- Fang, Y.; Nie, Y.; Penny, M. Transmission dynamics of the COVID19 outbreak and effectiveness of government interventions: A data-driven analysis. J. Med. Virol. 2020, 92, 645–659. [Google Scholar] [CrossRef] [Green Version]
- Yen, M.Y.; Schwartz, J.; Chen, S.Y.; King, C.C.; Yang, G.Y.; Hsueh, P.R. Interrupting COVID-19 transmission by implementing enhanced traffic control bundling: Implications for global prevention and control efforts. J. Microbiol. Immunol. Infect. 2020, 53, 377–380. [Google Scholar] [CrossRef]
- Hellewell, J.; Abbott, S.; Gimma, A.; Bosse, N.I.; Jarvis, C.I.; Russell, T.W.; Munday, J.D.; Kucharski, A.J.; Edmunds, W.J.; Sun, F.; et al. Feasibility of controlling COVID-19 outbreaks by isolation of cases and contacts. Lancet Glob. Health 2020, 8. [Google Scholar] [CrossRef] [Green Version]
- Zhao, S.; Chen, H. Modeling the epidemic dynamics and control of COVID-19 outbreak in China. Quant. Biol. 2020, 8, 1–9. [Google Scholar] [CrossRef] [Green Version]
- Rong, X.; Yang, L.; Chu, H.; Fan, M. Effect of delay in diagnosis on transmission of COVID-19. Math. Biosci. Eng. 2020, 17, 2725–2740. [Google Scholar] [CrossRef]
- Peirlinck, M.; Linka, K.; Costabal, F.S.; Kuhl, E. Outbreak dynamics of COVID-19 in China and the United States. Biomech. Modeling Mechanobiol. 2020, 1. [Google Scholar] [CrossRef] [PubMed]
- Liu, F.; Li, X.; Zhu, G. Using the contact network model and Metropolis-Hastings sampling to reconstruct the COVID-19 spread on the Diamond Princess. Sci. Bull. 2020, 65, 1297–1305. [Google Scholar] [CrossRef] [PubMed]
- Ferguson, N.; Laydon, D.; Nedjati-Gilani, G.; Imai, N.; Ainslie, K.; Baguelin, M.; Bhatia, S.; Boonyasiri, A.; Cucunubá, Z.; Cuomo-Dannenburg, G.; et al. Report 9: Impact of non-pharmaceutical interventions (NPIs) to reduce COVID19 mortality and healthcare demand. Imp. Coll. Lond. 2020, 10, 77482. [Google Scholar]
- Kermack, W.O.; McKendrick, A.G. A contribution to the mathematical theory of epidemics. Proc. R. Soc. Lond. Ser. A 1927, 115, 700–721. [Google Scholar]
- Anderson, R.M.; May, R.M. Infectious Diseases of Humans: Dynamics and Control; Oxford University Press: Oxford, UK, 1992; ISBN 978-019-854-040-3. [Google Scholar]
- Manzo, G. Complex Social Networks are Missing in the Dominant COVID-19 Epidemic Models. Sociologica 2020, 14, 31–49. [Google Scholar] [CrossRef]
- Keeling, M.J.; Eames, K.T. Networks and epidemic models. J. R. Soc. Interface 2005, 2, 295–307. [Google Scholar] [CrossRef] [Green Version]
- Danon, L.; Ford, A.P.; House, T.; Jewell, C.P.; Keeling, M.J.; Roberts, G.O.; Ross, J.V.; Vernon, M.C. Networks and the epidemiology of infectious disease. Interdiscip. Perspect. Infect. Dis. 2011, 2011. [Google Scholar] [CrossRef]
- Miller, J.C.; Kiss, I.Z. Epidemic spread in networks: Existing methods and current challenges. Math. Modeling Nat. Phenom. 2014, 9, 4–42. [Google Scholar] [CrossRef] [Green Version]
- Alboaneen, D.; Pranggono, B.; Alshammari, D.; Alqahtani, N.; Alyaffer, R. Predicting the Epidemiological Outbreak of the Coronavirus Disease 2019 (COVID-19) in Saudi Arabia. Int. J. Environ. Res. Public Health 2020, 17, 4568. [Google Scholar] [CrossRef]
- Alharbi, Y.; Alqahtani, A.; Albalawi, O.; Bakouri, M. Epidemiological Modeling of COVID-19 in Saudi Arabia: Spread Projection, Awareness, and Impact of Treatment. Appl. Sci. 2020, 10, 5895. [Google Scholar] [CrossRef]
- Aletreby, W.T.; Alharthy, A.M.; Faqihi, F.; Mady, A.F.; Ramadan, O.E.; Huwait, B.M.; Alodat, M.A.; Lahmar, A.B.; Mahmood, N.N.; Mumtaz, S.A.; et al. Dynamics of SARS-CoV-2 outbreak in the Kingdom of Saudi Arabia: A predictive model. Saudi Crit. Care J. 2020, 4, 79. [Google Scholar] [CrossRef]
- Komies, S.; Aldhahir, A.M.; Alghamdi, S.M.; Alqarni, A.; Oyelade, T.; Alqahtani, J.S. COVID-19 Outcomes in Saudi Arabia and the UK: A Tale of Two Kingdoms. medRxiv 2020. [Google Scholar] [CrossRef]
- Hou, C.; Chen, J.; Zhou, Y.; Hua, L.; Yuan, J.; He, S.; Guo, Y.; Zhang, S.; Jia, Q.; Zhao, C.; et al. The effectiveness of quarantine of Wuhan city against the Corona Virus Disease 2019 (COVID-19): A well-mixed SEIR model analysis. J. Med. Virol. 2020, 92, 841–848. [Google Scholar] [CrossRef] [PubMed] [Green Version]
- Kraemer, M.U.; Yang, C.H.; Gutierrez, B.; Wu, C.H.; Klein, B.; Pigott, D.M.; Du Plessis, L.; Faria, N.R.; Li, R.; Hanage, W.P.; et al. The effect of human mobility and control measures on the COVID-19 epidemic in China. Science 2020, 368, 493–497. [Google Scholar] [CrossRef] [Green Version]
- Weston, S.; Frieman, M.B. COVID-19: Knowns, Unknowns, and Questions. mSphere 2020, 5. [Google Scholar] [CrossRef] [Green Version]
- Yuen, K.S.; Ye, Z.W.; Fung, S.Y.; Chan, C.P.; Jin, D.Y. SARS-CoV-2 and COVID-19: The most important research questions. Cell Biosci. 2020, 10, 1–5. [Google Scholar] [CrossRef] [Green Version]
- Roosa, K.; Lee, Y.; Luo, R.; Kirpich, A.; Rothenberg, R.; Hyman, J.M.; Yan, P.; Chowell, G. Real-time forecasts of the COVID-19 epidemic in China from February 5th to February 24th, 2020. Infect. Dis. Modeling 2020, 5, 256–263. [Google Scholar] [CrossRef]
- Meyers, L. Contact network epidemiology: Bond percolation applied to infectious disease prediction and control. Bull. Am. Math. Soc. 2007, 44, 63–86. [Google Scholar] [CrossRef] [Green Version]
- Miller, J.C.; Slim, A.C.; Volz, E.M. Edge-based compartmental modeling for infectious disease spread. J. R. Soc. Interface 2012, 9, 890–906. [Google Scholar] [CrossRef] [Green Version]
- Bansal, S.; Grenfell, B.T.; Meyers, L.A. When individual behaviour matters: Homogeneous and network models in epidemiology. J. R. Soc. Interface 2007, 4, 879–891. [Google Scholar] [CrossRef] [Green Version]
- Meyers, L.A.; Pourbohloul, P.; Newman, M.E.; Skowronski, D.M.; Brunham, R.C. Network theory and SARS: Predicting outbreak diversity. J. Theor. Biol. 2005, 232, 71–81. [Google Scholar] [CrossRef] [PubMed]
- Bian, L.; Huang, Y.; Mao, L.; Lim, E.; Lee, G.; Yang, Y.; Cohen, M.; Wilson, D. Modeling individual vulnerability to communicable diseases: A framework and design. Ann. Assoc. Am. Geogr. 2012, 102, 1016–1025. [Google Scholar] [CrossRef]
- Salathe, M.; Jones, J.H. Dynamics and control of diseases in networks with community structure. Plos Comput. Biol. 2010, 6. [Google Scholar] [CrossRef]
- Volz, E. SIR dynamics in random networks with heterogeneous connectivity. J. Math. Biol. 2008, 56, 293–310. [Google Scholar] [CrossRef] [PubMed]
- Eagle, N.; Pentland, A.S. Reality mining: Sensing complex social systems. Pers. Ubiquitous Comput. 2006, 10, 255–268. [Google Scholar] [CrossRef]
- Read, J.M.; Keeling, M.J. Disease evolution on networks: The role of contact structure. Proc. R. Soc. Lond. Ser. B 2003, 270, 699–708. [Google Scholar] [CrossRef] [Green Version]
- Ball, F.; Britton, T.; Leung, K.Y.; Sirl, D. A stochastic SIR network epidemic model with preventive dropping of edges. J. Math. Biol. 2019, 78, 1875–1951. [Google Scholar] [CrossRef] [Green Version]
- Mossong, J.; Hens, N.; Jit, M.; Beutels, P.; Auranen, K.; Mikolajczyk, R.; Massari, M.; Salmaso, S.; Tomba, G.S.; Wallinga, J.; et al. Social contacts and mixing patterns relevant to the spread of infectious diseases. PLoS Med. 2008, 5. [Google Scholar] [CrossRef]
- Kiss, I.Z.; Green, D.M.; Kao, R.R. The effect of network mixing patterns on epidemic dynamics and the efficacy of disease contact tracing. J. R. Soc. Interface 2008, 5, 791–799. [Google Scholar] [CrossRef]
- Grijalva, C.G.; Goeyvaerts, N.; Verastegui, H.; Edwards, K.M.; Gil, A.I.; Lanata, C.F.; Hens, N. A household-based study of contact networks relevant for the spread of infectious diseases in the highlands of Peru. PLoS ONE 2015, 10. [Google Scholar] [CrossRef]
- Ajelli, M.; Litvinova, M. Estimating contact patterns relevant to the spread of infectious diseases in Russia. J. Theor. Biol. 2017, 419, 1–7. [Google Scholar] [CrossRef] [PubMed]
- Prem, K.; Liu, Y.; Russell, T.W.; Kucharski, A.J.; Eggo, R.M.; Davies, N.; Flasche, S.; Clifford, S.; Pearson, C.A.; Munday, J.D.; et al. The effect of control strategies to reduce social mixing on outcomes of the COVID-19 epidemic in Wuhan, China: A modeling study. Lancet Public Health 2020, 5, e261–e270. [Google Scholar] [CrossRef] [Green Version]
- Ferguson, N.M.; Cummings, D.A.; Fraser, C.; Cajka, J.C.; Cooley, P.C.; Burke, D.S. Strategies for mitigating an influenza pandemic. Nature 2006, 442, 448–452. [Google Scholar] [CrossRef] [PubMed]
- Halloran, M.E.; Ferguson, N.M.; Eubank, S.; Longini, I.M.; Cummings, D.A.; Lewis, B.; Xu, S.; Fraser, C.; Vullikanti, A.; Germann, T.C.; et al. Modeling targeted layered containment of an influenza pandemic in the United States. Proc. Natl. Acad. Sci. USA 2008, 105, 4639–4644. [Google Scholar] [CrossRef] [PubMed] [Green Version]
- Watts, D.J.; Strogatz, S.H. Collective dynamics of small-world networks. Nature 1998, 393, 440. [Google Scholar] [CrossRef]
- Abbey, H. An examination of the Reed-Frost theory of epidemics. Hum. Biol. 1952, 24, 201. [Google Scholar] [PubMed]
- Ahmed, Q.A.; Memish, Z.A. The cancellation of mass gatherings (MGs)? Decision making in the time of COVID-19. Travel Med. Infect. Dis. 2020, 101631. [Google Scholar] [CrossRef] [PubMed]
- Barry, M.; Al Amri, M.; Memish, Z.A. COVID-19 in the Shadows of MERS-CoV in the Kingdom of Saudi Arabia. J. Epidemiol. Glob. Health 2020, 10, 1–3. [Google Scholar] [CrossRef] [PubMed] [Green Version]
- Ebrahim, S.H.; Memish, Z.A. COVID-19-the role of mass gatherings. Travel Med. Infect. Dis. 2020, 101617. [Google Scholar] [CrossRef]
- Ebrahim, S.H.; Memish, Z.A. COVID-19: Preparing for superspreader potential among Umrah pilgrims to Saudi Arabia. Lancet 2020, 395, e48. [Google Scholar] [CrossRef] [Green Version]
- Ebrahim, S.H.; Memish, Z.A. Saudi Arabia’s drastic measures to curb the COVID-19 outbreak: Temporary suspension of the Umrah pilgrimage. J. Travel Med. 2020, 27. [Google Scholar] [CrossRef] [Green Version]
- Ministry of Health News. Available online: https://www.moh.gov.sa/Ministry/MediaCenter/News/Pages/News-2020-03-02-002.aspx (accessed on 20 April 2020).
- (Covid-19) Disease Interactive Dashboard. Available online: https://covid19.cdc.gov.sa/daily-updates/ (accessed on 18 June 2020).
- Humanitarian Data Exchange—Novel Coronavirus (COVID-19) Cases Data. Available online: https://data.humdata.org/dataset/novel-coronavirus-2019-ncov-cases (accessed on 18 June 2020).
- Ministry of Health. Available online: https://www.moh.gov.sa (accessed on 20 June 2020).
- Ministry of Health News. Available online: https://www.moh.gov.sa/en/Ministry/MediaCenter/News/Pages/News-2020-03-04-005.aspx (accessed on 20 April 2020).
- Saudi Press Agency. Available online: https://www.spa.gov.sa/2043312 (accessed on 15 May 2020).
- Networkx–Networkx Documentation. Available online: https://networkx.github.io (accessed on 25 April 2020).
- Prem, K.; Cook, A.R.; Jit, M. Projecting social contact matrices in 152 countries using contact surveys and demographic data. PLoS Comput. Biol. 2017, 13, e1005697. [Google Scholar] [CrossRef]
- General Authority for Statistics. Available online: https://www.stats.gov.sa (accessed on 28 April 2020).
- General Authority for Statistics. Population based on gender, age group, and nationality. Available online: https://www.stats.gov.sa/ar/5277 (accessed on 28 April 2020).
- eneral Authority for Statistics. 2010. Population Distribution over the Main Administrative Regions Based on Gender and Nationality. Available online: https://www.stats.gov.sa/sites/default/files/twzy_lskn_fy_lmnzq_ldry.xlsx (accessed on 30 April 2020).
- Bearman, P.S.; Moody, J.; Stovel, K. Chains of affection: The structure of adolescent romantic and sexual networks. Am. J. Sociol. 2004, 110, 44–91. [Google Scholar] [CrossRef] [Green Version]
- Al-Khraif, R.; Abdul Salam, A.; Abdul Rashid, M.F. Family Demographic Transition in Saudi Arabia: Emerging Issues and Concerns. SAGE Open 2020, 10, 2158244020914556. [Google Scholar] [CrossRef] [Green Version]
- Newman, M.E. The structure and function of complex networks. Siam Rev. 2003, 45, 167–256. [Google Scholar] [CrossRef] [Green Version]
- Newman, M.E.; Girvan, M. Finding and evaluating community structure in networks. Phys. Rev. E 2004, 69, 026113. [Google Scholar] [CrossRef] [PubMed] [Green Version]
- Eubank, S.; Guclu, H.; Kumar, V.A.; Marathe, M.V.; Srinivasan, A.; Toroczkai, Z.; Wang, N. Modeling disease outbreaks in realistic urban social networks. Nature 2004, 429, 180–184. [Google Scholar] [CrossRef]
- Gong, K.; Tang, M.; Hui, P.M.; Zhang, H.F.; Younghae, D.; Lai, Y.C. An efficient immunization strategy for community networks. PLoS ONE 2013, 8. [Google Scholar] [CrossRef]
- Volz, E.; Meyers, L.A. Susceptible-infected-recovered epidemics in dynamic contact networks. Proc. R. Soc. B 2007, 274, 2925–2934. [Google Scholar] [CrossRef] [Green Version]
- Stegehuis, C.; Van Der Hofstad, R.; Van Leeuwaarden, J.S. Epidemic spreading on complex networks with community structures. Sci. Rep. 2016, 6, 1–7. [Google Scholar] [CrossRef]
- Staudt, C.L.; Hamann, M.; Gutfraind, A.; Safro, I.; Meyerhenke, H. Generating realistic scaled complex networks. Appl. Netw. Sci. 2017, 2, 36. [Google Scholar] [CrossRef] [PubMed] [Green Version]
- Chawla, N.V.; Bowyer, K.W.; Hall, L.O.; Kegelmeyer, W.P. SMOTE: Synthetic minority over-sampling technique. J. Artif. Intell. Res. 2002, 16, 321–357. [Google Scholar] [CrossRef]
- Tang, J.; Alelyani, S.; Liu, H. Feature selection for classification: A review. Data Classif. Algorithms Appl. 2014, 28, 37–64. [Google Scholar]
- Kirkcaldy, R.D.; King, B.A.; Brooks, J.T. COVID-19 and Postinfection Immunity: Limited Evidence, Many Remaining Questions. JAMA 2020. [Google Scholar] [CrossRef] [PubMed]
- Lauer, S.A.; Grantz, K.H.; Bi, Q.; Jones, F.K.; Zheng, Q.; Meredith, H.R.; Azman, A.S.; Reich, N.G.; Lessler, J. The incubation period of coronavirus disease 2019 (COVID-19) from publicly reported confirmed cases: Estimation and application. Ann. Intern. Med. 2020, 172, 577–582. [Google Scholar] [CrossRef] [Green Version]
- Chen, C.; Twycross, J.; Garibaldi, J.M. A new accuracy measure based on bounded relative error for time series forecasting. PLoS ONE 2017, 12. [Google Scholar] [CrossRef] [Green Version]
- Armstrong, J.S. Principles of Forecasting: A Handbook for Researchers and Practitioners; Springer Science & Business Media: Berlin, Germany, 2001; ISBN 978-079-237-401-5. [Google Scholar]
- Savitzky, A.; Golay, M.J. Smoothing and differentiation of data by simplified least squares procedures. Anal. Chem. 1964, 36, 1627–1639. [Google Scholar] [CrossRef]
- When Will COVID-19 End? Data-Driven Prediction. Available online: http://www.sutd.edu.sg. (accessed on 20 October 2020).
- Epidemic Situation and Forecasting of COVID-19 in Saudi Arabia using the SIR model. Available online: https://www.medrxiv.org/content/10.1101/2020.05.05.20091520v1 (accessed on 20 October 2020).


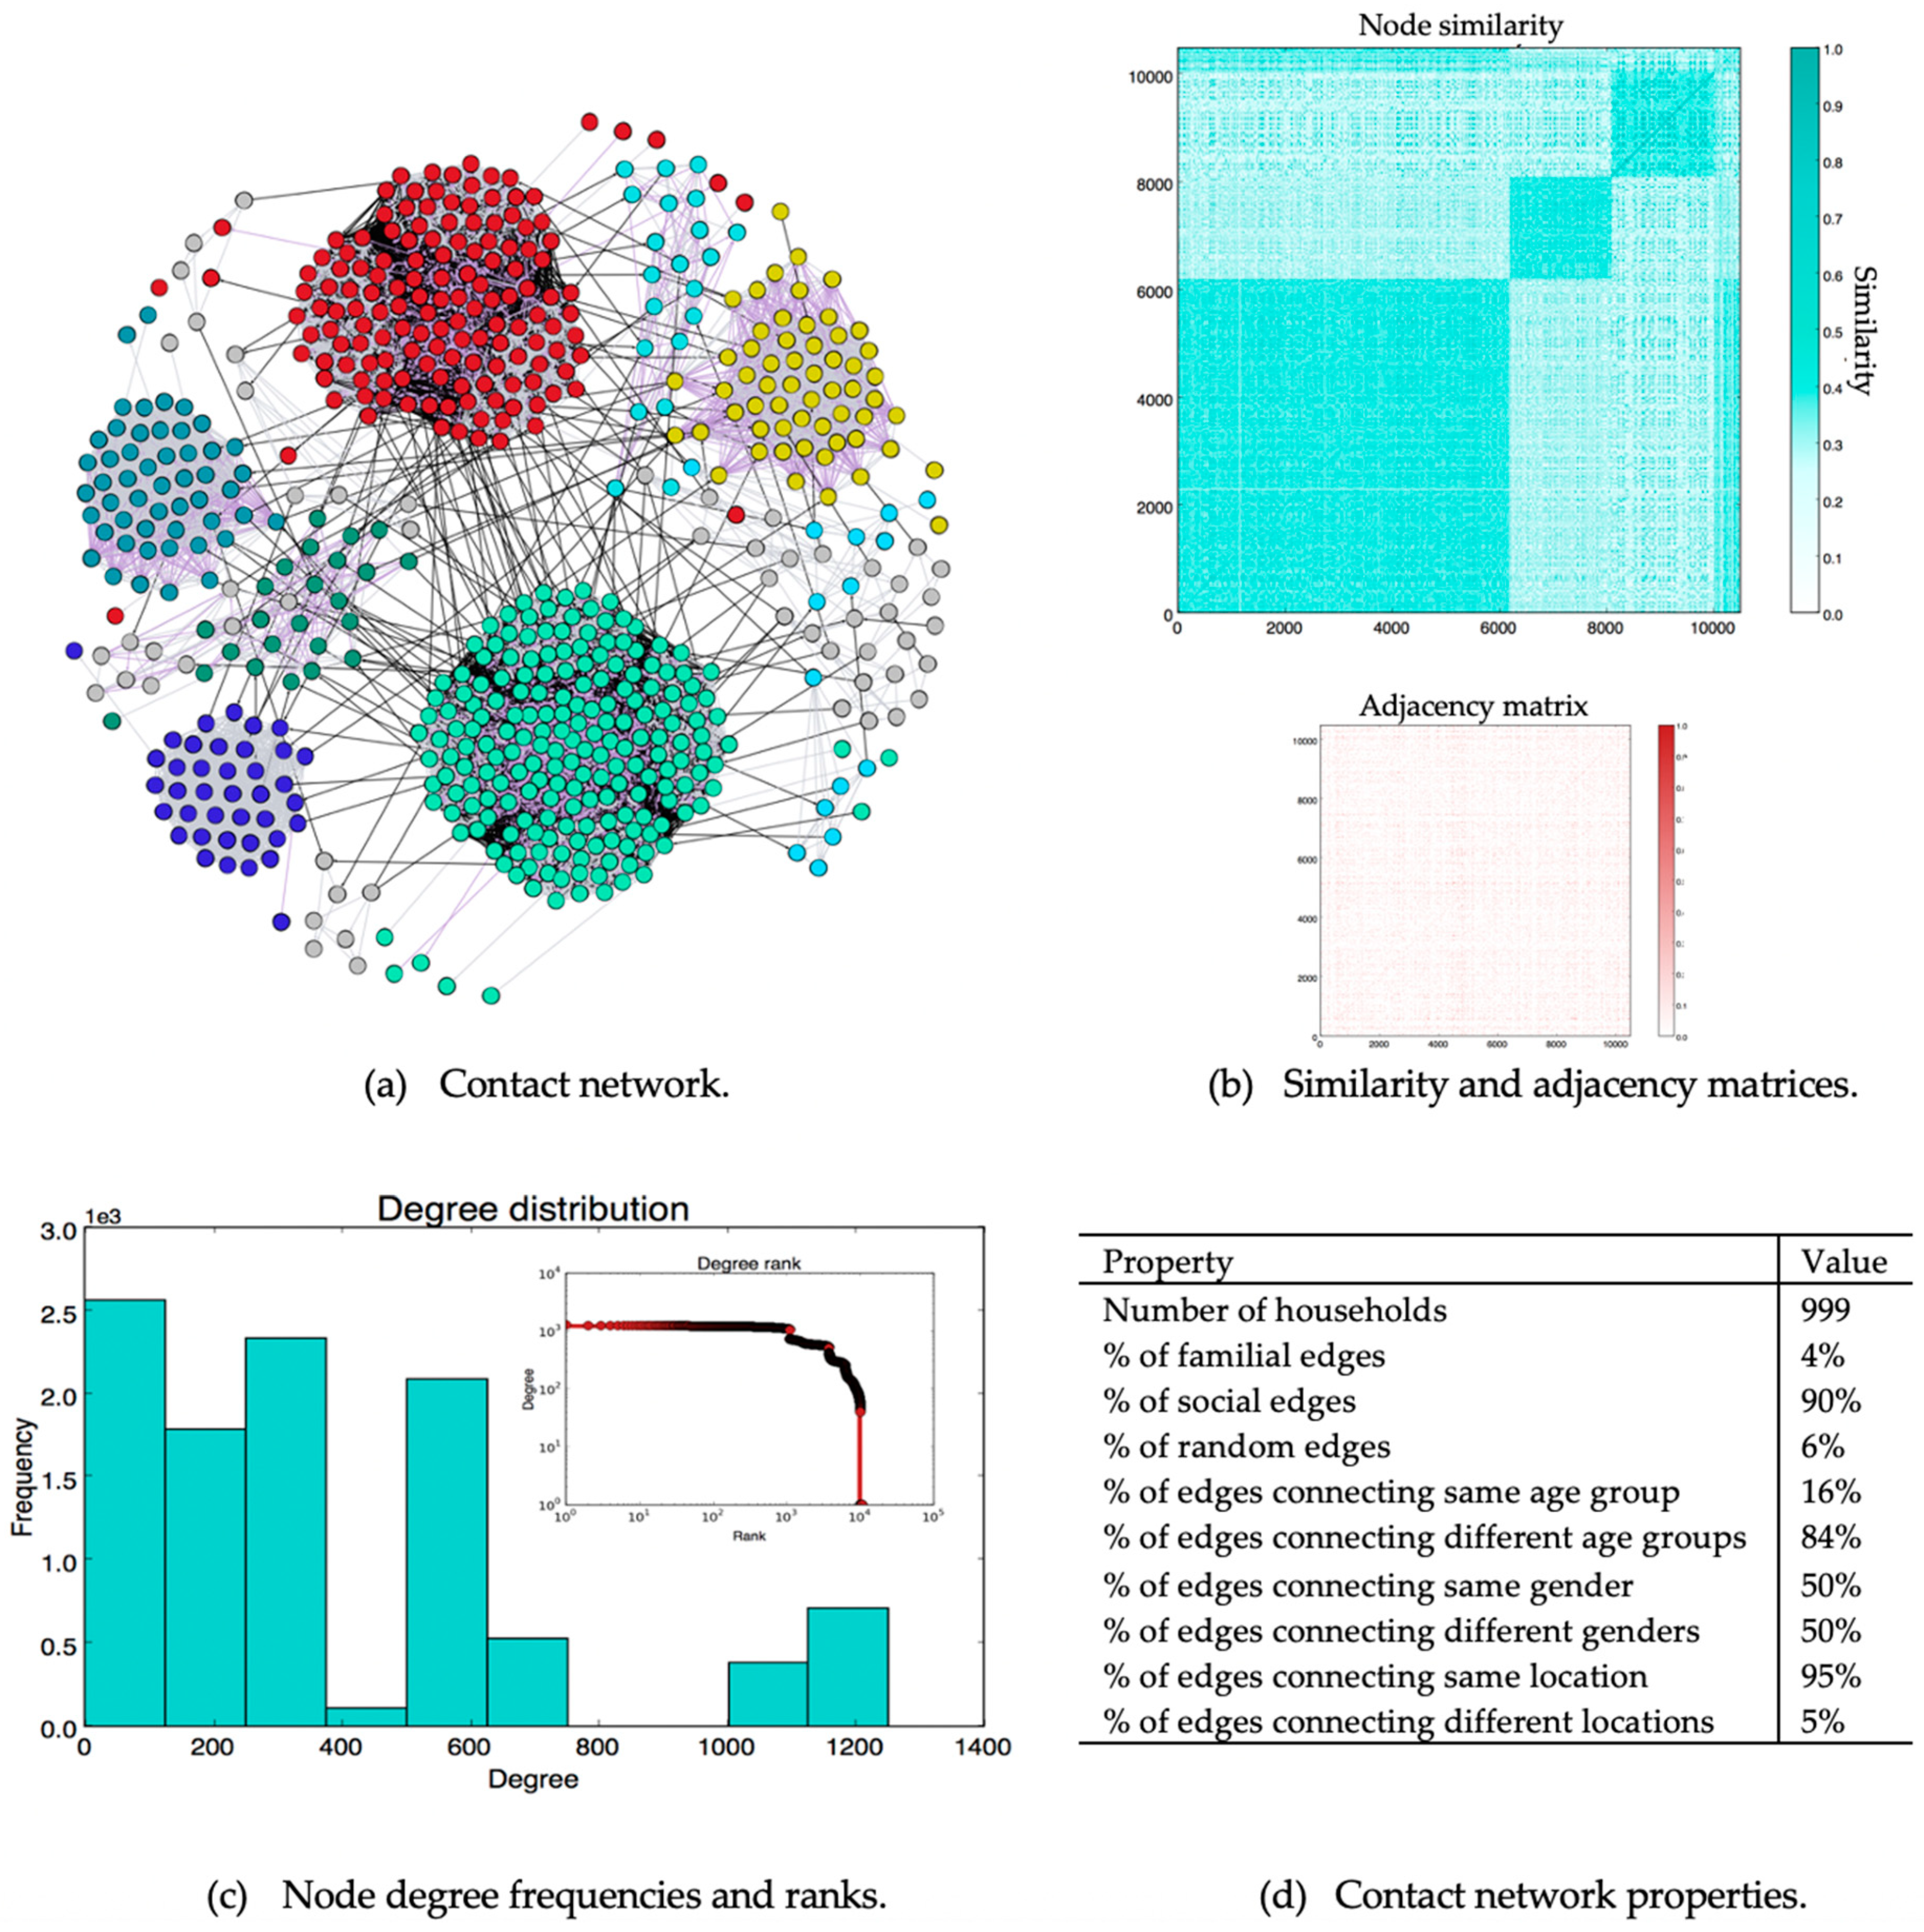
| Property | Definition | Value |
|---|---|---|
| Number of nodes | Number of individuals in the contact network | 10,500 |
| Number of edges | Number of connections between individuals in the contact network | 1,994,082 |
| Network density | Ratio of the number of edges to the number of possible edges. | 0.036 |
| Number of connected components | Parts of the network in which all nodes are connected | 1 |
| Node degree | Number of edges connected to a node | |
| Average degree | Average number of edges per node | 380 |
| Maximum degree | Degree of nodes with the greatest number of edges | 1252 |
| Minimum degree | Degree of nodes with the smallest number of edges | 1 |
| Network diameter | Length of longest shortest path over all node pairs | 5 |
| Network average path length | Over all shortest paths connecting node pairs | 2.34 |
| Network clustering coefficient | Extent to which neighbors of a node to form connections. | 0.25 |
| Network Community structure | Degree to which nodes can be grouped into internally dense sets | |
| Modularity | 0.62 | |
| Number of communities | 14 |
| Type | Attribute | p-Value |
|---|---|---|
| Unbalanced data | Age | 2.21775012 × 10−020 |
| Gender | 4.73960493 × 10−087 | |
| Citizenship | 0.00000000 × 10+000 | |
| Location | 0.00000000 × 10+000 | |
| Balanced data | Age | 4.57937250 × 10−274 |
| Gender | 3.62576524 × 10−121 | |
| Citizenship | 0.00000000 × 10+000 | |
| Location | 0.00000000 × 10+000 |
| Symbol | Value | Description | Type |
|---|---|---|---|
| T | 0.7 | Lower limit of the similarity between two nodes | Threshold |
| p+social | 0.25 | Probability of connecting a pair of similar nodes | Node pair connection ratio |
| p+loc | 0.15 | Probability of connecting a pair of non-similar nodes in the same location | Node pair connection ratio |
| p+random | 0.01 | Probability of connecting a pair of non-similar nodes in different locations | Node pair connection ratio |
| p−familial | 0.0001 | Probability of deleting a familial edge connecting a pair of nodes | Edge deletion ratio |
| p−social | 0.005 | Probability of deleting a social edge connecting a pair of nodes | Edge deletion ratio |
| p−random | 0.001 | Probability of deleting a random edge connecting a pair of nodes | Edge deletion ratio |
| τ | 14 days | Incubation period | Threshold |
| γ | 0.2 | Rate of transition from the infected state to the recovered state | Recovery rate |
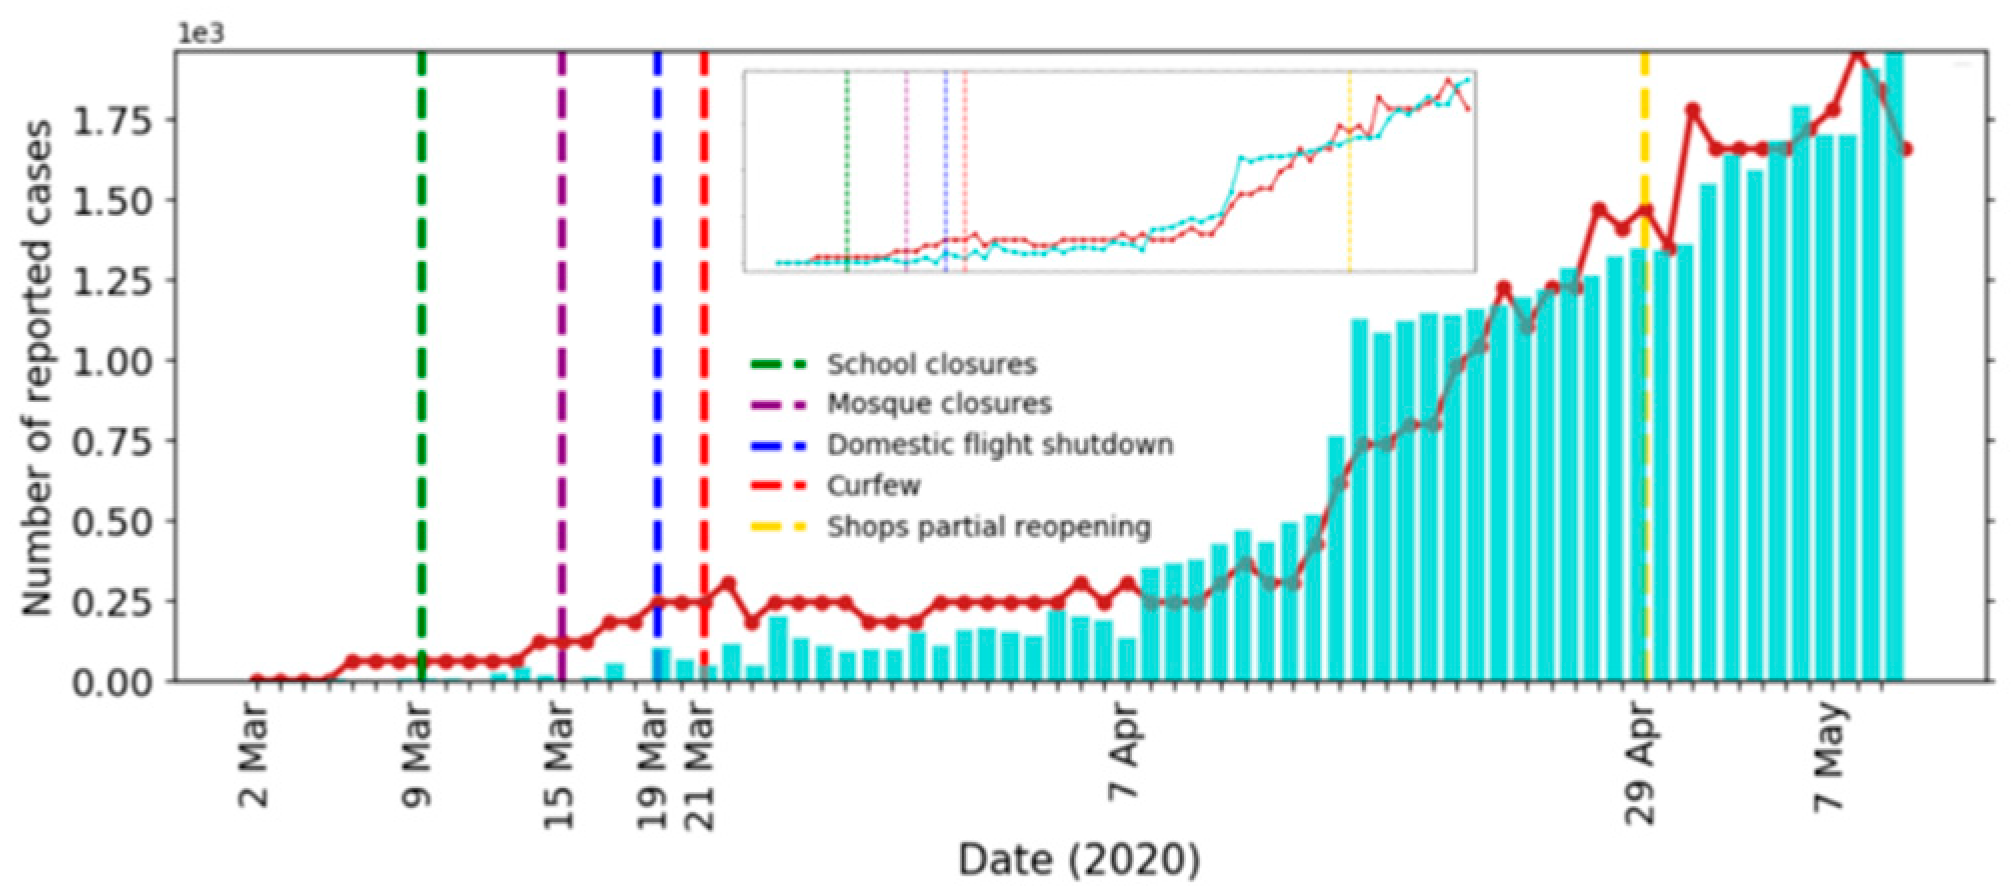
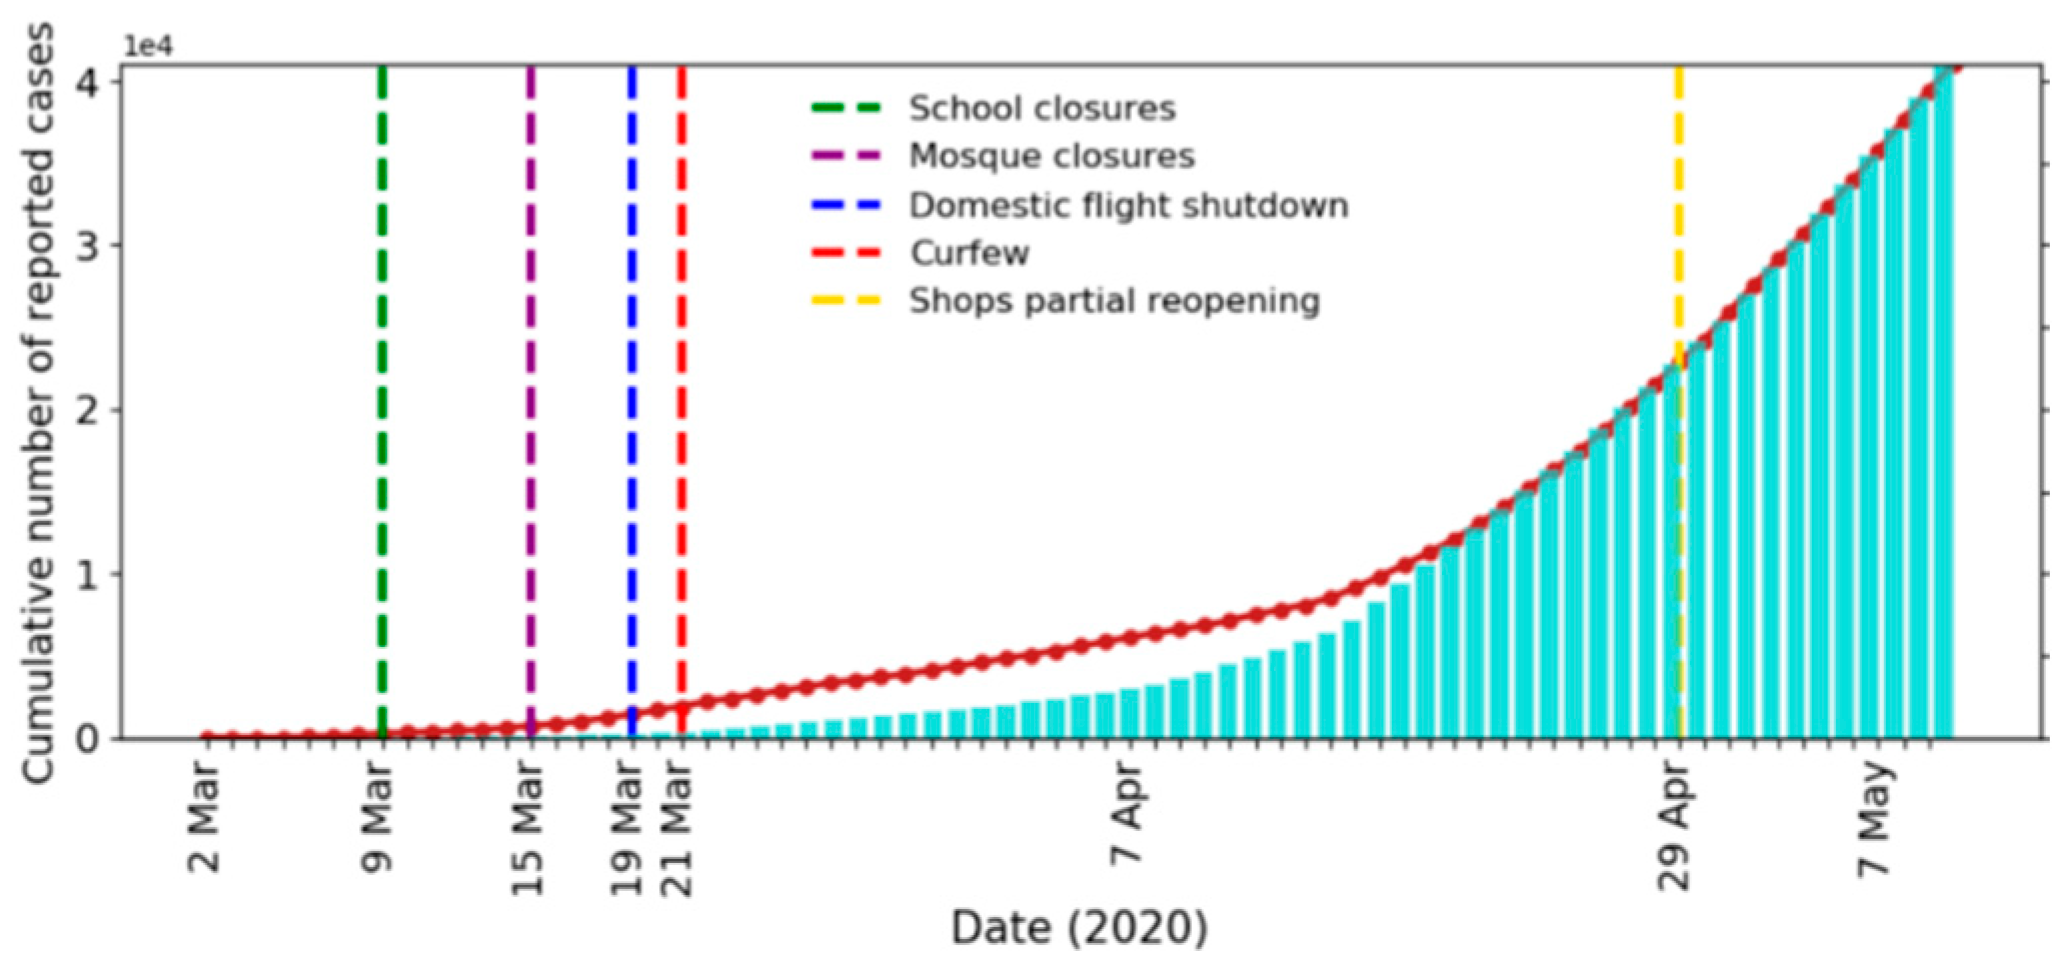
| Measure | Effective Date | Compliance Rate |
|---|---|---|
| School closures | 9 March 2020 | 95% |
| Mosque closures | 15 March 2020 | 65% |
| Domestic flight shutdowns | 21 March 2020 | 85% |
| Curfews | 23 March 2020 | 50% |
| Ground screening | 10 April 2020 | 35% |
| Partial business reopening | 29 April 2020 | 50% |
| Business as usual | 31 May 2020 | - |
| Percentage of Population Vaccinated | Peak Size (% of Population) | Peak Date | Outbreak Size | End (95%) | End (99%) |
|---|---|---|---|---|---|
| 0% | 0.39% | 1 July | 41% | 4 November | - |
| 30% | 0.32% | 9 June | 31% | 24 September | 9 December |
| 50% | 0.28% | 1 June | 19% | 30 August | 27 September |
| 70% | 0.27% | 30 May | 13% | 25 June | 17 July |
Publisher’s Note: MDPI stays neutral with regard to jurisdictional claims in published maps and institutional affiliations. |
© 2020 by the authors. Licensee MDPI, Basel, Switzerland. This article is an open access article distributed under the terms and conditions of the Creative Commons Attribution (CC BY) license (http://creativecommons.org/licenses/by/4.0/).
Share and Cite
Alrasheed, H.; Althnian, A.; Kurdi, H.; Al-Mgren, H.; Alharbi, S. COVID-19 Spread in Saudi Arabia: Modeling, Simulation and Analysis. Int. J. Environ. Res. Public Health 2020, 17, 7744. https://doi.org/10.3390/ijerph17217744
Alrasheed H, Althnian A, Kurdi H, Al-Mgren H, Alharbi S. COVID-19 Spread in Saudi Arabia: Modeling, Simulation and Analysis. International Journal of Environmental Research and Public Health. 2020; 17(21):7744. https://doi.org/10.3390/ijerph17217744
Chicago/Turabian StyleAlrasheed, Hend, Alhanoof Althnian, Heba Kurdi, Heila Al-Mgren, and Sulaiman Alharbi. 2020. "COVID-19 Spread in Saudi Arabia: Modeling, Simulation and Analysis" International Journal of Environmental Research and Public Health 17, no. 21: 7744. https://doi.org/10.3390/ijerph17217744