
Development of a Modular Assay for Detailed Immunophenotyping of Peripheral Human Whole Blood Samples by Multicolor Flow Cytometry


Abstract
:
1. Introduction
2. Results
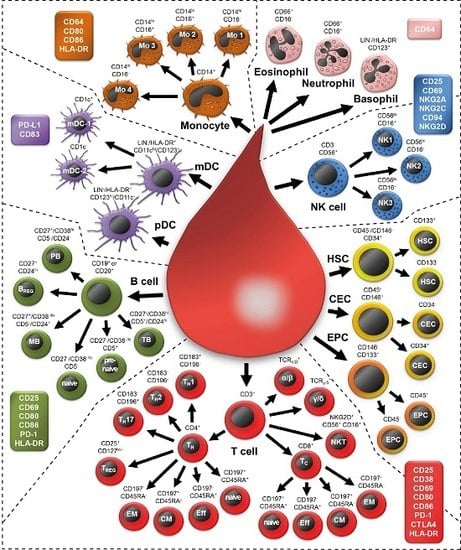
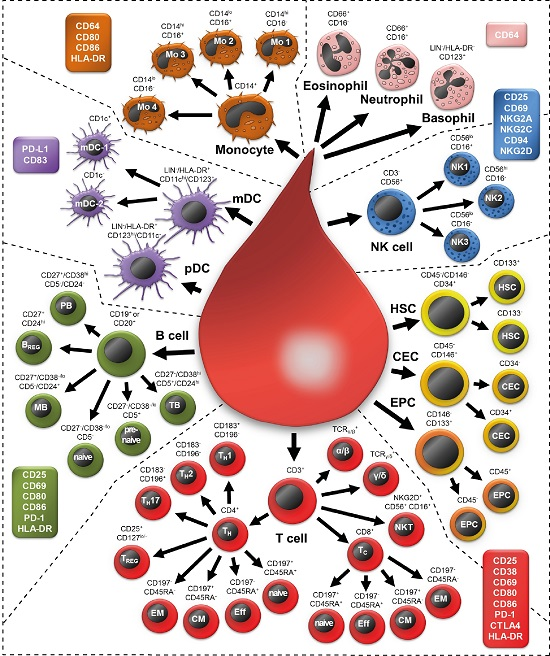
2.1. Examining 37 Cell Subsets
2.2. Morphology of All Leukocytes
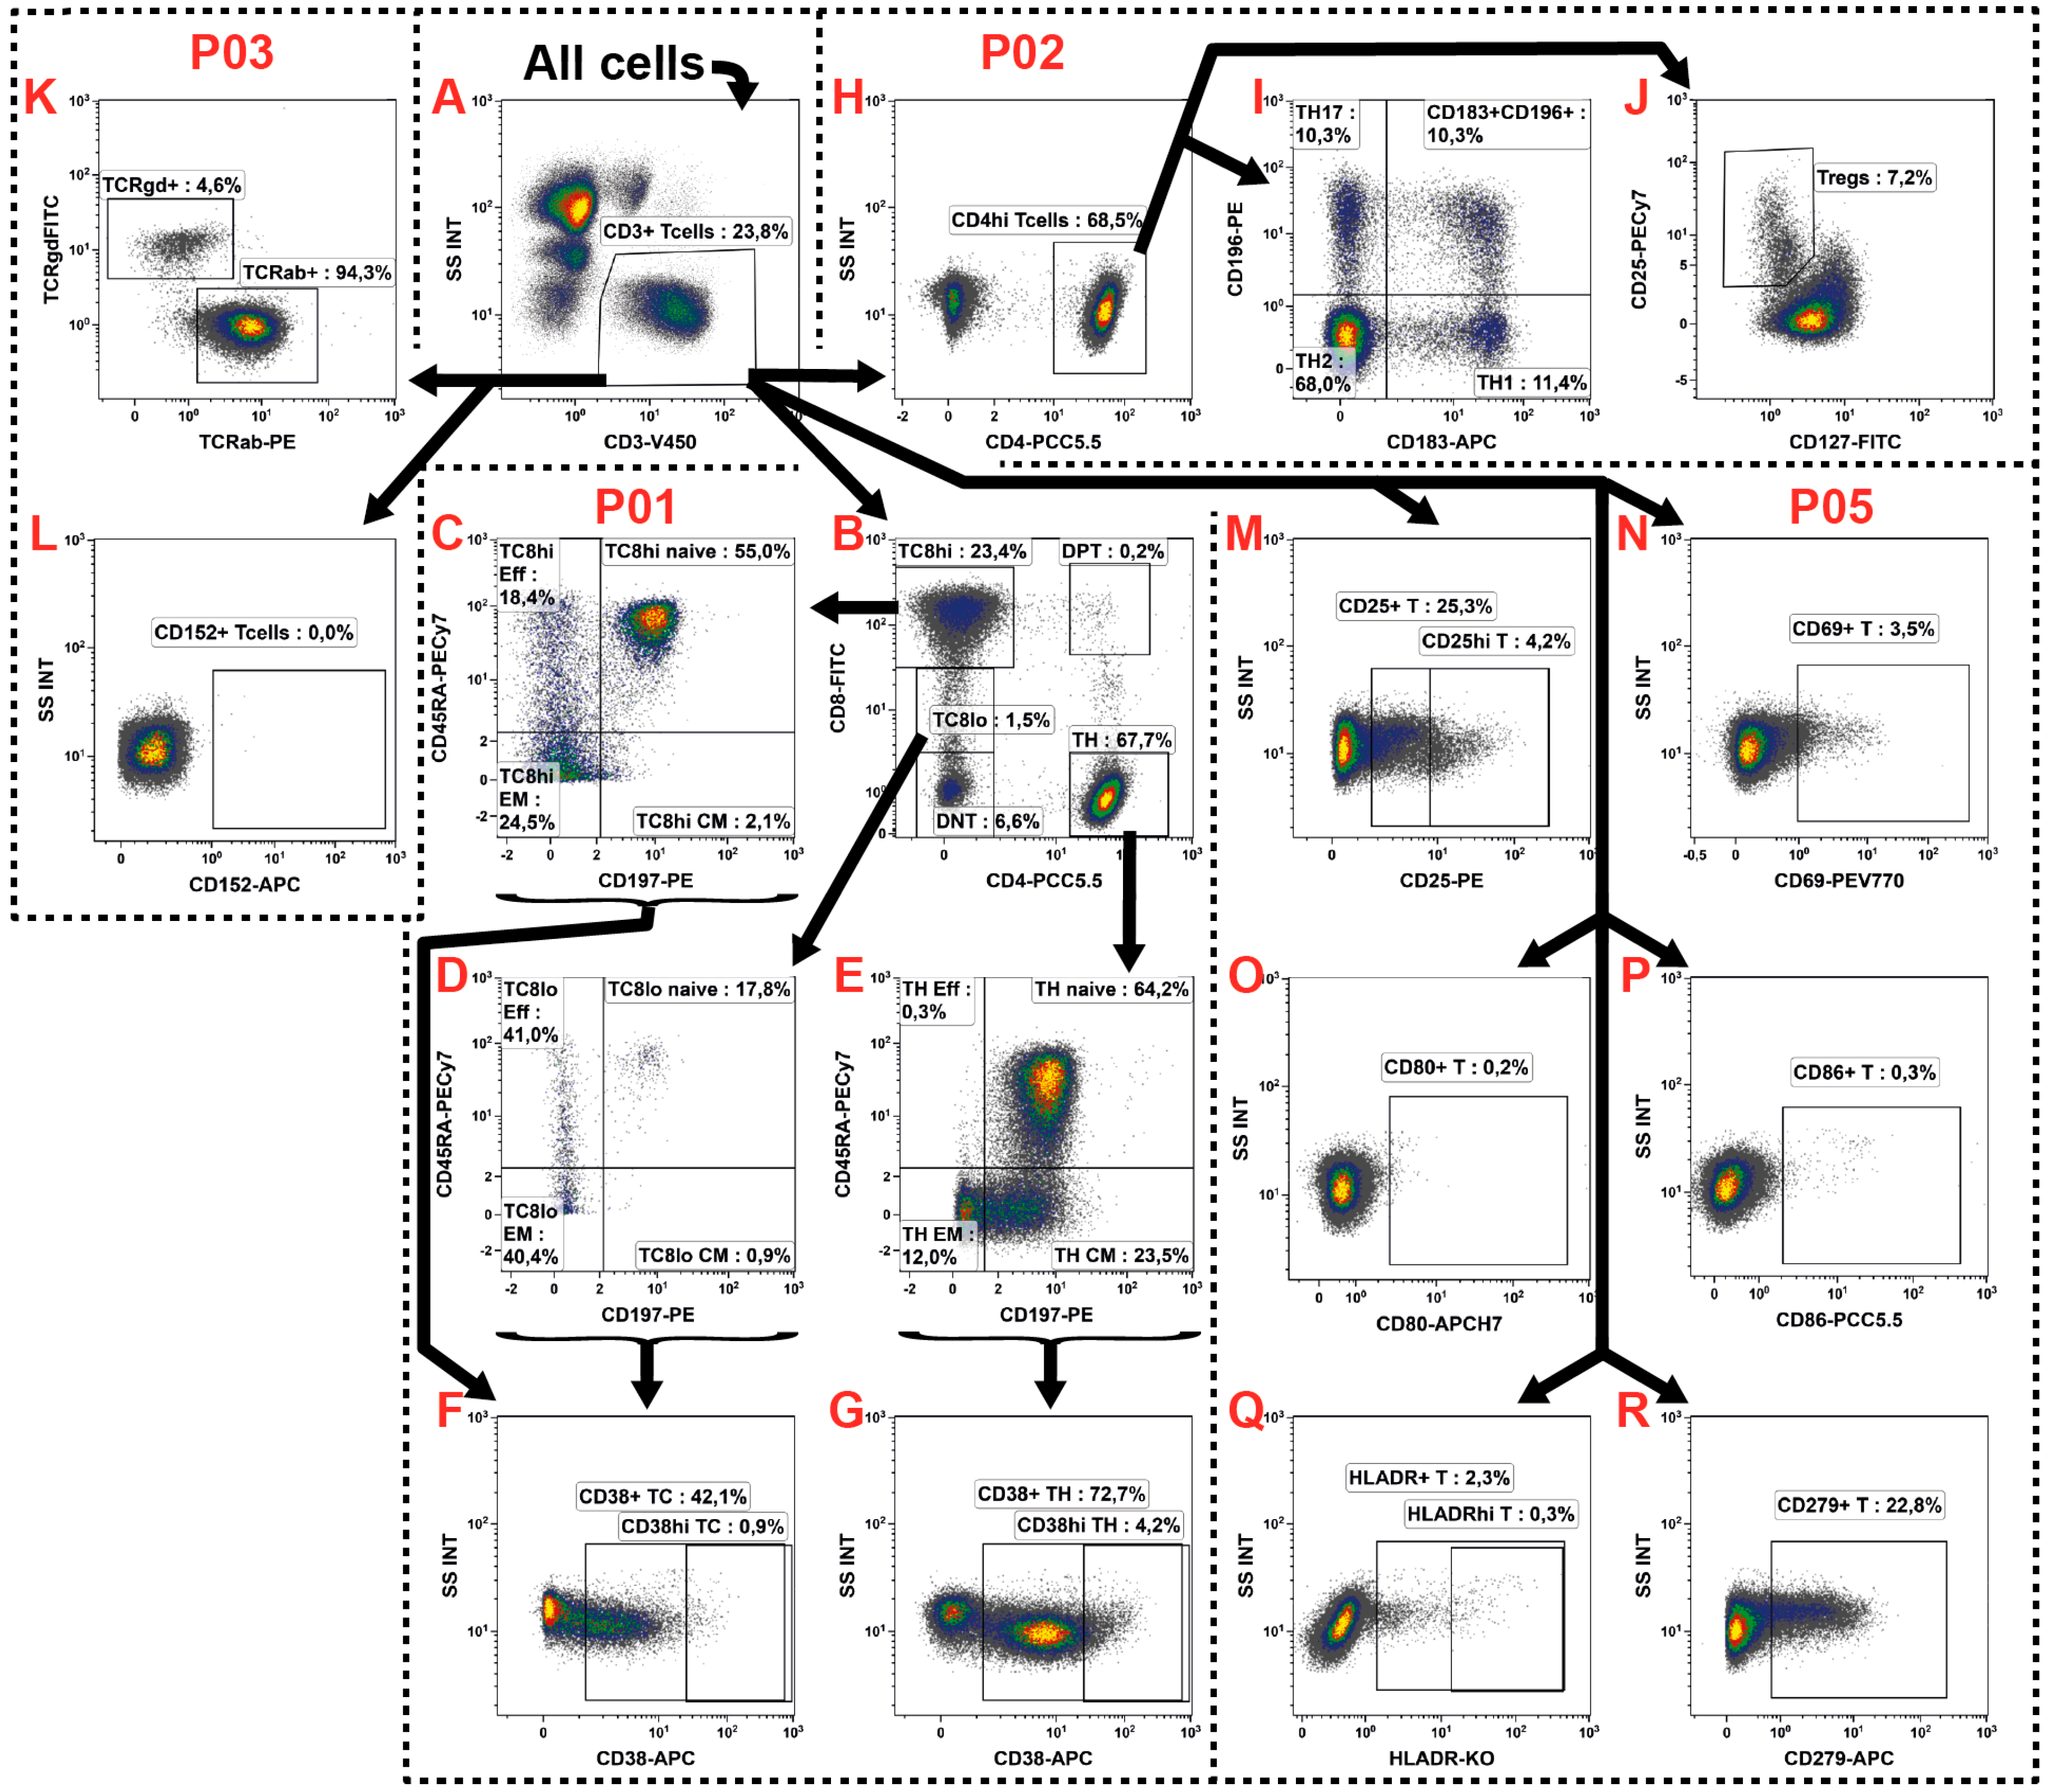
2.3. T Cell Subsets
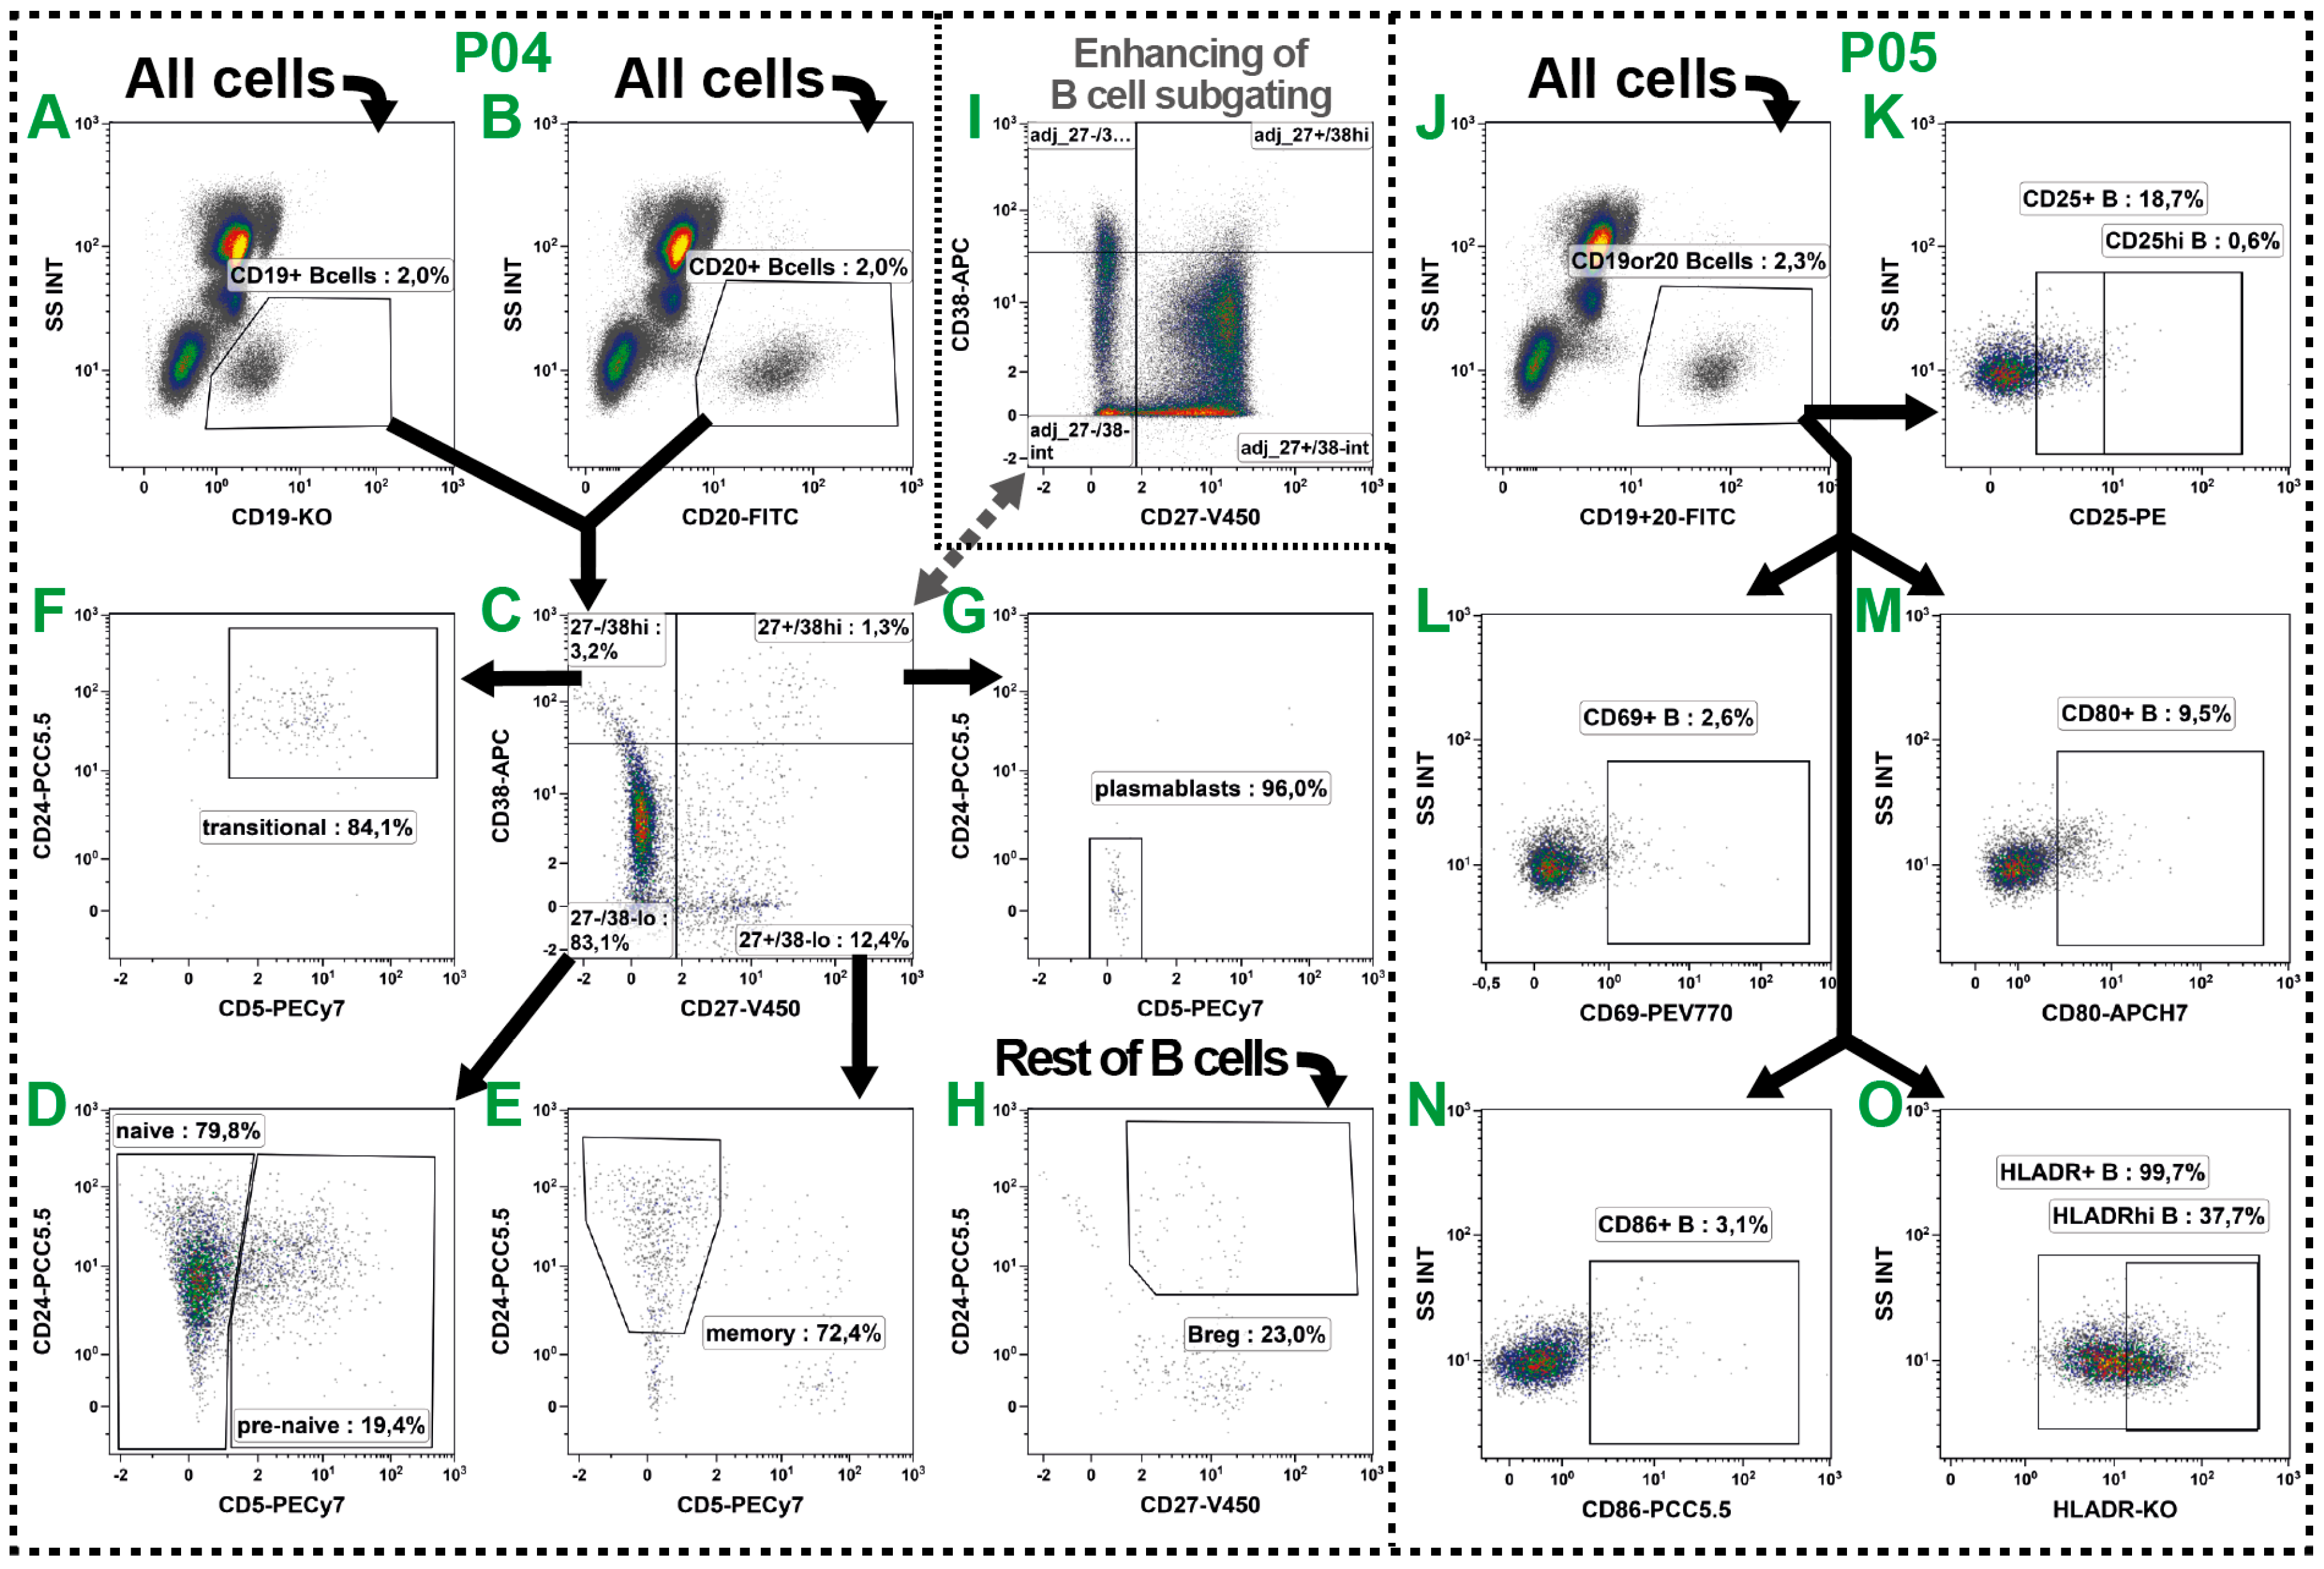
2.4. B Cell Subsets
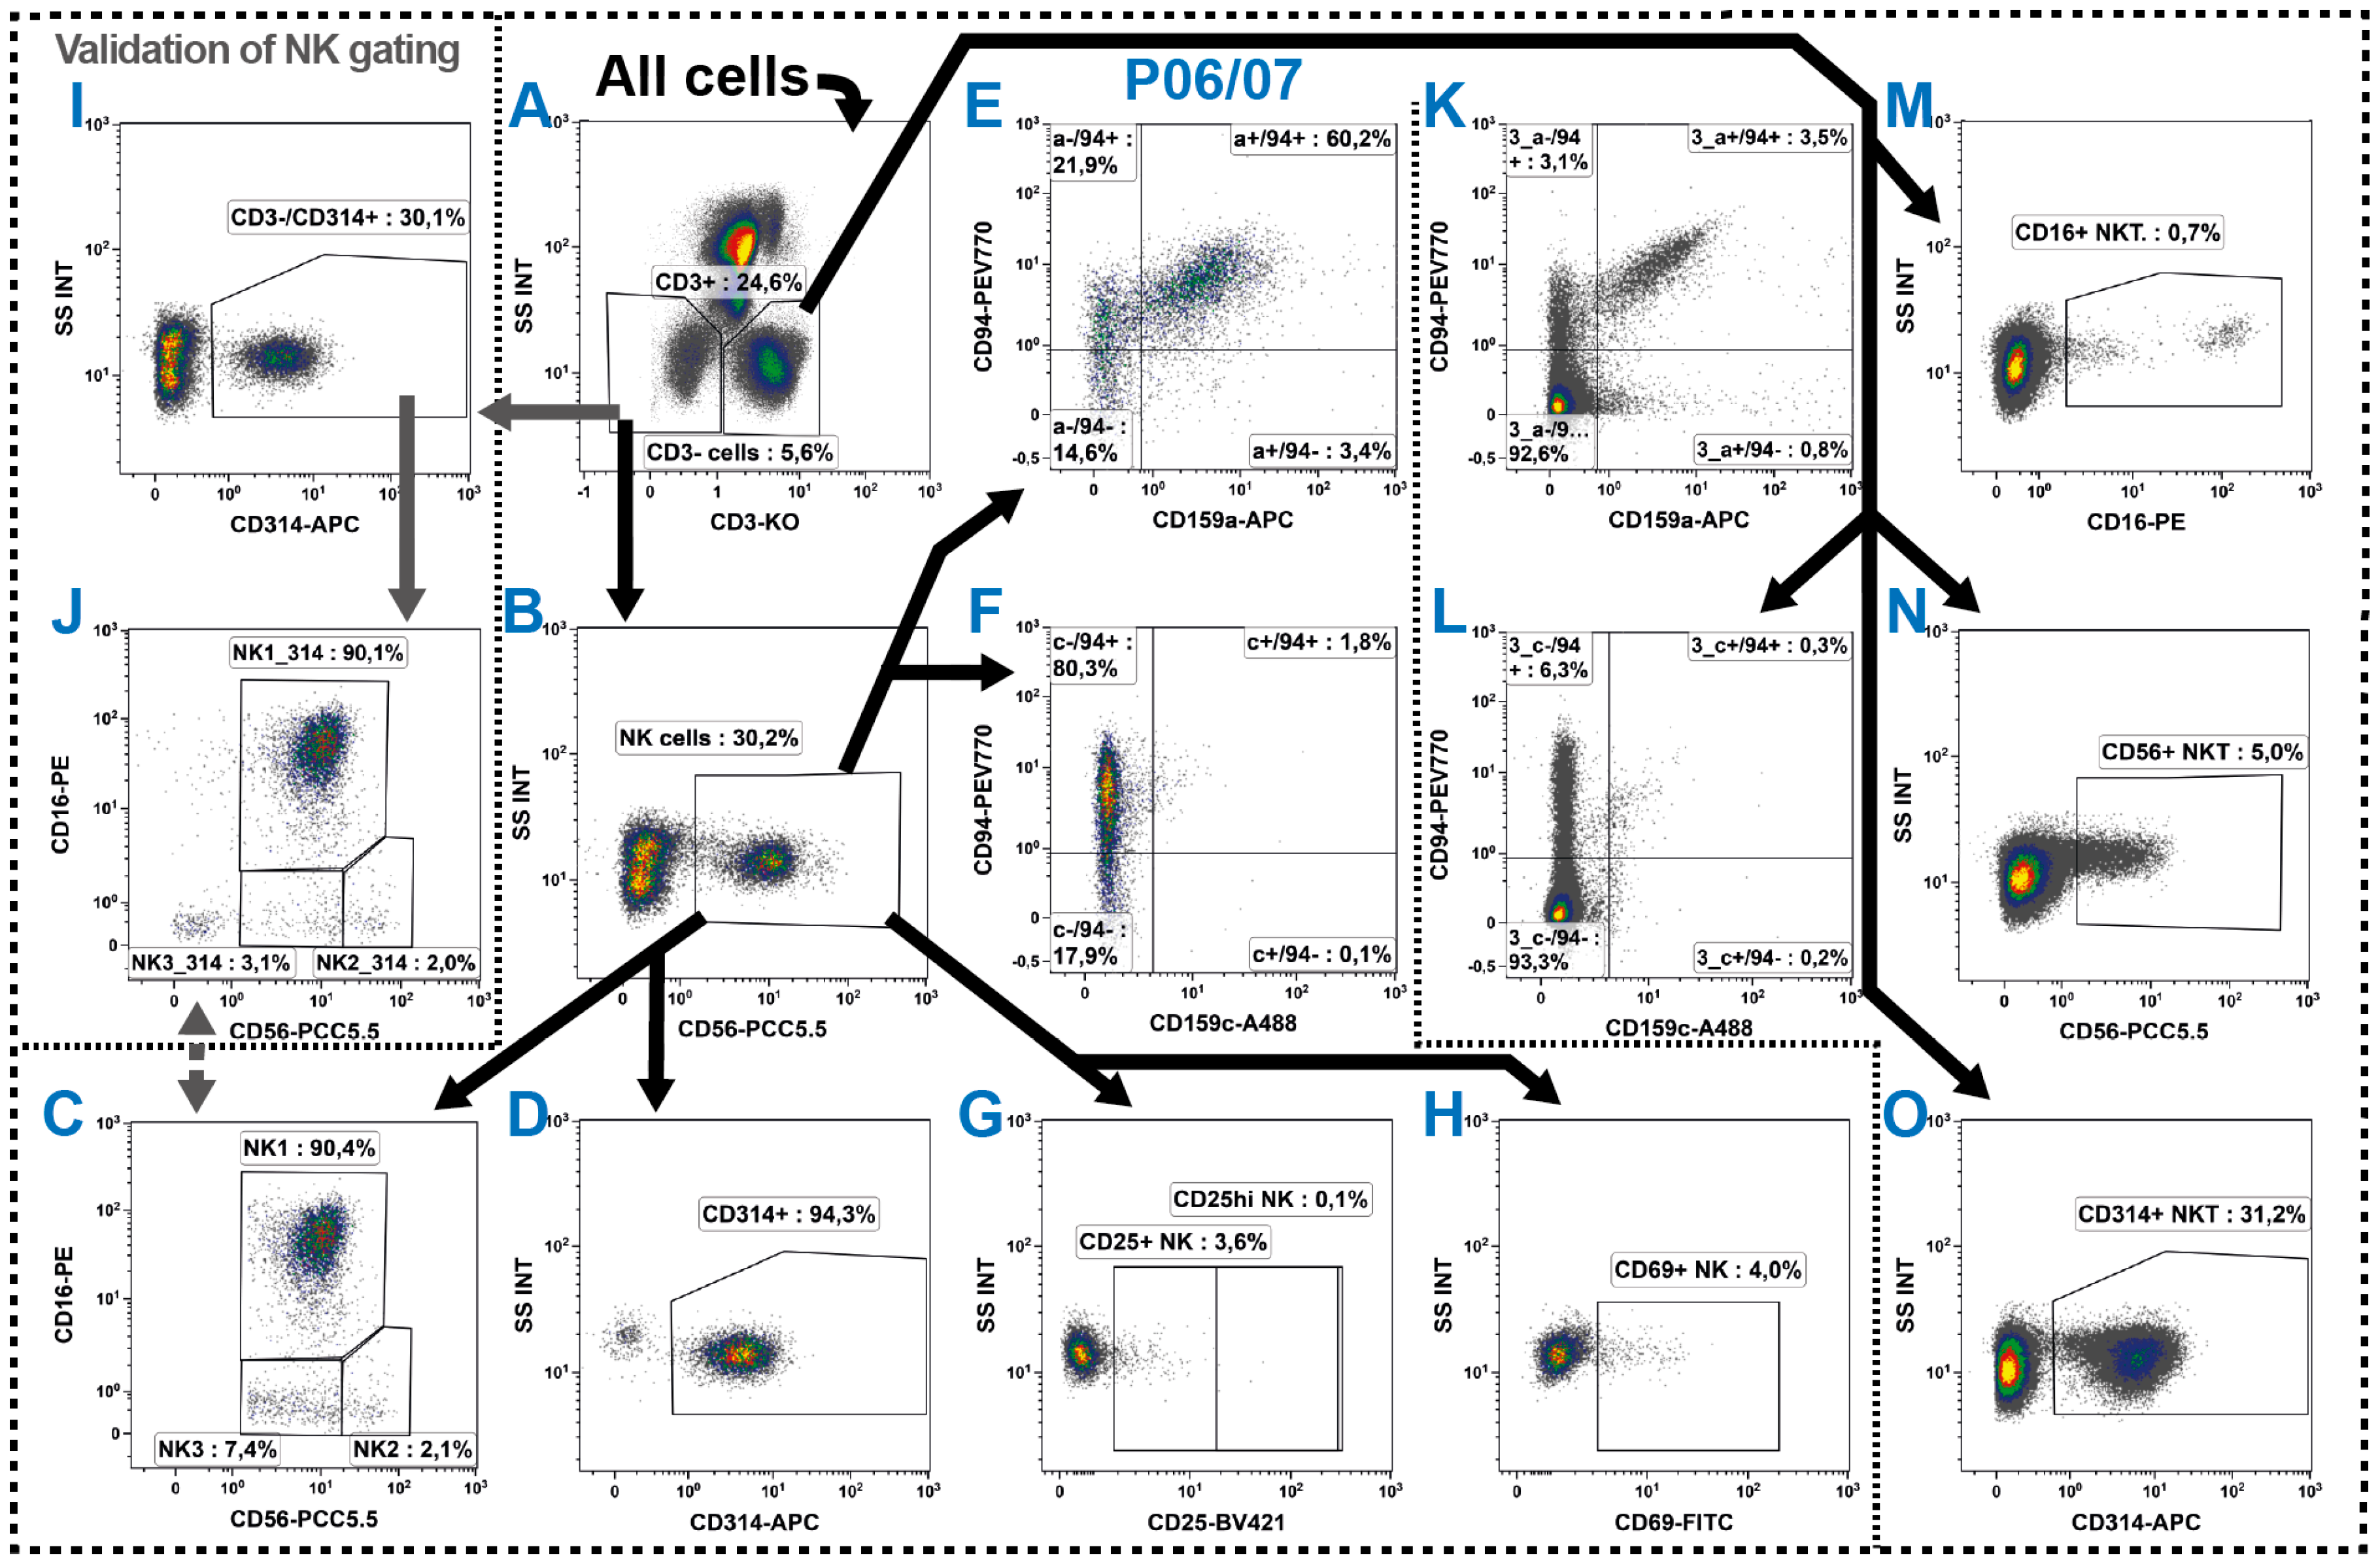
2.5. Natural Killer Cells
2.6. NKT Cells
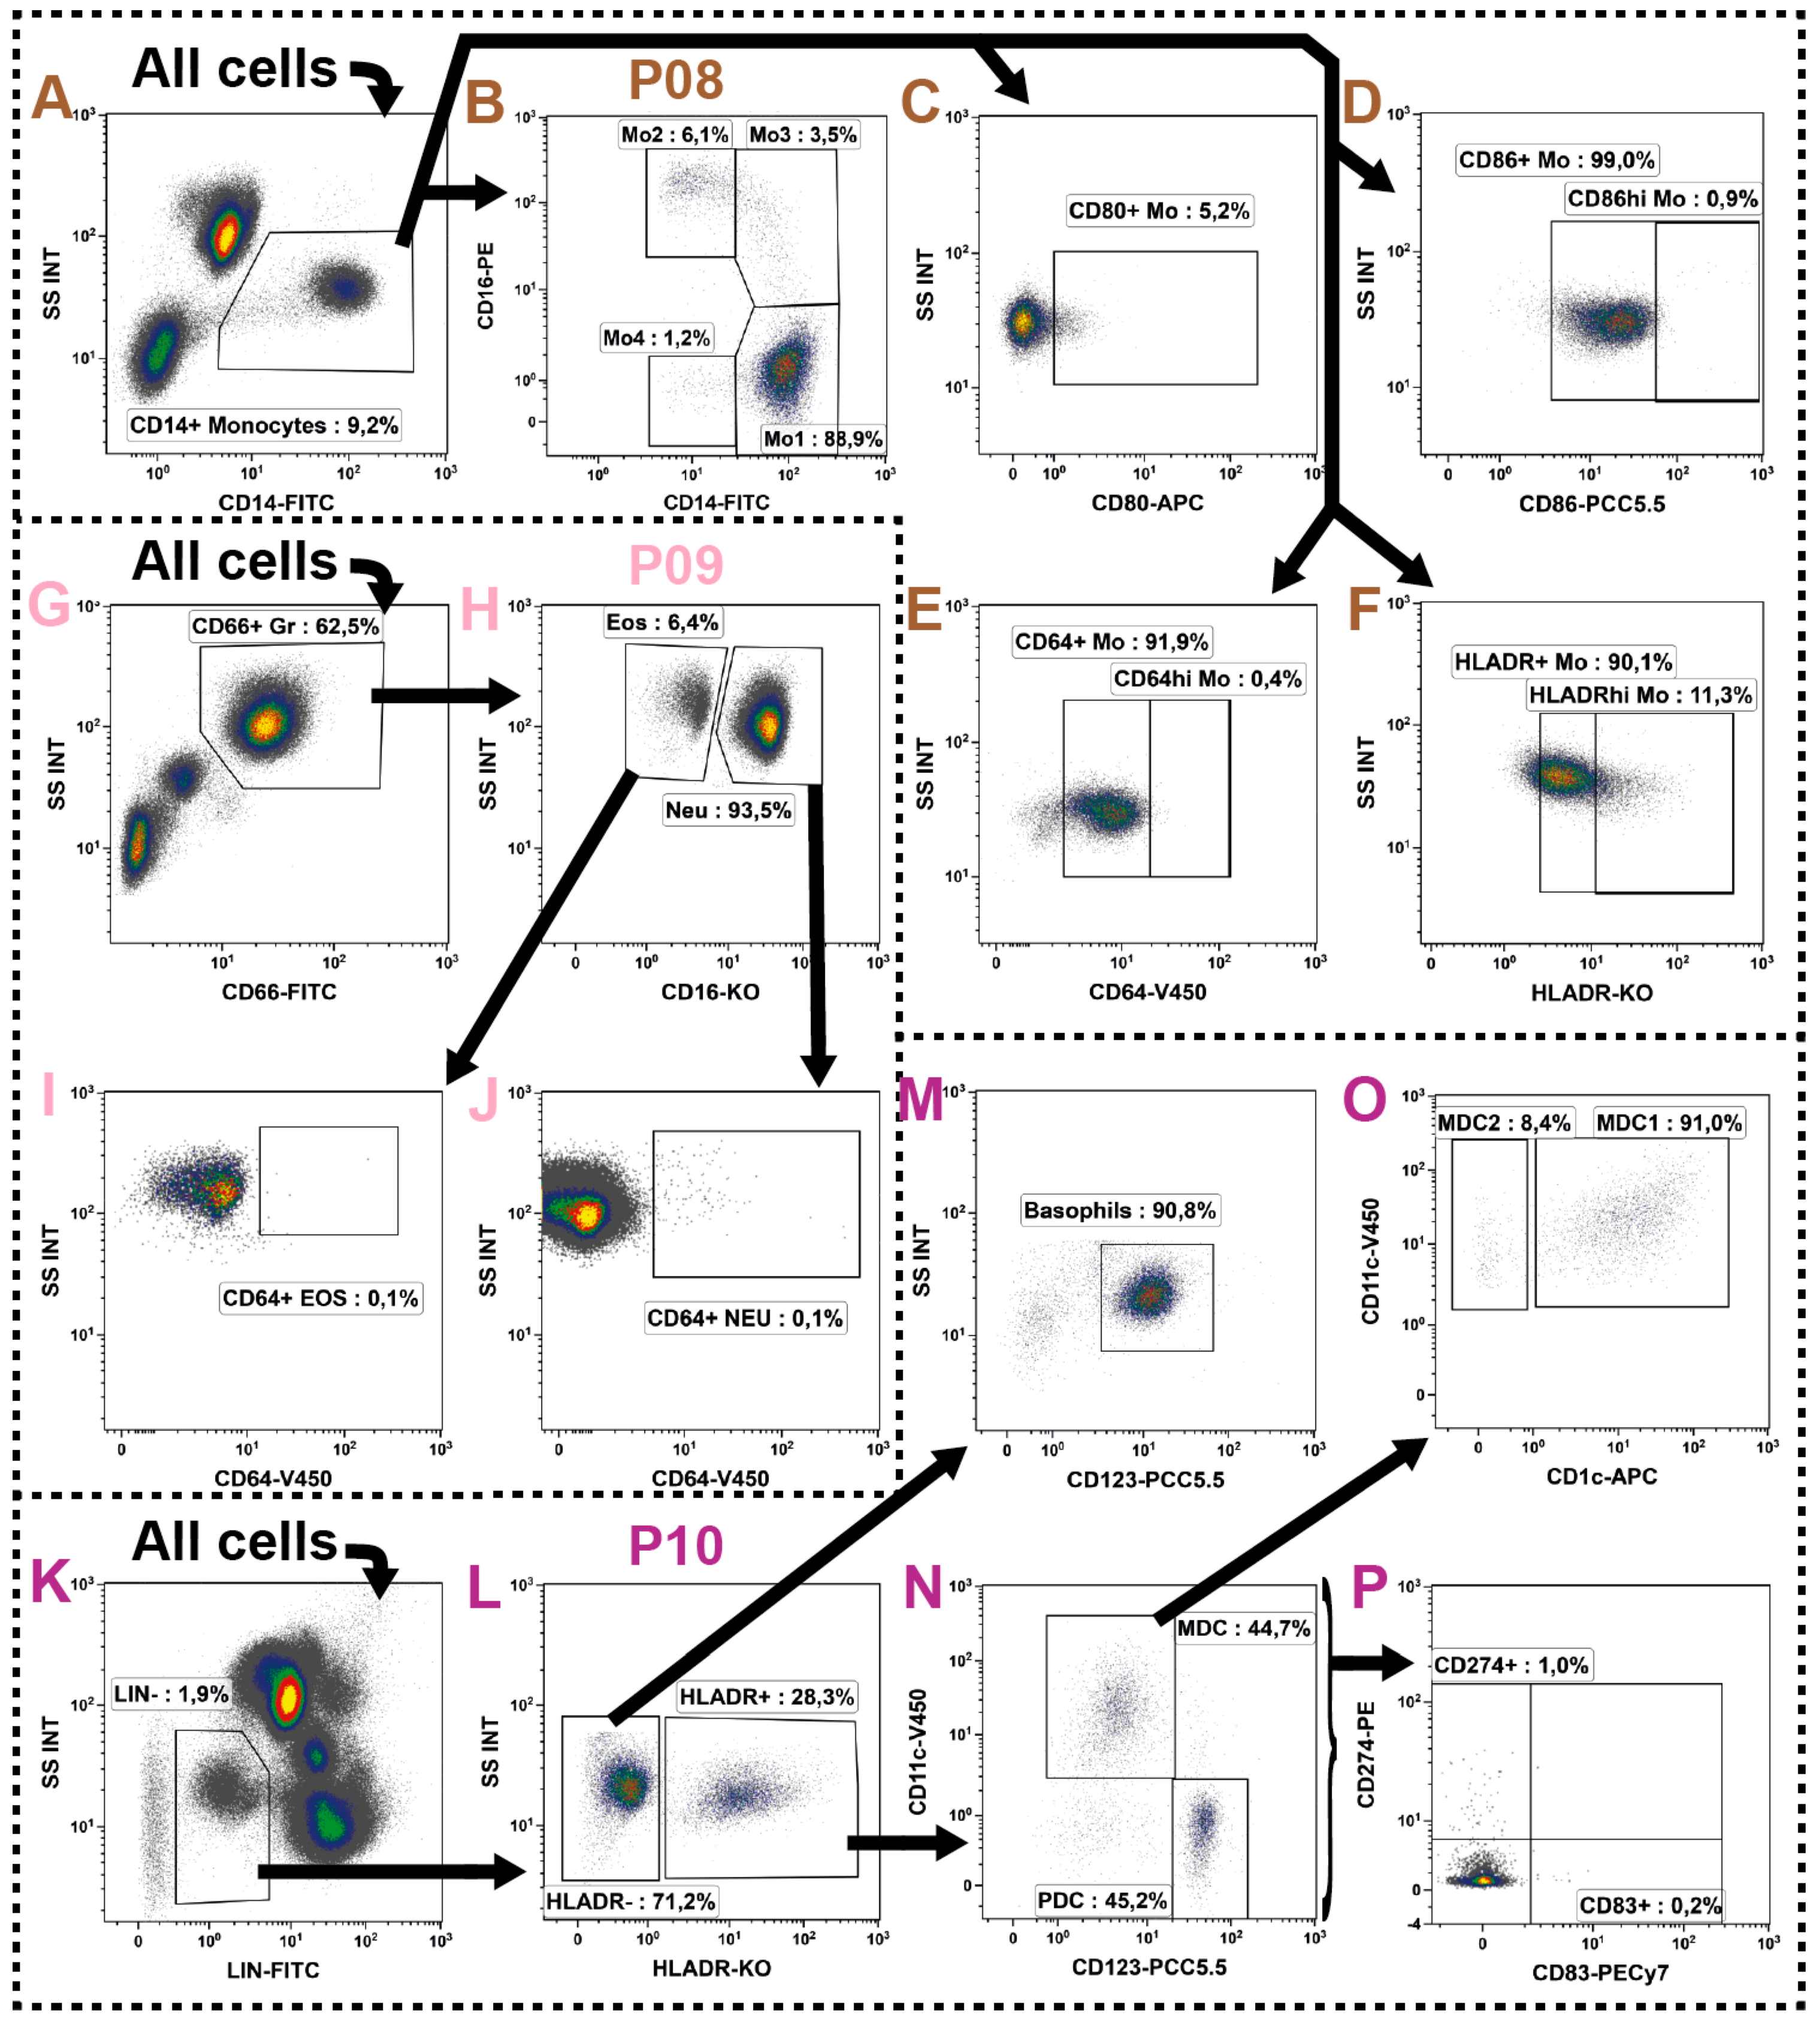
2.7. Monocytes
2.8. Granulocytes
2.9. Dendritic Cells
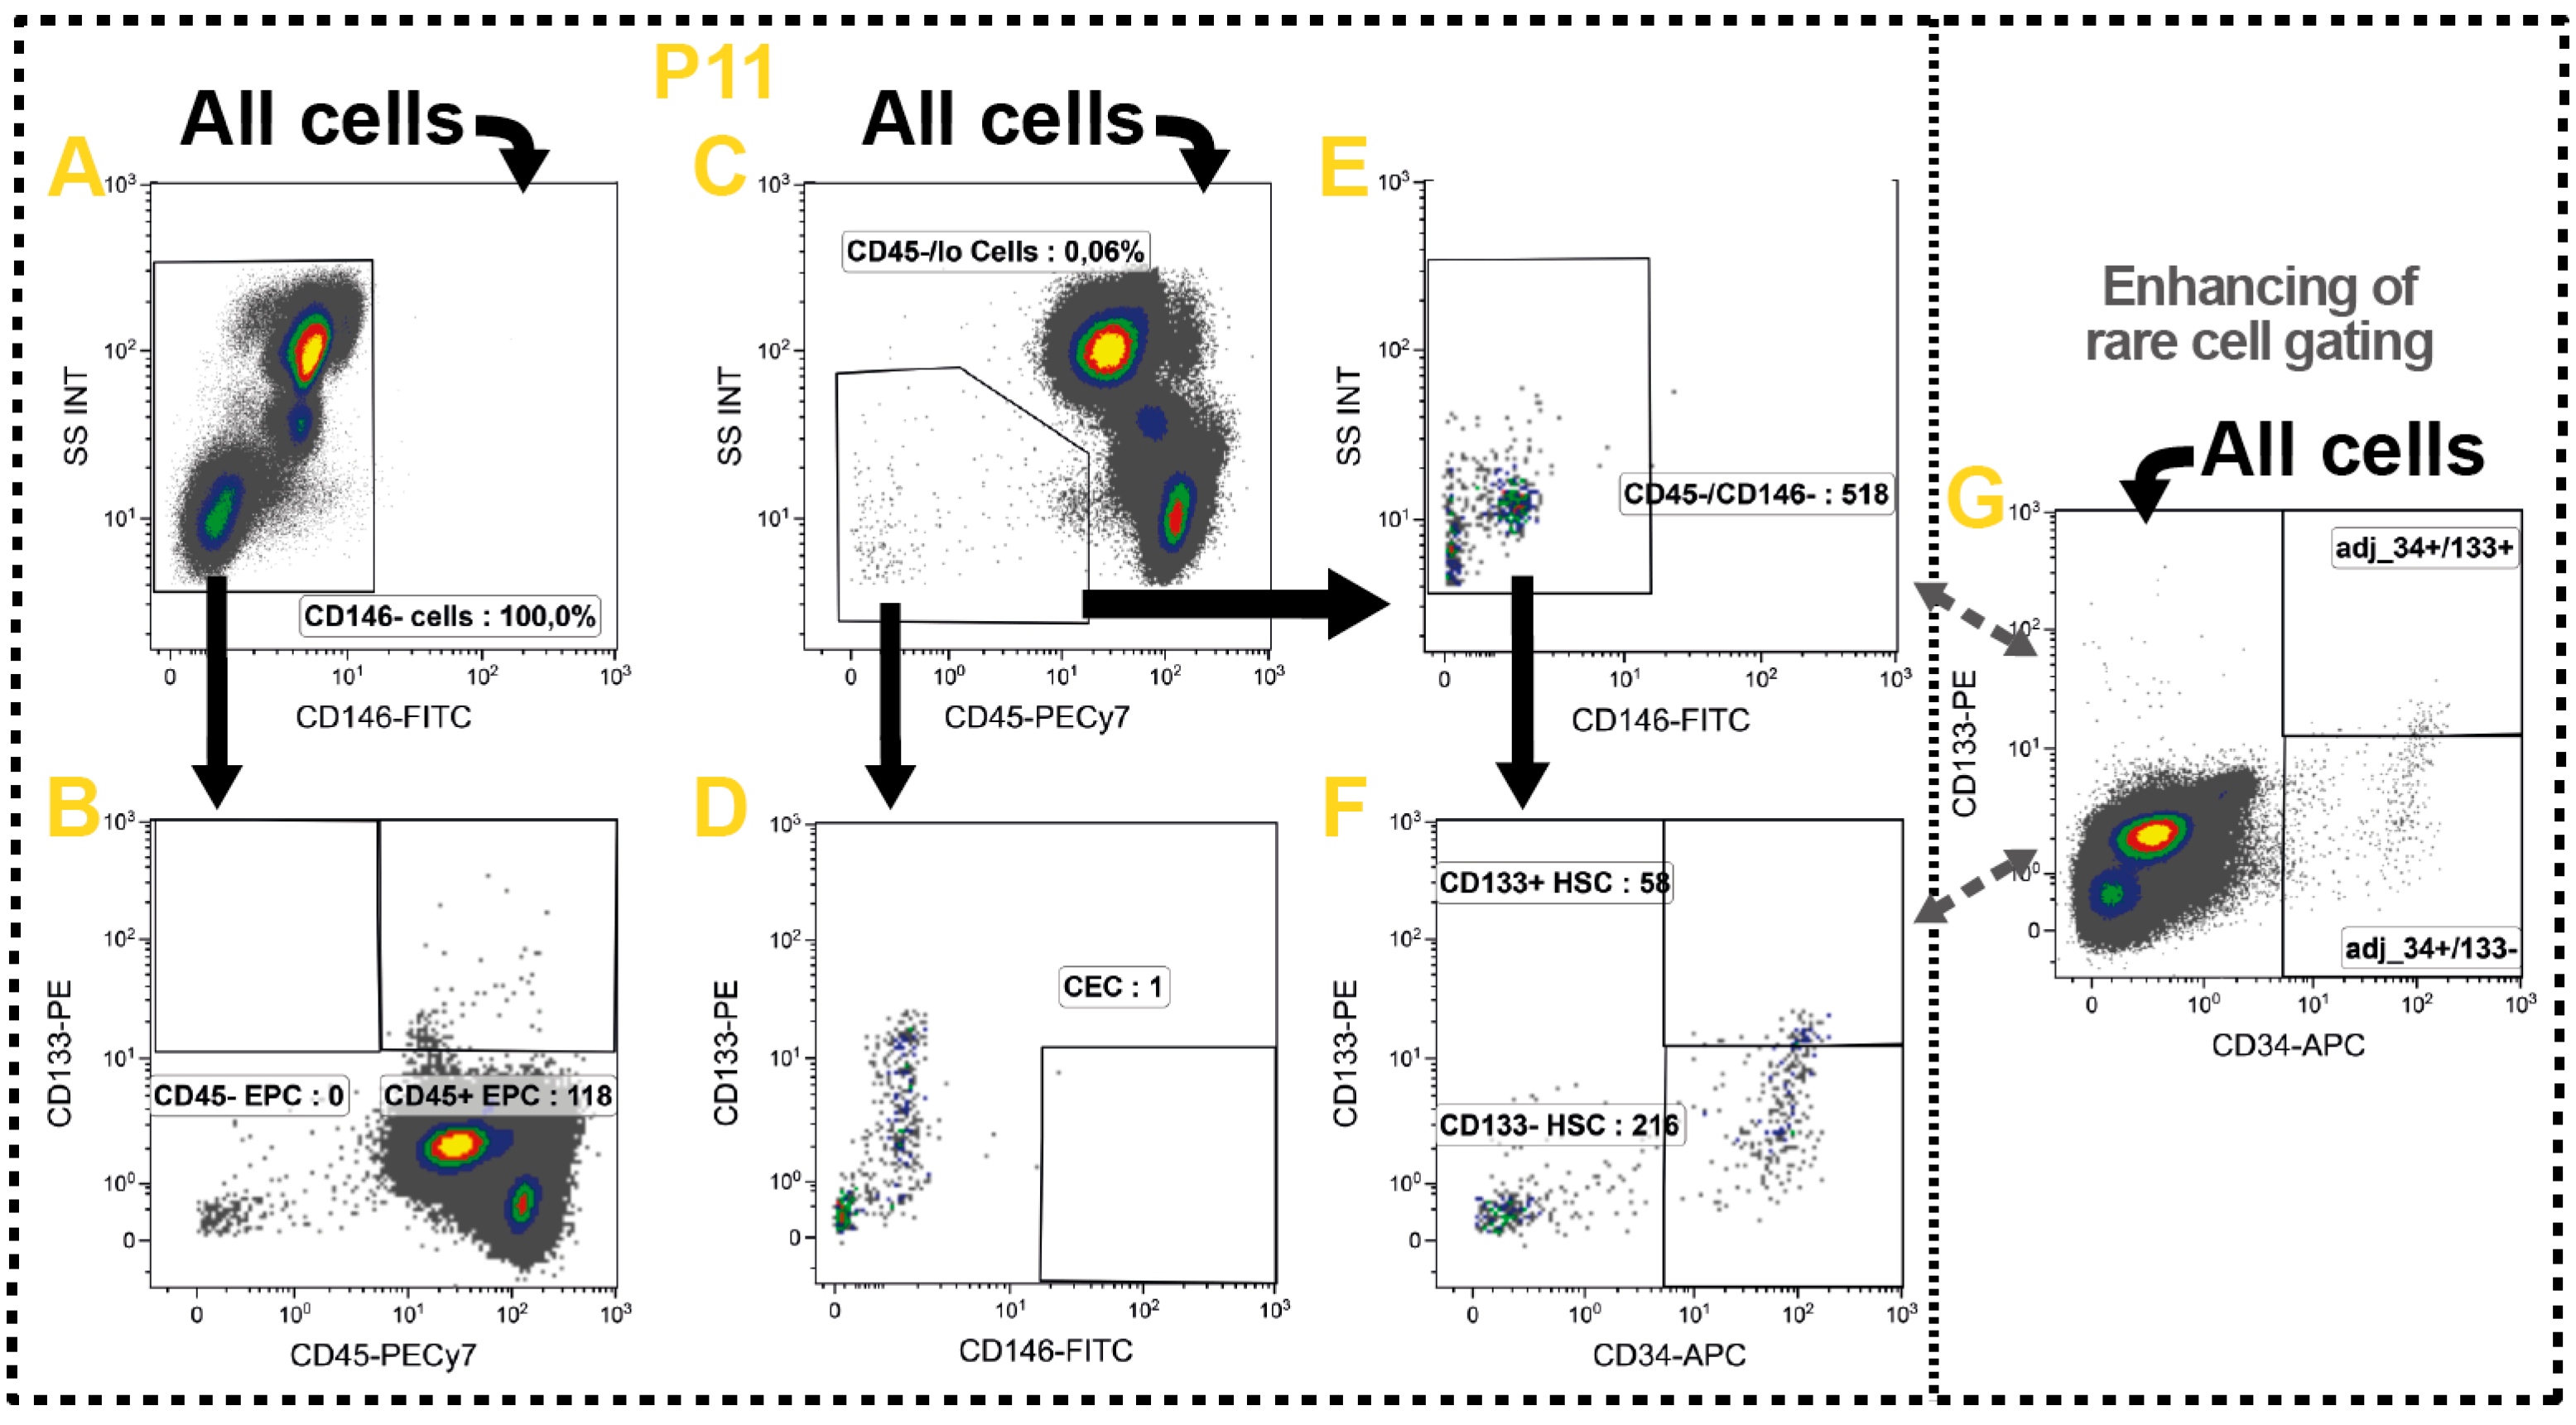
2.10. Non-Immune Cells
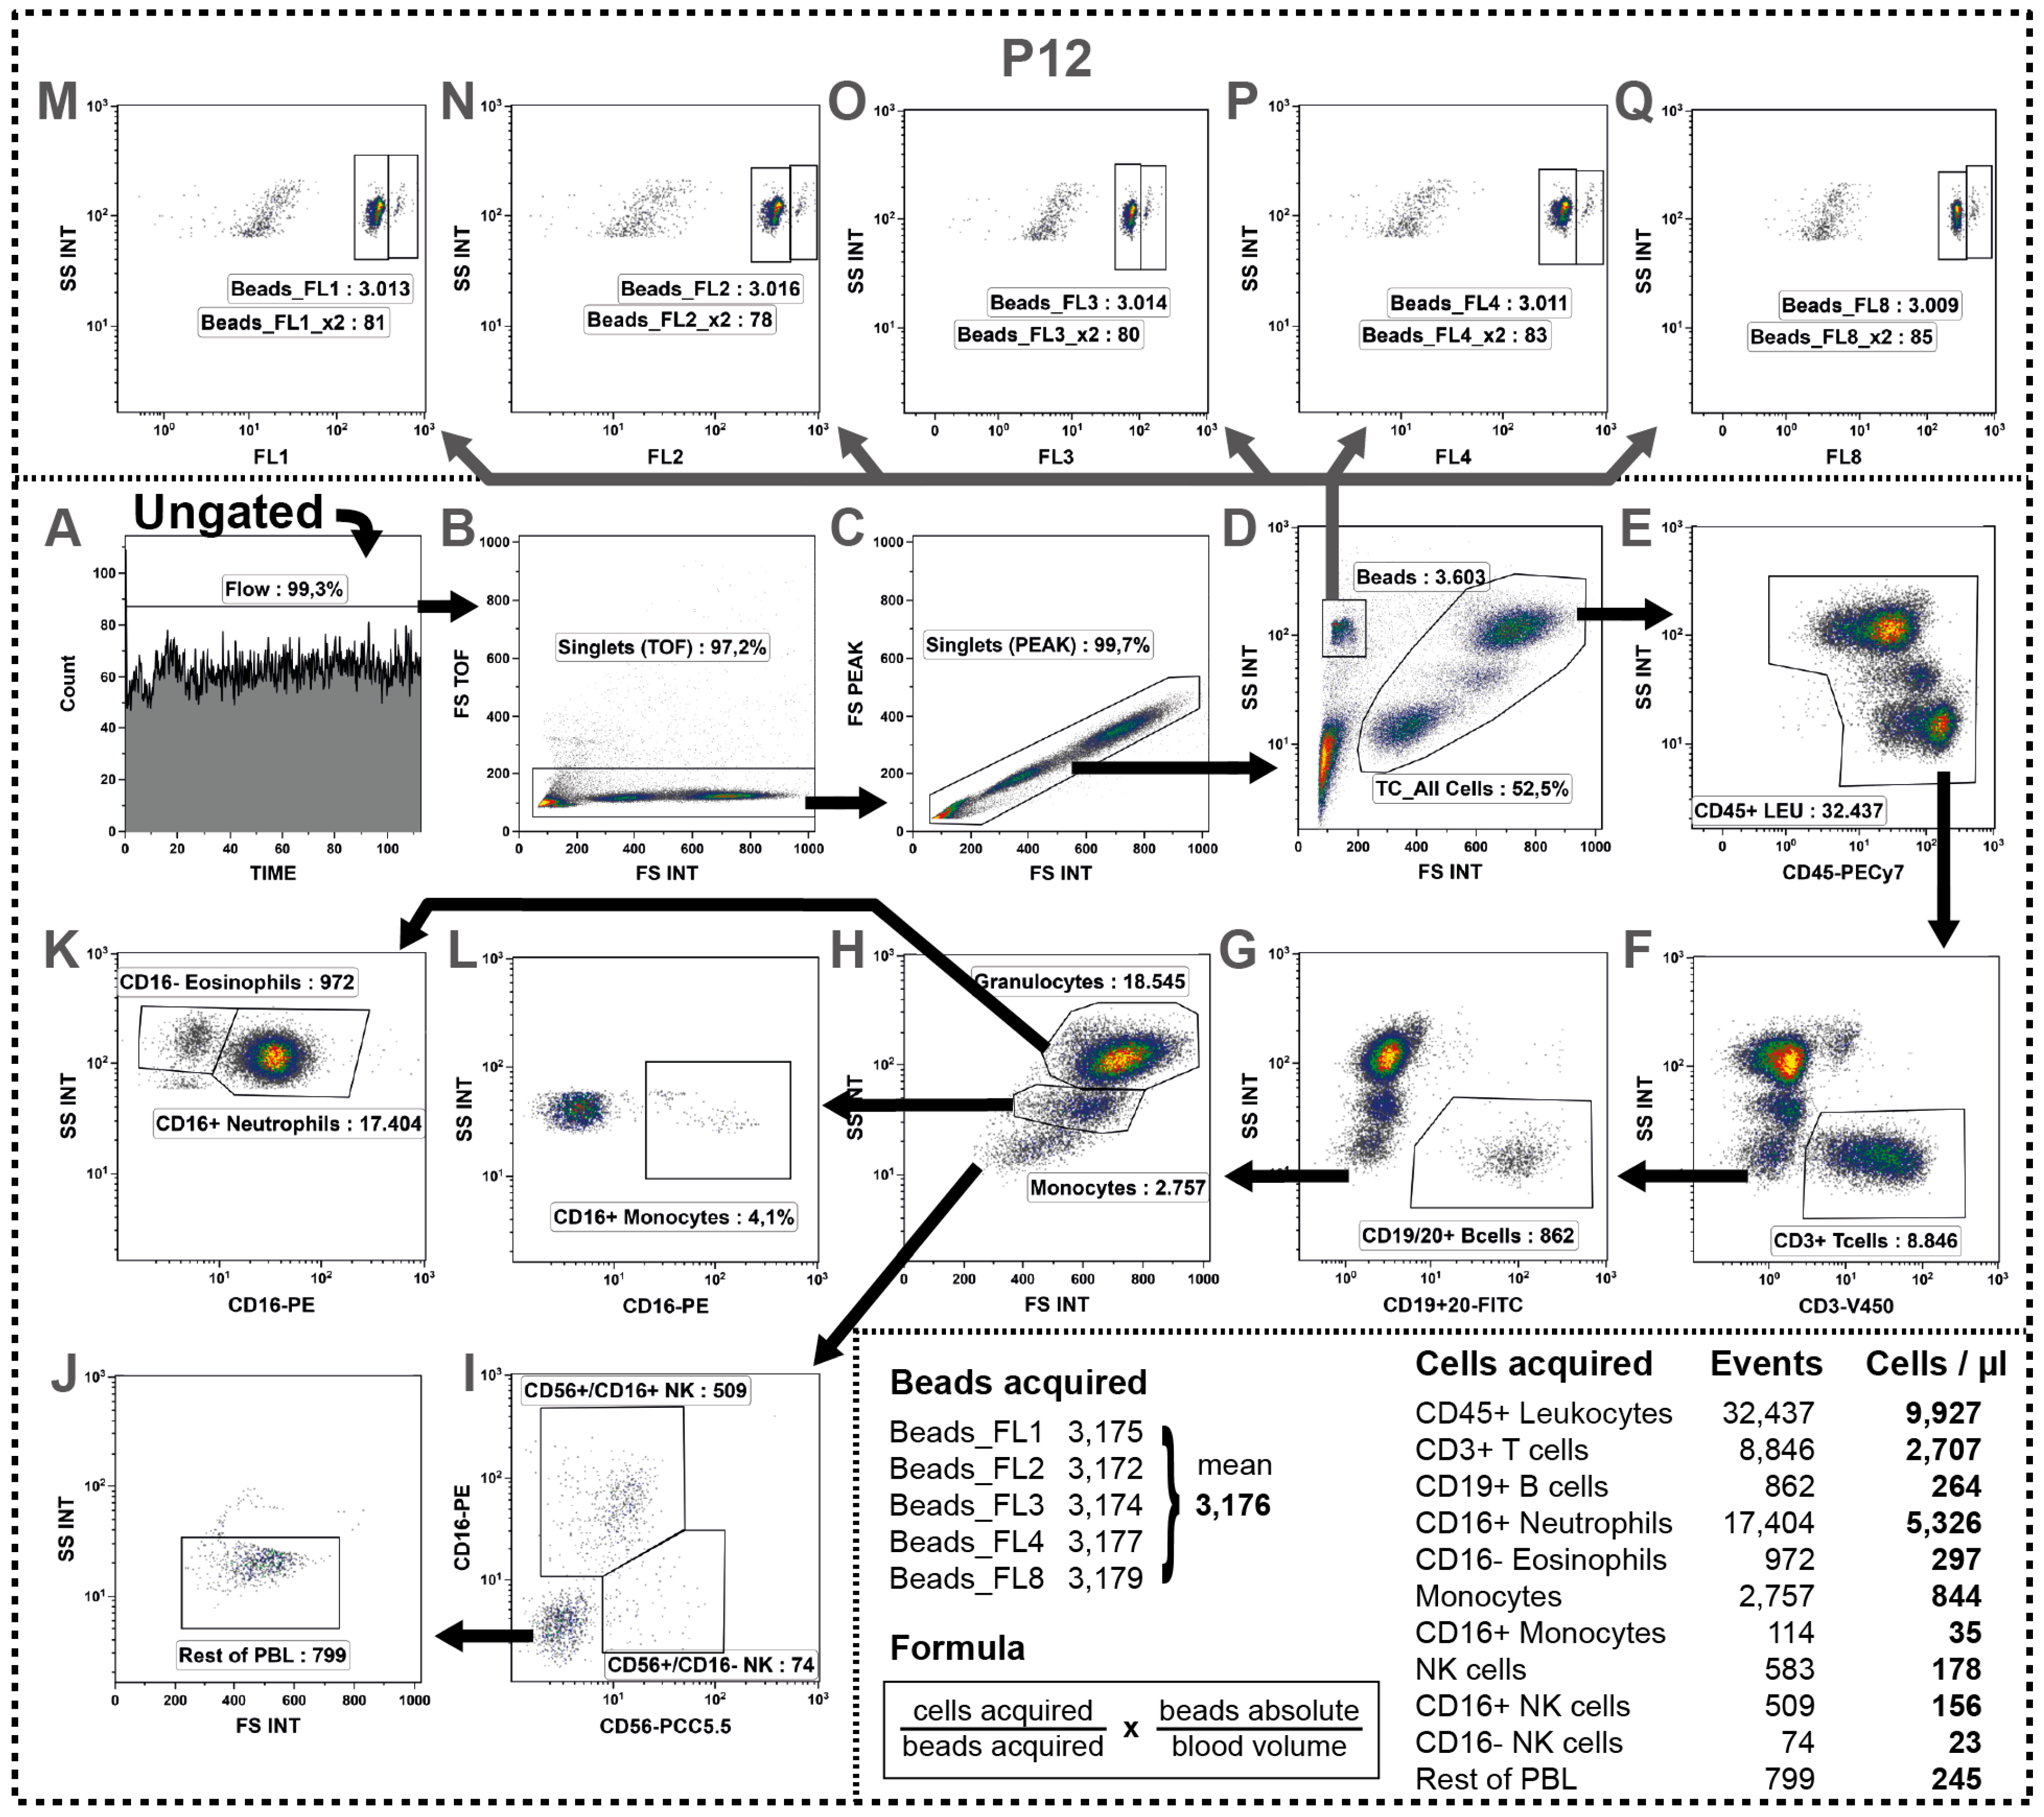
2.11. Determination of Absolute Cell Numbers
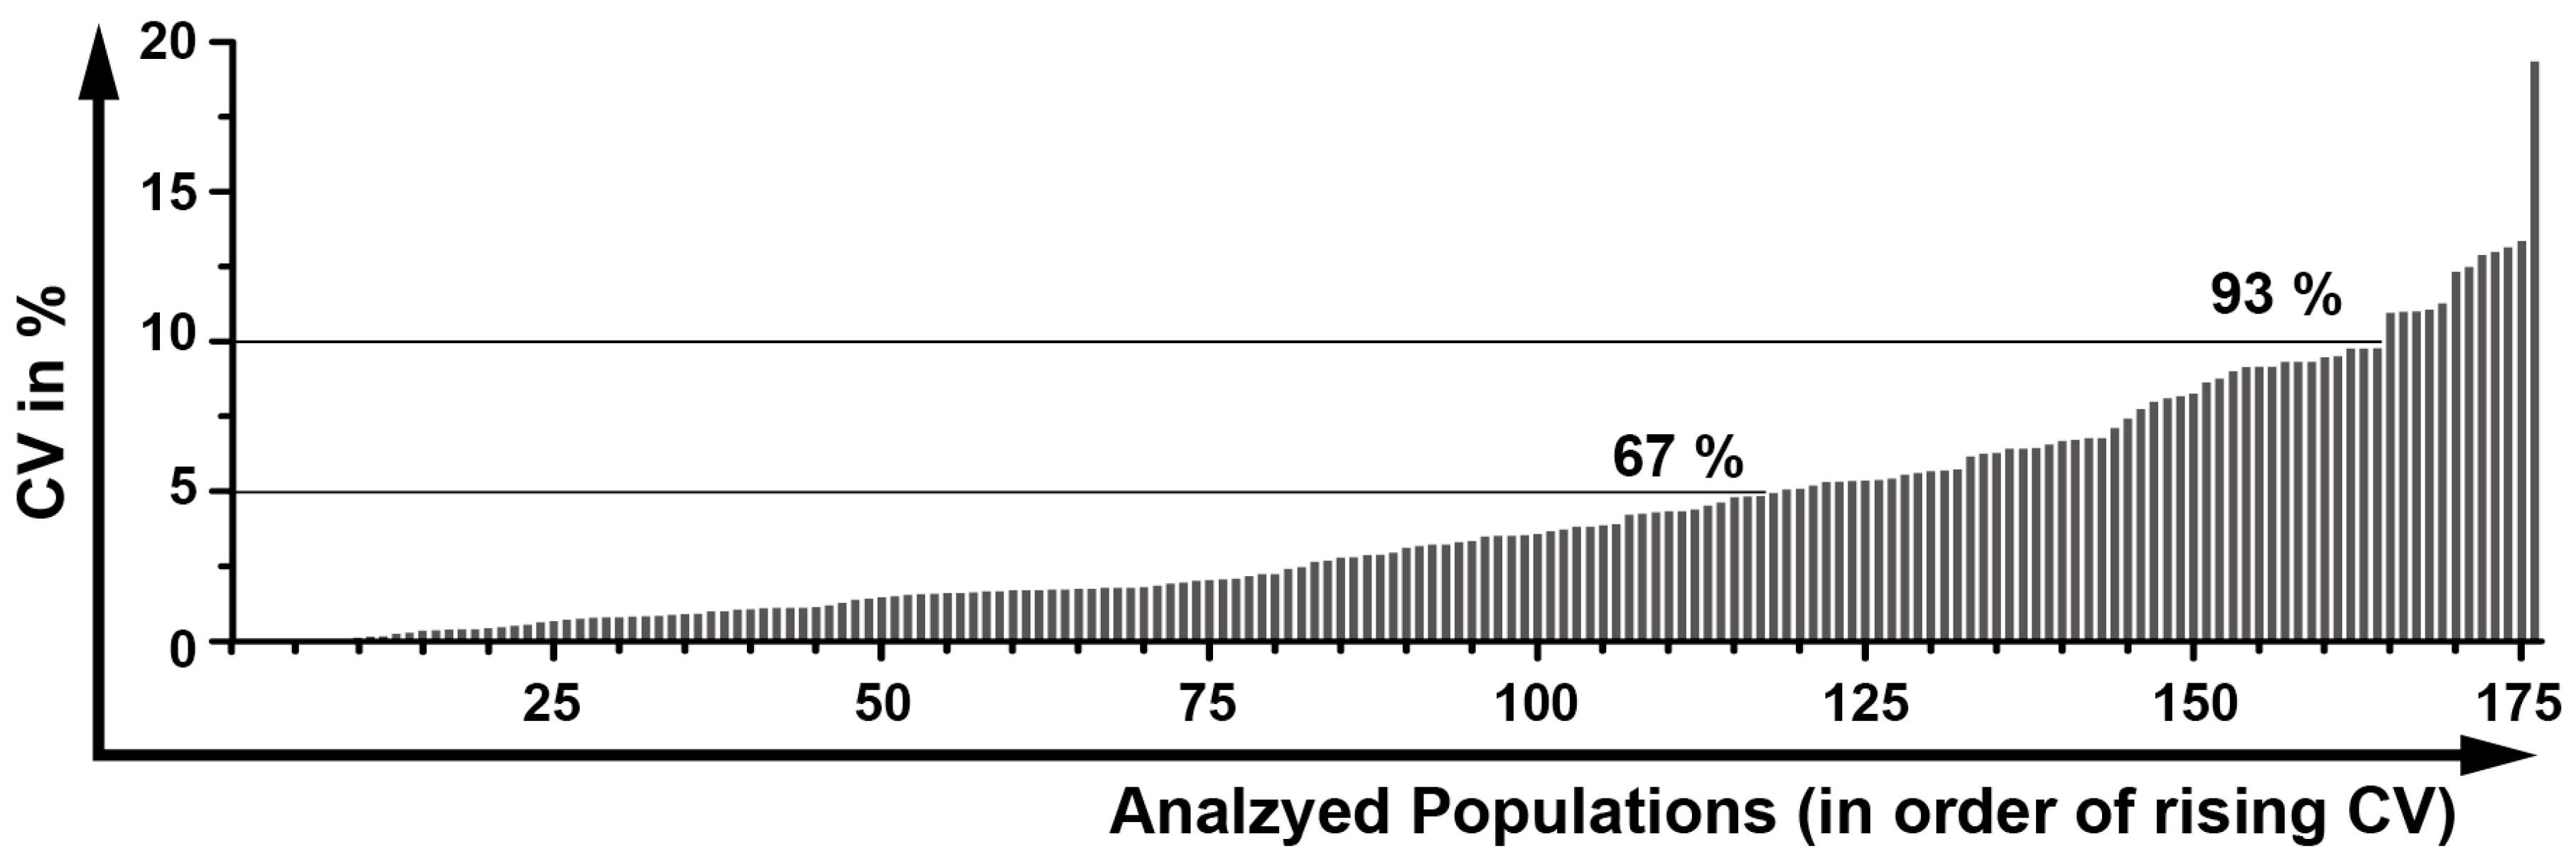
2.12. Determination of a General Assay Robustness
3. Discussion
4. Materials and Methods
4.1. Blood Withdrawals from Healthy Donors
4.2. Choice of the Antibodies and Preliminaries
4.3. Sample Preparation
4.4. Data Acquisition
4.5. Data Analysis
4.6. Assay Robustness
Supplementary Materials
Acknowledgments
Author Contributions
Conflicts of Interest
Abbreviations
| BREG | B10 regulatory B cell |
| CD | Cluster of differentiation |
| CEC | Circulating endothelial cell |
| CTLA4 | Cytotoxic T lymphocyte-associated protein 4 (CD152) |
| CV | Coefficient of variation |
| DC | Dendritic cell |
| DIoB | Detailed Immunophenotyping of Blood |
| DNT | Double negative T cell |
| DPT | Double positive T cell |
| EPC | Endothelial progenitor cells |
| FMO | Fluorescence minus one |
| FSC | Forward scatter |
| HPC | Hematopoietic stem cell |
| NHD | Normal healthy donor |
| P | Panel |
| PD-1 | Programmed cell death protein-1 (CD274) |
| PD-L1 | Programmed death-ligand 1 (CD279) |
| PFA | Paraformaldehyde |
| SSC | Side scatter |
| TC | Cytotoxic T cell |
| TCM | Central memory T cell |
| TEff | Effector T cell |
| TEM | Effector memory T cell |
| TH | T helper cell |
| TREG | Regulatory T cell |
| A488 | Alexa-488 |
| APC | Allophycocyanin |
| APCH7 | APC-H7 |
| APCR700 | APC-R700 |
| APCV770 | APC-Vio770 |
| BV421 | Brilliant Violet 421 |
| FITC | Fluorescein isothiocyanate |
| KO | Krome Orange |
| PCC5.5 | PerCp-Cy5.5 |
| PE | Phycoerythrin |
| PECy7 | PE-Cy7 |
| PEV770 | PE-Vio770 |
| V450 | Horizon V450 |
References
- Galon, J.; Angell, H.K.; Bedognetti, D.; Marincola, F.M. The continuum of cancer immunosurveillance: Prognostic, predictive, and mechanistic signatures. Immunity 2013, 39, 11–26. [Google Scholar] [PubMed]
- Derer, A.; Frey, B.; Fietkau, R.; Gaipl, U.S. Immune-modulating properties of ionizing radiation: Rationale for the treatment of cancer by combination radiotherapy and immune checkpoint inhibitors. Cancer Immunol. Immunother. 2015, 65, 779–786. [Google Scholar] [CrossRef] [PubMed]
- Balermpas, P.; Rodel, F.; Liberz, R.; Oppermann, J.; Wagenblast, J.; Ghanaati, S.; Harter, P.N.; Mittelbronn, M.; Weiss, C.; Rodel, C.; et al. Head and neck cancer relapse after chemoradiotherapy correlates with CD163+ macrophages in primary tumour and CD11b+ myeloid cells in recurrences. Br. J. Cancer 2014, 111, 1509–1518. [Google Scholar] [CrossRef] [PubMed]
- Ordonez, R.; Henriquez-Hernandez, L.A.; Federico, M.; Valenciano, A.; Pinar, B.; Lloret, M.; Bordon, E.; Rodriguez-Gallego, C.; Lara, P.C. Radio-induced apoptosis of peripheral blood CD8 T lymphocytes is a novel prognostic factor for survival in cervical carcinoma patients. Strahlenther. Onkol. 2014, 190, 210–216. [Google Scholar] [CrossRef]
- Persa, E.; Balogh, A.; Safrany, G.; Lumniczky, K. The effect of ionizing radiation on regulatory T cells in health and disease. Cancer Lett. 2015, 368, 252–261. [Google Scholar] [PubMed]
- Dovedi, S.J.; Adlard, A.L.; Lipowska-Bhalla, G.; McKenna, C.; Jones, S.; Cheadle, E.J.; Stratford, I.J.; Poon, E.; Morrow, M.; Stewart, R.; et al. Acquired resistance to fractionated radiotherapy can be overcome by concurrent PD-L1 blockade. Cancer Res. 2014, 74, 5458–5468. [Google Scholar] [CrossRef]
- Bjoern, J.; Brimnes, M.K.; Andersen, M.H.; Thor Straten, P.; Svane, I.M. Changes in peripheral blood level of regulatory T cells in patients with malignant melanoma during treatment with dendritic cell vaccination and low-dose IL-2. Scand. J. Immunol. 2011, 73, 222–233. [Google Scholar] [PubMed]
- Sage, E.K.; Schmid, T.E.; Sedelmayr, M.; Gehrmann, M.; Geinitz, H.; Duma, M.N.; Combs, S.E.; Multhoff, G. Comparative analysis of the effects of radiotherapy versus radiotherapy after adjuvant chemotherapy on the composition of lymphocyte subpopulations in breast cancer patients. Radiother. Oncol. 2016, 118, 176–180. [Google Scholar] [PubMed]
- Frey, B.; Strnad, A.; Buslei, R.; Fietkau, R.; Gaipl, U.S. Primary glioblastoma multiforme tumors and recurrence: Comparative analysis of the danger signals HMGB1, HSP70, and calreticulin. Strahlenther. Onkol. 2016, 192, 146–155. [Google Scholar]
- Chattopadhyay, P.K.; Roederer, M. Cytometry: Today’s technology and tomorrow’s horizons. Methods 2012, 57, 251–258. [Google Scholar] [CrossRef] [PubMed]
- Mahnke, Y.D.; Beddall, M.H.; Roederer, M. OMIP-013: Differentiation of human T-cells. Cytom. Part A 2012, 81, 935–936. [Google Scholar] [CrossRef]
- Mahnke, Y.D.; Beddall, M.H.; Roederer, M. OMIP-029: Human NK-cell phenotypization. Cytom. Part A 2015, 87, 986–988. [Google Scholar]
- Wistuba-Hamprecht, K.; Pawelec, G.; Derhovanessian, E. OMIP-020: Phenotypic characterization of human γδ T-cells by multicolor flow cytometry. Cytom. Part A 2014, 85, 522–524. [Google Scholar]
- Preijers, F.W.; Huys, E.; Favre, C.; Moshaver, B. Establishment of harmonization in immunophenotyping: A comparative study of a standardized one-tube lymphocyte-screening panel. Cytom. Part B: Clin. Cytom. 2014, 86, 418–425. [Google Scholar] [CrossRef]
- Gustafson, M.P.; Lin, Y.; Maas, M.L.; van Keulen, V.P.; Johnston, P.B.; Peikert, T.; Gastineau, D.A.; Dietz, A.B. A method for identification and analysis of non-overlapping myeloid immunophenotypes in humans. PLoS ONE 2015, 10, e0121546. [Google Scholar]
- Bocsi, J.; Melzer, S.; Dahnert, I.; Tarnok, A. OMIP-023: 10-color, 13 antibody panel for in-depth phenotyping of human peripheral blood leukocytes. Cytom. Part A 2014, 85, 781–784. [Google Scholar]
- Moncunill, G.; Han, H.; Dobano, C.; McElrath, M.J.; de Rosa, S.C. OMIP-024: Pan-leukocyte immunophenotypic characterization of PBMC subsets in human samples. Cytom. Part A 2014, 85, 995–998. [Google Scholar]
- Maecker, H.T.; McCoy, J.P.; Nussenblatt, R. Standardizing immunophenotyping for the human immunology project. Nat. Rev. Immunol. 2012, 12, 191–200. [Google Scholar] [PubMed]
- Finak, G.; Langweiler, M.; Jaimes, M.; Malek, M.; Taghiyar, J.; Korin, Y.; Raddassi, K.; Devine, L.; Obermoser, G.; Pekalski, M.L.; et al. Standardizing flow cytometry immunophenotyping analysis from the human immunophenotyping consortium. Sci. Rep. 2016, 6, 20686. [Google Scholar]
- Streitz, M.; Miloud, T.; Kapinsky, M.; Reed, M.R.; Magari, R.; Geissler, E.K.; Hutchinson, J.A.; Vogt, K.; Schlickeiser, S.; Kverneland, A.H.; et al. Standardization of whole blood immune phenotype monitoring for clinical trials: Panels and methods from the ONE study. Transplant. Res. 2013, 2, 17. [Google Scholar] [PubMed]
- Trautmann, A.; Rückert, B.; Schmid-Grendelmeier, P.; Niederer, E.; Bröcker, E.-B.; Blaser, K.; Akdis, C.A. Human CD8 T cells of the peripheral blood contain a low CD8 expressing cytotoxic/effector subpopulation. Immunology 2003, 108, 305–312. [Google Scholar] [CrossRef] [PubMed]
- Sallusto, F.; Lenig, D.; Forster, R.; Lipp, M.; Lanzavecchia, A. Two subsets of memory T lymphocytes with distinct homing potentials and effector functions. Nature 1999, 401, 708–712. [Google Scholar] [CrossRef] [PubMed]
- Fritsch, R.D.; Shen, X.; Sims, G.P.; Hathcock, K.S.; Hodes, R.J.; Lipsky, P.E. Stepwise differentiation of CD4 memory T cells defined by expression of CCR7 and CD27. J. Immunol. 2005, 175, 6489–6497. [Google Scholar] [PubMed]
- Acosta-Rodriguez, E.V.; Rivino, L.; Geginat, J.; Jarrossay, D.; Gattorno, M.; Lanzavecchia, A.; Sallusto, F.; Napolitani, G. Surface phenotype and antigenic specificity of human interleukin 17-producing T helper memory cells. Nat. Immunol. 2007, 8, 639–646. [Google Scholar] [PubMed]
- Seddiki, N.; Santner-Nanan, B.; Martinson, J.; Zaunders, J.; Sasson, S.; Landay, A.; Solomon, M.; Selby, W.; Alexander, S.I.; Nanan, R.; et al. Expression of interleukin (IL)-2 and IL-7 receptors discriminates between human regulatory and activated T cells. J. Exp. Med. 2006, 203, 1693–1700. [Google Scholar] [CrossRef] [PubMed]
- Annunziato, F.; Cosmi, L.; Santarlasci, V.; Maggi, L.; Liotta, F.; Mazzinghi, B.; Parente, E.; Fili, L.; Ferri, S.; Frosali, F.; et al. Phenotypic and functional features of human Th17 cells. J. Exp. Med. 2007, 204, 1849–1861. [Google Scholar] [CrossRef] [PubMed]
- Codarri, L.; Vallotton, L.; Ciuffreda, D.; Venetz, J.P.; Garcia, M.; Hadaya, K.; Buhler, L.; Rotman, S.; Pascual, M.; Pantaleo, G. Expansion and tissue infiltration of an allospecific CD4+CD25+CD45RO+IL-7 Rαhigh cell population in solid organ transplant recipients. J. Exp. Med. 2007, 204, 1533–1541. [Google Scholar] [CrossRef] [PubMed]
- Liu, W.; Putnam, A.L.; Xu-Yu, Z.; Szot, G.L.; Lee, M.R.; Zhu, S.; Gottlieb, P.A.; Kapranov, P.; Gingeras, T.R.; Fazekas de St Groth, B.; et al. CD127 expression inversely correlates with FoxP3 and suppressive function of human CD4+ T reg cells. J. Exp. Med. 2006, 203, 1701–1711. [Google Scholar] [CrossRef] [PubMed]
- Andreu-Ballester, J.C.; Garcia-Ballesteros, C.; Benet-Campos, C.; Amigo, V.; Almela-Quilis, A.; Mayans, J.; Ballester, F. Values for αβ and γδ T-lymphocytes and CD4+, CD8+, and CD56+ subsets in healthy adult subjects: Assessment by age and gender. Cytom. Part B: Clin. Cytom. 2012, 82, 238–244. [Google Scholar] [CrossRef] [PubMed]
- Sandoval-Montes, C.; Santos-Argumedo, L. CD38 is expressed selectively during the activation of a subset of mature T cells with reduced proliferation but improved potential to produce cytokines. J. Leukoc. Biol. 2005, 77, 513–521. [Google Scholar] [CrossRef] [PubMed]
- Salgado, F.J.; Lojo, J.; Fernandez-Alonso, C.M.; Vinuela, J.; Cordero, O.J.; Nogueira, M. Interleukin-dependent modulation of HLA-DR expression on CD4 and CD8 activated T cells. Immunol. Cell Biol. 2002, 80, 138–147. [Google Scholar] [PubMed]
- LaSalle, J.M.; Ota, K.; Hafler, D.A. Presentation of autoantigen by human T cells. J. Immunol. 1991, 147, 774–780. [Google Scholar] [PubMed]
- Keir, M.E.; Butte, M.J.; Freeman, G.J.; Sharpe, A.H. PD-1 and its ligands in tolerance and immunity. Annu. Rev. Immunol. 2008, 26, 677–704. [Google Scholar] [CrossRef]
- Mahoney, K.M.; Freeman, G.J.; McDermott, D.F. The next immune-checkpoint inhibitors: PD-1/PD-L1 blockade in melanoma. Clin. Ther. 2015, 37, 764–782. [Google Scholar] [CrossRef] [PubMed]
- Ginaldi, L.; de Martinis, M.; Matutes, E.; Farahat, N.; Morilla, R.; Catovsky, D. Levels of expression of CD19 and CD20 in chronic B cell leukaemias. J. Clin. Pathol. 1998, 51, 364–369. [Google Scholar] [CrossRef] [PubMed]
- Perez-Andres, M.; Paiva, B.; Nieto, W.G.; Caraux, A.; Schmitz, A.; Almeida, J.; Vogt, R.F., Jr.; Marti, G.E.; Rawstron, A.C.; van Zelm, M.C.; et al. Human peripheral blood B-cell compartments: A crossroad in B-cell traffic. Cytom. Part B: Clin. Cytom. 2010, 78B, S47–S60. [Google Scholar]
- Jackson, S.M.; Wilson, P.C.; James, J.A.; Capra, J.D. Human B cell subsets. Adv. Immunol. 2008, 98, 151–224. [Google Scholar] [PubMed]
- Lee, J.; Kuchen, S.; Fischer, R.; Chang, S.; Lipsky, P.E. Identification and characterization of a human CD5+ pre-naive B cell population. J. Immunol. 2009, 182, 4116–4126. [Google Scholar] [PubMed]
- Klein, U.; Rajewsky, K.; Kuppers, R. Human immunoglobulin (Ig)M+IgD+ peripheral blood B cells expressing the CD27 cell surface antigen carry somatically mutated variable region genes: CD27 as a general marker for somatically mutated (memory) B cells. J. Exp. Med. 1998, 188, 1679–1689. [Google Scholar] [PubMed]
- Agematsu, K.; Hokibara, S.; Nagumo, H.; Komiyama, A. CD27: A memory B-cell marker. Immunol. Today 2000, 21, 204–206. [Google Scholar] [PubMed]
- Agematsu, K.; Nagumo, H.; Yang, F.C.; Nakazawa, T.; Fukushima, K.; Ito, S.; Sugita, K.; Mori, T.; Kobata, T.; Morimoto, C.; et al. B cell subpopulations separated by CD27 and crucial collaboration of CD27+ B cells and helper T cells in immunoglobulin production. Eur. J. Immunol. 1997, 27, 2073–2079. [Google Scholar] [CrossRef]
- Marie-Cardine, A.; Divay, F.; Dutot, I.; Green, A.; Perdrix, A.; Boyer, O.; Contentin, N.; Tilly, H.; Tron, F.; Vannier, J.P.; et al. Transitional B cells in humans: Characterization and insight from B lymphocyte reconstitution after hematopoietic stem cell transplantation. Clin. Immunol. 2008, 127, 14–25. [Google Scholar] [CrossRef] [PubMed]
- Sims, G.P.; Ettinger, R.; Shirota, Y.; Yarboro, C.H.; Illei, G.G.; Lipsky, P.E. Identification and characterization of circulating human transitional B cells. Blood 2005, 105, 4390–4398. [Google Scholar] [CrossRef] [PubMed]
- Wehr, C.; Eibel, H.; Masilamani, M.; Illges, H.; Schlesier, M.; Peter, H.H.; Warnatz, K. A new CD21low B cell population in the peripheral blood of patients with SLE. Clin. Immunol. 2004, 113, 161–171. [Google Scholar] [CrossRef]
- Iwata, Y.; Matsushita, T.; Horikawa, M.; Dilillo, D.J.; Yanaba, K.; Venturi, G.M.; Szabolcs, P.M.; Bernstein, S.H.; Magro, C.M.; Williams, A.D.; et al. Characterization of a rare IL-10-competent B-cell subset in humans that parallels mouse regulatory B10 cells. Blood 2011, 117, 530–541. [Google Scholar] [PubMed]
- Lanier, L.L.; Testi, R.; Bindl, J.; Phillips, J.H. Identity of Leu-19 (CD56) leukocyte differentiation antigen and neural cell adhesion molecule. J. Exp. Med. 1989, 169, 2233–2238. [Google Scholar] [CrossRef] [PubMed]
- Lanier, L.L.; Le, A.M.; Civin, C.I.; Loken, M.R.; Phillips, J.H. The relationship of CD16 (Leu-11) and Leu-19 (NKH-1) antigen expression on human peripheral blood NK cells and cytotoxic T lymphocytes. J. Immunol. 1986, 136, 4480–4486. [Google Scholar] [PubMed]
- Bjorkstrom, N.K.; Ljunggren, H.G.; Sandberg, J.K. CD56 negative NK cells: Origin, function, and role in chronic viral disease. Trends Immunol. 2010, 31, 401–406. [Google Scholar] [PubMed]
- Yu, J.; Mao, H.C.; Wei, M.; Hughes, T.; Zhang, J.; Park, I.K.; Liu, S.; McClory, S.; Marcucci, G.; Trotta, R.; et al. CD94 surface density identifies a functional intermediary between the CD56bright and CD56dim human NK-cell subsets. Blood 2010, 115, 274–281. [Google Scholar] [PubMed]
- Fauriat, C.; Long, E.O.; Ljunggren, H.G.; Bryceson, Y.T. Regulation of human NK-cell cytokine and chemokine production by target cell recognition. Blood 2010, 115, 2167–2176. [Google Scholar] [CrossRef] [PubMed]
- Moretta, L. Dissecting CD56dim human NK cells. Blood 2010, 116, 3689–3691. [Google Scholar] [PubMed]
- Ravetch, J.V.; Bolland, S. IgG Fc receptors. Annu. Rev. Immunol. 2001, 19, 275–290. [Google Scholar] [CrossRef] [PubMed]
- Perussia, B.; Trinchieri, G.; Jackson, A.; Warner, N.L.; Faust, J.; Rumpold, H.; Kraft, D.; Lanier, L.L. The Fc receptor for IgG on human natural killer cells: Phenotypic, functional, and comparative studies with monoclonal antibodies. J. Immunol. 1984, 133, 180–189. [Google Scholar] [PubMed]
- Lenart, M.; Trzyna, E.; Rutkowska, M.; Bukowska-Strakova, K.; Szaflarska, A.; Pituch-Noworolska, A.; Szczepanik, A.; Zembala, M.; Siedlar, M. The loss of the CD16 B73.1/Leu11c epitope occurring in some primary immunodeficiency diseases is not associated with the FcγRIIIa-48L/R/H polymorphism. Int. J. Mol. Med. 2010, 26, 435–442. [Google Scholar] [PubMed]
- Carson, W.E.; Fehniger, T.A.; Caligiuri, M.A. CD56bright natural killer cell subsets: Characterization of distinct functional responses to interleukin-2 and the c-kit ligand. Eur. J. Immunol. 1997, 27, 354–360. [Google Scholar] [CrossRef] [PubMed]
- Gottschalk, L.R.; Bray, R.A.; Kaizer, H.; Gebel, H.M. Two populations of CD56 (Leu-19)+/CD16+ cells in bone marrow transplant recipients. Bone Marrow Transplant. 1990, 5, 259–264. [Google Scholar] [PubMed]
- Jacobs, R.; Hintzen, G.; Kemper, A.; Beul, K.; Kempf, S.; Behrens, G.; Sykora, K.W.; Schmidt, R.E. CD56bright cells differ in their KIR repertoire and cytotoxic features from CD56dim NK cells. Eur. J. Immunol. 2001, 31, 3121–3127. [Google Scholar] [PubMed]
- Montaldo, E.; del Zotto, G.; Della Chiesa, M.; Mingari, M.C.; Moretta, A.; de Maria, A.; Moretta, L. Human NK cell receptors/markers: A tool to analyze NK cell development, subsets and function. Cytom.Part A 2013, 83, 702–713. [Google Scholar] [CrossRef]
- Andre, P.; Castriconi, R.; Espeli, M.; Anfossi, N.; Juarez, T.; Hue, S.; Conway, H.; Romagne, F.; Dondero, A.; Nanni, M.; et al. Comparative analysis of human NK cell activation induced by NKG2D and natural cytotoxicity receptors. Eur. J. Immunol. 2004, 34, 961–971. [Google Scholar] [CrossRef] [PubMed]
- Bauer, S.; Groh, V.; Wu, J.; Steinle, A.; Phillips, J.H.; Lanier, L.L.; Spies, T. Activation of NK cells and T cells by NKG2D, a receptor for stress-inducible MICA. Science 1999, 285, 727–729. [Google Scholar] [CrossRef]
- Wu, J.; Song, Y.; Bakker, A.B.; Bauer, S.; Spies, T.; Lanier, L.L.; Phillips, J.H. An activating immunoreceptor complex formed by NKG2D and DAP10. Science 1999, 285, 730–732. [Google Scholar] [PubMed]
- Crane, C.A.; Han, S.J.; Barry, J.J.; Ahn, B.J.; Lanier, L.L.; Parsa, A.T. TGF-β downregulates the activating receptor NKG2D on NK cells and CD8+ T cells in glioma patients. Neuro-Oncology 2010, 12, 7–13. [Google Scholar] [PubMed]
- Muntasell, A.; Magri, G.; Pende, D.; Angulo, A.; Lopez-Botet, M. Inhibition of NKG2D expression in NK cells by cytokines secreted in response to human cytomegalovirus infection. Blood 2010, 115, 5170–5179. [Google Scholar]
- Romero, A.I.; Thoren, F.B.; Brune, M.; Hellstrand, K. NKp46 and NKG2D receptor expression in NK cells with CD56dim and CD56bright phenotype: Regulation by histamine and reactive oxygen species. Br. J. Haematol. 2006, 132, 91–98. [Google Scholar] [CrossRef] [PubMed]
- Benlahrech, A.; Donaghy, H.; Rozis, G.; Goodier, M.; Klavinskis, L.; Gotch, F.; Patterson, S. Human NK cell up-regulation of CD69, HLA-DR, interferon γ secretion and cytotoxic activity by plasmacytoid dendritic cells is regulated through overlapping but different pathways. Sensors 2009, 9, 386–403. [Google Scholar] [PubMed]
- Borrego, F.; Robertson, M.J.; Ritz, J.; Pena, J.; Solana, R. CD69 is a stimulatory receptor for natural killer cell and its cytotoxic effect is blocked by CD94 inhibitory receptor. Immunology 1999, 97, 159–165. [Google Scholar] [CrossRef] [PubMed]
- Clausen, J.; Vergeiner, B.; Enk, M.; Petzer, A.L.; Gastl, G.; Gunsilius, E. Functional significance of the activation-associated receptors CD25 and CD69 on human NK-cells and NK-like T-cells. Immunobiology 2003, 207, 85–93. [Google Scholar] [CrossRef] [PubMed]
- Borrego, F.; Masilamani, M.; Marusina, A.I.; Tang, X.; Coligan, J.E. The CD94/NKG2 family of receptors: From molecules and cells to clinical relevance. Immunol. Res. 2006, 35, 263–278. [Google Scholar] [PubMed]
- Al Omar, S.Y.; Marshall, E.; Middleton, D.; Christmas, S.E. Increased numbers but functional defects of CD56+CD3+ cells in lung cancer. Int. Immunol. 2012, 24, 409–415. [Google Scholar] [CrossRef] [PubMed]
- Alonso-Arias, R.; Moro-Garcia, M.A.; Lopez-Vazquez, A.; Rodrigo, L.; Baltar, J.; Garcia, F.M.; Jaurrieta, J.J.; Lopez-Larrea, C. NKG2D expression in CD4+ T lymphocytes as a marker of senescence in the aged immune system. Age 2011, 33, 591–605. [Google Scholar] [PubMed]
- Bjorkstrom, N.K.; Gonzalez, V.D.; Malmberg, K.J.; Falconer, K.; Alaeus, A.; Nowak, G.; Jorns, C.; Ericzon, B.G.; Weiland, O.; Sandberg, J.K.; et al. Elevated numbers of FcγRIIIA+ (CD16+) effector CD8 T cells with NK cell-like function in chronic hepatitis C virus infection. J. Immunol. 2008, 181, 4219–4228. [Google Scholar] [CrossRef] [PubMed]
- Bodman-Smith, M.D.; Anand, A.; Durand, V.; Youinou, P.Y.; Lydyard, P.M. Decreased expression of FcγRIII (CD16) by γδ T cells in patients with rheumatoid arthritis. Immunology 2000, 99, 498–503. [Google Scholar] [CrossRef] [PubMed]
- Clemenceau, B.; Vivien, R.; Berthome, M.; Robillard, N.; Garand, R.; Gallot, G.; Vollant, S.; Vie, H. Effector memory αβ T lymphocytes can express FcγRIIIa and mediate antibody-dependent cellular cytotoxicity. J. Immunol. 2008, 180, 5327–5334. [Google Scholar] [CrossRef] [PubMed]
- Michel, J.J.; Turesson, C.; Lemster, B.; Atkins, S.R.; Iclozan, C.; Bongartz, T.; Wasko, M.C.; Matteson, E.L.; Vallejo, A.N. CD56-expressing T cells that have features of senescence are expanded in rheumatoid arthritis. Arthritis Rheum. 2007, 56, 43–57. [Google Scholar] [CrossRef] [PubMed]
- Guilliams, M.; Ginhoux, F.; Jakubzick, C.; Naik, S.H.; Onai, N.; Schraml, B.U.; Segura, E.; Tussiwand, R.; Yona, S. Dendritic cells, monocytes and macrophages: A unified nomenclature based on ontogeny. Nat. Rev. Immunol. 2014, 14, 571–578. [Google Scholar] [PubMed]
- Van Vugt, M.J.; van den Herik-Oudijk, I.E.; van de Winkle, J.G. Binding of PE-CY5 conjugates to the human high-affinity receptor for IgG (CD64). Blood 1996, 88, 2358–2361. [Google Scholar] [PubMed]
- Beavis, A.J.; Pennline, K.J. ALLO-7: A new fluorescent tandem dye for use in flow cytometry. Cytometry 1996, 24, 390–395. [Google Scholar] [CrossRef]
- Thomas, R.; Lipsky, P.E. Human peripheral blood dendritic cell subsets. Isolation and characterization of precursor and mature antigen-presenting cells. J. Immunol. 1994, 153, 4016–4028. [Google Scholar] [PubMed]
- Gustafson, M.P.; Lin, Y.; LaPlant, B.; Liwski, C.J.; Maas, M.L.; League, S.C.; Bauer, P.R.; Abraham, R.S.; Tollefson, M.K.; Kwon, E.D.; et al. Immune monitoring using the predictive power of immune profiles. J. Immunother. Cancer 2013, 1, 1–11. [Google Scholar]
- Creery, W.D.; Diaz-Mitoma, F.; Filion, L.; Kumar, A. Differential modulation of B7-1 and B7-2 isoform expression on human monocytes by cytokines which influence the development of T helper cell phenotype. Eur. J. Immunol. 1996, 26, 1273–1277. [Google Scholar] [PubMed]
- Li, Y.; Lee, P.Y.; Sobel, E.S.; Narain, S.; Satoh, M.; Segal, M.S.; Reeves, W.H.; Richards, H.B. Increased expression of FcγRI/CD64 on circulating monocytes parallels ongoing inflammation and nephritis in lupus. Arthritis Res. Ther. 2009, 11, R6. [Google Scholar] [PubMed]
- Gerrard, T.L.; Dyer, D.R.; Mostowski, H.S. IL-4 and granulocyte-macrophage colony-stimulating factor selectively increase HLA-DR and HLA-DP antigens but not HLA-DQ antigens on human monocytes. J. Immunol. 1990, 144, 4670–4674. [Google Scholar] [PubMed]
- Kim, O.Y.; Monsel, A.; Bertrand, M.; Coriat, P.; Cavaillon, J.M.; Adib-Conquy, M. Differential down-regulation of HLA-DR on monocyte subpopulations during systemic inflammation. Crit. Care 2010, 14, R61. [Google Scholar] [CrossRef] [PubMed]
- Antoniades, C.G.; Berry, P.A.; Davies, E.T.; Hussain, M.; Bernal, W.; Vergani, D.; Wendon, J. Reduced monocyte HLA-DR expression: A novel biomarker of disease severity and outcome in acetaminophen-induced acute liver failure. Hepatology 2006, 44, 34–43. [Google Scholar] [CrossRef] [PubMed]
- Cheadle, W.G.; Hershman, M.J.; Wellhausen, S.R.; Polk, H.C., Jr. HLA-DR antigen expression on peripheral blood monocytes correlates with surgical infection. Am. J. Surg. 1991, 161, 639–645. [Google Scholar] [CrossRef]
- Franke, A.; Lante, W.; Zoeller, L.G.; Kurig, E.; Weinhold, C.; Markewitz, A. Delayed recovery of human leukocyte antigen-DR expression after cardiac surgery with early non-lethal postoperative complications: Only an epiphenomenon? Interact Cardiovasc. Thorac. Surg. 2008, 7, 207–211. [Google Scholar] [PubMed]
- Haveman, J.W.; van den Berg, A.P.; Verhoeven, E.L.; Nijsten, M.W.; van den Dungen, J.J.; The, H.T.; Zwaveling, J.H. HLA-DR expression on monocytes and systemic inflammation in patients with ruptured abdominal aortic aneurysms. Crit. Care 2006, 10, R119. [Google Scholar] [CrossRef]
- Hershman, M.J.; Cheadle, W.G.; Wellhausen, S.R.; Davidson, P.F.; Polk, H.C., Jr. Monocyte HLA-DR antigen expression characterizes clinical outcome in the trauma patient. Br. J. Surg. 1990, 77, 204–207. [Google Scholar] [PubMed]
- Hofer, T.P.; Frankenberger, M.; Heimbeck, I.; Burggraf, D.; Wjst, M.; Wright, A.K.; Kerscher, M.; Nahrig, S.; Huber, R.M.; Fischer, R.; et al. Decreased expression of HLA-DQ and HLA-DR on cells of the monocytic lineage in cystic fibrosis. J. Mol. Med. 2014, 92, 1293–1304. [Google Scholar] [CrossRef]
- Monneret, G.; Lepape, A.; Voirin, N.; Bohe, J.; Venet, F.; Debard, A.L.; Thizy, H.; Bienvenu, J.; Gueyffier, F.; Vanhems, P. Persisting low monocyte human leukocyte antigen-DR expression predicts mortality in septic shock. Intensive Care Med. 2006, 32, 1175–1183. [Google Scholar] [PubMed]
- Richter, A.; Nebe, T.; Wendl, K.; Schuster, K.; Klaebisch, G.; Quintel, M.; Lorenz, D.; Post, S.; Trede, M. HLA-DR expression in acute pancreatitis. Eur. J. Surg. 1999, 165, 947–951. [Google Scholar] [CrossRef] [PubMed]
- Satoh, A.; Miura, T.; Satoh, K.; Masamune, A.; Yamagiwa, T.; Sakai, Y.; Shibuya, K.; Takeda, K.; Kaku, M.; Shimosegawa, T. Human leukocyte antigen-DR expression on peripheral monocytes as a predictive marker of sepsis during acute pancreatitis. Pancreas 2002, 25, 245–250. [Google Scholar] [CrossRef] [PubMed]
- Van den Berk, J.M.; Oldenburger, R.H.; van den Berg, A.P.; Klompmaker, I.J.; Mesander, G.; van Son, W.J.; an der Bij, W.; Sloof, M.J.; The, T.H. Low HLA-DR expression on monocytes as a prognostic marker for bacterial sepsis after liver transplantation. Transplantation 1997, 63, 1846–1848. [Google Scholar] [PubMed]
- Venet, F.; Tissot, S.; Debard, A.L.; Faudot, C.; Crampe, C.; Pachot, A.; Ayala, A.; Monneret, G. Decreased monocyte human leukocyte antigen-DR expression after severe burn injury: Correlation with severity and secondary septic shock. Crit. Care Med. 2007, 35, 1910–1917. [Google Scholar] [PubMed]
- Watt, S.M.; Sala-Newby, G.; Hoang, T.; Gilmore, D.J.; Grunert, F.; Nagel, G.; Murdoch, S.J.; Tchilian, E.; Lennox, E.S.; Waldmann, H. CD66 identifies a neutrophil-specific epitope within the hematopoietic system that is expressed by members of the carcinoembryonic antigen family of adhesion molecules. Blood 1991, 78, 63–74. [Google Scholar] [PubMed]
- Karasuyama, H.; Yamanishi, Y. Basophils have emerged as a key player in immunity. Curr. Opin. Immunol. 2014, 31, 1–7. [Google Scholar] [PubMed]
- Gopinath, R.; Nutman, T.B. Identification of eosinophils in lysed whole blood using side scatter and CD16 negativity. Cytometry 1997, 30, 313–316. [Google Scholar] [CrossRef]
- Barth, E.; Fischer, G.; Schneider, E.M.; Wollmeyer, J.; Georgieff, M.; Weiss, M. Differences in the expression of CD64 and mCD14 on polymorphonuclear cells and on monocytes in patients with septic shock. Cytokine 2001, 14, 299–302. [Google Scholar] [CrossRef] [PubMed]
- Repp, R.; Valerius, T.; Sendler, A.; Gramatzki, M.; Iro, H.; Kalden, J.R.; Platzer, E. Neutrophils express the high affinity receptor for IgG (FcγRI, CD64) after in vivo application of recombinant human granulocyte colony-stimulating factor. Blood 1991, 78, 885–889. [Google Scholar] [PubMed]
- Agis, H.; Fureder, W.; Bankl, H.C.; Kundi, M.; Sperr, W.R.; Willheim, M.; Boltz-Nitulescu, G.; Butterfield, J.H.; Kishi, K.; Lechner, K.; et al. Comparative immunophenotypic analysis of human mast cells, blood basophils and monocytes. Immunology 1996, 87, 535–543. [Google Scholar] [CrossRef] [PubMed]
- Han, X.; Jorgensen, J.L.; Brahmandam, A.; Schlette, E.; Huh, Y.O.; Shi, Y.; Awagu, S.; Chen, W. Immunophenotypic study of basophils by multiparameter flow cytometry. Arch. Pathol. Lab. Med. 2008, 132, 813–819. [Google Scholar] [PubMed]
- Ziegler-Heitbrock, L.; Ancuta, P.; Crowe, S.; Dalod, M.; Grau, V.; Hart, D.N.; Leenen, P.J.; Liu, Y.J.; MacPherson, G.; Randolph, G.J.; et al. Nomenclature of monocytes and dendritic cells in blood. Blood 2010, 116, e74–e80. [Google Scholar] [CrossRef] [PubMed]
- Collin, M.; McGovern, N.; Haniffa, M. Human dendritic cell subsets. Immunology 2013, 140, 22–30. [Google Scholar] [CrossRef] [PubMed]
- Jongbloed, S.L.; Kassianos, A.J.; McDonald, K.J.; Clark, G.J.; Ju, X.; Angel, C.E.; Chen, C.J.; Dunbar, P.R.; Wadley, R.B.; Jeet, V.; et al. Human CD141+ (BDCA-3)+ dendritic cells (DCs) represent a unique myeloid DC subset that cross-presents necrotic cell antigens. J. Exp. Med. 2010, 207, 1247–1260. [Google Scholar] [PubMed]
- Haniffa, M.; Shin, A.; Bigley, V.; McGovern, N.; Teo, P.; See, P.; Wasan, P.S.; Wang, X.N.; Malinarich, F.; Malleret, B.; et al. Human tissues contain CD141hi cross-presenting dendritic cells with functional homology to mouse CD103+ nonlymphoid dendritic cells. Immunity 2012, 37, 60–73. [Google Scholar]
- Hemont, C.; Neel, A.; Heslan, M.; Braudeau, C.; Josien, R. Human blood mDC subsets exhibit distinct TLR repertoire and responsiveness. J. Leukoc. Biol. 2013, 93, 599–609. [Google Scholar] [CrossRef] [PubMed]
- Clark, G.J.; Kupresanin, F.; Fromm, P.D.; Ju, X.; Muusers, L.; Silveira, P.A.; Elgundi, Z.; Gasiorowski, R.E.; Papadimitrious, M.S.; Bryant, C.; et al. New insights into the phenotype of human dendritic cell populations. Clin. Transl. Immunol. 2016, 5, e61. [Google Scholar] [CrossRef] [PubMed]
- Chen, L.; Zhang, Z.; Chen, W.; Zhang, Z.; Li, Y.; Shi, M.; Zhang, J.; Chen, L.; Wang, S.; Wang, F.S. B7-H1 up-regulation on myeloid dendritic cells significantly suppresses T cell immune function in patients with chronic hepatitis B. J. Immunol. 2007, 178, 6634–6641. [Google Scholar] [CrossRef] [PubMed]
- Selenko-Gebauer, N.; Majdic, O.; Szekeres, A.; Hofler, G.; Guthann, E.; Korthauer, U.; Zlabinger, G.; Steinberger, P.; Pickl, W.F.; Stockinger, H.; et al. B7-H1 (programmed death-1 ligand) on dendritic cells is involved in the induction and maintenance of T cell anergy. J. Immunol. 2003, 170, 3637–3644. [Google Scholar] [CrossRef] [PubMed]
- Tanaka, K.; Albin, M.J.; Yuan, X.; Yamaura, K.; Habicht, A.; Murayama, T.; Grimm, M.; Waaga, A.M.; Ueno, T.; Padera, R.F.; et al. PDL1 is required for peripheral transplantation tolerance and protection from chronic allograft rejection. J. Immunol. 2007, 179, 5204–5210. [Google Scholar]
- Nijman, H.W.; Kleijmeer, M.J.; Ossevoort, M.A.; Oorschot, V.M.; Vierboom, M.P.; van de Keur, M.; Kenemans, P.; Kast, W.M.; Geuze, H.J.; Melief, C.J. Antigen capture and major histocompatibility class II compartments of freshly isolated and cultured human blood dendritic cells. J. Exp. Med. 1995, 182, 163–174. [Google Scholar]
- O’Doherty, U.; Steinman, R.M.; Peng, M.; Cameron, P.U.; Gezelter, S.; Kopeloff, I.; Swiggard, W.J.; Pope, M.; Bhardwaj, N. Dendritic cells freshly isolated from human blood express CD4 and mature into typical immunostimulatory dendritic cells after culture in monocyte-conditioned medium. J. Exp. Med. 1993, 178, 1067–1076. [Google Scholar] [CrossRef]
- Wu, W.C.; Sun, H.W.; Chen, H.T.; Liang, J.; Yu, X.J.; Wu, C.; Wang, Z.; Zheng, L. Circulating hematopoietic stem and progenitor cells are myeloid-biased in cancer patients. Proc. Natl. Acad. Sci. USA 2014, 111, 4221–4226. [Google Scholar] [CrossRef]
- Beerepoot, L.V.; Mehra, N.; Vermaat, J.S.; Zonnenberg, B.A.; Gebbink, M.F.; Voest, E.E. Increased levels of viable circulating endothelial cells are an indicator of progressive disease in cancer patients. Ann. Oncol. 2004, 15, 139–145. [Google Scholar] [CrossRef]
- Rafat, N.; Beck, G.; Schulte, J.; Tuettenberg, J.; Vajkoczy, P. Circulating endothelial progenitor cells in malignant gliomas. J. Neurosurg. 2010, 112, 43–49. [Google Scholar] [CrossRef]
- Khan, S.S.; Solomon, M.A.; McCoy, J.P., Jr. Detection of circulating endothelial cells and endothelial progenitor cells by flow cytometry. Cytom. Part B: Clin. Cytom. 2005, 64, 1–8. [Google Scholar] [CrossRef]
- Goon, P.K.; Lip, G.Y.; Boos, C.J.; Stonelake, P.S.; Blann, A.D. Circulating endothelial cells, endothelial progenitor cells, and endothelial microparticles in cancer. Neoplasia 2006, 8, 79–88. [Google Scholar] [CrossRef]
- Kraan, J.; Sleijfer, S.; Foekens, J.A.; Gratama, J.W. Clinical value of circulating endothelial cell detection in oncology. Drug Discov. Today 2012, 17, 710–717. [Google Scholar] [CrossRef]
- Strijbos, M.H.; Gratama, J.W.; Kraan, J.; Lamers, C.H.; den Bakker, M.A.; Sleijfer, S. Circulating endothelial cells in oncology: Pitfalls and promises. Br. J. Cancer 2008, 98, 1731–1735. [Google Scholar] [CrossRef]
- Goon, P.K.; Boos, C.J.; Stonelake, P.S.; Blann, A.D.; Lip, G.Y. Detection and quantification of mature circulating endothelial cells using flow cytometry and immunomagnetic beads: A methodological comparison. Thromb. Haemost. 2006, 96, 45–52. [Google Scholar] [CrossRef]
- Fadini, G.P.; Losordo, D.; Dimmeler, S. Critical reevaluation of endothelial progenitor cell phenotypes for therapeutic and diagnostic use. Circ. Res. 2012, 110, 624–637. [Google Scholar] [CrossRef]
- Rose, J.A.; Erzurum, S.; Asosingh, K. Biology and flow cytometry of proangiogenic hematopoietic progenitors cells. Cytom. Part A 2015, 87, 5–19. [Google Scholar] [CrossRef]
- Griewank, K.G.; Ugurel, S.; Schadendorf, D.; Paschen, A. New developments in biomarkers for melanoma. Curr. Opin. Oncol. 2013, 25, 145–151. [Google Scholar] [CrossRef]
- Furuta, G.T.; Atkins, F.D.; Lee, N.A.; Lee, J.J. Changing roles of eosinophils in health and disease. Ann. Allergy Asthma Immunol. 2014, 113, 3–8. [Google Scholar] [CrossRef]
- Hajishengallis, G.; Moutsopoulos, N.M.; Hajishengallis, E.; Chavakis, T. Immune and regulatory functions of neutrophils in inflammatory bone loss. Semin. Immunol. 2016, 28, 146–158. [Google Scholar] [CrossRef] [PubMed]
- Jacobsen, E.A.; Helmers, R.A.; Lee, J.J.; Lee, N.A. The expanding role(s) of eosinophils in health and disease. Blood 2012, 120, 3882–3890. [Google Scholar] [PubMed]
- Mandruzzato, S.; Brandau, S.; Britten, C.M.; Bronte, V.; Damuzzo, V.; Gouttefangeas, C.; Maurer, D.; Ottensmeier, C.; van der Burg, S.H.; Welters, M.J.; et al. Toward harmonized phenotyping of human myeloid-derived suppressor cells by flow cytometry: Results from an interim study. Cancer Immunol. Immunother. 2016, 65, 161–169. [Google Scholar] [CrossRef] [PubMed]
- Lin, S.J.; Chao, H.C.; Yan, D.C.; Huang, Y.J. Expression of adhesion molecules on T lymphocytes in young children and infants—A comparative study using whole blood lysis or density gradient separation. Clin. Lab. Haematol. 2002, 24, 353–359. [Google Scholar] [PubMed]
- Weinberg, A.; Song, L.Y.; Wilkening, C.; Sevin, A.; Blais, B.; Louzao, R.; Stein, D.; Defechereux, P.; Durand, D.; Riedel, E.; et al. Optimization and limitations of use of cryopreserved peripheral blood mononuclear cells for functional and phenotypic T-cell characterization. Clin. Vaccine Immunol. 2009, 16, 1176–1186. [Google Scholar] [CrossRef] [PubMed]
- Rawstron, A.C.; Orfao, A.; Beksac, M.; Bezdickova, L.; Brooimans, R.A.; Bumbea, H.; Dalva, K.; Fuhler, G.; Gratama, J.; Hose, D.; et al. Report of the European Myeloma Network on multiparametric flow cytometry in multiple myeloma and related disorders. Haematologica 2008, 93, 431–438. [Google Scholar] [PubMed]
- Karawajew, L.; Dworzak, M.; Ratei, R.; Rhein, P.; Gaipa, G.; Buldini, B.; Basso, G.; Hrusak, O.; Ludwig, W.D.; Henze, G.; et al. Minimal residual disease analysis by eight-color flow cytometry in relapsed childhood acute lymphoblastic leukemia. Haematologica 2015, 100, 935–944. [Google Scholar] [PubMed]
- Aghaeepour, N.; Finak, G.; Flow, C.A.P.C.; Consortium, D.; Hoos, H.; Mosmann, T.R.; Brinkman, R.; Gottardo, R.; Scheuermann, R.H. Critical assessment of automated flow cytometry data analysis techniques. Nat. Methods 2013, 10, 228–238. [Google Scholar] [PubMed]
- Tung, J.W.; Parks, D.R.; Moore, W.A.; Herzenberg, L.A.; Herzenberg, L.A. Identification of B-cell subsets: An exposition of 11-color (Hi-D) FACS methods. Methods Mol. Biol. 2004, 271, 37–58. [Google Scholar] [PubMed]
- Moore, W.A.; Parks, D.R. Update for the logicle data scale including operational code implementations. Cytom. Part A 2012, 81, 273–277. [Google Scholar]


| Panel | Blue: 488 nm | Red: 638 nm | Violet: 405 nm | |||||
|---|---|---|---|---|---|---|---|---|
| 525/40 | 575/30 | 695/30 | 755/LP | 660/20 | 755/LP | 450/50 | 550/40 | |
| FITC|A488 | PE | PCC5.5 | PECy7|PEV770 | APC | APCH7 | V450|BV421 | KO | |
| P01 | CD8 | CD197 | CD4 | CD45RA | CD38 | CD3 | ||
| P02 | CD127 | CD196 | CD4 | CD25 | CD183 | CD3 | ||
| P03 | TCRγ/δ | TCRα/β | CD152 | CD3 | ||||
| P04 | CD20 | CD24 | CD5 | CD38 | CD27 | CD19 | ||
| P05 | CD19/20 | CD25 | CD86 | CD69 | CD279 | CD80 | CD3 | HLA-DR |
| P06 | CD69 | CD16 | CD56 | CD314 | CD25 | CD3 | ||
| P07 | CD159c | CD16 | CD56 | CD94 | CD159a | CD3 | ||
| P08 | CD14 | CD16 | CD86 | CD80 | CD64 | HLA-DR | ||
| P09 | CD66 | CD64 | CD16 | |||||
| P10 | LIN 1 | CD274 | CD123 | CD83 | CD1c | CD11c | HLA-DR | |
| P11 | CD146 | CD133.1 | CD45 | CD34 | ||||
| P12 | CD19/20 | CD16 | CD56 | CD45 | CD3 | |||
| Cell Subset | Definition | ||
|---|---|---|---|
| Leukocytes | Forward scatter (FSC) vs. Side scatter (SSC) | ||
| T cells | CD3+ | ||
| T helper cells (TH) | CD3+/CD4+/CD8− | ||
| TH1 | CD3+/CD4+/CD8−/CD183+/CD196− | ||
| TH2 | CD3+/CD4+/CD8−/CD183−/CD196− | ||
| TH17 | CD3+/CD4+/CD8−/CD183−/CD196+ | ||
| TREG | CD3+/CD4+/CD8−/CD25hi/CD127−/lo | ||
| Naïve TH | CD3+/CD4+/CD8−/CD197+/CD45RA+ | ||
| Effector TH | CD3+/CD4+/CD8−/CD197−/CD45RA+ | ||
| EM TH | CD3+/CD4+/CD8−/CD197−/CD45RA− | ||
| CM TH | CD3+/CD4+/CD8−/CD197+/CD45RA− | ||
| Cytotoxic T cells (TC) | CD3+/CD8+/CD4− | ||
| Naïve TC | CD3+/CD8+/CD4−/CD197+/CD45RA+ | ||
| Effector TC | CD3+/CD8+/CD4−/CD197−/CD45RA+ | ||
| EM TC | CD3+/CD8+/CD4−/CD197−/CD45RA− | ||
| CM TC | CD3+/CD8+/CD4−/CD197+/CD45RA− | ||
| TCRα/β T cells | CD3+/TCRαβ+/TCRγδ− | ||
| TCRγ/δ T cells | CD3+/TCRγδ+/TCRαβ− | ||
| B cells | CD19+ or CD20+ | ||
| Pre−naïve B | CD19+ or CD20+/CD27−/CD38−/lo/CD5+ | ||
| Naïve B | CD19+ or CD20+/CD27−/CD38−/lo/CD5− | ||
| Memory B | CD19+ or CD20+/CD27+/CD38−/lo/CD5−/CD24+ | ||
| Transitional B | CD19+ or CD20+/CD27−/CD38hi/CD5+/CD24hi | ||
| Plasma blasts | CD19+ or CD20+/CD27+/CD38hi/CD5−/CD24− | ||
| BREG | CD19+ or CD20+/CD27+/CD24hi following the exclusion of the other five B cell subsets (see Table 3: Rest of B cells) | ||
| NK cells | CD3−/CD56+ | ||
| NK1 | CD3−/CD56+/CD16+ | ||
| NK2 | CD3−/CD56hi/CD16− | ||
| NK3 | CD3−/CD56lo/CD16− | ||
| NKT | CD3+/CD56+ or CD3+/CD16+ or CD3+/NKG2D+ | ||
| Neutrophils | CD66+/CD16+ | ||
| Eosinophils | CD66+/CD16− | ||
| Basophils | CD3−/CD14−/CD16−/CD19−/CD20−/CD56−/HLADR−/CD123+ | ||
| Dendritic cells | (mDC or pDC) | ||
| mDC | CD3−/CD14−/CD16−/CD19−/CD20−/CD56−/HLADR+/CD11chi/CD123−/lo | ||
| mDC−1 | CD3−/CD14−/CD16−/CD19−/CD20−/CD56−/HLADR+/CD11chi/CD123−/lo/CD1c+ | ||
| mDC−2 | CD3−/CD14−/CD16−/CD19−/CD20−/CD56−/HLADR+/CD11chi/CD123−/lo/CD1c− | ||
| pDC | CD3−/CD14−/CD16−/CD19−/CD20−/CD56−/HLADR−/CD123hi/CD11c− | ||
| Monocytes | CD14+ | ||
| Mo1 | CD14hi/CD16− | ||
| Mo2 | CD14lo/CD16+ | ||
| Mo3 | CD14hi/CD16+ | ||
| Mo4 | CD14lo/CD16− | ||
| HSC | CD45−/CD146−/CD34+ | ||
| CEC | CD45−/CD146+ | ||
| EPC | CD146−/CD133+ | ||
| Panel | Boolean Gate | Definition |
|---|---|---|
| P01 | TC | “T8hi” or “T8lo” |
| P04 | CD19 or CD20 B cells | “CD19+ B cells” or “CD20+ B cells” |
| P05 | Rest of B cells | “CD19 or CD20 B cells” and (not (pre−naïve or (naïve or (“memory” or (“transitional” or “plasma blasts”))))) |
| P06 | NKT | “CD3+” and (“CD94+ NKT” or (“CD56+ NKT” or (“NKG2C+ NKT” or (“NKG2A+ NKT” or “CD16+ NKT”)))) |
| P17 | NKT | “CD3+” and (“CD56+ NKT” or (“CD16+ NKT” or “NKG2D+ NKT”)) |
| P10 | All DCs | “MDC” or “PDC” |
| P01 | Rest 1 | “CD45+ Leu” and (not “CD3+ T cells”) |
| P01 | Rest 2 | “Rest 1” and (not (“CD19/20+ B cells”) |
| P01 | Rest 3 | “Rest 2” and (not (“Monocytes” or “Granulocytes”) |
| P01 | Rest 4 | “Rest 3” and (not (“CD56+/CD16+ NK” or “CD56+/CD16− NK”) |
© 2016 by the authors; licensee MDPI, Basel, Switzerland. This article is an open access article distributed under the terms and conditions of the Creative Commons Attribution (CC-BY) license (http://creativecommons.org/licenses/by/4.0/).
Share and Cite
Rühle, P.F.; Fietkau, R.; Gaipl, U.S.; Frey, B. Development of a Modular Assay for Detailed Immunophenotyping of Peripheral Human Whole Blood Samples by Multicolor Flow Cytometry. Int. J. Mol. Sci. 2016, 17, 1316. https://doi.org/10.3390/ijms17081316
Rühle PF, Fietkau R, Gaipl US, Frey B. Development of a Modular Assay for Detailed Immunophenotyping of Peripheral Human Whole Blood Samples by Multicolor Flow Cytometry. International Journal of Molecular Sciences. 2016; 17(8):1316. https://doi.org/10.3390/ijms17081316
Chicago/Turabian StyleRühle, Paul F., Rainer Fietkau, Udo S. Gaipl, and Benjamin Frey. 2016. "Development of a Modular Assay for Detailed Immunophenotyping of Peripheral Human Whole Blood Samples by Multicolor Flow Cytometry" International Journal of Molecular Sciences 17, no. 8: 1316. https://doi.org/10.3390/ijms17081316