EVI1 as a Marker for Lymph Node Metastasis in HNSCC

 , , and
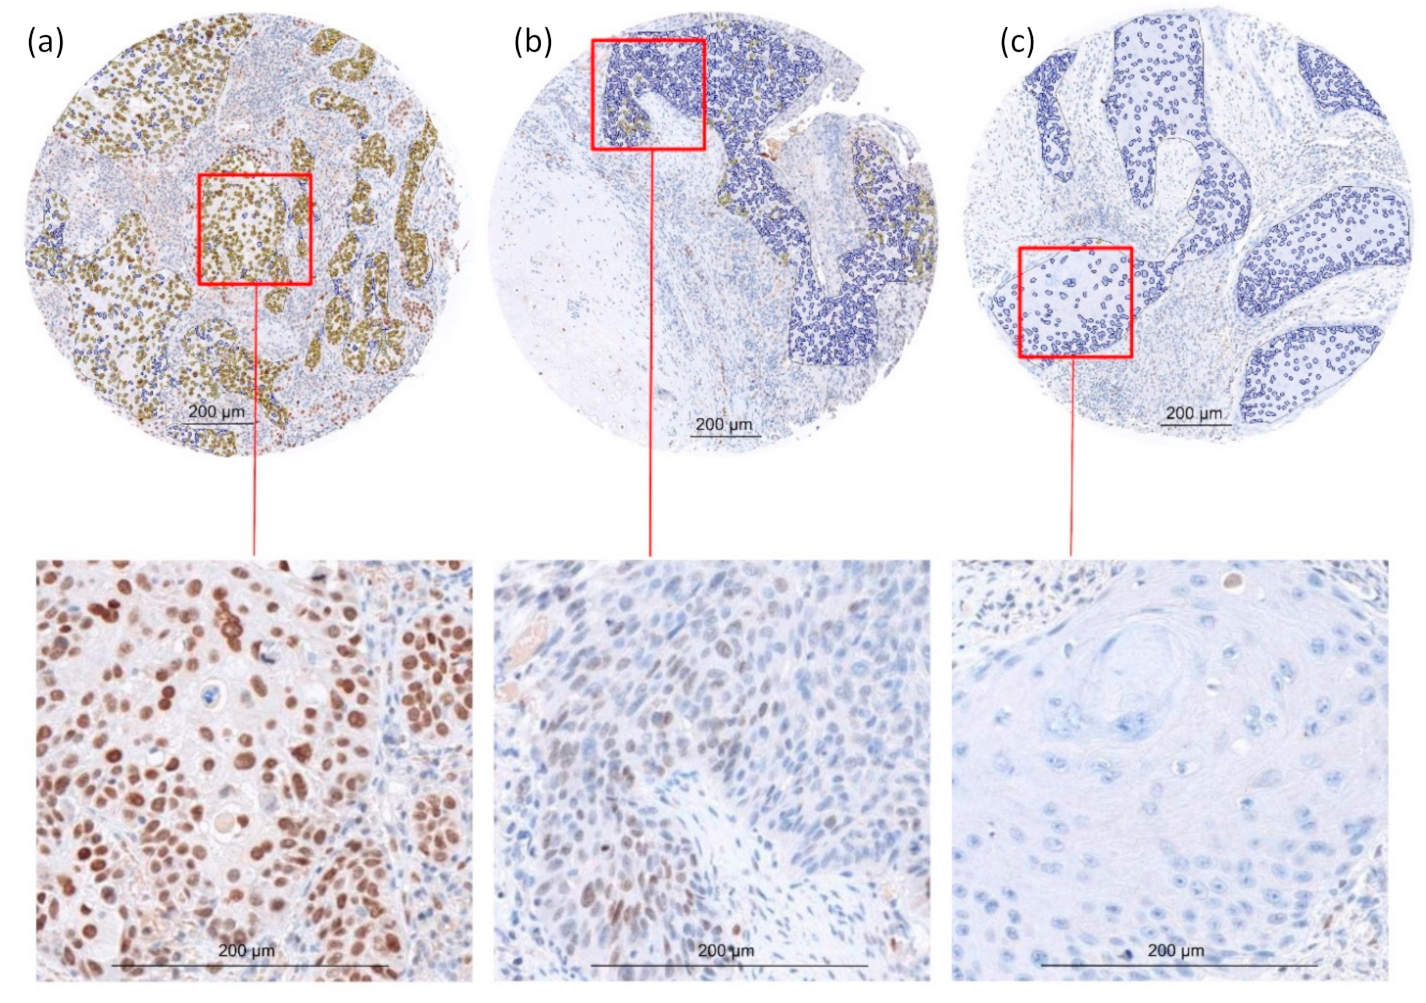
Abstract
:1. Introduction
2. Results
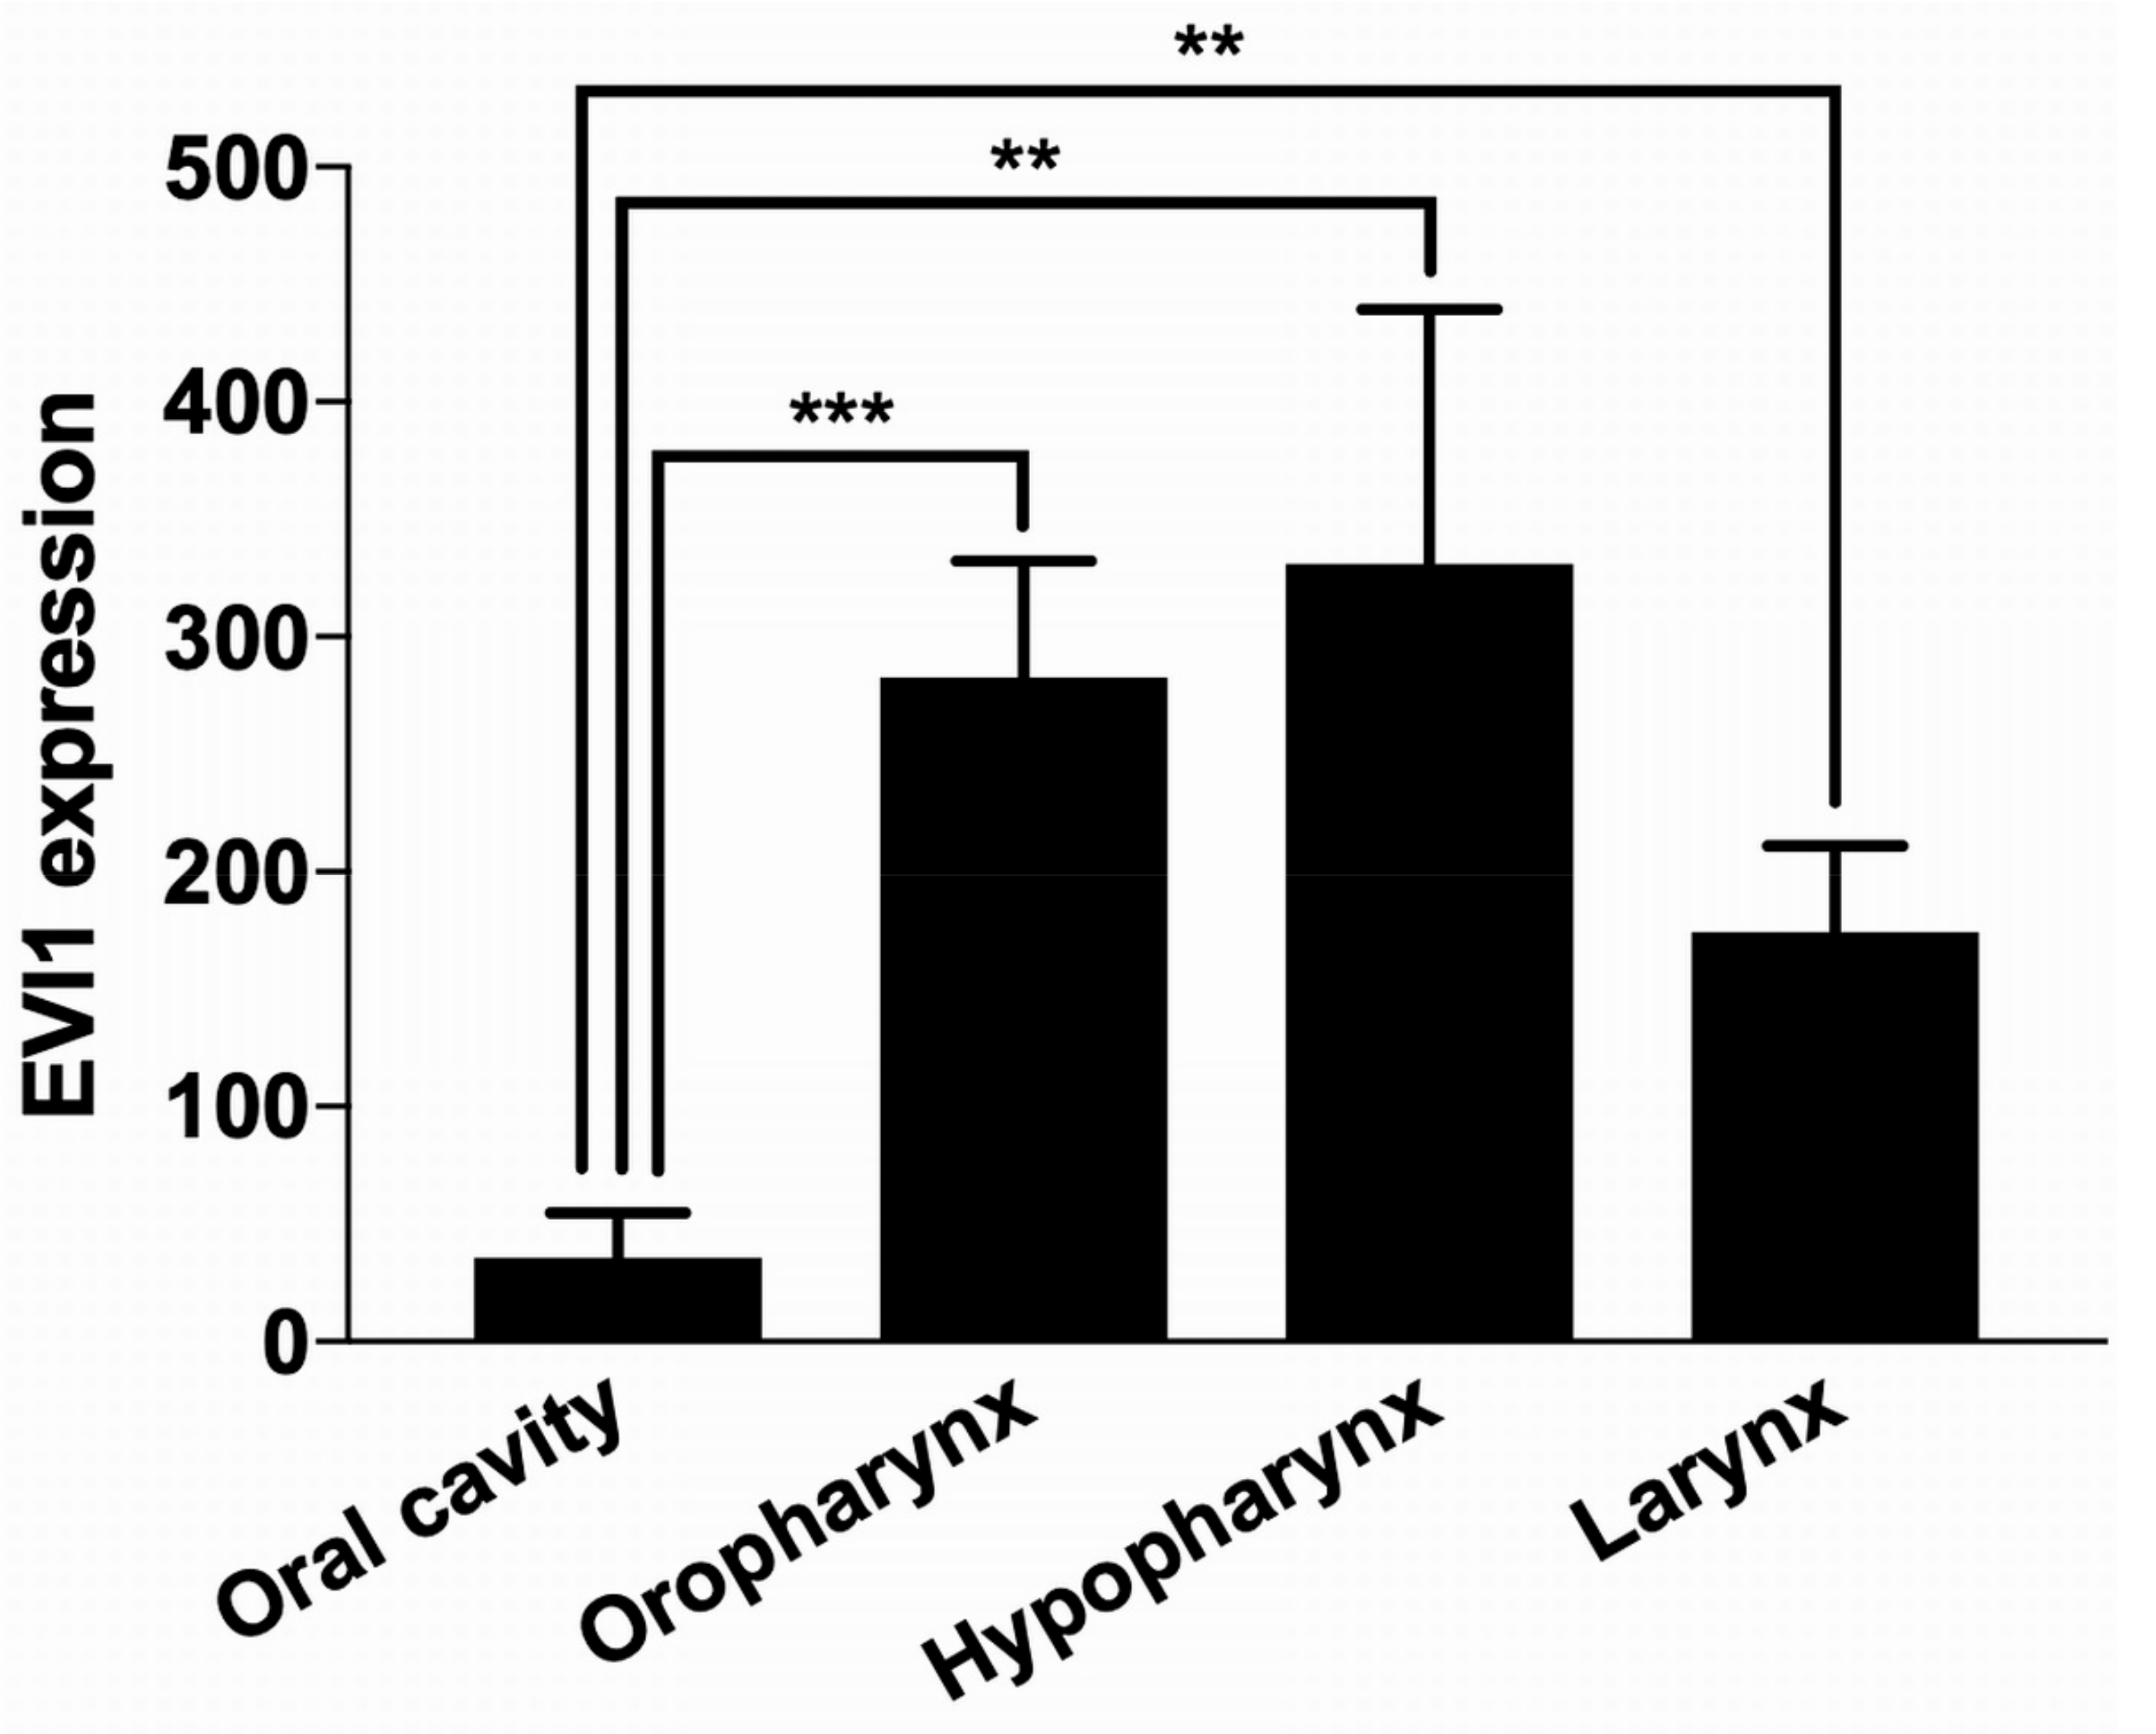
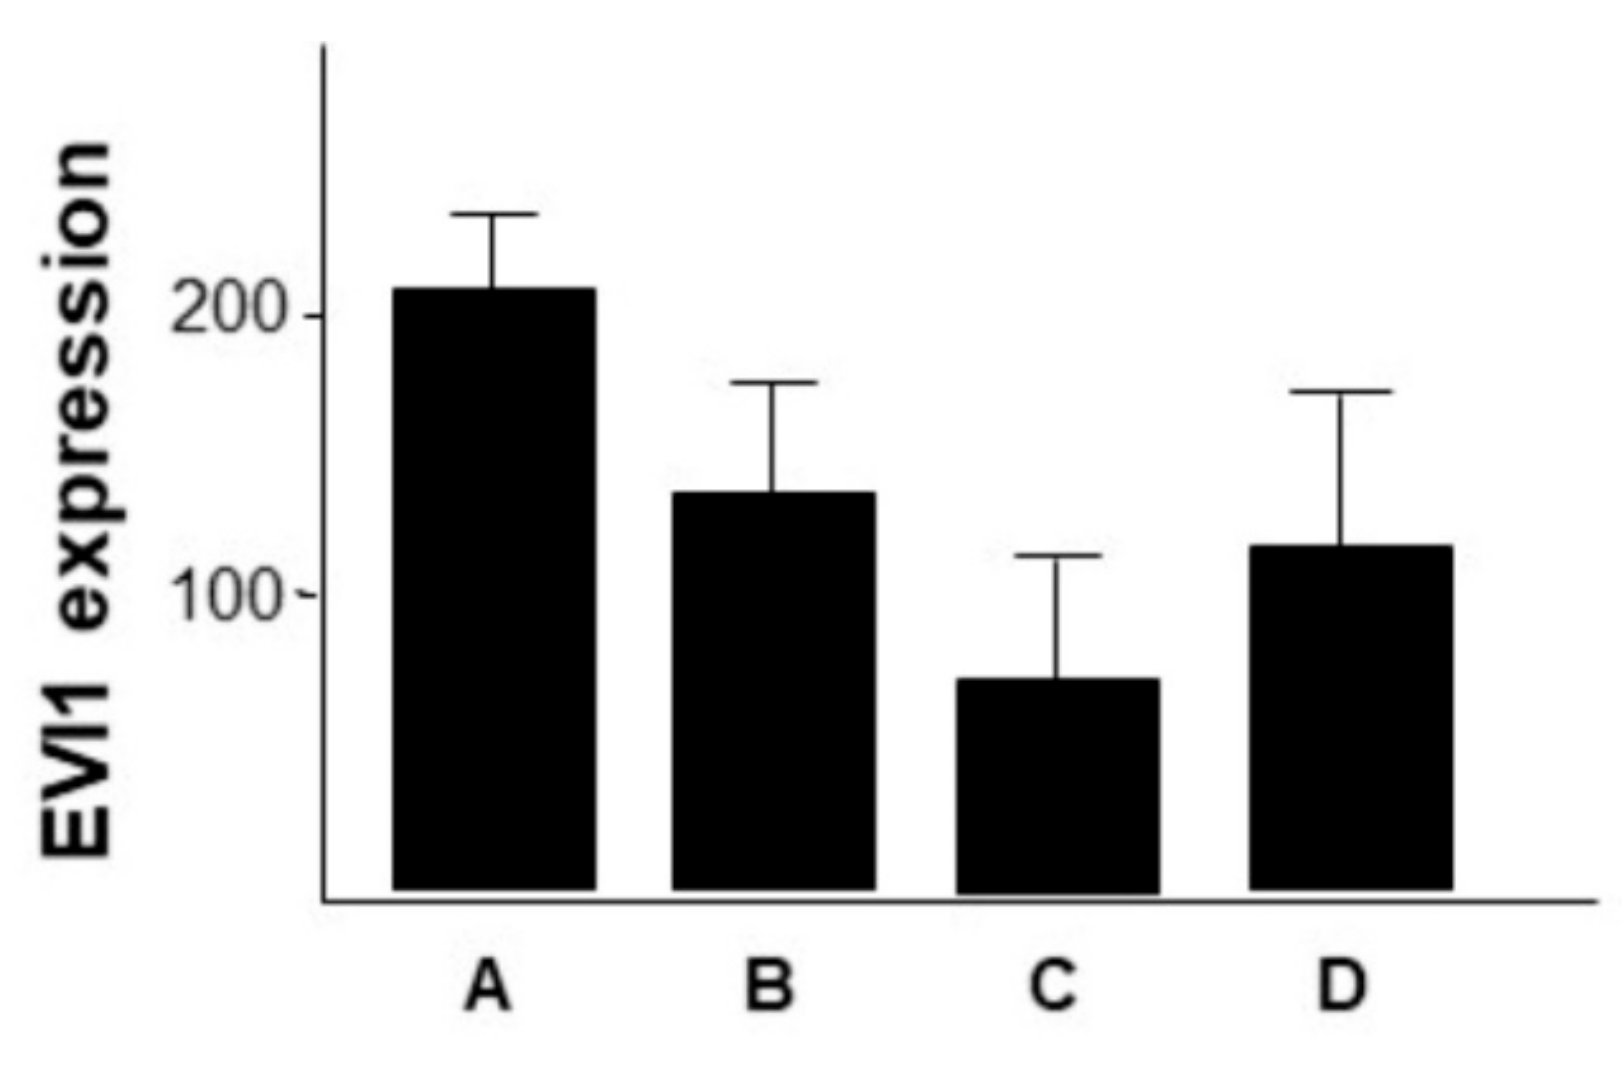
2.1. Different Sites of Origin of Primary HNSCC Have Different EVI1 Expression Levels
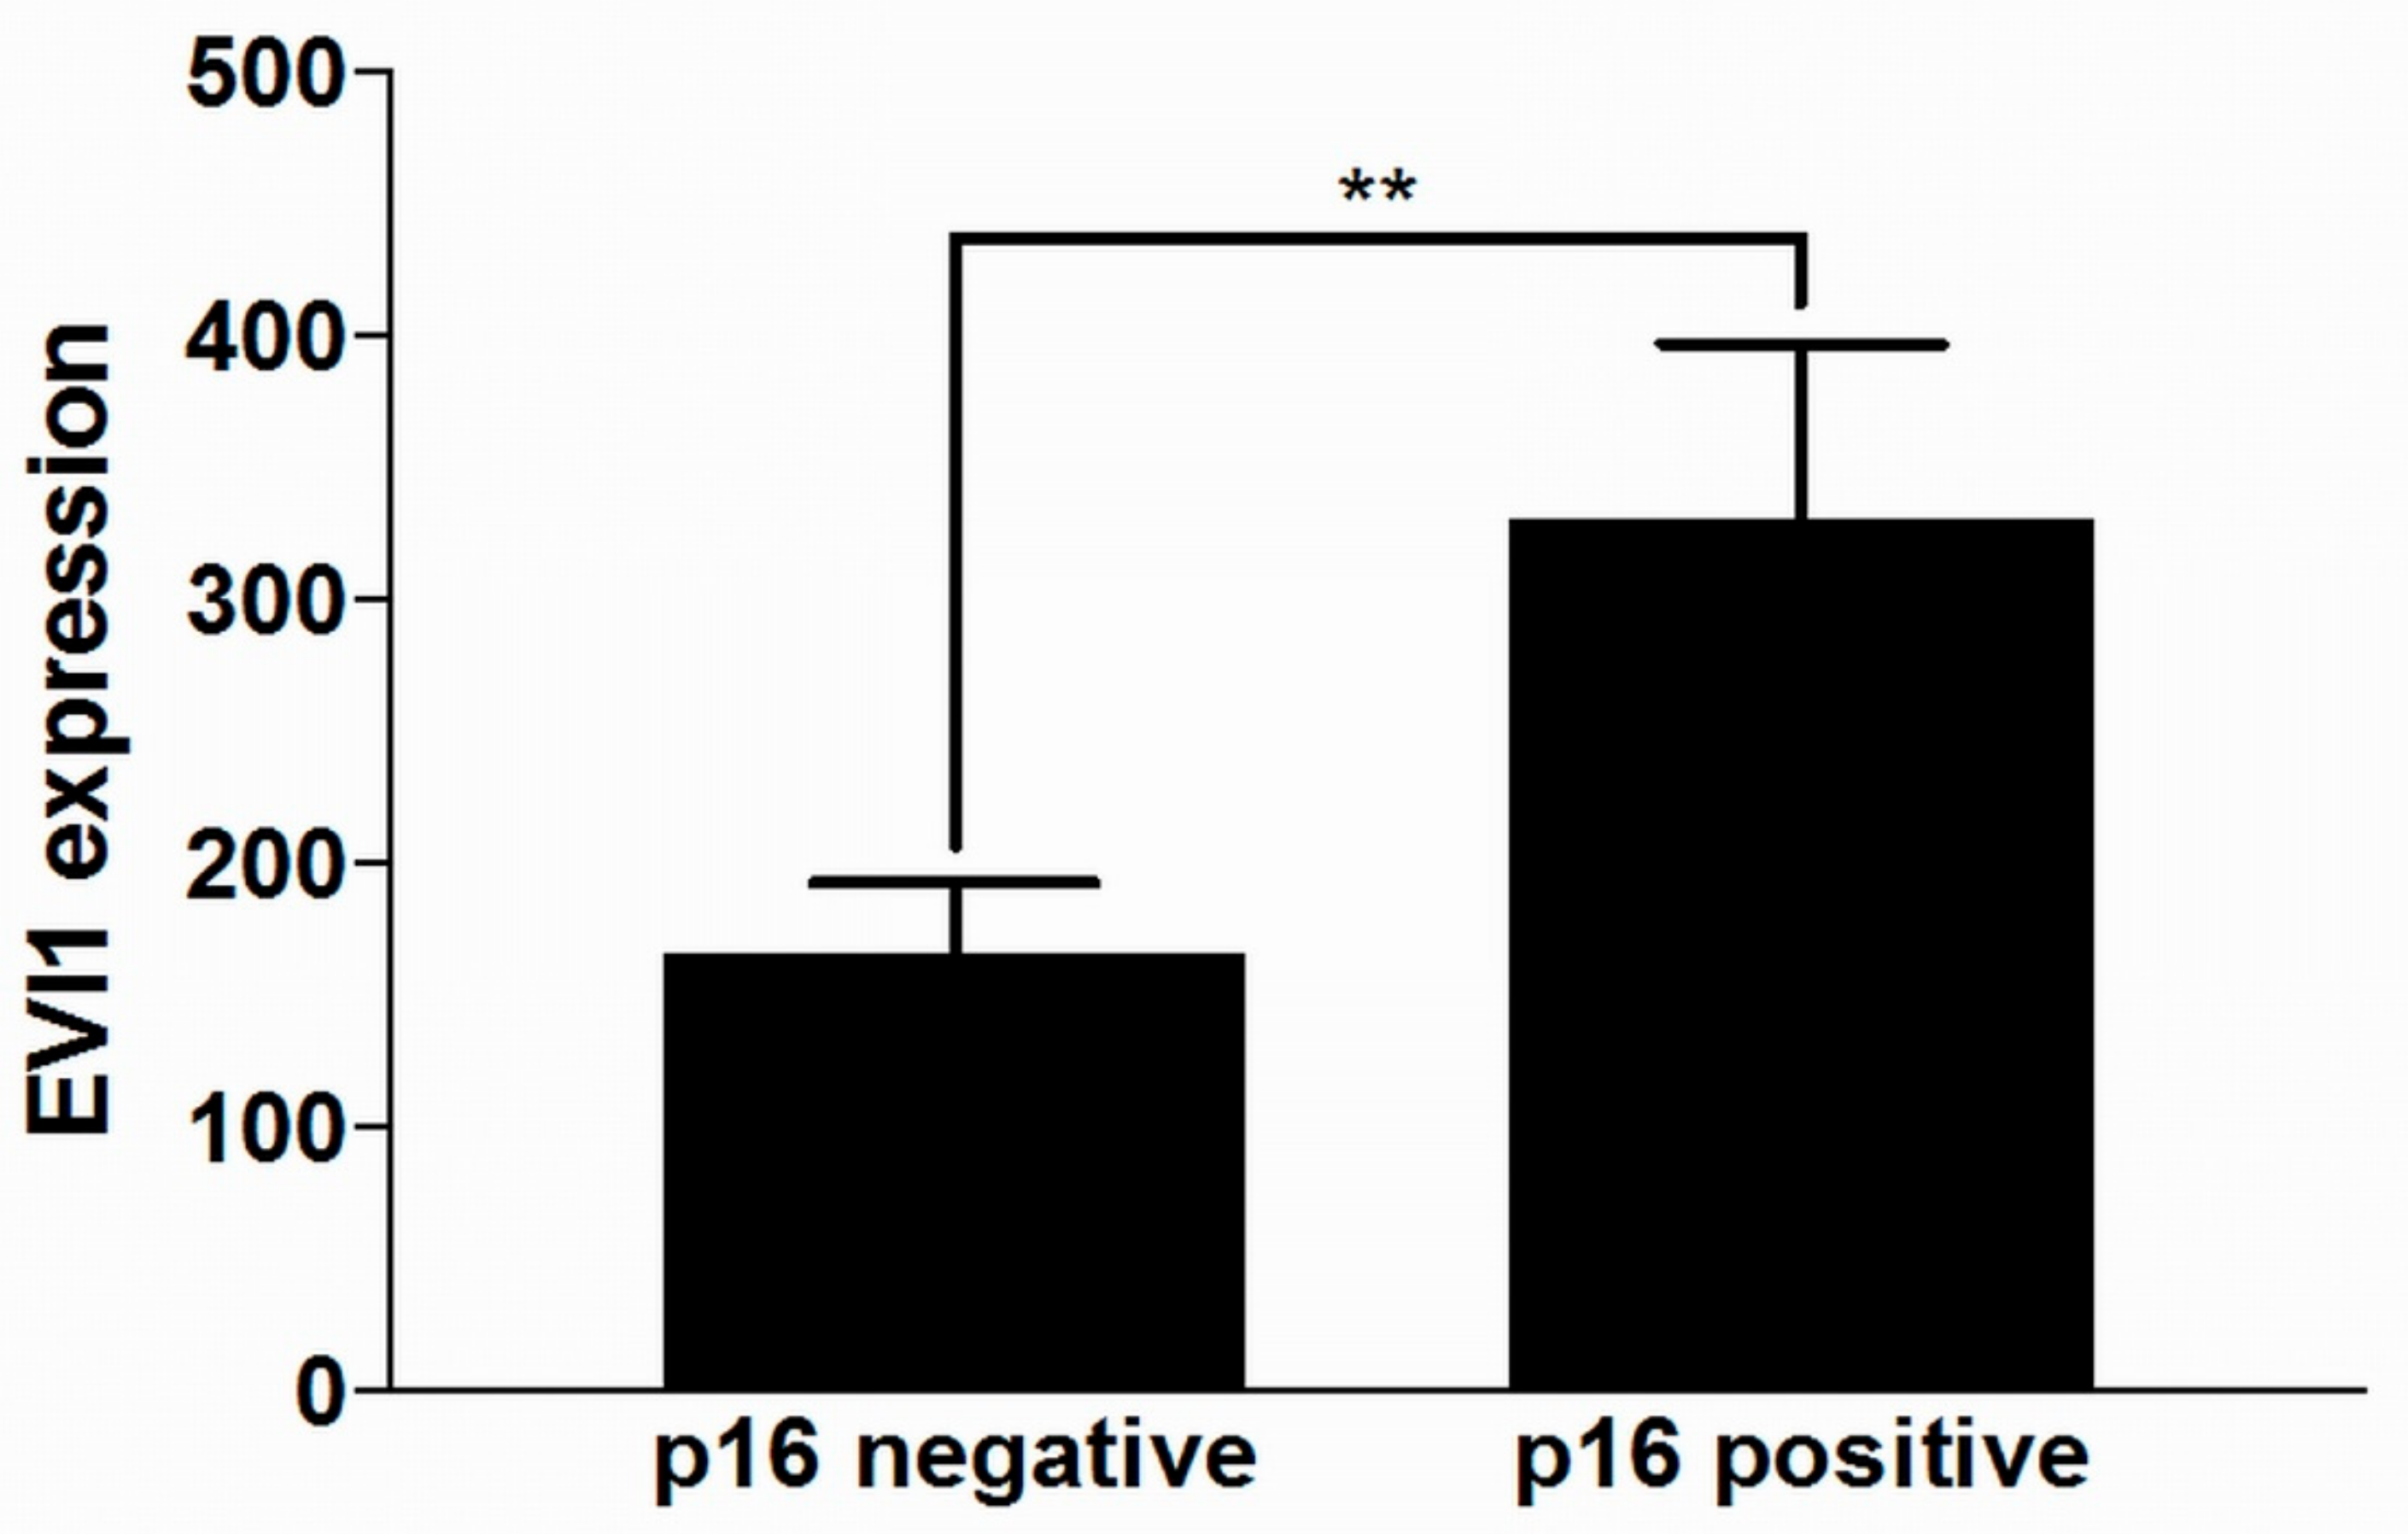
2.2. HPV Positive HNSCC Have Higher EVI1 Expression than HPV Negative HNSCC
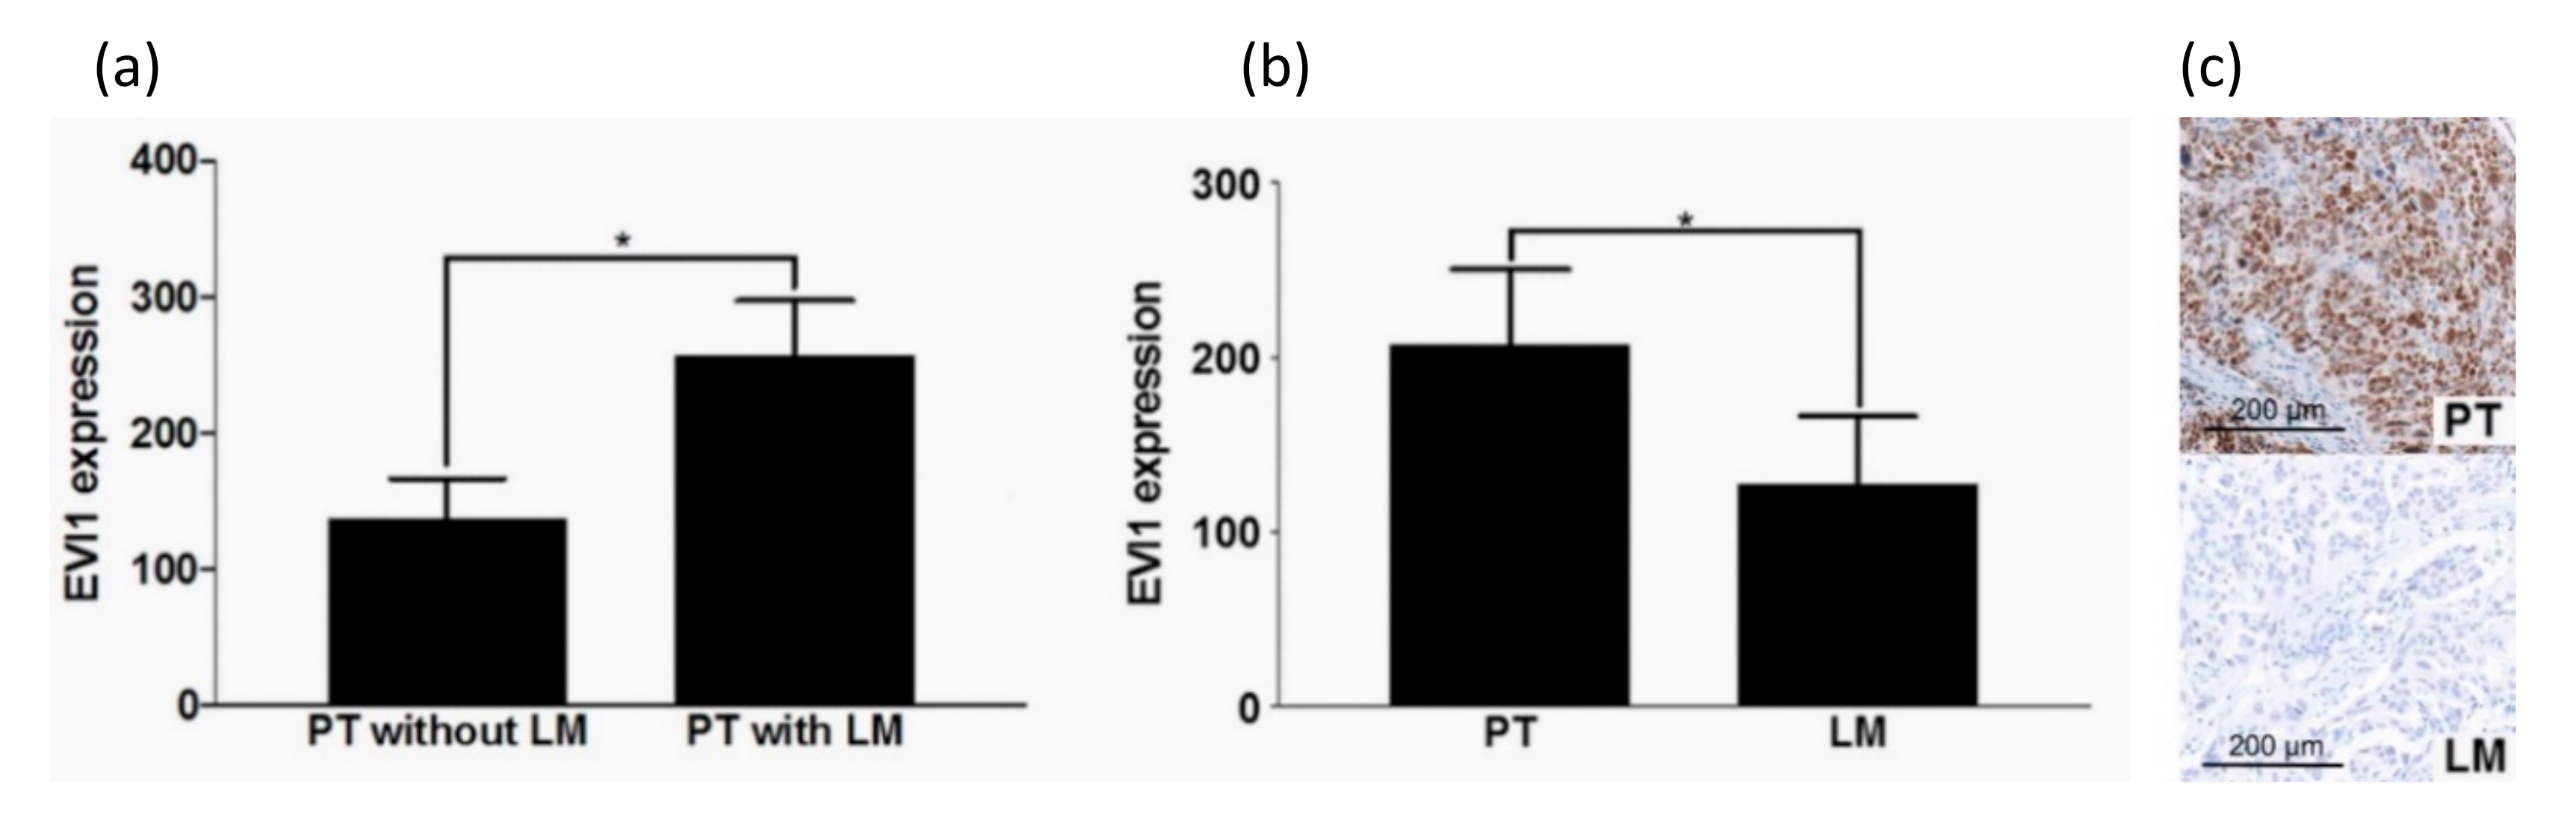
2.3. Primary HNSCC with Lymph Node Metastasis Have A Higher EVI1 Expression
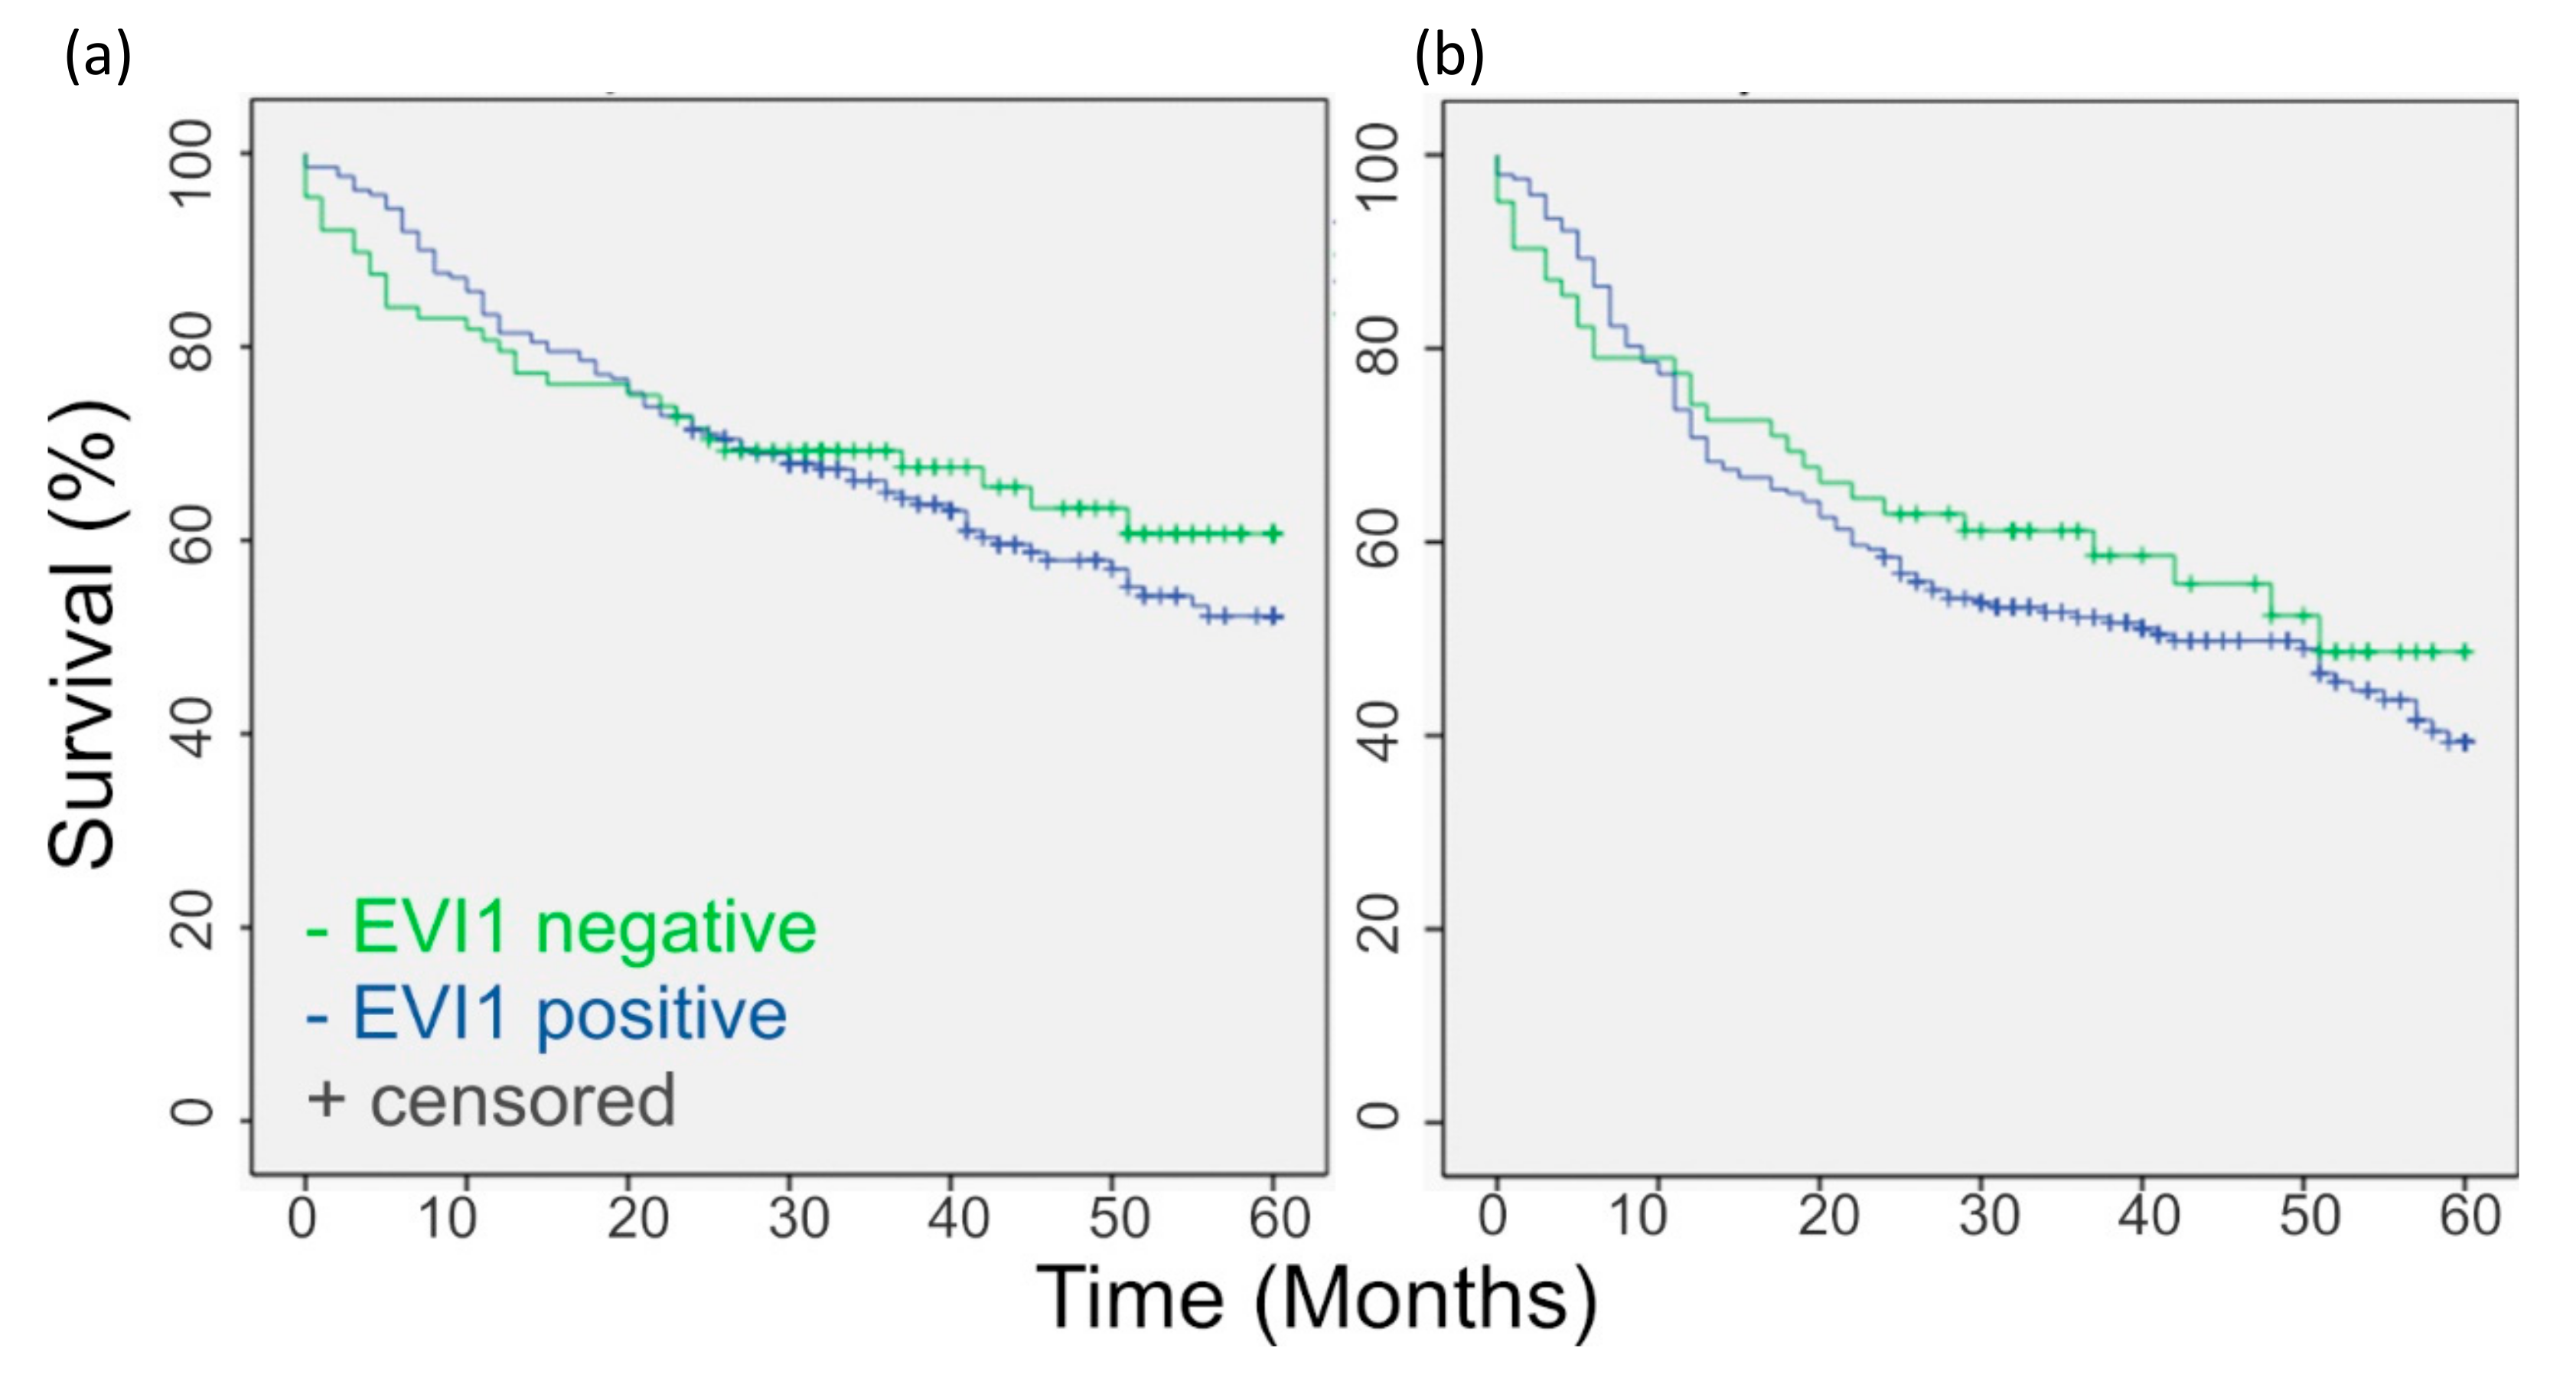
2.4. EVI1 Expression in HNSCC Does Not Correlate with Patient Age, UICC Stage, Overall Survival, and Disease-Free Survival
3. Discussion
4. Materials and Methods
4.1. Patient Data and Tumor Material
4.2. Immunohistochemistry
4.3. Evaluation of Immunohistochemical Staining
4.4. Statistical Analysis
5. Conclusions
Supplementary Materials
Author Contributions
Funding
Conflicts of Interest
Abbreviations
| DM | Distant Metastasis |
| EVI1 | Ecotropic Viral Integration Site 1 |
| FFPE | Formalin-Fixed Paraffin-Embedded |
| HNSCC | Head and Neck Squamous Cell Carcinoma |
| LM | Lymph Node Metastasis |
| LR | Local Recurrence |
| PT | Primary Tumor |
| ROI | Region of Interest |
| TMA | Tissue Microarray |
References
- Mucenski, M.L.; Taylor, B.A.; Ihle, J.N.; Hartley, J.W.; Morse, H.C., 3rd; Jenkins, N.A.; Copeland, N.G. Identification of a common ecotropic viral integration site, Evi-1, in the DNA of AKXD murine myeloid tumors. Mol. Cell. Biol. 1988, 8, 301–308. [Google Scholar] [CrossRef]
- Wieser, R. The oncogene and developmental regulator EVI1: Expression, biochemical properties, and biological functions. Gene 2007, 396, 346–357. [Google Scholar] [CrossRef]
- Arai, S.; Yoshimi, A.; Shimabe, M.; Ichikawa, M.; Nakagawa, M.; Imai, Y.; Goyama, S.; Kurokawa, M. Evi-1 is a transcriptional target of mixed-lineage leukemia oncoproteins in hematopoietic stem cells. Blood 2011, 117, 6304–6314. [Google Scholar] [CrossRef] [PubMed] [Green Version]
- Kataoka, K.; Kurokawa, M. Ecotropic viral integration site 1, stem cell self-renewal and leukemogenesis. Cancer Sci. 2012, 103, 1371–1377. [Google Scholar] [CrossRef] [PubMed]
- Konantz, M.; Andre, M.C.; Ebinger, M.; Grauer, M.; Wang, H.; Grzywna, S.; Rothfuss, O.C.; Lehle, S.; Kustikova, O.S.; Salih, H.R.; et al. EVI-1 modulates leukemogenic potential and apoptosis sensitivity in human acute lymphoblastic leukemia. Leukemia 2013, 27, 56–65. [Google Scholar] [CrossRef] [PubMed]
- Sato, T.; Goyama, S.; Kataoka, K.; Nasu, R.; Tsuruta-Kishino, T.; Kagoya, Y.; Nukina, A.; Kumagai, K.; Kubota, N.; Nakagawa, M.; et al. Evi1 defines leukemia-initiating capacity and tyrosine kinase inhibitor resistance in chronic myeloid leukemia. Oncogene 2014, 33, 5028–5038. [Google Scholar] [CrossRef] [Green Version]
- Heller, G.; Rommer, A.; Steinleitner, K.; Etzler, J.; Hackl, H.; Heffeter, P.; Tomasich, E.; Filipits, M.; Steinmetz, B.; Topakian, T.; et al. EVI1 promotes tumor growth via transcriptional repression of MS4A3. J. Hematol. Oncol. 2015, 8, 28. [Google Scholar] [CrossRef] [Green Version]
- Nanjundan, M.; Nakayama, Y.; Cheng, K.W.; Lahad, J.; Liu, J.; Lu, K.; Kuo, W.L.; Smith-McCune, K.; Fishman, D.; Gray, J.W.; et al. Amplification of MDS1/EVI1 and EVI1, located in the 3q26.2 amplicon, is associated with favorable patient prognosis in ovarian cancer. Cancer Res. 2007, 67, 3074–3084. [Google Scholar] [CrossRef] [Green Version]
- Patel, J.B.; Appaiah, H.N.; Burnett, R.M.; Bhat-Nakshatri, P.; Wang, G.; Mehta, R.; Badve, S.; Thomson, M.J.; Hammond, S.; Steeg, P.; et al. Control of EVI-1 oncogene expression in metastatic breast cancer cells through microRNA miR-22. Oncogene 2011, 30, 1290–1301. [Google Scholar] [CrossRef] [Green Version]
- Deng, X.; Cao, Y.; Liu, Y.; Li, F.; Sambandam, K.; Rajaraman, S.; Perkins, A.S.; Fields, A.P.; Hellmich, M.R.; Townsend, C.M.; et al. Overexpression of Evi-1 oncoprotein represses TGF-beta signaling in colorectal cancer. Mol. Carcinog. 2013, 52, 255–264. [Google Scholar] [CrossRef] [Green Version]
- Dutta, P.; Bui, T.; Bauckman, K.A.; Keyomarsi, K.; Mills, G.B.; Nanjundan, M. EVI1 splice variants modulate functional responses in ovarian cancer cells. Mol. Oncol. 2013, 7, 647–668. [Google Scholar] [CrossRef] [PubMed]
- Nayak, K.B.; Kuila, N.; Das Mohapatra, A.; Panda, A.K.; Chakraborty, S. EVI1 targets DeltaNp63 and upregulates the cyclin dependent kinase inhibitor p21 independent of p53 to delay cell cycle progression and cell proliferation in colon cancer cells. Int. J. Biochem. Cell Biol. 2013, 45, 1568–1576. [Google Scholar] [CrossRef] [PubMed]
- Queisser, A.; Hagedorn, S.; Wang, H.; Schaefer, T.; Konantz, M.; Alavi, S.; Deng, M.; Vogel, W.; von Massenhausen, A.; Kristiansen, G.; et al. Ecotropic viral integration site 1, a novel oncogene in prostate cancer. Oncogene 2017, 36, 1573–1584. [Google Scholar] [CrossRef] [PubMed]
- Xu, X.; Liu, S.; Ji, X. Overexpression of ecotropic viral integration site-1 is a prognostic factor of lung squamous cell cancer. Oncotargets Ther. 2017, 10, 2739–2744. [Google Scholar] [CrossRef] [Green Version]
- Bard-Chapeau, E.A.; Jeyakani, J.; Kok, C.H.; Muller, J.; Chua, B.Q.; Gunaratne, J.; Batagov, A.; Jenjaroenpun, P.; Kuznetsov, V.A.; Wei, C.L.; et al. Ecotopic viral integration site 1 (EVI1) regulates multiple cellular processes important for cancer and is a synergistic partner for FOS protein in invasive tumors. Proc. Natl. Acad. Sci. USA 2012, 109, 2168–2173. [Google Scholar] [CrossRef] [Green Version]
- Integrated genomic and molecular characterization of cervical cancer. Nature 2017, 543, 378–384. [CrossRef]
- Parker, S.L.; Tong, T.; Bolden, S.; Wingo, P.A. Cancer statistics, 1996. CA Cancer J. Clin. 1996, 46, 5–27. [Google Scholar] [CrossRef]
- Vokes, E.E.; Weichselbaum, R.R.; Lippman, S.M.; Hong, W.K. Head and neck cancer. New Engl. J. Med. 1993, 328, 184–194. [Google Scholar] [CrossRef]
- Larson, D.L.; Lindberg, R.D.; Lane, E.; Goepfert, H. Major complications of radiotherapy in cancer of the oral cavity and oropharynx. A 10 year retrospective study. Am. J. Surg. 1983, 146, 531–536. [Google Scholar] [CrossRef]
- Ervin, T.J.; Clark, J.R.; Weichselbaum, R.R.; Fallon, B.G.; Miller, D.; Fabian, R.L.; Posner, M.R.; Norris, C.M., Jr.; Tuttle, S.A.; Schoenfeld, D.A.; et al. An analysis of induction and adjuvant chemotherapy in the multidisciplinary treatment of squamous-cell carcinoma of the head and neck. J. Clin. Oncol.: Off. J. Am. Soc. Clin. Oncol. 1987, 5, 10–20. [Google Scholar] [CrossRef]
- Chin, D.; Boyle, G.M.; Porceddu, S.; Theile, D.R.; Parsons, P.G.; Coman, W.B. Head and neck cancer: Past, present and future. Expert Rev. Anticancer Ther. 2006, 6, 1111–1118. [Google Scholar] [CrossRef] [PubMed]
- Bernier, J. A multidisciplinary approach to squamous cell carcinomas of the head and neck: An update. Curr. Opin. Oncol. 2008, 20, 249–255. [Google Scholar] [CrossRef] [PubMed]
- Stell, P.M.; Rawson, N.S. Adjuvant chemotherapy in head and neck cancer. Br. J. Cancer 1990, 61, 779–787. [Google Scholar] [CrossRef] [Green Version]
- Murdoch, D. Standard, and novel cytotoxic and molecular-targeted, therapies for HNSCC: An evidence-based review. Curr. Opin. Oncol. 2007, 19, 216–221. [Google Scholar] [CrossRef] [PubMed]
- Sher, D.J.; Yan, J.; Day, A.; Sumer, B.D.; Pham, N.L.; Khan, S.; Zhu, H. Comparative effectiveness of primary radiotherapy versus surgery in elderly patients with locally advanced oropharyngeal squamous cell carcinoma. Oral Oncol. 2019, 88, 18–26. [Google Scholar] [CrossRef] [PubMed]
- Amin, M.B.; Greene, F.L.; Edge, S.B.; Compton, C.C.; Gershenwald, J.E.; Brookland, R.K.; Meyer, L.; Gress, D.M.; Byrd, D.R.; Winchester, D.P. The Eighth Edition AJCC Cancer Staging Manual: Continuing to build a bridge from a population-based to a more “personalized” approach to cancer staging. Ca: A Cancer J. Clin. 2017, 67, 93–99. [Google Scholar] [CrossRef]
- Urashima, M.; Hama, T.; Suda, T.; Suzuki, Y.; Ikegami, M.; Sakanashi, C.; Akutsu, T.; Amagaya, S.; Horiuchi, K.; Imai, Y.; et al. Distinct effects of alcohol consumption and smoking on genetic alterations in head and neck carcinoma. PLoS ONE 2013, 8, e80828. [Google Scholar] [CrossRef]
- Sattler, H.P.; Lensch, R.; Rohde, V.; Zimmer, E.; Meese, E.; Bonkhoff, H.; Retz, M.; Zwergel, T.; Bex, A.; Stoeckle, M.; et al. Novel amplification unit at chromosome 3q25-q27 in human prostate cancer. Prostate 2000, 45, 207–215. [Google Scholar] [CrossRef]
- De Braekeleer, M.; Le Bris, M.J.; De Braekeleer, E.; Basinko, A.; Morel, F.; Douet-Guilbert, N. 3q26/EVI1 rearrangements in myeloid hemopathies: A cytogenetic review. Future Oncol. (Lond. Engl.) 2015, 11, 1675–1686. [Google Scholar] [CrossRef]
- Lydiatt, W.M.; Patel, S.G.; O’Sullivan, B.; Brandwein, M.S.; Ridge, J.A.; Migliacci, J.C.; Loomis, A.M.; Shah, J.P. Head and Neck cancers-major changes in the American Joint Committee on cancer eighth edition cancer staging manual. Ca: A Cancer J. Clin. 2017, 67, 122–137. [Google Scholar] [CrossRef]
- Nayak, K.B.; Sajitha, I.S.; Kumar, T.R.S.; Chakraborty, S. Ecotropic viral integration site 1 promotes metastasis independent of epithelial mesenchymal transition in colon cancer cells. Cell Death Dis. 2018, 9, 18. [Google Scholar] [CrossRef] [PubMed] [Green Version]
- Hufbauer, M.; Maltseva, M.; Meinrath, J.; Lechner, A.; Beutner, D.; Huebbers, C.U.; Akgul, B. HPV16 increases the number of migratory cancer stem cells and modulates their miRNA expression profile in oropharyngeal cancer. Int. J. Cancer 2018, 143, 1426–1439. [Google Scholar] [CrossRef] [PubMed] [Green Version]
- Ma, H.; Li, Y.; Wang, X.; Wu, H.; Qi, G.; Li, R.; Yang, N.; Gao, M.; Yan, S.; Yuan, C.; et al. PBK, targeted by EVI1, promotes metastasis and confers cisplatin resistance through inducing autophagy in high-grade serous ovarian carcinoma. Cell Death Dis. 2019, 10, 166. [Google Scholar] [CrossRef] [PubMed]
- Forster, M.D.; Devlin, M.J. Immune Checkpoint Inhibition in Head and Neck Cancer. Front. Oncol. 2018, 8, 310. [Google Scholar] [CrossRef] [PubMed] [Green Version]
- Braun, M.; Goltz, D.; Shaikhibrahim, Z.; Vogel, W.; Bohm, D.; Scheble, V.; Sotlar, K.; Fend, F.; Tan, S.H.; Dobi, A.; et al. ERG protein expression and genomic rearrangement status in primary and metastatic prostate cancer--a comparative study of two monoclonal antibodies. Prostate Cancer Prostatic Dis. 2012, 15, 165–169. [Google Scholar] [CrossRef] [Green Version]
- Braun, M.; Kirsten, R.; Rupp, N.J.; Moch, H.; Fend, F.; Wernert, N.; Kristiansen, G.; Perner, S. Quantification of protein expression in cells and cellular subcompartments on immunohistochemical sections using a computer supported image analysis system. Histol. Histopathol. 2013, 28, 605–610. [Google Scholar]


© 2020 by the authors. Licensee MDPI, Basel, Switzerland. This article is an open access article distributed under the terms and conditions of the Creative Commons Attribution (CC BY) license (http://creativecommons.org/licenses/by/4.0/).
Share and Cite
Idel, C.; Ribbat-Idel, J.; Kuppler, P.; Krupar, R.; Offermann, A.; Vogel, W.; Rades, D.; Kirfel, J.; Wollenberg, B.; Perner, S. EVI1 as a Marker for Lymph Node Metastasis in HNSCC. Int. J. Mol. Sci. 2020, 21, 854. https://doi.org/10.3390/ijms21030854
Idel C, Ribbat-Idel J, Kuppler P, Krupar R, Offermann A, Vogel W, Rades D, Kirfel J, Wollenberg B, Perner S. EVI1 as a Marker for Lymph Node Metastasis in HNSCC. International Journal of Molecular Sciences. 2020; 21(3):854. https://doi.org/10.3390/ijms21030854
Chicago/Turabian StyleIdel, Christian, Julika Ribbat-Idel, Patrick Kuppler, Rosemarie Krupar, Anne Offermann, Wenzel Vogel, Dirk Rades, Jutta Kirfel, Barbara Wollenberg, and Sven Perner. 2020. "EVI1 as a Marker for Lymph Node Metastasis in HNSCC" International Journal of Molecular Sciences 21, no. 3: 854. https://doi.org/10.3390/ijms21030854