Prehospital Point-Of-Care Lactate Increases the Prognostic Accuracy of National Early Warning Score 2 for Early Risk Stratification of Mortality: Results of a Multicenter, Observational Study

 ,
,  , , , and
Abstract
:1. Introduction
2. Material and Methods
2.1. Study Design
2.2. Study Setting
2.3. Population
2.4. Study Protocol
2.5. Data Abstraction
2.6. Data Analysis
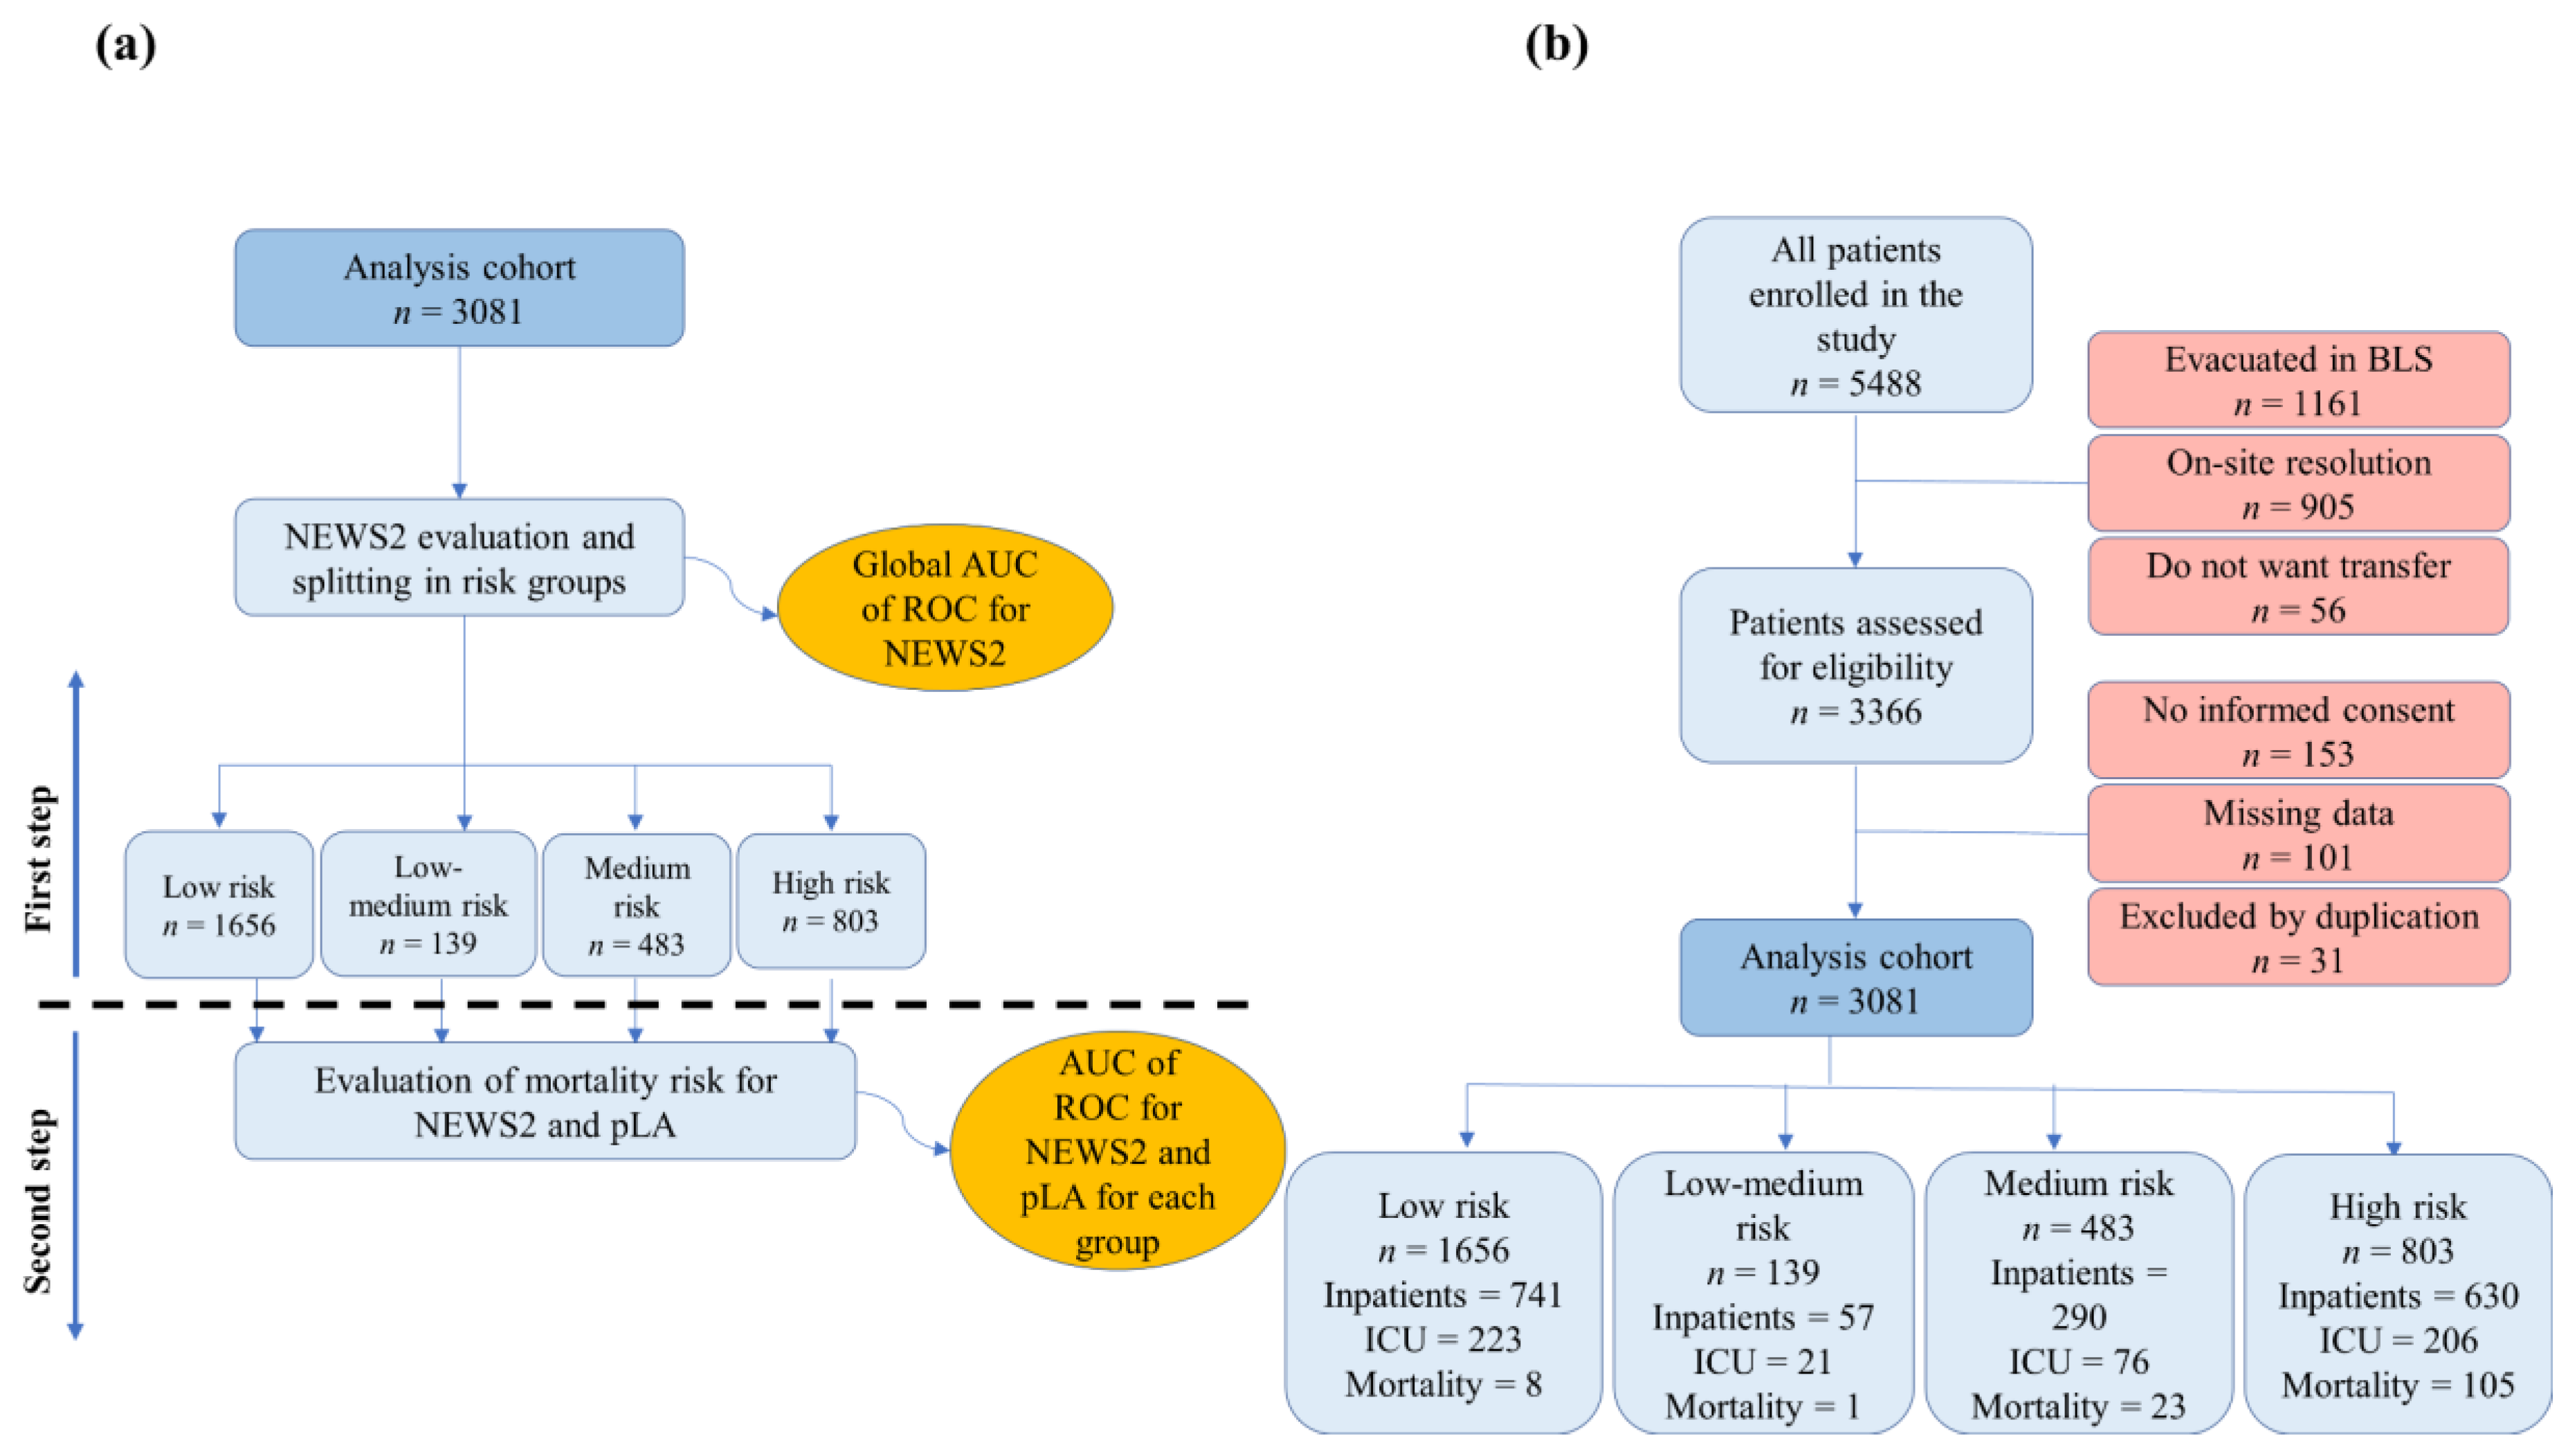
3. Results
3.1. Patients
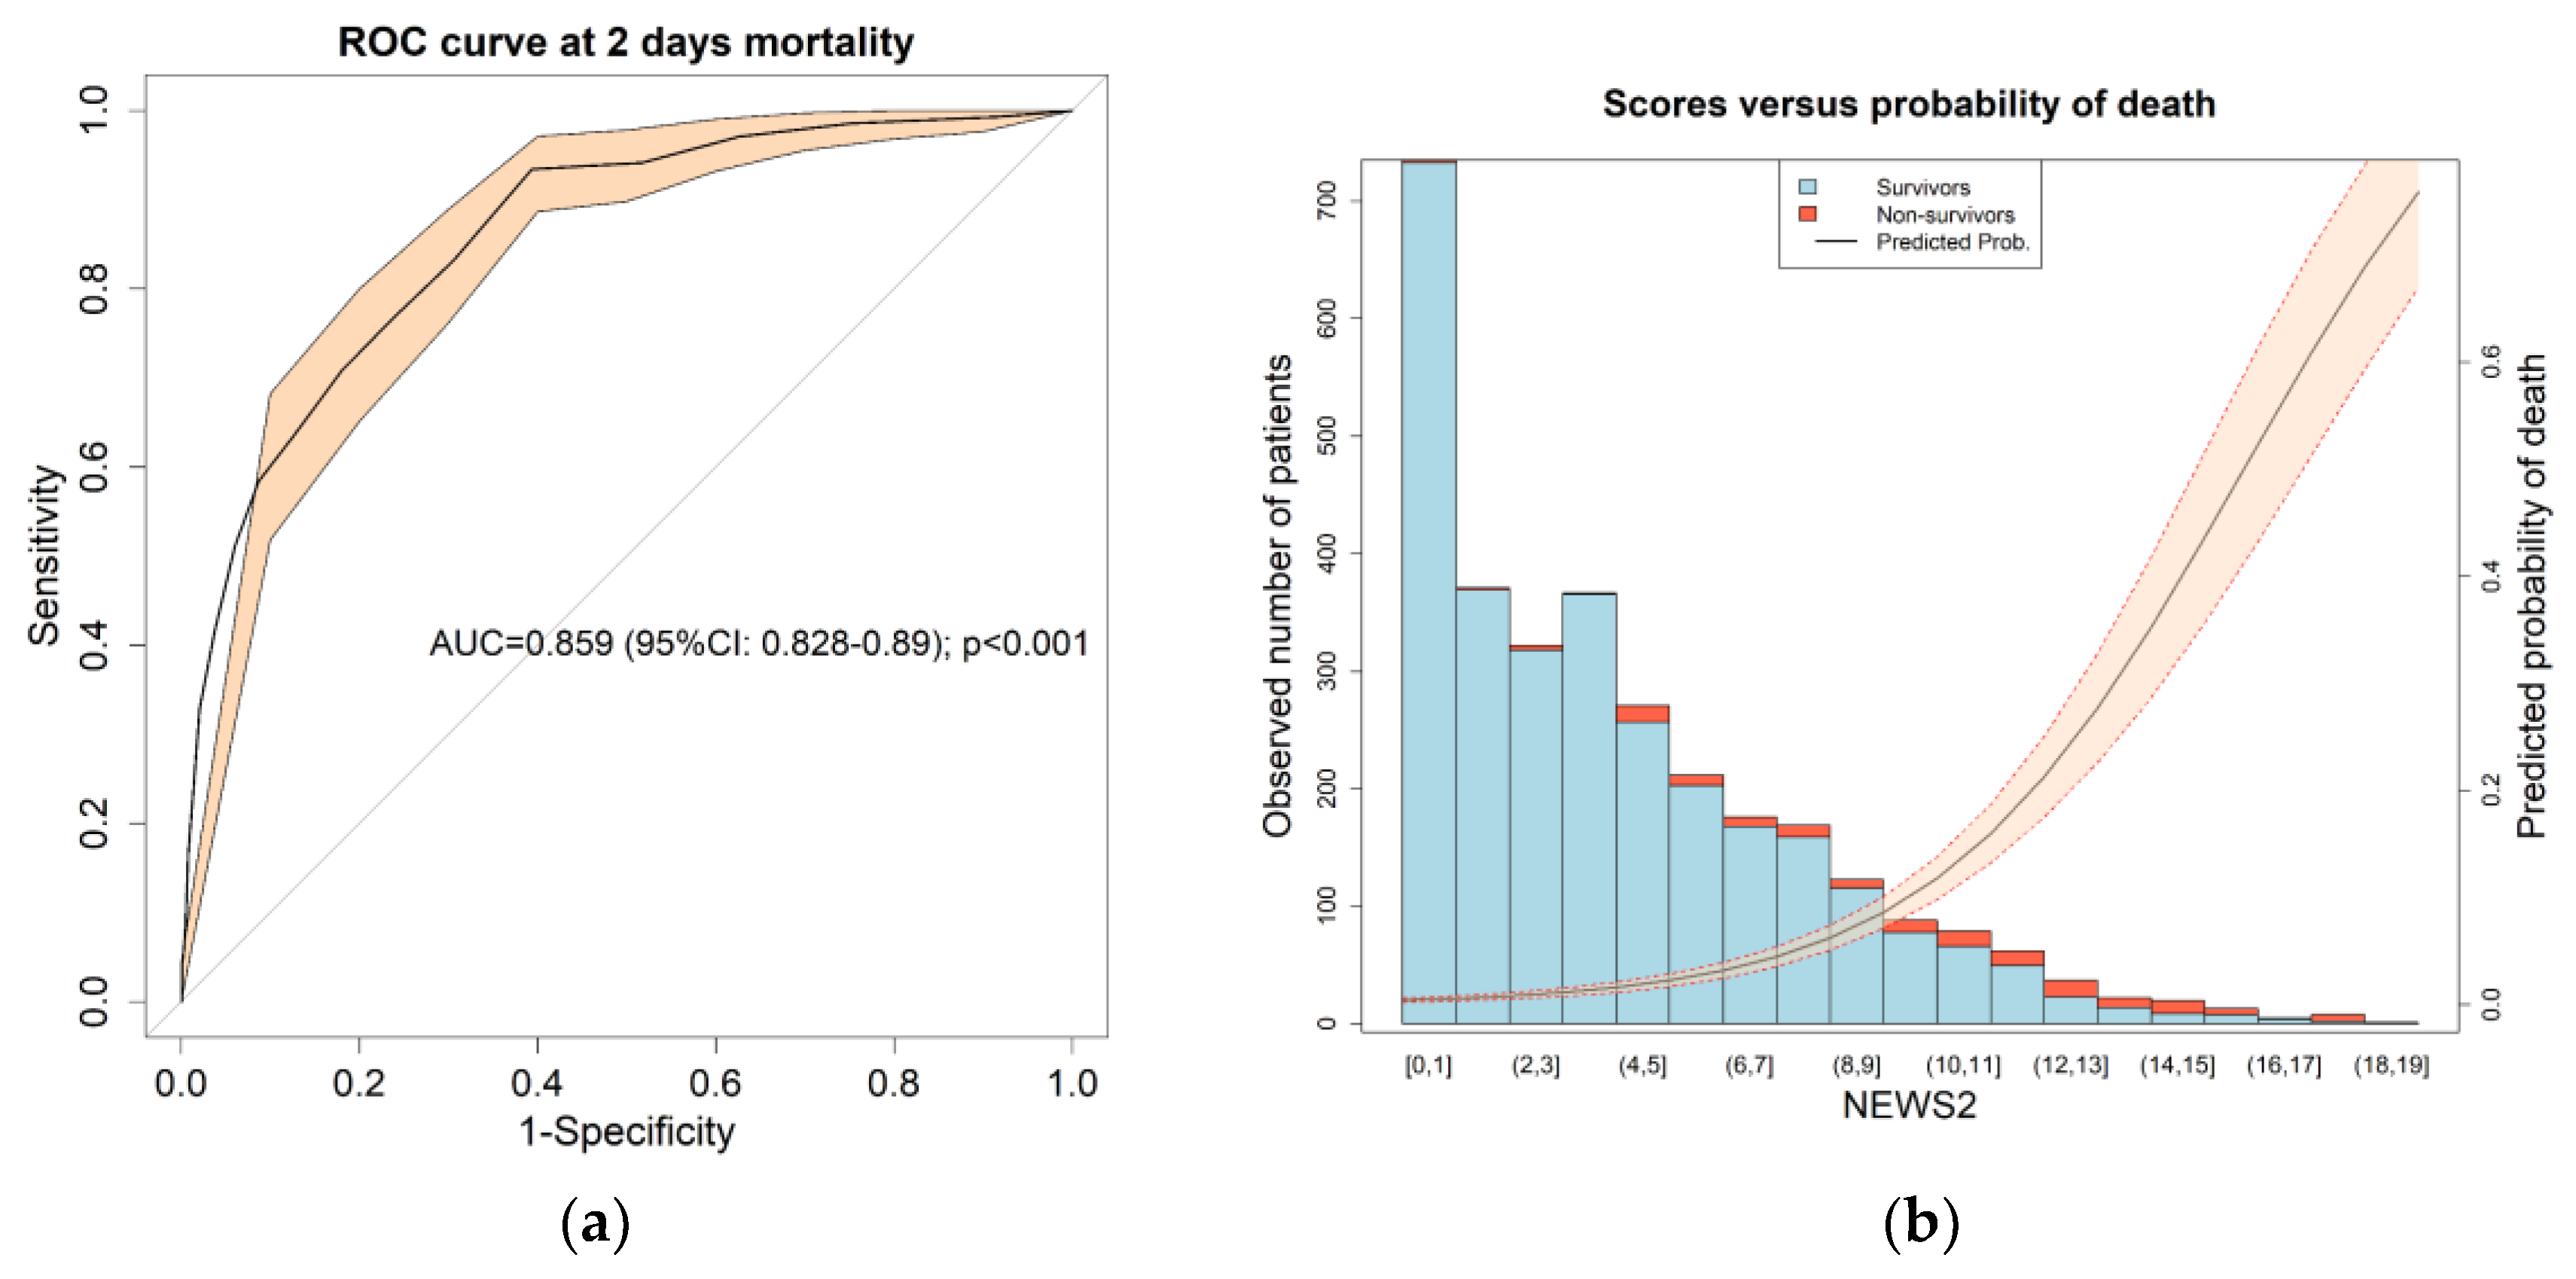
3.2. Patient Classification and Global NEWS2 Performance
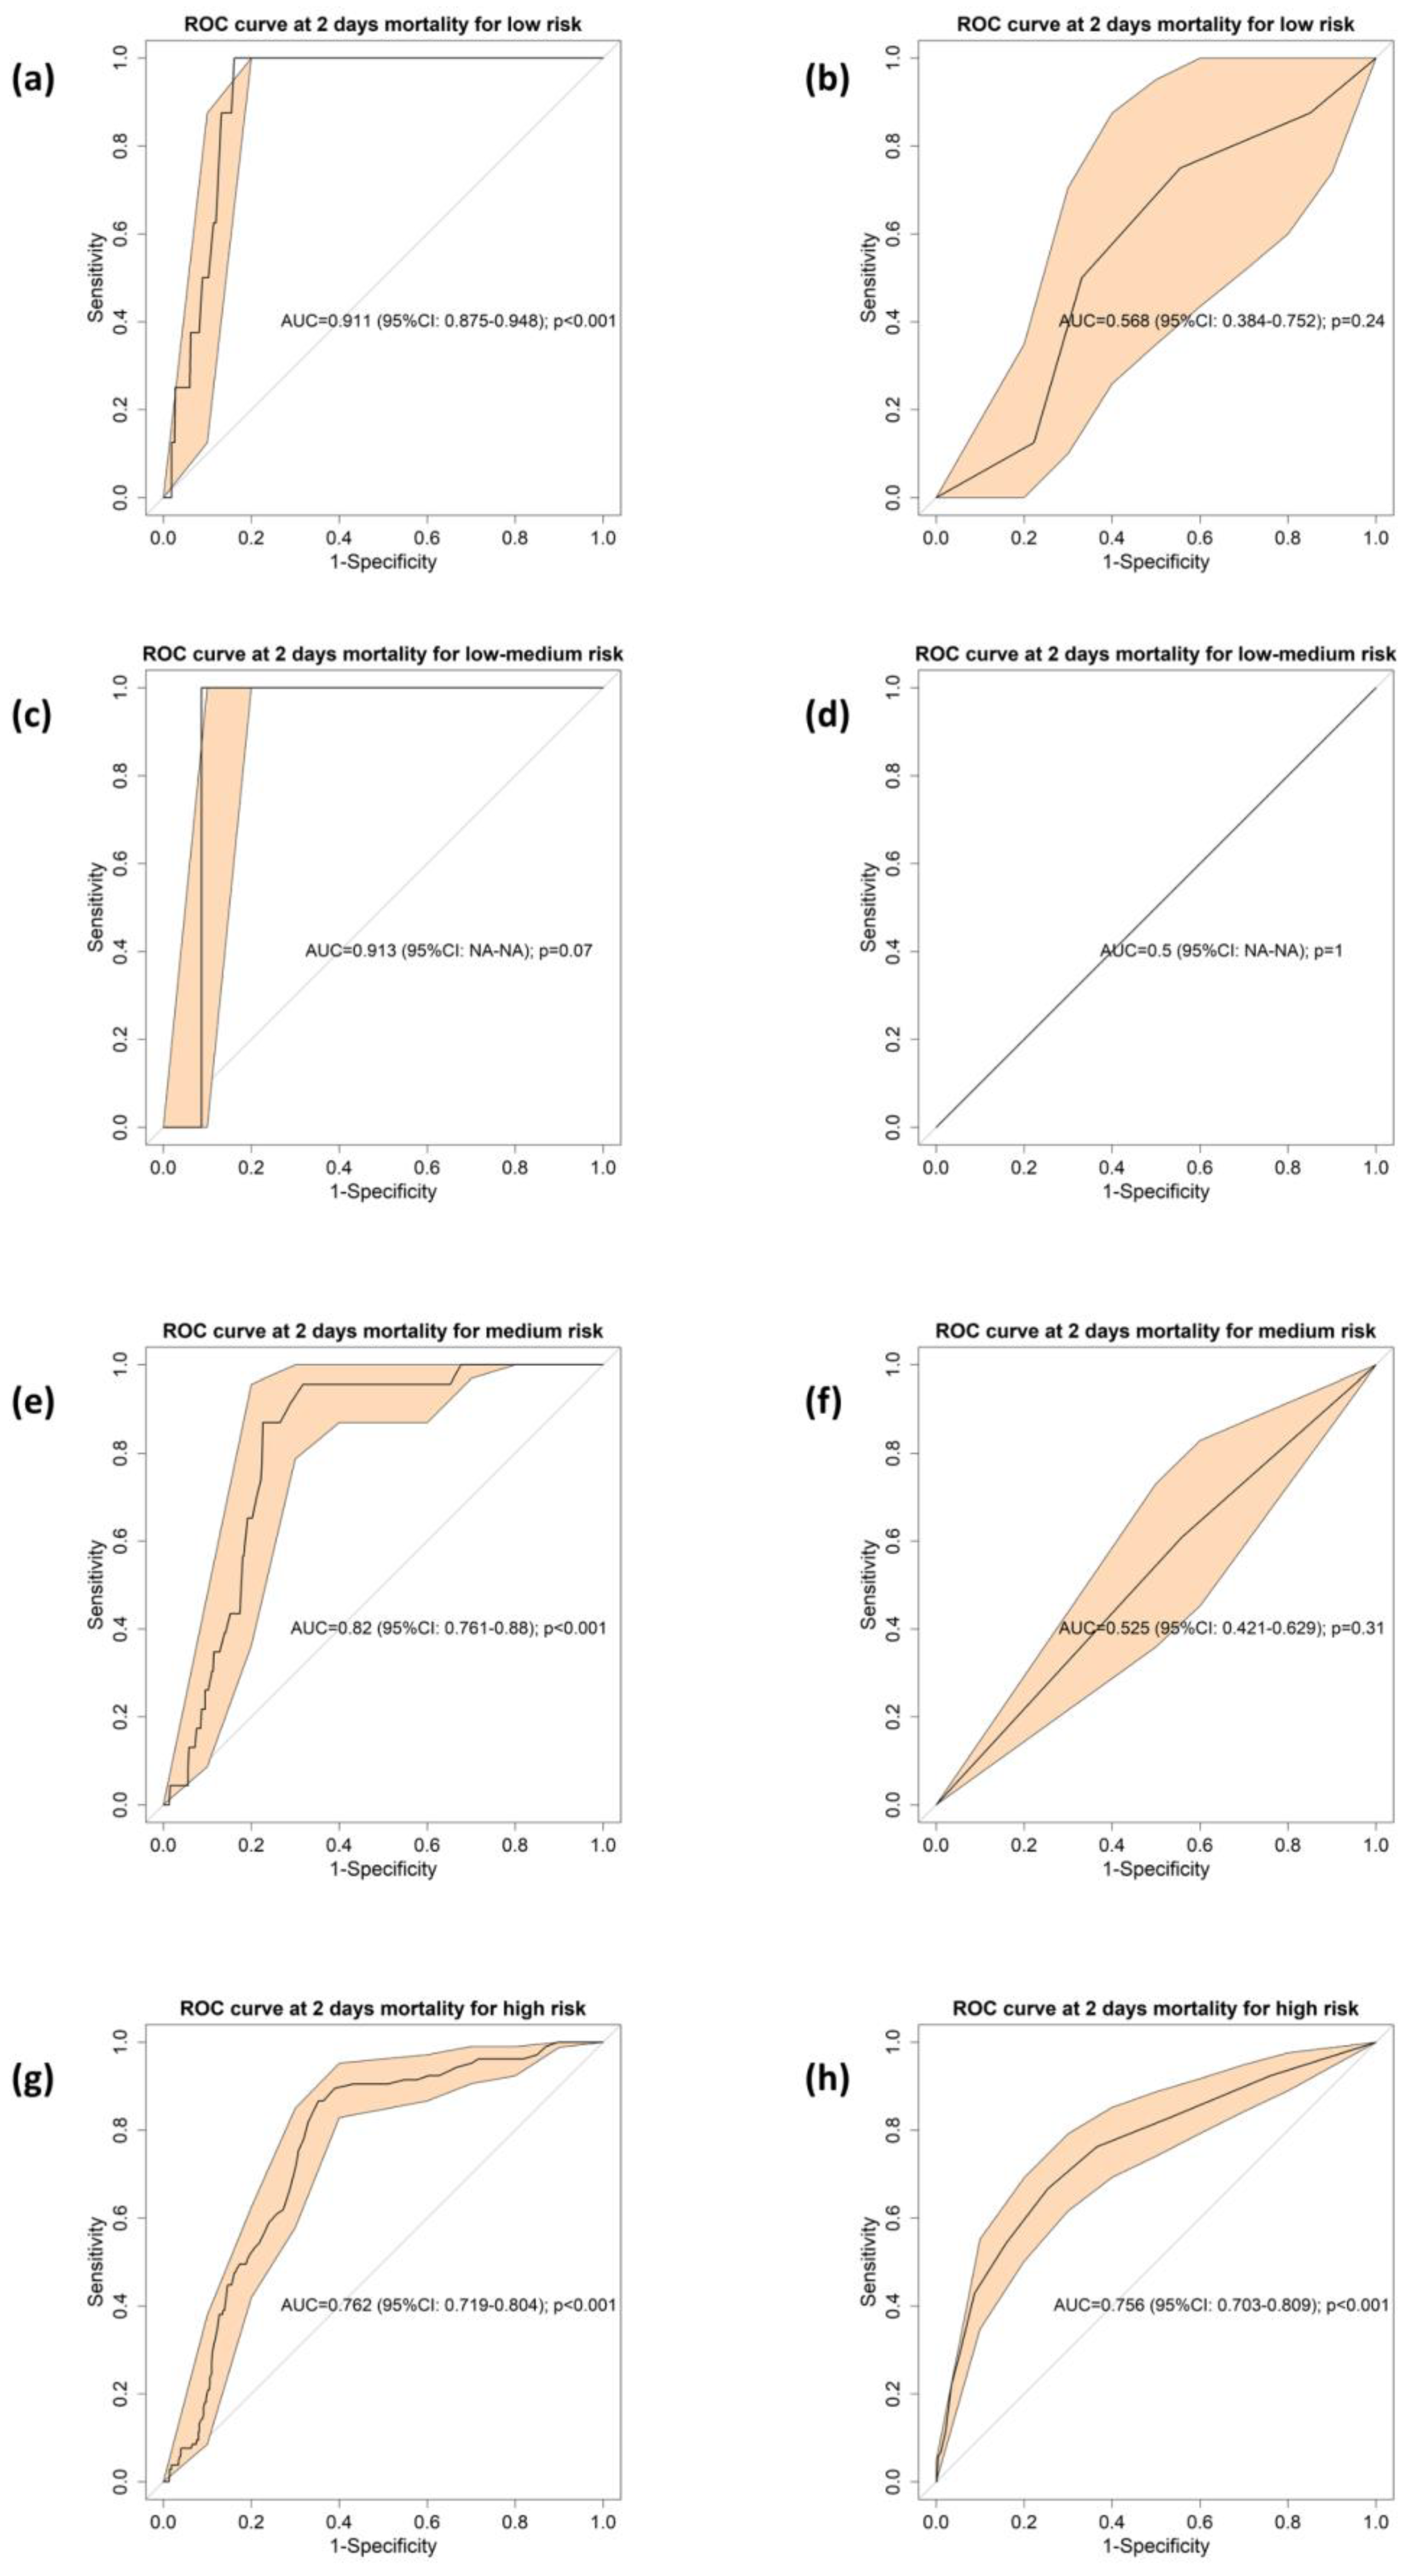
3.3. Comparison of Mortality Discrimination Derived from pLA and NEWS2
4. Discussion
Strength and Limitations
5. Conclusions
Supplementary Materials
Author Contributions
Funding
Conflicts of Interest
References
- Mills, E.H.A.; Aasbjerg, K.; Hansen, S.M.; Ringgren, K.B.; Dahl, M.; Rasmussen, B.S.; Torp-Pedersen, C.; Søgaard, P.; Kragholm, K. Prehospital time and mortality in patients requiring a highest priority emergency medical response: A danish registry-based cohort study. BMJ Open 2019, 9, e0230. [Google Scholar] [CrossRef] [Green Version]
- Sanko, S.; Kashani, S.; Ito, T.; Guggenheim, A.; Fei, S.; Eckstein, M. Advanced practice providers in the field: Implementation of the los angeles fire department advanced provider response unit. Prehosp. Emerg. Care 2019, 11, 1–11. [Google Scholar] [CrossRef] [PubMed]
- Downey, C.L.; Tahir, W.; Randell, R.; Brown, J.M.; Jayne, D.G. Strengths and limitations of early warning scores: A systematic review and narrative synthesis. Int. J. Nurs. Stud. 2017, 76, 106–119. [Google Scholar] [CrossRef] [PubMed] [Green Version]
- Barker, R.O.; Stocker, R.; Russell, S.; Roberts, A.P.; Kingston, A.; Adamson, J.; Hanratty, B. Distribution of the national early warning score (NEWS) in care home residents. Age Ageing 2019, 49, 141–145. [Google Scholar] [CrossRef] [PubMed] [Green Version]
- Scott, L.J.; Redmond, N.M.; Garrett, J.; Whiting, P.; Northstone, K.; Pullyblank, A. Distributions of the national early warning score (NEWS) across a healthcare system following a large-scale roll-out. Emerg. Med. J. 2019, 36, 287–292. [Google Scholar] [CrossRef] [PubMed] [Green Version]
- Royal College of Physicians. National Early Warning Score (NEWS) 2: Standardising the Assessment of Acute-Illness Severity in the NHS; RCP Press: London, UK, 2017. [Google Scholar]
- Pirneskoski, J.; Kuisma, M.; Olkkola, K.T.; Nurmi, J. Prehospital national early warning score predicts early mortality. Acta Anaesthesiol. Scand. 2019, 63, 676–683. [Google Scholar] [CrossRef]
- Silcock, D.J.; Corfield, A.R.; Gowens, P.A.; Rooney, K.D. Validation of the national early warning score in the prehospital setting. Resuscitation 2015, 89, 31–35. [Google Scholar] [CrossRef]
- Shaw, J.; Fothergill, R.T.; Clark, S.; Moore, F. Can the prehospital national early warning score identify patients most at risk from subsequent deterioration? Emerg. Med. J. 2017, 34, 533–537. [Google Scholar] [CrossRef]
- Body, R.; Almashali, M.; Morris, N.; Moss, P.; Jarman, H.; Appelboam, A.; Parris, R.; Chan, L.; Walker, A.; Harrison, M. Diagnostic accuracy of the T-MACS decision aid with a contemporary point-of-care troponin assay. Heart 2019, 105, 768–774. [Google Scholar] [CrossRef]
- Swan, K.L.; Avard, B.J.; Keene, T. The relationship between elevated prehospital point-of-care lactate measurements, intensive care unit admission, and mortality: A retrospective review of adult patients. Aust. Crit. Care 2019, 32, 100–105. [Google Scholar] [CrossRef]
- Ferreruela, M.; Raurich, J.M.; Ayestarán, I.; Llompart-Pou, J.A. Hyperlactatemia in ICU patients: Incidence, causes and associated mortality. J. Crit. Care 2017, 42, 200–205. [Google Scholar] [CrossRef] [PubMed]
- Martín-Rodríguez, F.; López-Izquierdo, R.; Castro-Villamor, M.A.; Mangas, I.M.; Del-Brío-Ibáñez, P.; Delgado-Benito, J.F.; Martín-Conty, J.L.; Manzanares, J.Á.; Mayo-Iscar, A.; Del-Pozo-Vegas, C. Prognostic value of lactate in prehospital care as a predictor of early mortality. Am. J. Emerg. Med. 2019, 37, 1627–1632. [Google Scholar] [CrossRef] [PubMed]
- Wood, C.; Chaboyer, W.; Carr, P. How do nurses use early warning scoring systems to detect and act on patient deterioration to ensure patient safety? A scoping review. Int. J. Nurs. Stud. 2019, 94, 166–178. [Google Scholar] [CrossRef] [PubMed]
- Crilly, J.; Keijzers, G.; Tippett, V.; O’wyer, J.; Lind, J.; Bost, N.; O’Dwyer, M.; Shiels, S.; Wallis, M. Improved outcomes for emergency department patients whose ambulance off-stretcher time is not delayed. Emerg. Med. Australas. 2015, 27, 216–224. [Google Scholar] [CrossRef] [Green Version]
- Lau, K.K.; Yu, E.L.; Lee, M.F.; Ho, S.H.; Ng, P.M.; Leung, C.S. Ambulance use affects timely emergency treatment of acute ischaemic stroke. Hong Kong Med. J. 2018, 24, 335–339. [Google Scholar] [CrossRef]
- Schuetz, P.; Hausfater, P.; Amin, D.; Amin, A.; Haubitz, S.; Faessler, L.; Kutz, A.; Conca, A.; Reutlinger, B.; Canavaggio, P. Biomarkers from distinct biological pathways improve early risk stratification in medical emergency patients: The multinational, prospective, observational TRIAGE study. Crit. Care 2015, 19, 377. [Google Scholar] [CrossRef] [Green Version]
- Cetınkaya, H.B.; Koksal, O.; Sigirli, D.; Leylek, E.H.; Karasu, O. The predictive value of the modified early warning score with rapid lactate level (ViEWS-L) for mortality in patients of age 65 or older visiting the emergency department. Intern. Emerg. Med. 2017, 12, 1253–1257. [Google Scholar] [CrossRef]
- Young, R.S.; Gobel, B.H.; Schumacher, M.; Lee, J.; Weaver, C.; Weitzman, S. Use of the modified early warning score and serum lactate to prevent cardiopulmonary arrest in hematology-oncology patients: A quality improvement study. Am. J. Med. Qual. 2014, 29, 530–537. [Google Scholar] [CrossRef]
- Jo, S.; Yoon, J.; Lee, J.B.; Jin, Y.; Jeong, T.; Park, B. Predictive value of the national early warning score-lactate for mortality and the need for critical care among general emergency department patients. J. Crit. Care 2016, 36, 60–68. [Google Scholar] [CrossRef]
- Dundar, Z.D.; Kocak, S.; Girisgin, A.S. Lactate and NEWS-L are fair predictors of mortality in critically ill geriatric emergency department patients. Am. J. Emerg. Med. 2020, in press. [Google Scholar] [CrossRef]
- Kim, D.; Jo, S.; Lee, J.B.; Jin, Y.; Jeong, T.; Yoon, J.; Park, B. Comparison of the national early warning score+lactate score with the pre-endoscopic rockall, glasgow-blatchford, and AIMS65 scores in patients with upper gastrointestinal bleeding. Clin. Exp. Emerg. Med. 2018, 5, 219–229. [Google Scholar] [CrossRef] [PubMed]
- Kelly, C.A.; Upex, A.; Bateman, D.N. Comparison of consciousness level assessment in the poisoned patient using the alert/verbal/painful/unresponsive scale and the glasgow coma scale. Ann. Emerg. Med. 2004, 44, 108–113. [Google Scholar] [CrossRef] [PubMed]
- Sanko, S.; Lane, C.; Eckstein, M. Effect of new 9-1-1 system on efficiency of initial resource assignment. Prehosp. Emerg. Care 2019, 1–13. [Google Scholar] [CrossRef] [PubMed]
- Bohm, K.; Kurland, L. The accuracy of medical dispatch—A systematic review. Scand. J. Trauma Resusc. Emerg. Med. 2018, 26, 94. [Google Scholar] [CrossRef]
- Li, Y.G.; Pastori, D.; Farcomeni, A.; Yang, P.S.; Jang, E.; Joung, B.; Wang, Y.T.; Guo, Y.T.; Lip, G.Y.H. A simple clinical risk score (C2HEST) for predicting incident atrial fibrillation in asian subjects: Derivation in 471,446 chinese subjects, with internal validation and external application in 451,199 korean subjects. Chest 2019, 155, 510–518. [Google Scholar] [CrossRef]
- Austin, P.C.; Steyerberg, E.W. Events per variable (EPV) and the relative performance of different strategies for estimating the out-of-sample validity of logistic regression models. Stat. Methods Med. Res. 2017, 26, 796–808. [Google Scholar] [CrossRef] [Green Version]
- Yoo, J.W.; Lee, J.R.; Jung, Y.K.; Choi, S.H.; Son, J.S.; Kang, B.J.; Park, T.S.; Huh, J.W.; Lim, C.M.; Koh, Y. A combination of early warning score and lactate to predict intensive care unit transfer of inpatients with severe sepsis/septic shock. Korean J. Intern. Med. 2015, 30, 471–477. [Google Scholar] [CrossRef]
- Jo, S.; Jeong, T.; Lee, J.B.; Jin, Y.; Yoon, J.; Park, B. Validation of modified early warning score using serum lactate level in community-acquired pneumonia patients. The national early warning score-lactate score. Am. J. Emerg. Med. 2016, 34, 536–541. [Google Scholar] [CrossRef]
- Abbott, T.E.F.; Torrance, H.D.T.; Cron, N.; Vaid, N.; Emmanuel, J. A single-centre cohort study of national early warning score (NEWS) and near patient testing in acute medical admissions. Eur. J. Intern. Med. 2016, 35, 78–82. [Google Scholar] [CrossRef] [Green Version]
- Martín-Rodríguez, F.; López-Izquierdo, R.; Del-Pozo-Vegas, C.; Delgado-Benito, J.F.; Del-Brio-Ibáñez, P.; Moro-Mangas, I.; Martín-Conty, J.L.; Castro-Villamor, M.Á. Predictive value of the prehospital NEWS2-L-national early warning score 2 lactate-for detecting early death after an emergency. Emergencias 2019, 31, 173–179. [Google Scholar]
- Hargreaves, D.S. Persistently elevated early warning scores and lactate identifies patients at high risk of mortality in suspected sepsis. Eur. J. Emerg. Med. 2020, in press. [Google Scholar] [CrossRef] [PubMed]
- Jouffroy, R.; Saade, A.; Tourtier, J.P.; Gueye, P.; Bloch-Laine, E.; Ecollan, P.; Carli, P.; Vivien, B. Skin mottling score and capillary refill time to assess mortality of septic shock since pre-hospital setting. Am. J. Emerg. Med. 2019, 37, 664–671. [Google Scholar] [CrossRef] [PubMed]
- Spagnolli, W.; Rigon, M.; Torri, E.; Cozzio, S.; Vettorato, E.; Nollo, G. Application of the national early warning score (NEWS) as a stratification tool on admission in an Italian acute medical ward: A perspective study. Int. J. Clin. Pract. 2017, 71, e1293. [Google Scholar] [CrossRef] [PubMed]
- Lane, D.J.; Wunsch, H.; Saskin, R.; Cheskes, S.; Lin, S.; Morrison, L.J.; Scales, D.C. Assessing severity of illness in patients transported to hospital by paramedics: External validation of 3 prognostic scores. Prehosp. Emerg. Care 2019, 273–281. [Google Scholar] [CrossRef]
- Kramer, A.A.; Sebat, F.; Lissauer, M. A review of early warning systems for prompt detection of patients at risk for clinical decline. J. Trauma Acute Care Surg. 2019, 87, S67–S73. [Google Scholar] [CrossRef]
- Brangan, E.; Banks, J.; Brant, H.; Pullyblank, A.; Le Roux, H.; Redwood, S. Using the national early warning score (NEWS) outside acute hospital settings: A qualitative study of staff experiences in the west of England. BMJ Open 2018, 8, e022528. [Google Scholar] [CrossRef]
- Lewis, C.T.; Naumann, D.N.; Crombie, N.; Midwinter, M.J. Prehospital point-of-care lactate following trauma: A systematic review. J. Trauma Acute Care Surg. 2016, 81, 748–755. [Google Scholar] [CrossRef]
- Swan, K.L.; Keene, T.; Avard, B.J. A 12-month clinical audit comparing point-of-care lactate measurements tested by paramedics with in-hospital serum lactate measurements. Prehosp. Disaster Med. 2018, 33, 36–42. [Google Scholar] [CrossRef]
- Howard, I.L.; Bowen, J.M.; Al Shaikh, L.A.H.; Mate, K.S.; Owen, R.C.; Williams, D.M. Development of a trigger tool to identify adverse events and harm in emergency medical services. Emerg. Med. J. 2017, 34, 391–397. [Google Scholar] [CrossRef]
- Alabdali, A.; Fisher, J.D.; Trivedy, C.; Lilford, R.J. A systematic review of the prevalence and types of adverse events in interfacility critical care transfers by paramedics. Air Med. J. 2017, 36, 116–121. [Google Scholar] [CrossRef]


| NEWS2 | 3 | 2 | 1 | 0 | 1 | 2 | 3 |
|---|---|---|---|---|---|---|---|
| Pulse (bpm) | ≤40 | 41–50 | 51–90 | 91–110 | 111–130 | ≥131 | |
| BR (bpm) | ≤8 | 9–11 | 12–20 | 21–24 | ≥25 | ||
| T (°C) | ≤35 | 35.1–36 | 36.1–38 | 38.1–39 | ≥39.1 | ||
| SBP (mmHg) | ≤90 | 91–100 | 101–110 | 111–219 | ≥220 | ||
| SpO2 (%) Scale 1 | ≤91 | 92–93 | 94–95 | ≥96 | |||
| SpO2 (%) Scale 2 1 | ≤83 | 84–85 | 86–87 | 88–92 ≥93 air | 93–94 Oxygen | 95–96 Oxygen | ≥97 Oxygen |
| Air oxygen | Oxygen | Air | |||||
| AVPU (scale) | A | V, P, U |
| Characteristic 1 | Total | Survivors | Non-Survivors | p-Value |
|---|---|---|---|---|
| Number (n (%)) | 3081 (100) | 2944 (95.6) | 137 (4.4) | |
| Age (years) | 69 (54–81) | 69 (53–81) | 80 (65–87) | 0.001 2 |
| Female | 1269 (41.2) | 1218 (41.4) | 51 (37.2) | 0.335 3 |
| Isochronous (Minutes) | ||||
| Arrival time | 10 (8–13) | 10 (8–13) | 10 (8–15) | 0.184 2 |
| Support time | 28 (22–34) | 28 (22–34) | 32 (25–39) | 0.001 2 |
| Transfer time | 10 (7–14) | 10 (7–13) | 10 (7–18) | 0.039 2 |
| Initial Evaluation | ||||
| NEWS 2 (points) | 4 (2–7) | 4 (2–6) | 11 (7–13) | 0.001 2 |
| Breathing rate (bpm) | 17 (14–24) | 17 (14–22) | 23 (14–34) | 0.001 2 |
| Supplemental oxygen | 389 (12.6) | 343 (11.7) | 46 (33.6) | 0.001 2 |
| Oxygen saturation (%) | 96 (93–98) | 96 (93–98) | 83 (72–93) | 0.001 2 |
| Heart rate (bpm) | 85 (70–104) | 84 (70–102) | 97 (71–121) | 0.009 2 |
| SBP (mmHg) | 137 (118–155) | 137 (119–155) | 124 (93–153) | 0.002 2 |
| Temperature (°C) | 36.3 (36.0–36.8) | 36.3 (36.0–36.8) | 36.0 (35.1–37.0) | 0.014 2 |
| GCS (3–15 points) | 15 (15–15) | 15 (15–15) | 11 (3–15) | 0.001 2 |
| pLA (mmol/L) | 2.9 (2.0–4.0) | 2.8 (1.9–3.8) | 5.1 (4.3–7.3) | 0.001 2 |
| Hospital Outcomes | ||||
| Inpatients | 1718 (55.8) | 1581 (53.7) | 137 (100) | 0.001 2 |
| ICU | 526 (17.1) | 455 (15.5) | 71 (51.8) | 0.001 2 |
| Pathologies | Total | Survivors | Non-Survivors |
|---|---|---|---|
| Abdominal Pain/Problems | 176 (5.7) | 166 (5.6) | 10 (7.3) |
| Allergies (Reactions) | 33 (1.1) | 33 (1.1) | 0 |
| Animal Bites/Attacks | 3 (0.1) | 3 (0.1) | 0 |
| Assault/Sexual Assault/Stun Gun | 2 (0.1) | 1 (0) | 1 (0.7) |
| Breathing Problems | 333 (10.8) | 311 (10.6) | 22 (16.1) |
| Burns (Scalds)/Explosions | 7 (0.2) | 6 (0.2) | 1 (0.7) |
| Carbon Monoxide/Inhalation | 12 (0.4) | 12 (0.4) | 0 |
| Chest Pain | 593 (19.2) | 579 (19.7) | 14 (10.2) |
| Choking | 17 (0.6) | 12 (0.4) | 5 (3.6) |
| Convulsions/Seizures | 185 (6.0) | 185 (6.3) | 0 |
| Diabetic Problems | 37 (1.2) | 36 (1.2) | 1 (0.7) |
| Electrocution/Lightning | 2 (0.1) | 2 (0.1) | 0 |
| Falls | 59 (1.9) | 57 (1.9) | 2 (1.5) |
| Headache | 64 (2.1) | 64 (2.2) | 0 |
| Heart Problems/AICD | 381 (12.4) | 349 (11.9) | 32 (23.4) |
| Heat/Cold Exposure | 11 (0.4) | 10 (0.3) | 1 (0.7) |
| Hemorrhage/Lacerations | 27 (0.9) | 27 (0.9) | 0 |
| Inaccessible Incident/Entrapments | 3 (0.1) | 3 (0.1) | 0 |
| Overdose/Poisoning (Ingestion) | 158 (5.1) | 154 (5.2) | 4 (2.9) |
| Sick Person | 106 (3.4) | 96 (3.3) | 10 (7.3) |
| Stab/Gunshot/Penetrating Trauma | 10 (0.3) | 10 (0.3) | 0 |
| Stroke/Transient Ischemic Attack | 301 (9.8) | 290 (9.9) | 11 (8.0) |
| Traffic/Transportation Incidents | 160 (5.2) | 155 (5.3) | 5 (3.6) |
| Traumatic Injuries | 49 (1.6) | 44 (1.5) | 5 (3.6) |
| Unconscious/Fainting (Near) | 352 (11.4) | 339 (11.5) | 13 (9.5) |
| Variable | Mortality Risk | |||
|---|---|---|---|---|
| Low | Low-Medium | Medium | High | |
| Number | 1656 (53.8) | 139 (4.5) | 483 (15.7) | 803 (26.1) |
| Age (years) | 65 (51–78) | 66 (49–79) | 72 (55–83) | 76 (62–84) |
| Female | 669 (52.7) | 67 (5.2) | 208 (16.4) | 325 (25.6) |
| pLA (mmol/L) | 2.4 (1.8–3.4) | 2.9 (2.0–3.8) | 3.1 (2.2–4.4) | 3.7 (2.6–5.1) |
| Hospital Outcomes | ||||
| Inpatients | 741 (44.7) | 57 (41) | 290 (60.0) | 630 (78.5) |
| ICU | 223 (13.4) | 21 (15.1) | 76 (15.7) | 206 (25.7) |
| Mortality | 8 (0.5) | 1 (0.7) | 23 (4.8) | 105 (13.1) |
| Mortality Risk by pLA | ||||
| Low | Low-Medium | Medium | High | |
| Prev. | 0.005 | 0.005 | 0.048 | 0.131 |
| pLA cut-off | 4.0 | 4.9 | 4.3 | 4.1 |
| Se | 28.3 (8.83–47.7) | 50 (12.2–87.7) | 30.4 (11.7–49.1) | 28.4 (11.5–45.4) |
| Sp | 86.4 (73.1–99.6) | 71.2 (45.1–97.3) | 81.5 (67.3–95.6) | 81.0 (67.4–94.6) |
| PPV | 1.01 (0.37–1.65) | 1.35 (0–3.08) | 7.46 (5.25–9.67) | 15.2 (10.6–19.7) |
| NPV | 99.6 (99.5–99.7) | 99.5 (99.2–99.8) | 96.2 (95.4–97.1) | 89.4 (87.4–91.3) |
| LR+ | 2.14 (0.78–3.51) | 1.97 (0–4.55) | 1.66 (1.15–2.17) | 1.29 (0.87–1.7) |
| LR− | 0.77 (0.58–0.95) | 0.57 (0.15–1) | 0.77 (0.59–0.95 | 0.80 (0.63–0.95 |
| DA | 86.1 (73–99.2) | 71.1 (45.3–96.8) | 79.1 (66.4–91.7) | 74,1 (64.3–83.9) |
| OR | 1.27 (1.12–1.45) (p < 0.001) | NS | 1.15 (1.06–1.24) (p < 0.001) | 1.15 (1.10–120) (p < 0.001) |
| Mortality Risk by NEWS 2 | ||||
| Low | Low-Medium | Medium | High | |
| Prev. | 0.005 | NA | 0.048 | 0.131 |
| NEWS2 cut-off | 2 | NA | 5 | 11 |
| Se | 65 (21.9–100) | NA | 69.5 (0–100) | 66.7 (57.2–75) |
| Sp | 40.8 (0–81.9) | NA | 27 (0–100) | 74.6 (71.3–77.7) |
| PPV | 0.52 (0.30–0.74) | NA | 4.5 (1.22–7.78) | 28.3 (23.1–34.3) |
| NPV | 99.6 (99.4–99.8) | NA | 94.8 (NA–NA) | 93.7 (91.4–95.4) |
| LR+ | 1.09 (0.63–1.54) | NA | 0.94 (0.22–1.66) | 2.63 (2.18–3.17) |
| LR− | 0.81 (0.44–1.19) | NA | 1.08 (NA–NA) | 0.45 (0.34–0.59) |
| DA | 40.9 (18.9–81.6) | NA | 26.9 (0–100) | 73.6 (70.4–76.5) |
| OR | NS | NS | NS | 5.89 (3.79–9.14) (p < 0.001) |
| Survivors | Non-Survivors | Odd Ratios | ||
|---|---|---|---|---|
| NEWS2 < 3 | pLA < 4 | 944 (100%) | 0 (0%) | * |
| pLA > 4 | 158 (97.5%) | 4 (2.5%) | ||
| NEWS2 > 3 | pLA < 4 | 1075 (98.5%) | 17 (1.5%) | 15.75(9.27–28.32) p < 0.001 |
| pLA > 4 | 449 (80%) | 112 (20%) |
© 2020 by the authors. Licensee MDPI, Basel, Switzerland. This article is an open access article distributed under the terms and conditions of the Creative Commons Attribution (CC BY) license (http://creativecommons.org/licenses/by/4.0/).
Share and Cite
Martín-Rodríguez, F.; López-Izquierdo, R.; Delgado Benito, J.F.; Sanz-García, A.; del Pozo Vegas, C.; Castro Villamor, M.Á.; Martín-Conty, J.L.; Ortega, G.J. Prehospital Point-Of-Care Lactate Increases the Prognostic Accuracy of National Early Warning Score 2 for Early Risk Stratification of Mortality: Results of a Multicenter, Observational Study. J. Clin. Med. 2020, 9, 1156. https://doi.org/10.3390/jcm9041156
Martín-Rodríguez F, López-Izquierdo R, Delgado Benito JF, Sanz-García A, del Pozo Vegas C, Castro Villamor MÁ, Martín-Conty JL, Ortega GJ. Prehospital Point-Of-Care Lactate Increases the Prognostic Accuracy of National Early Warning Score 2 for Early Risk Stratification of Mortality: Results of a Multicenter, Observational Study. Journal of Clinical Medicine. 2020; 9(4):1156. https://doi.org/10.3390/jcm9041156
Chicago/Turabian StyleMartín-Rodríguez, Francisco, Raúl López-Izquierdo, Juan F. Delgado Benito, Ancor Sanz-García, Carlos del Pozo Vegas, Miguel Ángel Castro Villamor, José Luis Martín-Conty, and Guillermo J. Ortega. 2020. "Prehospital Point-Of-Care Lactate Increases the Prognostic Accuracy of National Early Warning Score 2 for Early Risk Stratification of Mortality: Results of a Multicenter, Observational Study" Journal of Clinical Medicine 9, no. 4: 1156. https://doi.org/10.3390/jcm9041156