The Plasmatic Aldosterone and C-Reactive Protein Levels, and the Severity of Covid-19: The Dyhor-19 Study

 , , , , , , and
Abstract
:1. Introduction
2. Patients and Methods
2.1. Study Design
2.2. Outcome Measures
2.3. Data Collection
2.4. Statistical Analyses
3. Results
3.1. Patients and Clinical Course
3.2. Factors Associated with Disease Severity
4. Discussion
Supplementary Materials
Author Contributions
Funding
Acknowledgments
Conflicts of Interest
References
- Guan, W.-J.; Ni, Z.-Y.; Hu, Y.; Liang, W.-H.; Ou, C.-Q.; He, J.-X.; Liu, L.; Shan, H.; Lei, C.-L.; Hui, D.S.C.; et al. Clinical Characteristics of Coronavirus Disease 2019 in China. N. Engl. J. Med. 2020, 382, 1708–1720. [Google Scholar] [CrossRef] [PubMed]
- Bouadma, L.; Lescure, F.-X.; Lucet, J.-C.; Yazdanpanah, Y.; Timsit, J.-F. Severe SARS-CoV-2 infections: Practical considerations and management strategy for intensivists. Intensive Care Med. 2020, 46, 579–582. [Google Scholar] [CrossRef] [PubMed] [Green Version]
- Zhang, J.; Yu, M.; Tong, S.; Liu, L.-Y.; Tang, L.-V. Predictive factors for disease progression in hospitalized patients with coronavirus disease 2019 in Wuhan, China. J. Clin. Virol. 2020, 127, 104392. [Google Scholar] [CrossRef] [PubMed]
- Zhang, X.; Tan, Y.; Ling, Y.; Lu, G.; Liu, F.; Yi, Z.; Jia, X.; Wu, M.; Shi, B.; Xu, S.; et al. Viral and host factors related to the clinical outcome of COVID-19. Nature 2020, 583, 437–440. [Google Scholar] [CrossRef]
- Cariou, B.; Hadjadj, S.; Wargny, M.; Pichelin, M.; Al-Salameh, A.; Allix, I.; Amadou, C.; Arnault, G.; Baudoux, F.; Bauduceau, B.; et al. Phenotypic characteristics and prognosis of inpatients with COVID-19 and diabetes: The CORONADO study. Diabetologia 2020, 63, 1500–1515. [Google Scholar] [CrossRef]
- Cecconi, M.; Piovani, D.; Brunetta, E.; Aghemo, A.; Greco, M.; Ciccarelli, M.; Angelini, C.; Voza, A.; Omodei, P.; Vespa, E.; et al. Early Predictors of Clinical Deterioration in a Cohort of 239 Patients Hospitalized for Covid-19 Infection in Lombardy, Italy. J. Clin. Med. 2020, 9, 1548. [Google Scholar] [CrossRef]
- Li, W.; Moore, M.J.; Vasilieva, N.; Sui, J.; Wong, S.K.; Berne, M.A.; Somasundaran, M.; Sullivan, J.L.; Luzuriaga, K.; Greenough, T.C.; et al. Angiotensin-converting enzyme 2 is a functional receptor for the SARS coronavirus. Nature 2003, 426, 450–454. [Google Scholar] [CrossRef] [Green Version]
- Vaduganathan, M.; Vardeny, O.; Michel, T.; McMurray, J.J.V.; Pfeffer, M.A.; Solomon, S.D. Renin–Angiotensin–Aldosterone System Inhibitors in Patients with Covid-19. N. Engl. J. Med. 2020, 382, 1653–1659. [Google Scholar] [CrossRef]
- Cao, B.; Wang, Y.; Wen, D.; Liu, W.; Wang, J.; Fan, G.; Ruan, L.; Song, B.; Cai, Y.; Wei, M.; et al. A Trial of Lopinavir-Ritonavir in Adults Hospitalized with Severe Covid-19. N. Engl. J. Med. 2020, 382, 1787–1799. [Google Scholar] [CrossRef]
- Sabbadin, C.; Armanini, D. Syndromes that Mimic an Excess of Mineralocorticoids. High Blood Press. Cardiovasc. Prev. 2016, 23, 231–235. [Google Scholar] [CrossRef]
- Moore, J.B.; June, C.H. Cytokine release syndrome in severe COVID-19. Science 2020, 368, 473–474. [Google Scholar] [CrossRef] [PubMed] [Green Version]
- Vabret, N.; Britton, G.J.; Gruber, C.; Hegde, S.; Kim, J.; Kuksin, M.; Levantovsky, R.; Malle, L.; Moreira, A.; Park, M.D.; et al. Immunology of COVID-19: Current state of the science. Immunity 2020, 52, 910–941. [Google Scholar] [CrossRef] [PubMed]
- Imai, Y.; Kuba, K.; Rao, S.; Huan, Y.; Guo, F.; Guan, B.; Yang, P.; Sarao, R.; Wada, T.; Leong-Poi, H.; et al. Angiotensin-converting enzyme 2 protects from severe acute lung failure. Nature 2005, 436, 112–116. [Google Scholar] [CrossRef]
- Imai, Y.; Kuba, K.; Ohto-Nakanishi, T.; Penninger, J.M. Angiotensin-Converting Enzyme 2 (ACE2) in Disease Pathogenesis. Circ. J. 2010, 74, 405–410. [Google Scholar] [CrossRef] [PubMed] [Green Version]
- Kuba, K.; Imai, Y.; Rao, S.; Gao, H.; Guo, F.; Guan, B.; Huan, Y.; Yang, P.; Zhang, Y.; Deng, W.; et al. A crucial role of angiotensin converting enzyme 2 (ACE2) in SARS coronavirus-induced lung injury. Nat. Med. 2005, 11, 875–879. [Google Scholar] [CrossRef]
- Patel, S.; Rauf, A.; Khan, H.; Abu-Izneid, T. Renin-angiotensin-aldosterone (RAAS): The ubiquitous system for homeostasis and pathologies. Biomed. Pharmacother. 2017, 94, 317–325. [Google Scholar] [CrossRef]
- Watanabe, T.; Miyoshi, M.; Imoto, T. Angiotensin II: Its effects on fever and hypothermia in systemic inflammation. Front. Biosci. 2004, 9, 438–447. [Google Scholar] [CrossRef] [Green Version]
- Liao, C.-W.; Chou, C.-H.; Wu, X.-M.; Chen, Z.-W.; Chen, Y.-H.; Chang, Y.-Y.; Wu, V.-C.; Rose-John, S.; Hung, C.-S.; Lin, Y.-H.; et al. Interleukin-6 plays a critical role in aldosterone-induced macrophage recruitment and infiltration in the myocardium. Biochim. Biophys. Acta Mol. Basis Dis. 2020, 1866, 165627. [Google Scholar] [CrossRef]
- Chou, C.-H.; Hung, C.-S.; Liao, C.-W.; Wei, L.-H.; Chen, C.-W.; Shun, C.-T.; Wen, W.-F.; Wan, C.-H.; Wu, X.-M.; Chang, Y.-Y.; et al. IL-6 trans-signalling contributes to aldosterone-induced cardiac fibrosis. Cardiovasc. Res. 2018, 114, 690–702. [Google Scholar] [CrossRef]
- Pacurari, M.; Kafoury, R.; Tchounwou, P.B.; Ndebele, K. The Renin-Angiotensin-Aldosterone System in Vascular Inflammation and Remodeling. Int. J. Inflamm. 2014, 2014, 1–13. [Google Scholar] [CrossRef]
- Wilkinson-Berka, J.L.; Suphapimol, V.; Jerome, J.R.; Deliyanti, D.; Allingham, M.J. Angiotensin II and aldosterone in retinal vasculopathy and inflammation. Exp. Eye Res. 2019, 187, 107766. [Google Scholar] [CrossRef] [PubMed]
- Maron, B.A.; Zhang, Y.-Y.; White, K.; Chan, S.Y.; Handy, D.E.; Mahoney, C.E.; Loscalzo, J.; Leopold, J.A. Aldosterone Inactivates the Endothelin-B Receptor via a Cysteinyl Thiol Redox Switch to Decrease Pulmonary Endothelial Nitric Oxide Levels and Modulate Pulmonary Arterial Hypertension. Circulation 2012, 126, 963–974. [Google Scholar] [CrossRef] [PubMed] [Green Version]
- Edler, C.; Schröder, A.S.; Aepfelbacher, M.; Fitzek, A.; Heinemann, A.; Heinrich, F.; Klein, A.; Langenwalder, F.; Lütgehetmann, M.; Meißner, K.; et al. Dying with SARS-CoV-2 infection—an autopsy study of the first consecutive 80 cases in Hamburg, Germany. Int. J. Legal Med. 2020, 134, 1275–1284. [Google Scholar] [CrossRef] [PubMed]
- Varga, Z.; Flammer, A.J.; Steiger, P.; Haberecker, M.; Andermatt, R.; Zinkernagel, A.S.; Mehra, M.R.; Schuepbach, R.A.; Ruschitzka, F.; Moch, H. Endothelial cell infection and endotheliitis in COVID-19. Lancet 2020, 395, 1417–1418. [Google Scholar] [CrossRef]
- Ackermann, M.; Verleden, S.E.; Kuehnel, M.; Haverich, A.; Welte, T.; Laenger, F.; Vanstapel, A.; Werlein, C.; Stark, H.; Tzankov, A.; et al. Pulmonary Vascular Endothelialitis, Thrombosis, and Angiogenesis in Covid-19. N. Engl. J. Med. 2020, 383, 120–128. [Google Scholar] [CrossRef]
- Tan, W.S.D.; Liao, W.; Zhou, S.; Mei, D.; Wong, W.-S.F. Targeting the renin–angiotensin system as novel therapeutic strategy for pulmonary diseases. Curr. Opin. Pharmacol. 2018, 40, 9–17. [Google Scholar] [CrossRef]
- Aronson, J.K.; Ferner, R.E. Drugs and the renin-angiotensin system in covid-19. BMJ 2020, 369, m1313. [Google Scholar] [CrossRef] [Green Version]
- Reynolds, H.R.; Adhikari, S.; Pulgarin, C.; Troxel, A.B.; Iturrate, E.; Johnson, S.B.; Hausvater, A.; Newman, J.D.; Berger, J.S.; Bangalore, S.; et al. Renin-Angiotensin-Aldosterone System Inhibitors and Risk of Covid-19. N. Engl. J. Med. 2020, 382, 2441–2448. [Google Scholar] [CrossRef]


| Patient Characteristics | Total (n = 44) | Disease Severity | p-Value | |
|---|---|---|---|---|
| Mild/Moderate (n = 29) | Severe (n = 15) | |||
| Demographics | ||||
| Age, median (IQR)—years | 66.5 (53–75.3) | 65 (55–75) | 70 (50.5–75.5) | 0.67 1 |
| Female sex—n (%) | 17 (38.6) | 9 (31) | 8 (53) | 0.15 2 |
| Diagnosis of Covid-19—n (%) | ||||
| Positive (SARS-CoV-2 PCR) | 41 (93.2) | 27 (93) | 14 (93) | 1 3 |
| Suspected | 3 (6.8) | 3 (7) | 1 (7) | 1 3 |
| Signs and symptoms of Covid-19—n (%) | ||||
| Fever | 38 (86.4) | 27 (93.1) | 11 (73.3) | 0.16 3 |
| Myalgia | 14 (32.6) | 9 (31) | 5 (35.7) | 1 3 |
| Cough | 28 (65.1) | 20 (69) | 8 (53.3) | 0.31 2 |
| Breathlessness | 24 (54.5) | 15 (51.7) | 9 (60) | 0.60 2 |
| Diarrhea | 12 (27.3) | 7 (24.1) | 5 (33.3) | 0.72 3 |
| Headache | 2 (4.5) | 1 (3.4) | 1 (6.7) | 1 3 |
| Anosmia | 8 (18.2) | 7 (24.1) | 1 (6.7) | 0.23 3 |
| Dysgeusia | 9 (20.5) | 7 (24.1) | 2 (13.3) | 0.7 3 |
| Delay from onset symptoms median (IQR)—day | 8 (5–10) | 9 (6–11) | 7 (4–8) | 0.07 1 |
| Coexisting conditions—n (%) | ||||
| Hypertension | 25 (56.8) | 15 (51.7) | 10 (66.7) | 0.34 2 |
| Diabetes mellitus | 15 (34.1) | 8 (27.6) | 7 (46.7) | 0.21 2 |
| Obesity | 11 (25) | 6 (20.7) | 5 (33.3) | 0.47 3 |
| Cardiovascular disease | 16 (36.4) | 10 (34.5) | 6 (40) | 0.72 2 |
| Stroke | 5 (11.4) | 2 (6.9) | 3 (20) | 0.32 3 |
| Chronic kidney disease (eGFR < 60 mL/min) | 7 (15.9) | 2 (6.9) | 5 (33.3) | 0.04 3 |
| Cancer | 8 (18.2) | 7 (24.1) | 1 (6.7) | 0.41 3 |
| Dysthyroid disease | 5 (11.4) | 1 (3.4) | 4 (26.7) | 0.04 3 |
| History of organ transplantation | 4 (9.1) | 1 (3.4) | 3 (20) | 0.11 3 |
| Documented acute bacterial infection | 10 (22.7) | 3 (10.3) | 7 (46.7) | 0.02 3 |
| Long-term anti-hypertensive treatment—n (%) | ||||
| Angiotensin-converting enzyme inhibitors | 10 (22.7) | 6 (20.7) | 4 (26.7) | 0.71 2 |
| Angiotensin-receptor blockers | 6 (13.6) | 5 (17.2) | 1 (6.7) | 0.65 2 |
| Calcium-channel blockers | 6 (13.6) | 5 (17.2) | 1 (6.7) | 0.65 2 |
| Beta-blockers | 14 (31.8) | 6 (20.7) | 8 (53.3) | 0.04 2 |
| Thiazide diuretics | 3 (6.8) | 2 (6.9) | 1 (6.7) | 1 2 |
| Loop diuretics | 7 (15.9) | 2 (6.9) | 5 (33.3) | 0.04 2 |
| Care during hospitalization | ||||
| Duration mean (SD)—day | 13.1 (10.9) | 10.1 (7.5) | 18.8 (14.1) | 0.03 4 |
| Corticosteroid therapy mean (SD)—day | 1.8 (3.1) | 1.1 (2.4) | 3.33 (3.8) | 0.02 4 |
| Use of antibiotic agents—n (%) | 30 (68.2) | 16 (55.2) | 14 (93.3) | 0.02 3 |
| Use of vasoactive drug—n (%) | 7 (15.91) | 0 (0.00) | 7 (46.67) | <0.01 3 |
| Seven-Category Ordinal Scale | Day 0 (at Inclusion) | Day 2 | OS Max | |
|---|---|---|---|---|
| Mild clinical status—n (%) | 12 (27.3) | 17 (38.6) | 10 (22.7) | |
| 1 | Not hospitalized, no limitations on activities—n | - | - | - |
| 2 | Not hospitalized, limitations on activities—n | - | 2 | - |
| 3 | Hospitalized, not requiring supplemental oxygen—n | 12 | 15 | 10 |
| Moderate clinical status—n (%) | 25 (56.8) | 15 (34.1) | 19 (43.2) | |
| 4 | Hospitalized, requiring supplemental oxygen—n | 25 | 15 | 19 |
| Severe clinical status—n (%) | 7 (15.9) | 12 (27.3) | 15 (34.1) | |
| 5 | Hospitalized, on non-invasive ventilation or high flow oxygen devices—n | 1 | 5 | 3 |
| 6 | Hospitalized, on invasive mechanical ventilation or ECMO—n | 6 | 5 | 6 |
| 7 | Death—n | |||
| Measurements | Number Data Available | Total | Disease Severity | Median Difference (95% CI) | p-Value * | |
|---|---|---|---|---|---|---|
| Mild/Moderate (n = 29) | Severe (n = 15) | |||||
| Univariate analysis | ||||||
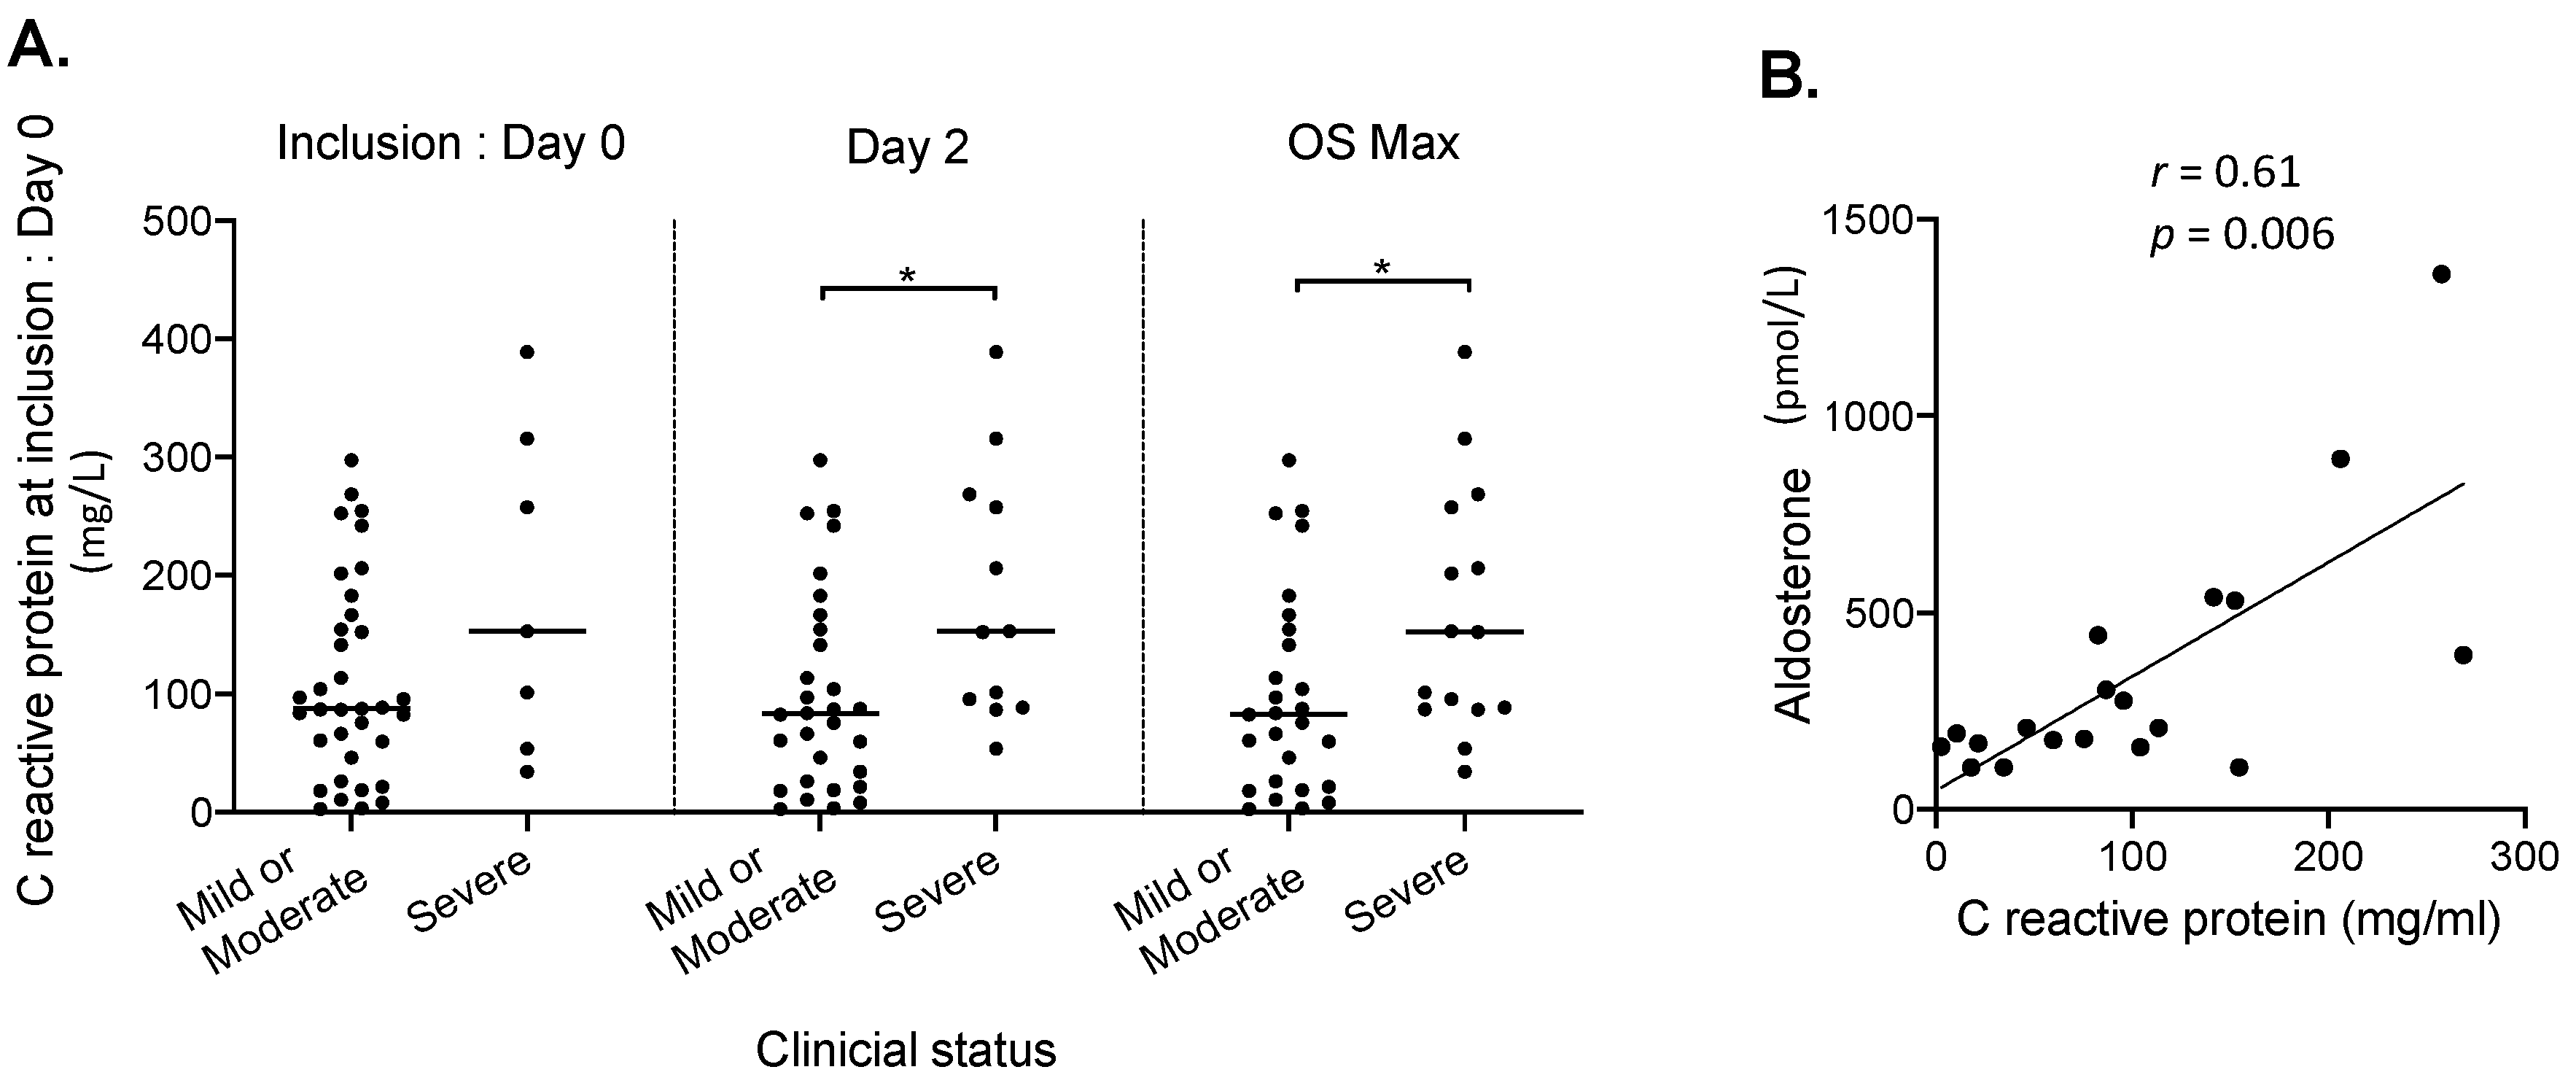
| C-reactive protein median (min-max)—mg/L | 42 | 92 (3–389) | 83 (3–298) | 152 (34–389) | 65 (6; 127) | 0.03 1 |
| Lymphocyte count median (min-max)—109/L | 42 | 1.2 (0.2–2.6) | 1.1 (0.2–2.6) | 1.3 (0.2–2) | 0.2 (−0.2; 0.5) | 0.22 1 |
| Monocyte count median (min-max)—109/L | 42 | 0.5 (0.1–2.3) | 0.5 (0.1–2.3) | 0.5 (0.2–1.5) | 0.1 (−0.1; 0.3) | 0.42 1 |
| Eosinophil count median (min-max)—109/L | 42 | 0.1 (0–0.3) | 0.1 (0–0.3) | 0 (0–0.3) | −0.02 (−0.1; 0) | 0.11 1 |
| Fibrinogen median (min-max)—g/L | 39 | 5.7 (1.2–9.4) | 5.6 (1.2–9.4) | 5.9 (3.4–7.6) | 0.4 (−0.8; 1.5) | 0.56 2 |
| D-dimers median (min-max)—μg/L | 35 | 870 (200–4000) | 738 (372–4000) | 1112 (200–4000) | 215 (−247; 760) | 0.32 1 |
| NT pro-BNP median (min-max)—ng/L | 31 | 423 (17–63245) | 228 (17–16749) | 1135 (58–63245) | 711.50 (−17; 2065) | 0.06 1 |
| Troponin median (min-max)—ng/L | 39 | 13.8 (1.5–1596) | 12.4 (1.5–1596) | 23.8 (1.5–24) | 7.55 (−3; 68.5) | 0.18 1 |
| Ferritin median (min-max)—µg/L | 35 | 814 (133–12460) | 603 (148–12460) | 966 (133–7750) | 217 (−330; 965) | 0.43 1 |
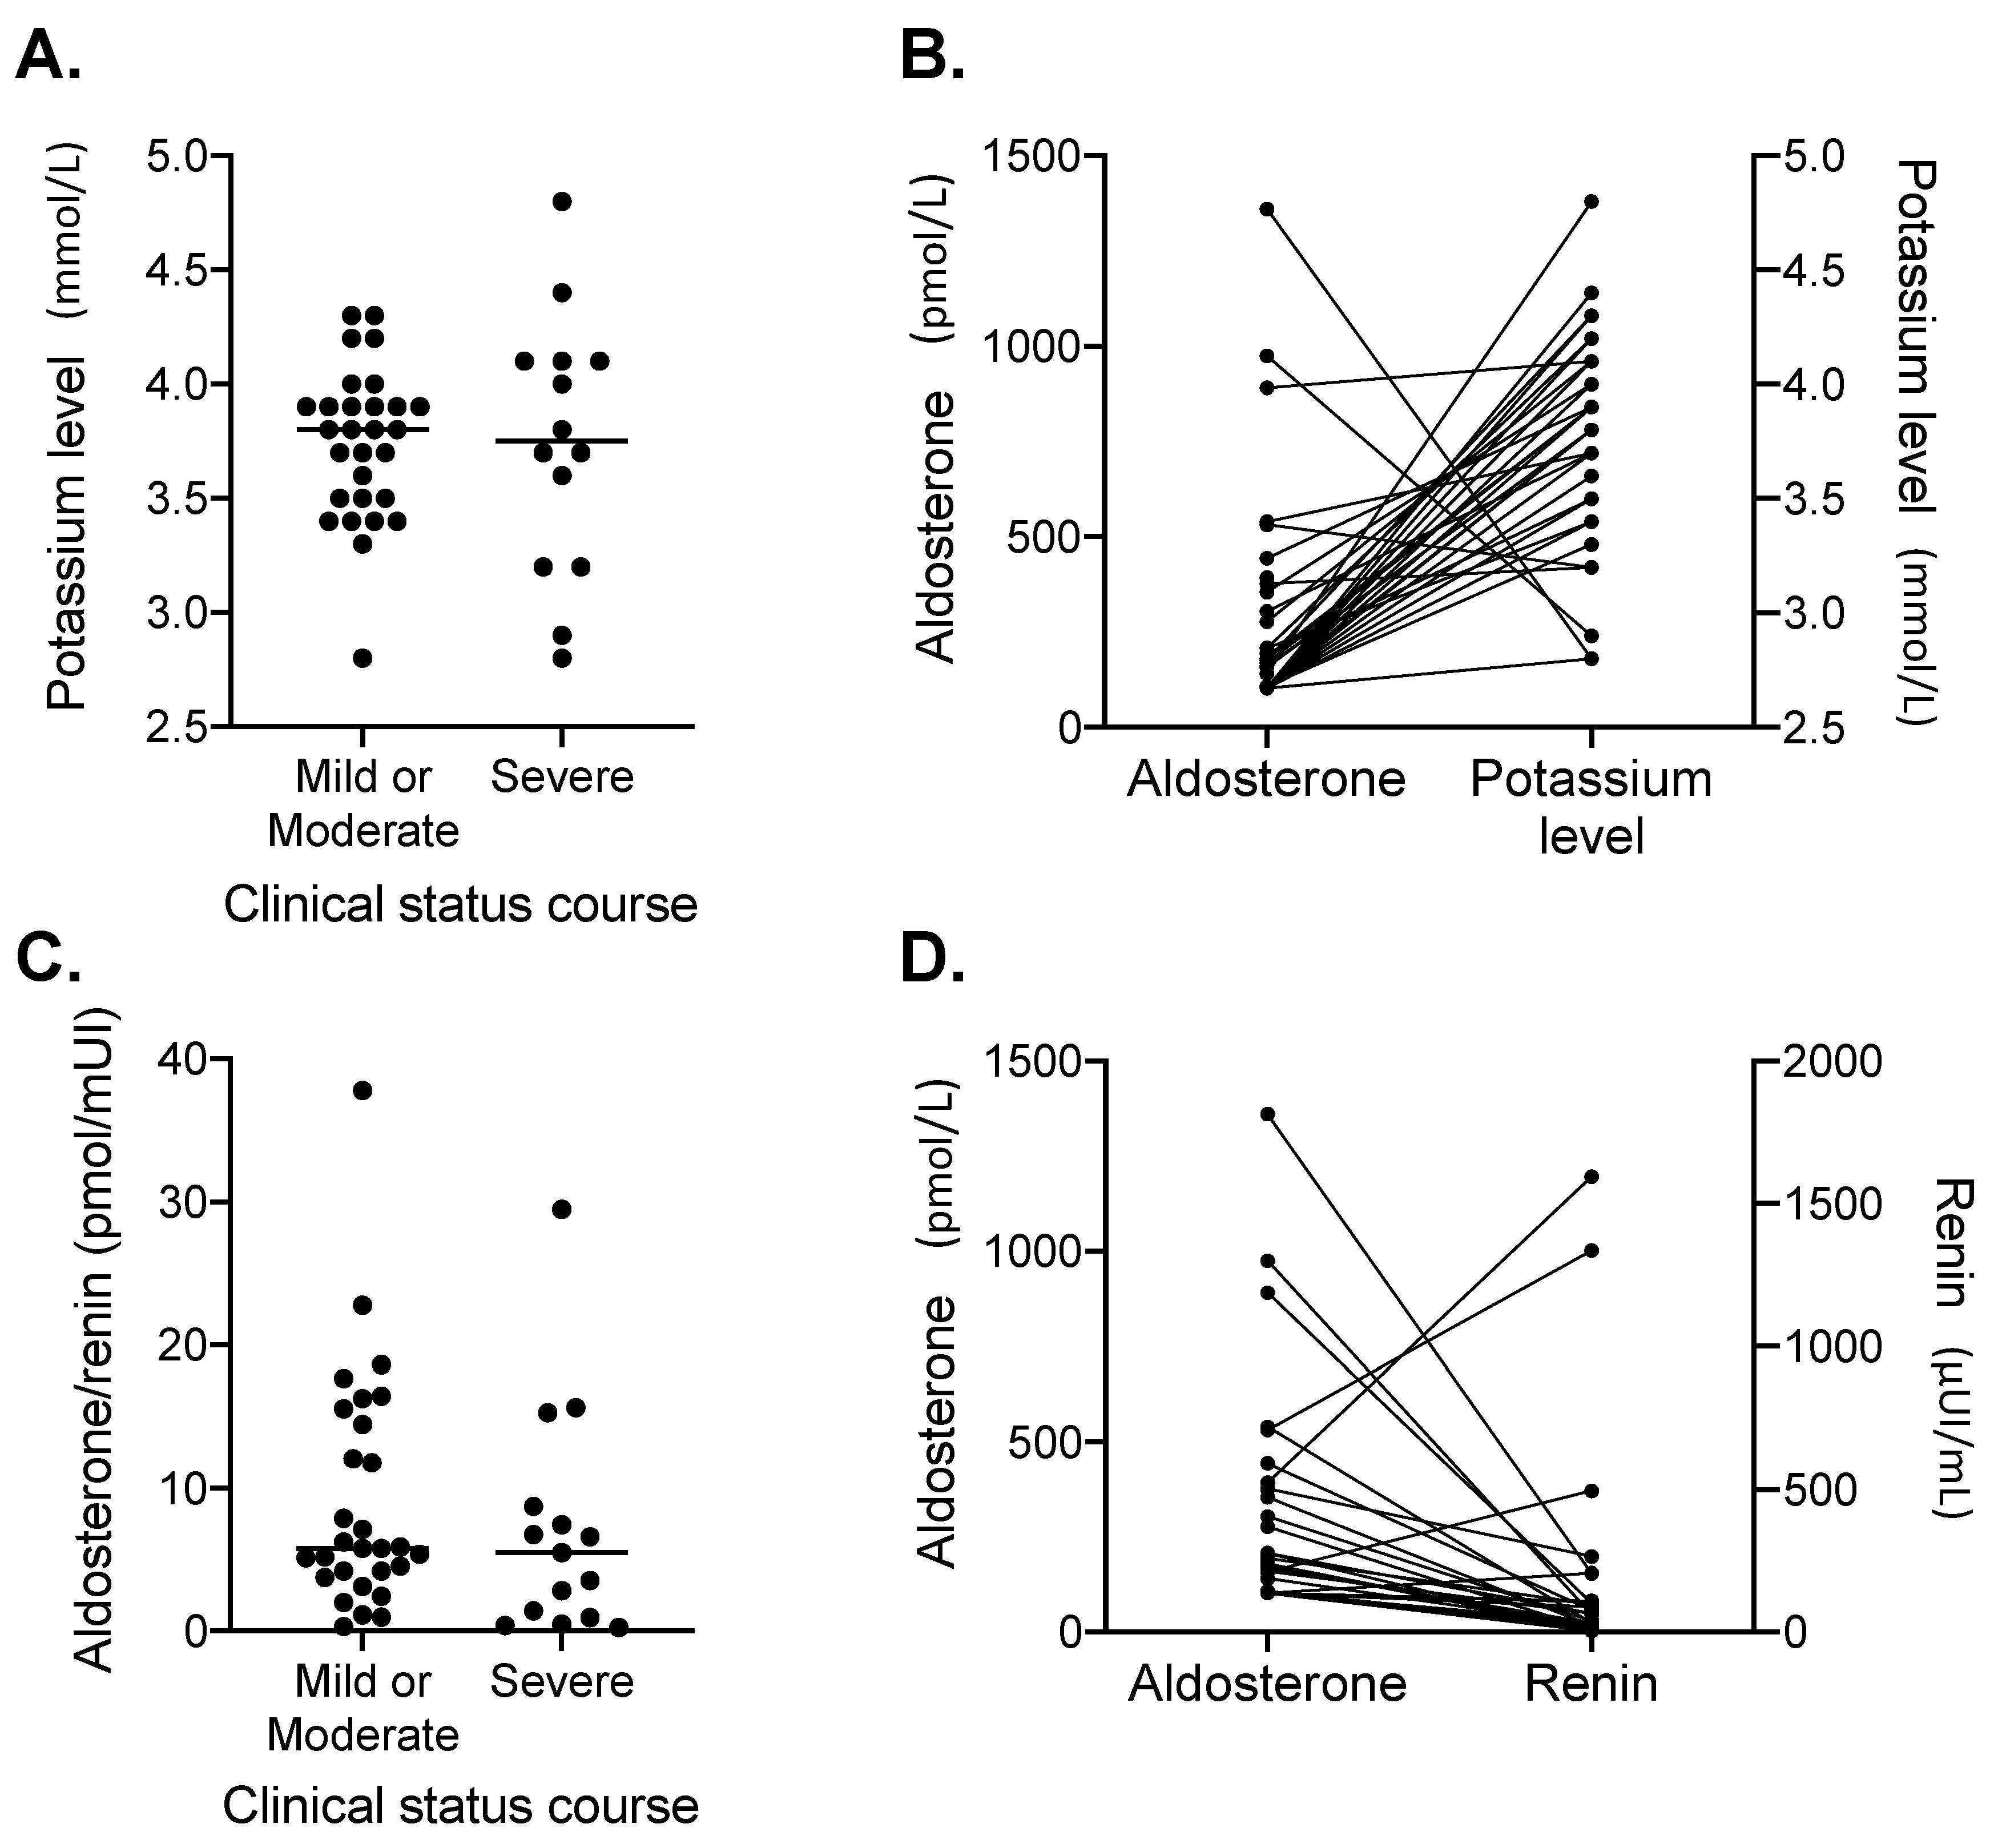
| Potassium level median (min-max)—mmol/L | 43 | 3.8 (2.8–4.8) | 3.8 (2.8–4.3) | 3.8 (2.8–4.8) | 3.8 (2.8; 4.8) | 0.99 2 |
| Creatinine median (min-max)—µmol/L | 44 | 74.5 (34–949) | 71 (34–949) | 100 (40–524) | 28 (5; 54) | 0.02 1 |
| eGFR median (min-max) —mL/min/1.73 m2 | 44 | 87.5 (3–120) | 91 (3–120) | 59 (9–120) | −26 (−50; 0) | 0.05 1 |
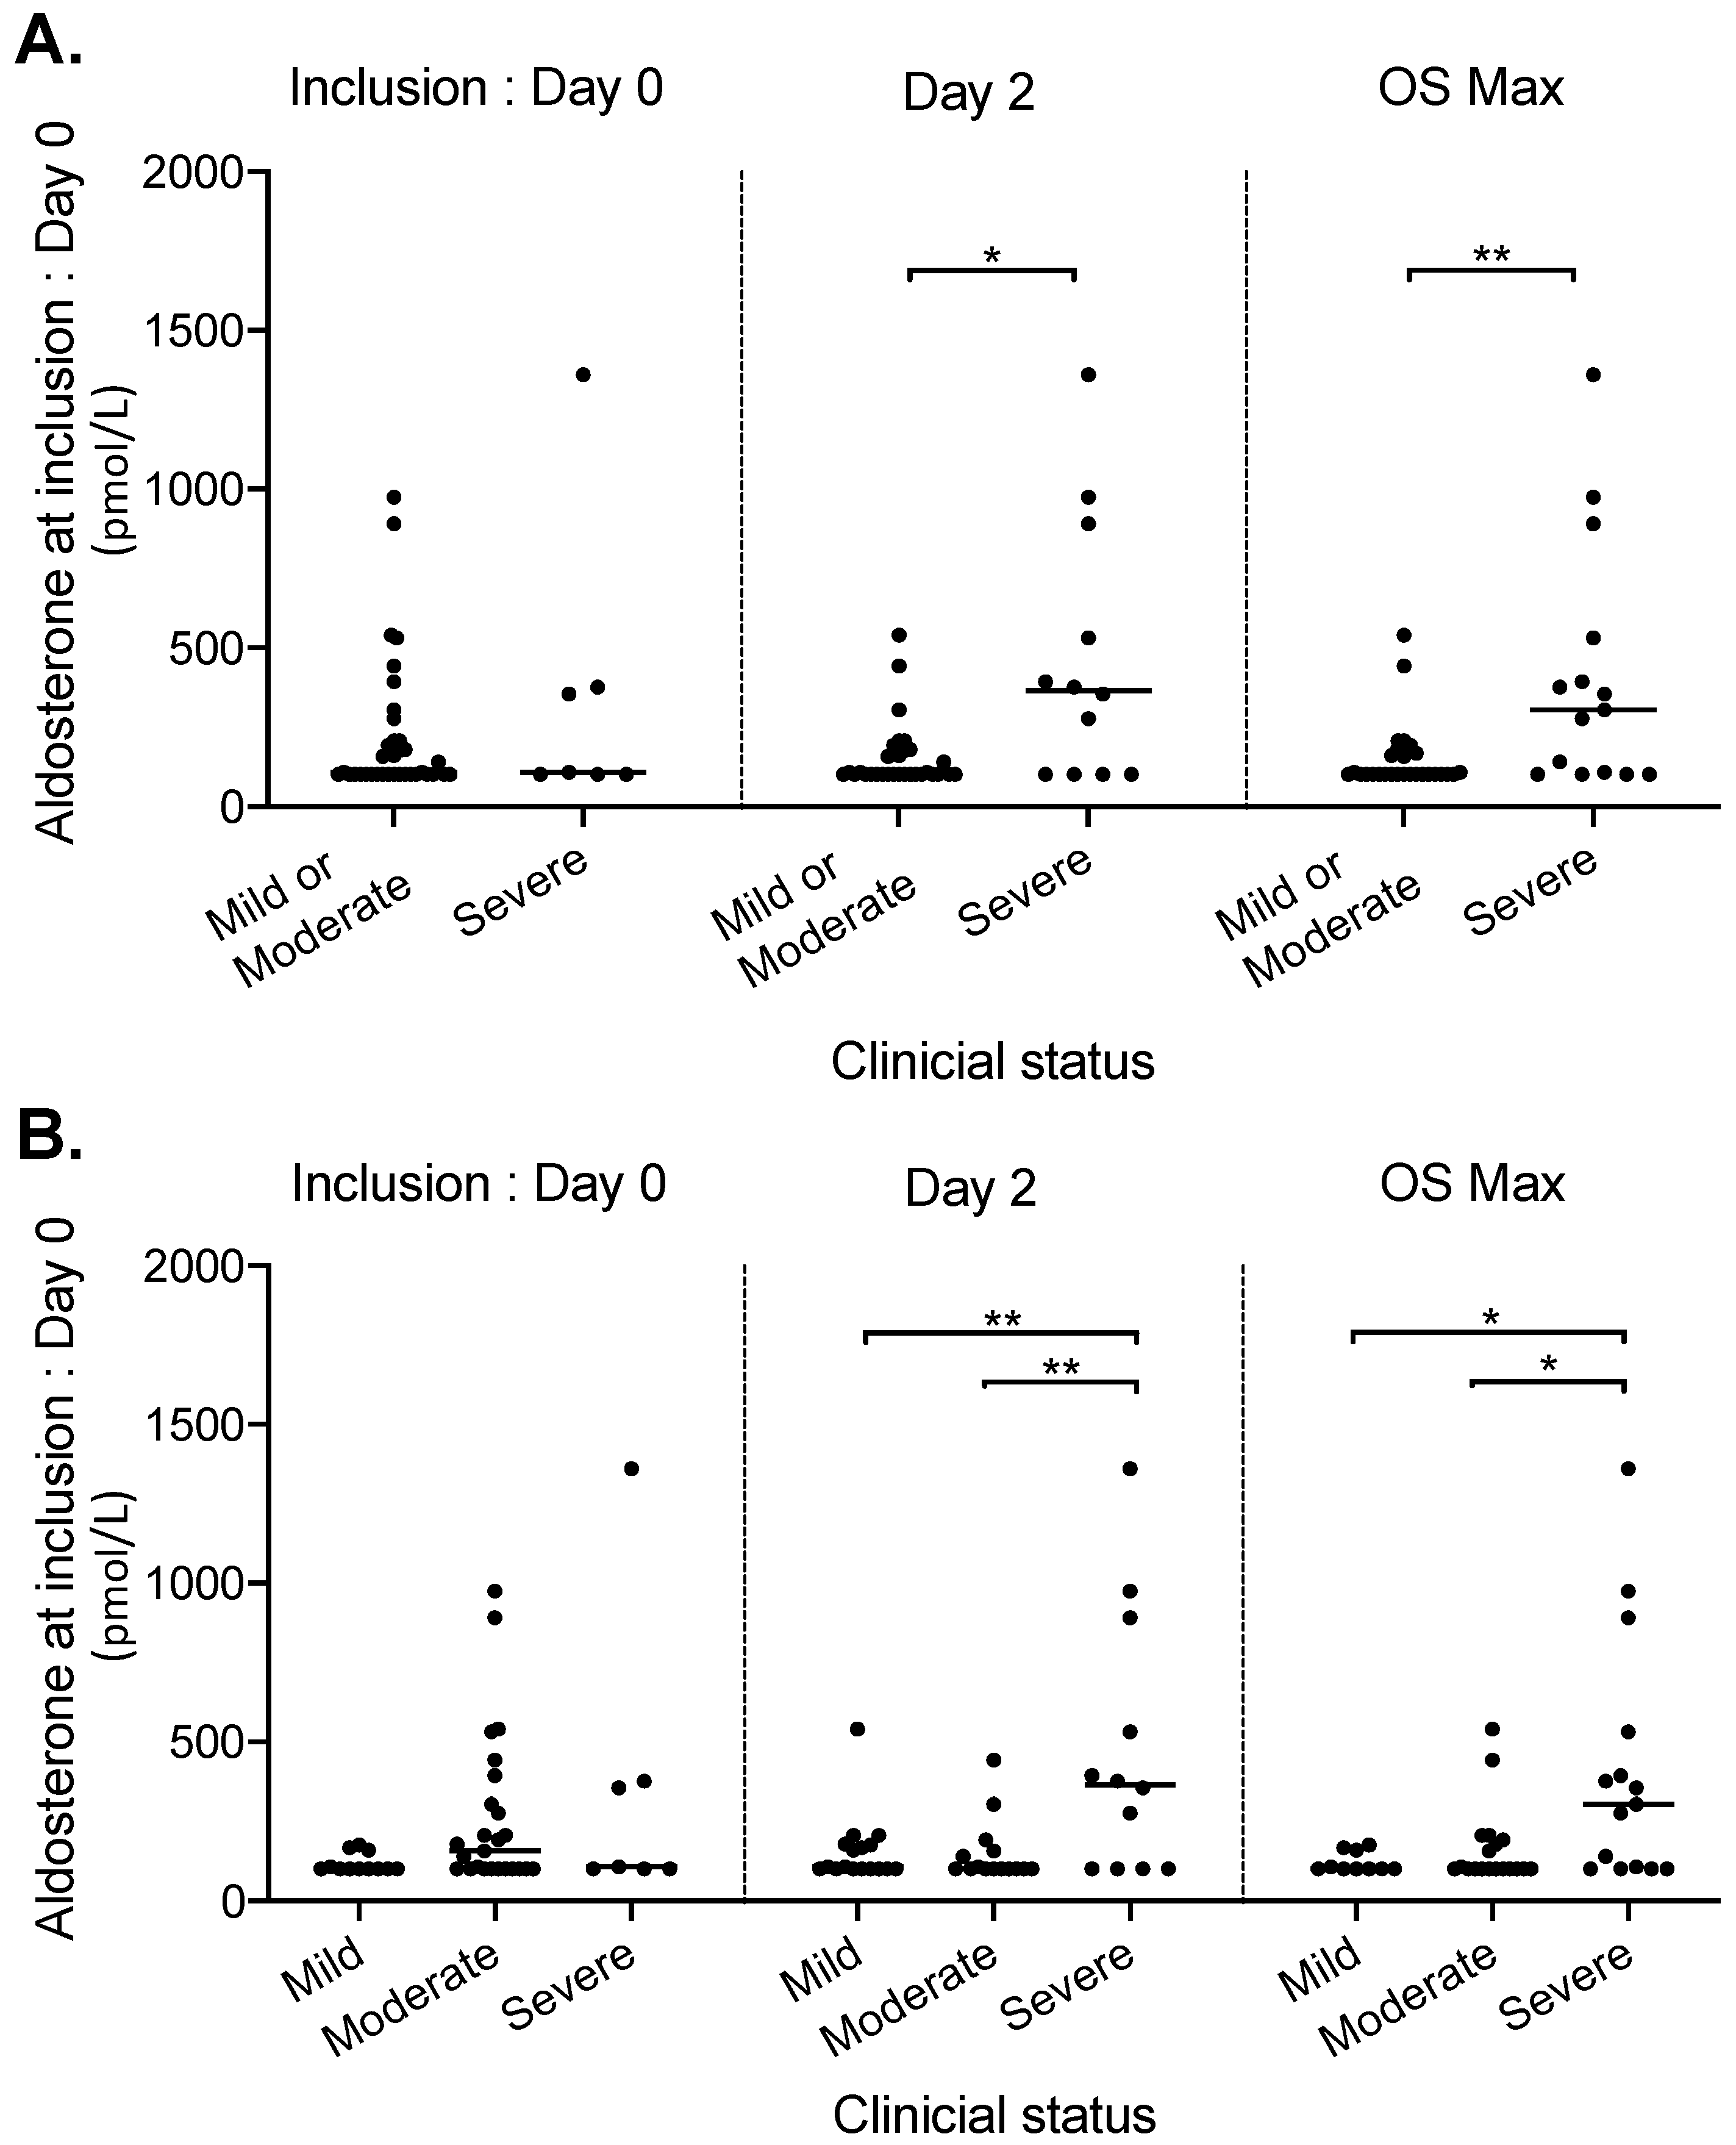
| Aldosterone median (min-max) – pmol/L | 44 | 108 (102.5–1360.1) | 102.5 (102.5–540.2) | 304.7 (102.5–1360.1) | 174.5 (0; 274.2) | <0.01 1 |
| Renin median (min-max) – µui/mL | 44 | 25.8 (4.5– 1594) | 19.00 (4.5–495.4) | 62.4 (9.4–1594) | 32.4 (9.2; 116.9) | <0.01 1 |
| Cortisol median (min-max) – nmol/mL | 34 | 471.8 (110.9–1320.8) | 495.2 (110.9–933.2) | 377.5 (115.6–1320.8) | −91.8 (−259.4; 90.5) | 0.17 1 |
| ACTH median (min-max)– pmol/L | 36 | 3.3 (0.2–13.8) | 5.5 (0.2–13.8) | 1.7 (0.2–11.1) | −2.9 (−5.2; −0.3) | 0.6 1 |
© 2020 by the authors. Licensee MDPI, Basel, Switzerland. This article is an open access article distributed under the terms and conditions of the Creative Commons Attribution (CC BY) license (http://creativecommons.org/licenses/by/4.0/).
Share and Cite
Villard, O.; Morquin, D.; Molinari, N.; Raingeard, I.; Nagot, N.; Cristol, J.-P.; Jung, B.; Roubille, C.; Foulongne, V.; Fesler, P.; et al. The Plasmatic Aldosterone and C-Reactive Protein Levels, and the Severity of Covid-19: The Dyhor-19 Study. J. Clin. Med. 2020, 9, 2315. https://doi.org/10.3390/jcm9072315
Villard O, Morquin D, Molinari N, Raingeard I, Nagot N, Cristol J-P, Jung B, Roubille C, Foulongne V, Fesler P, et al. The Plasmatic Aldosterone and C-Reactive Protein Levels, and the Severity of Covid-19: The Dyhor-19 Study. Journal of Clinical Medicine. 2020; 9(7):2315. https://doi.org/10.3390/jcm9072315
Chicago/Turabian StyleVillard, Orianne, David Morquin, Nicolas Molinari, Isabelle Raingeard, Nicolas Nagot, Jean-Paul Cristol, Boris Jung, Camille Roubille, Vincent Foulongne, Pierre Fesler, and et al. 2020. "The Plasmatic Aldosterone and C-Reactive Protein Levels, and the Severity of Covid-19: The Dyhor-19 Study" Journal of Clinical Medicine 9, no. 7: 2315. https://doi.org/10.3390/jcm9072315