A Microfluidic Diagnostic Device Capable of Autonomous Sample Mixing and Dispensing for the Simultaneous Genetic Detection of Multiple Plant Viruses

 and
and 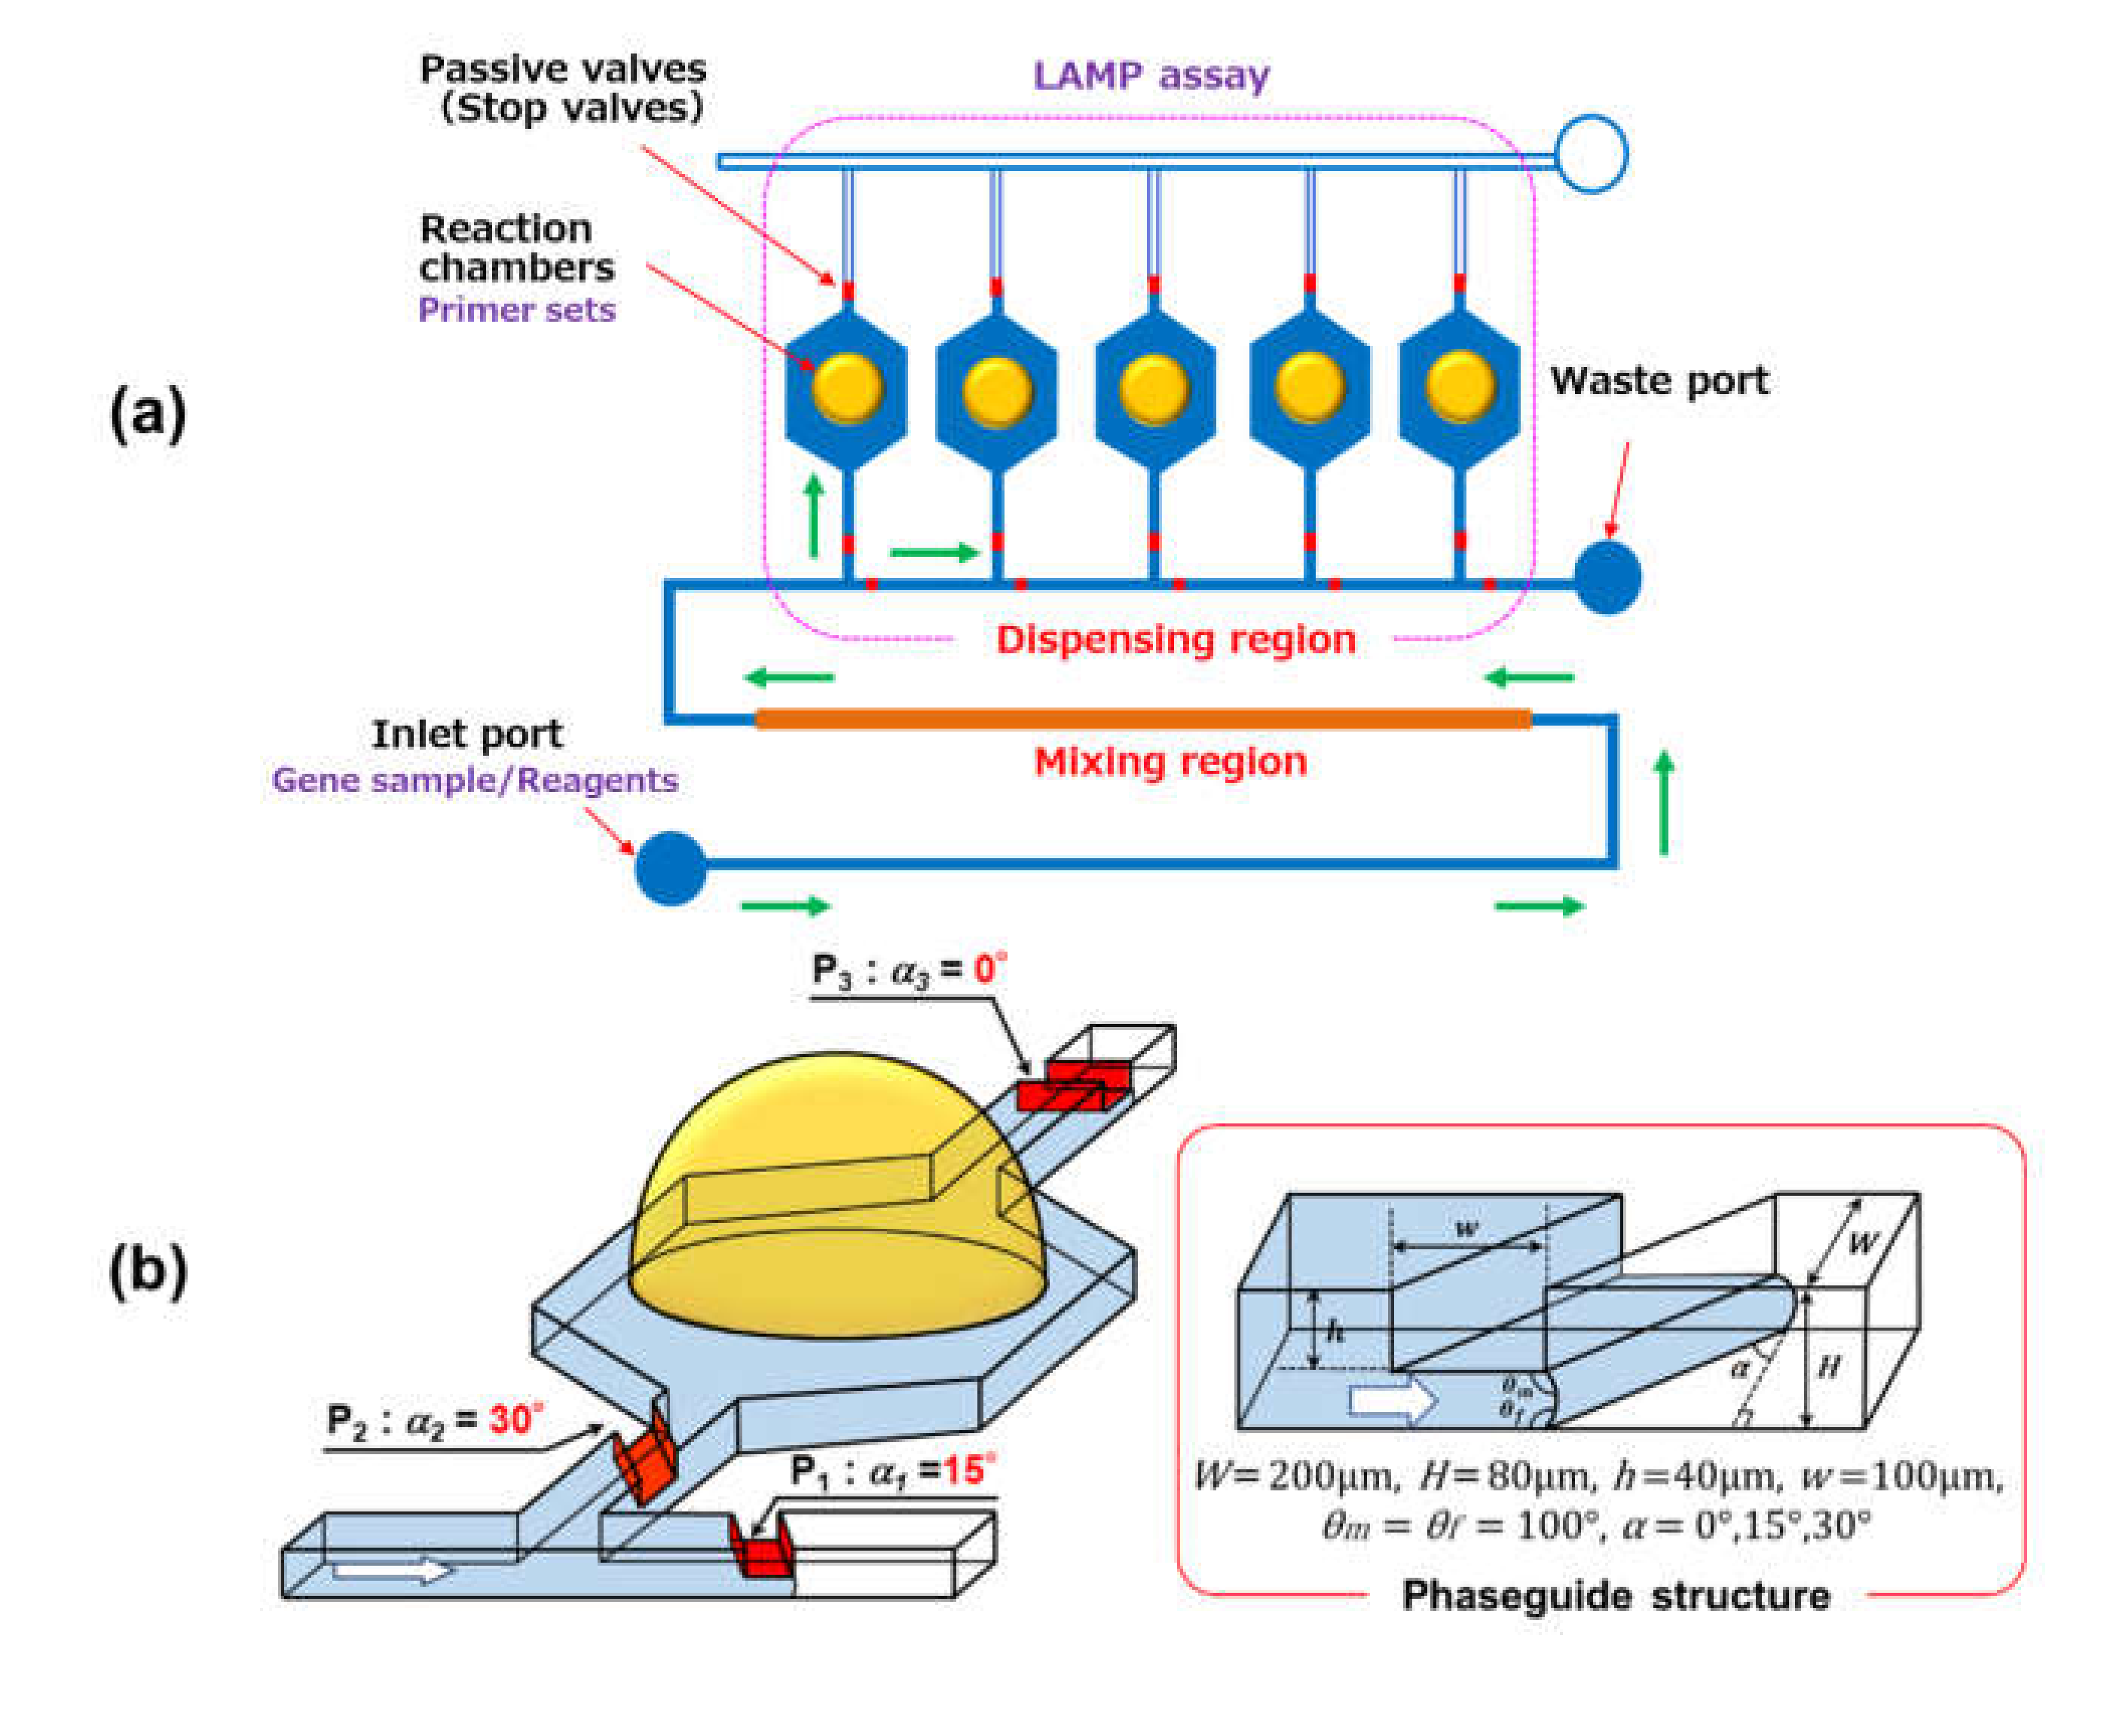
Abstract
:1. Introduction
2. Materials and Methods
2.1. Design of the Multiplex Genetic Diagnostic Device
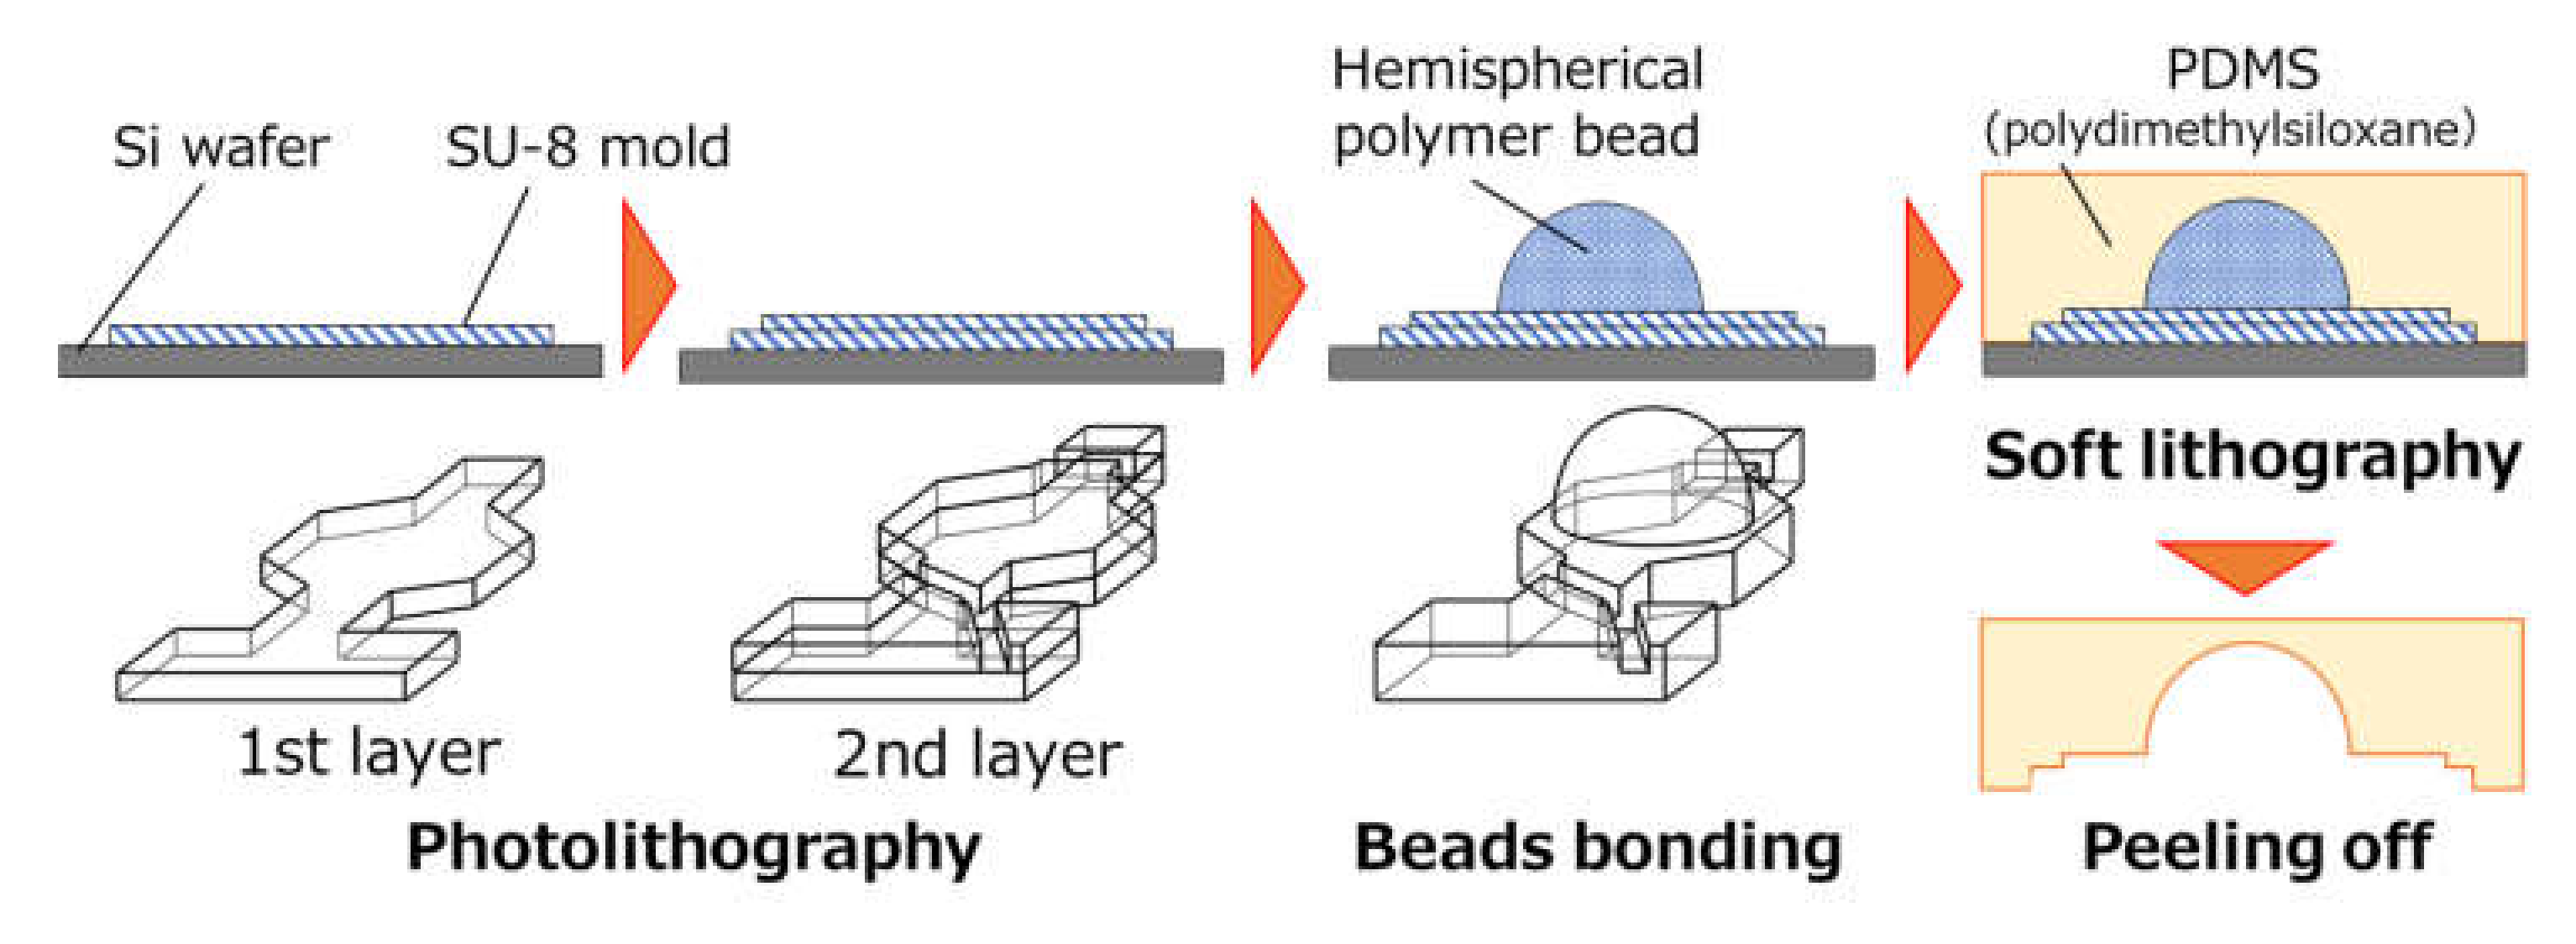
2.2. Fabrication Process of the Microfluidic Diagnostic Device
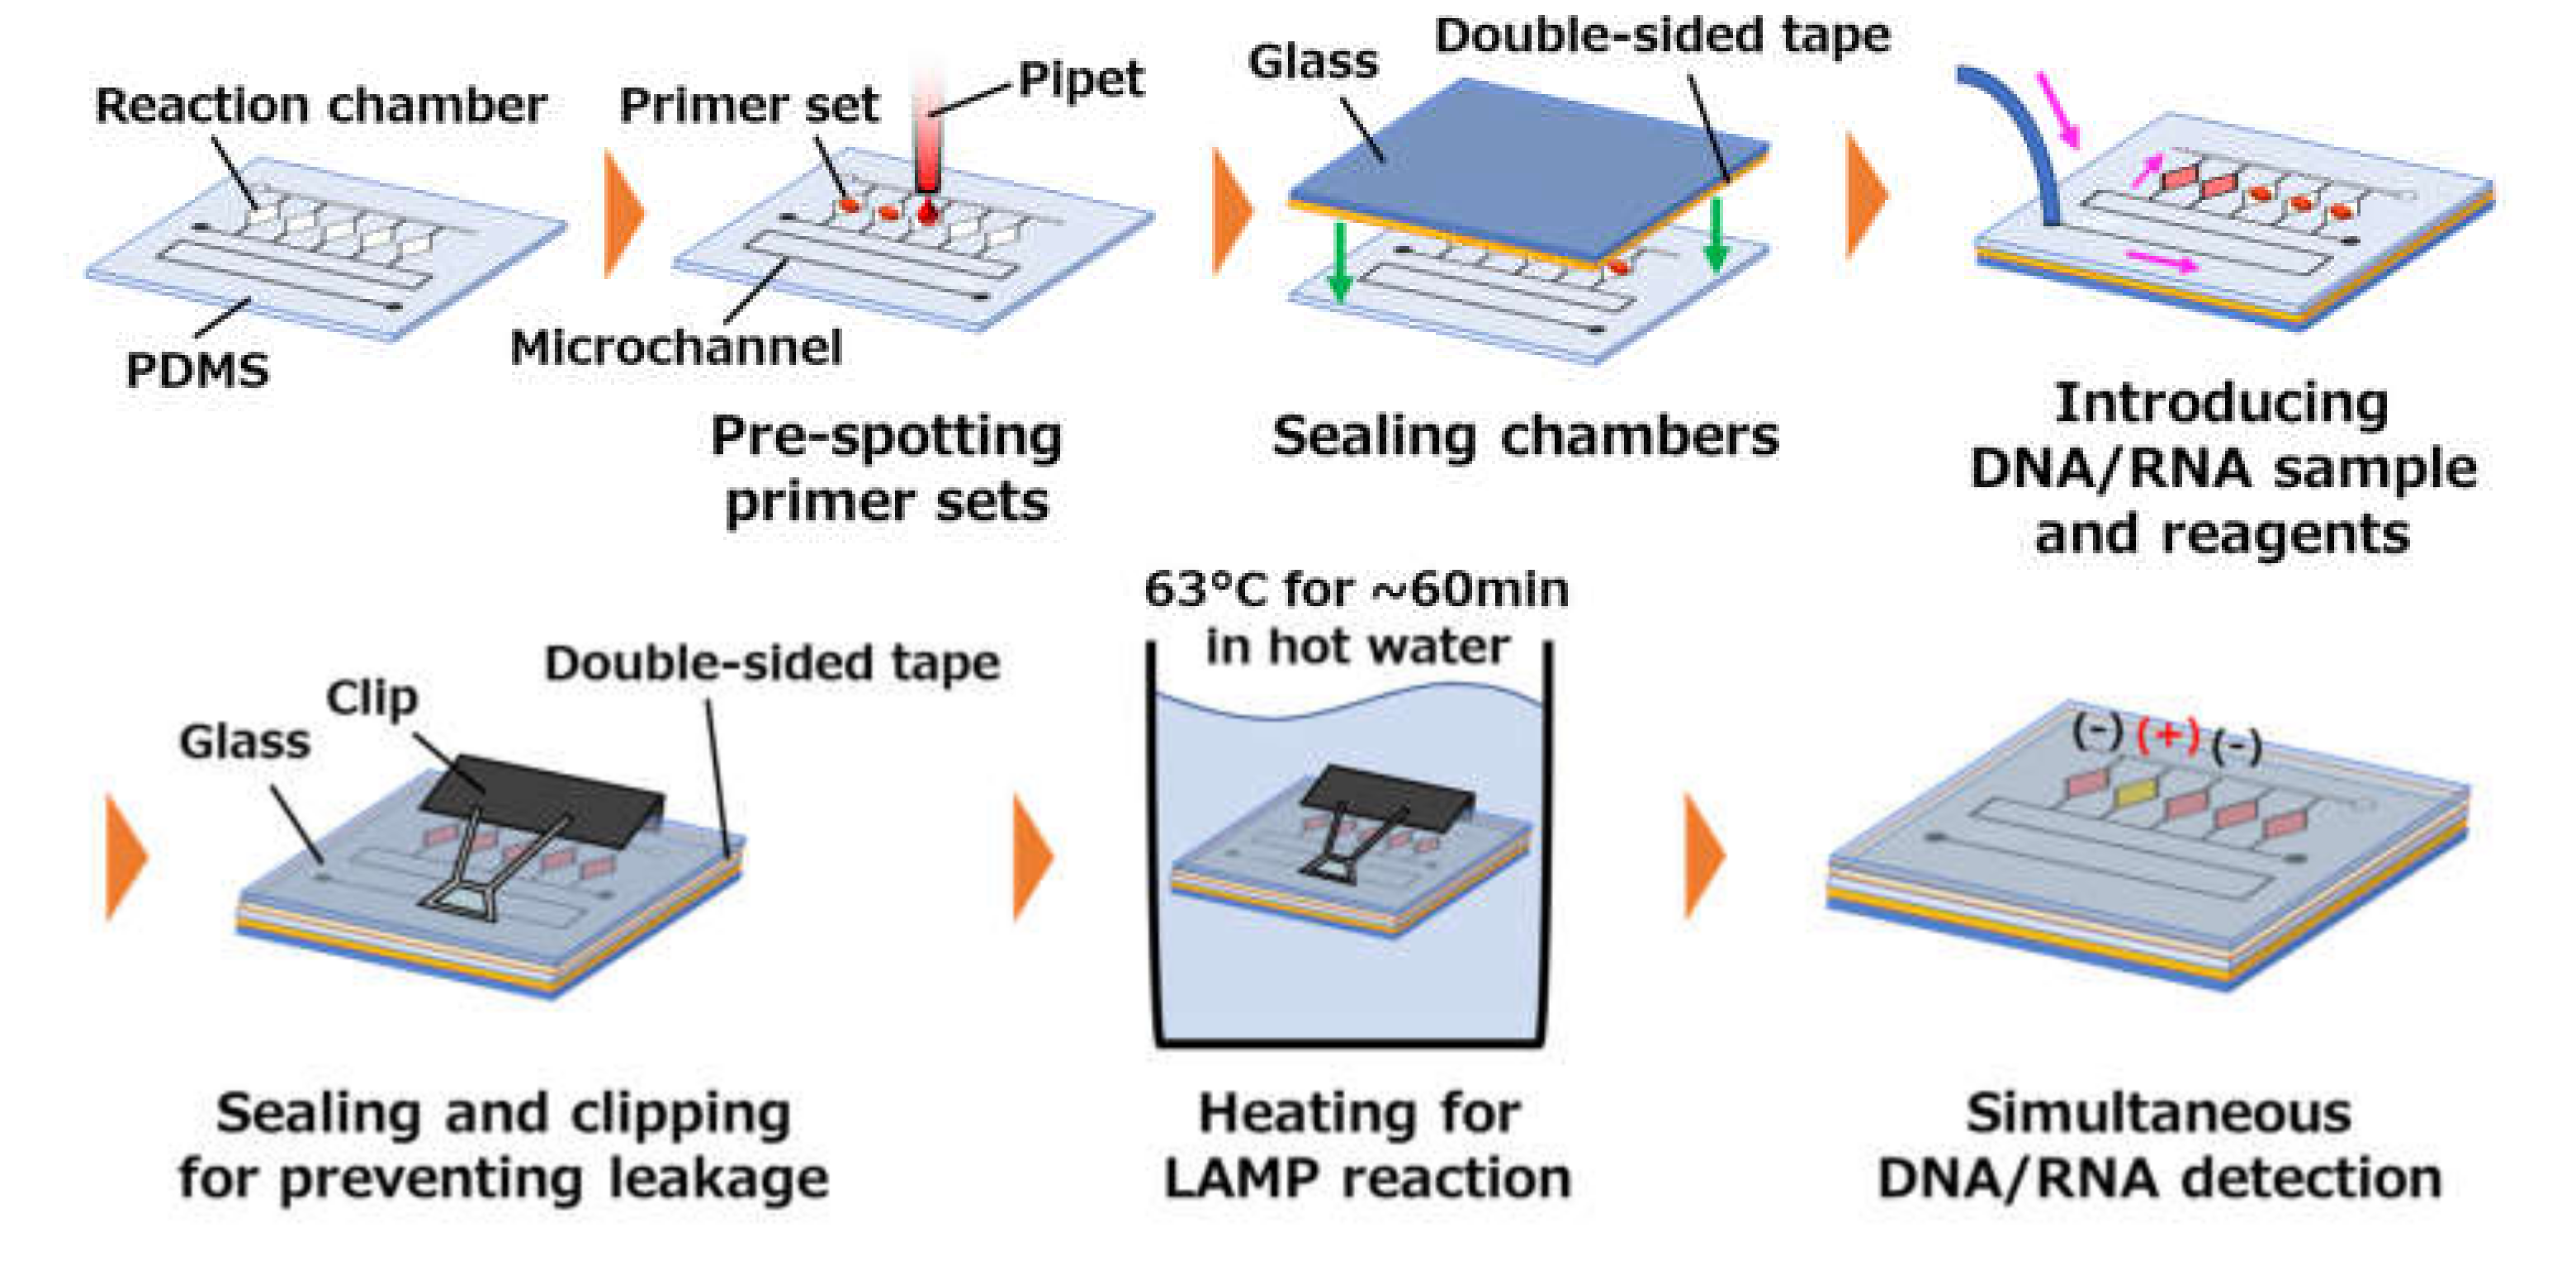
2.3. Operating Procedure for the Multiplex LAMP Assay in Microfluidic Diagnostic Devices
3. Results and Discussion
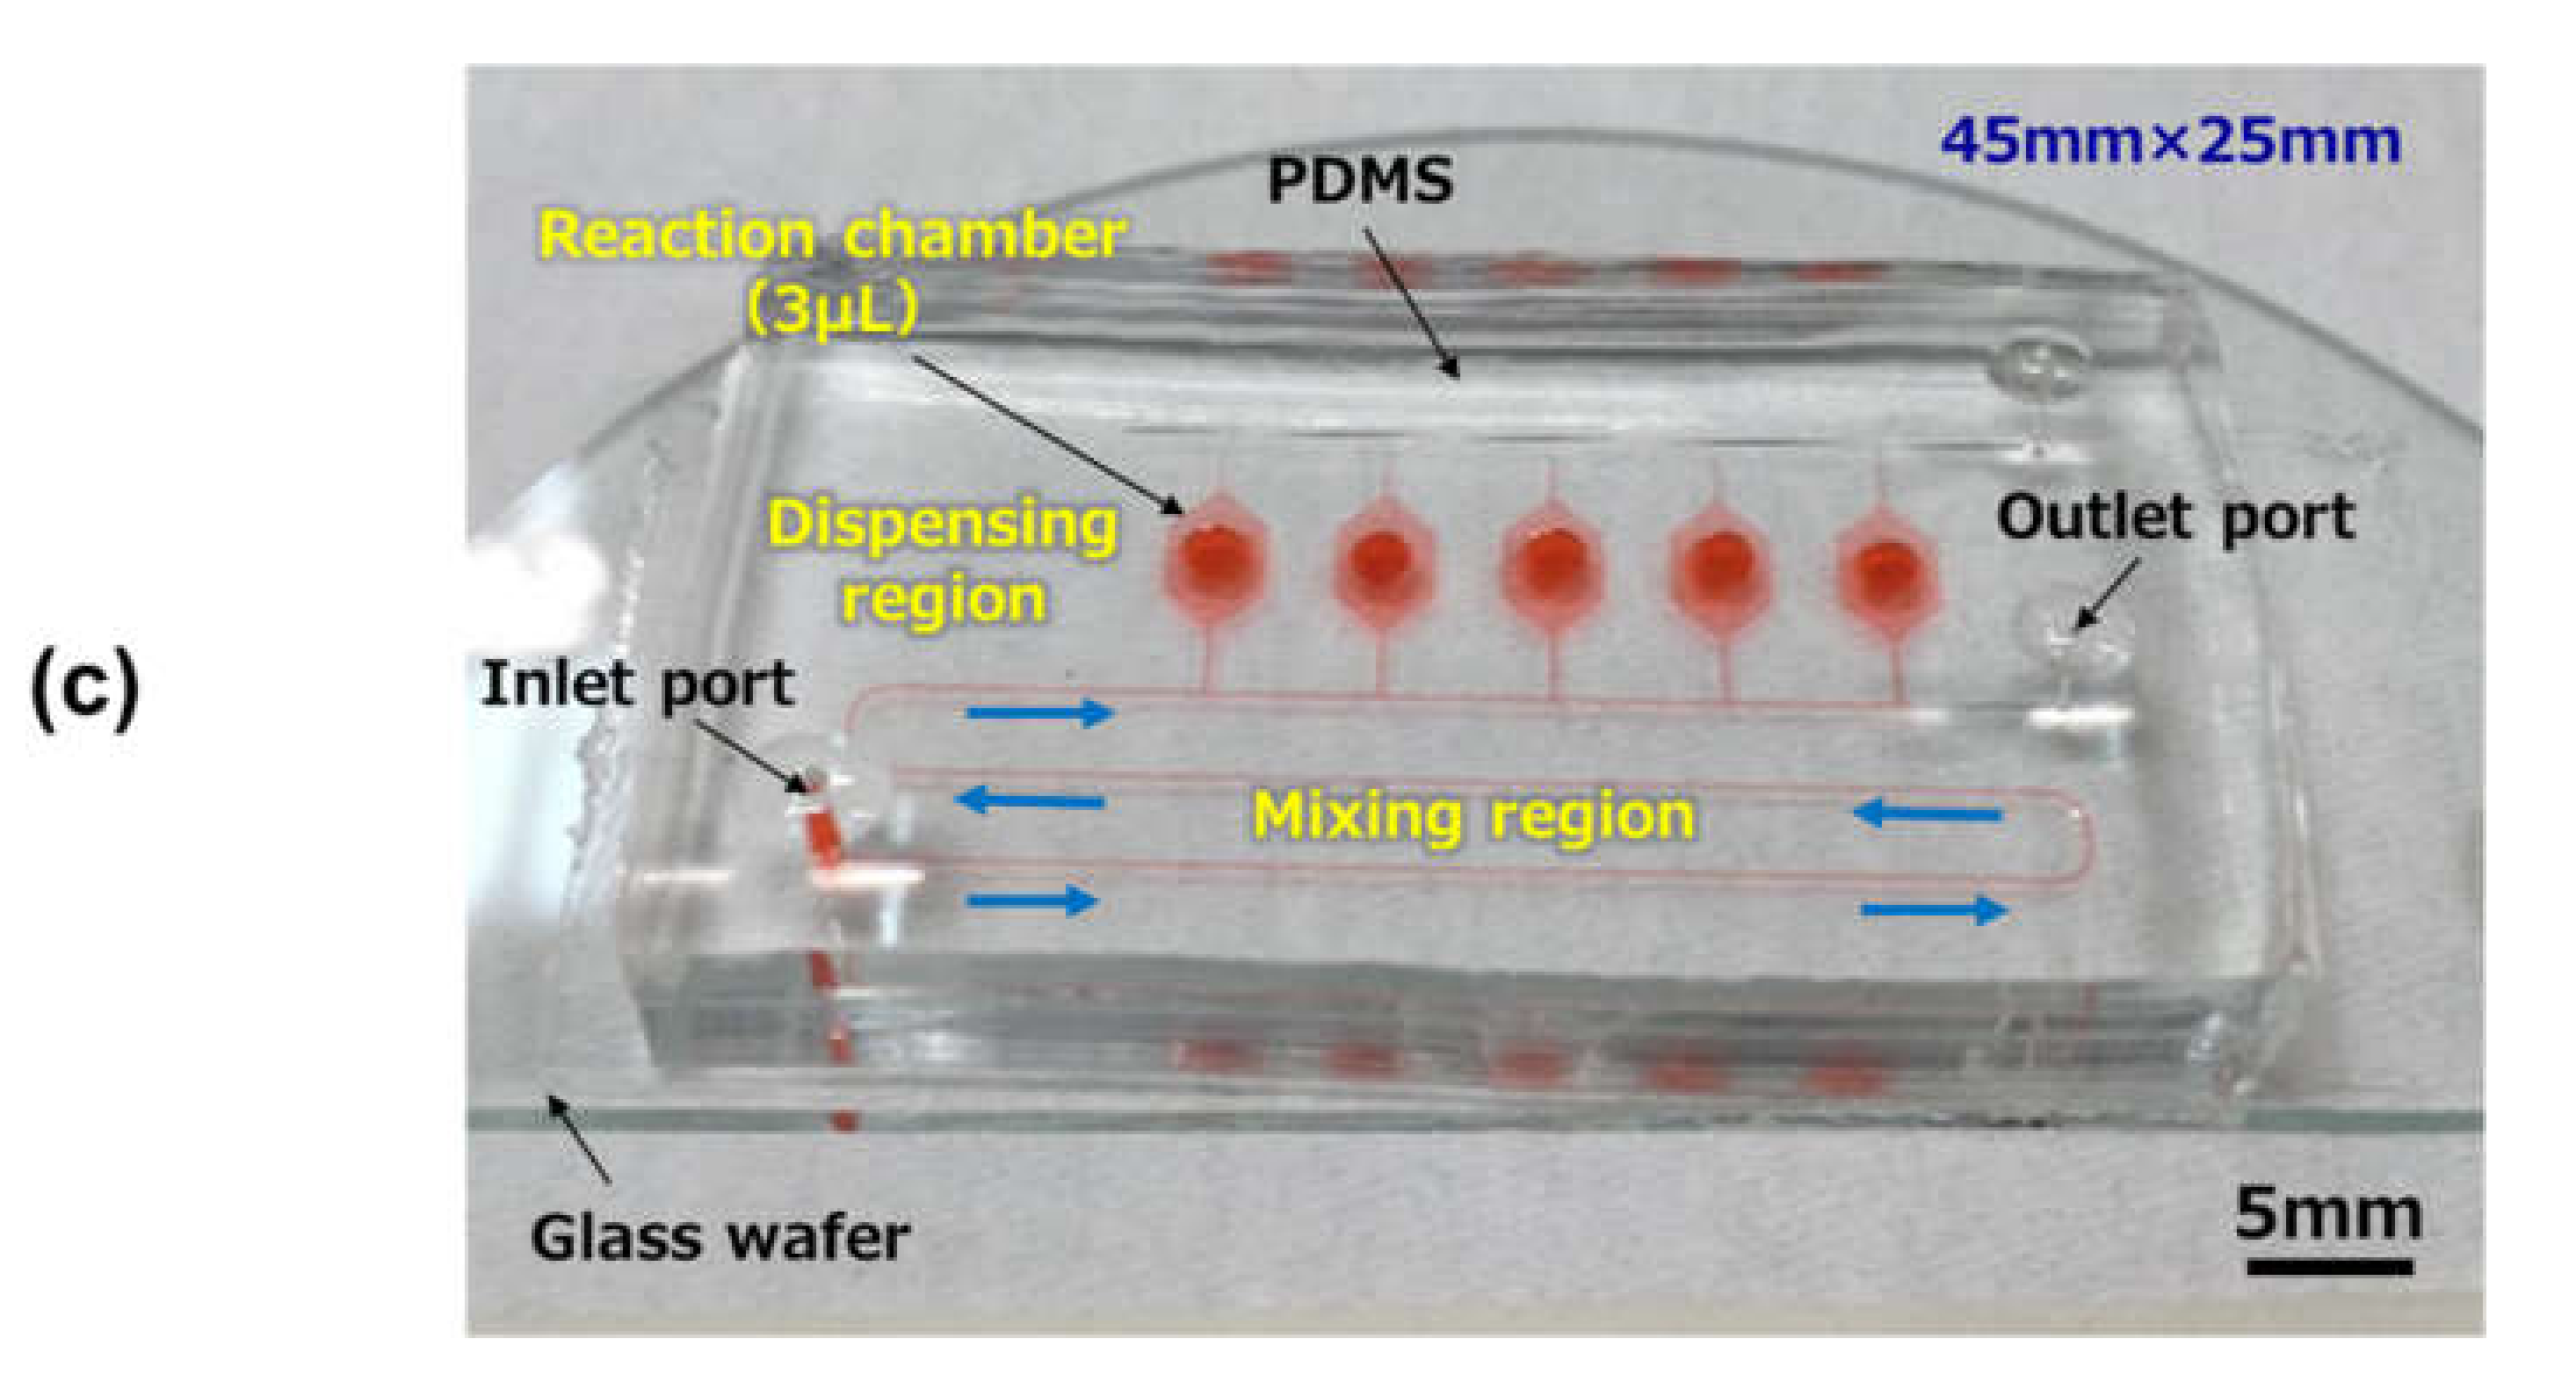
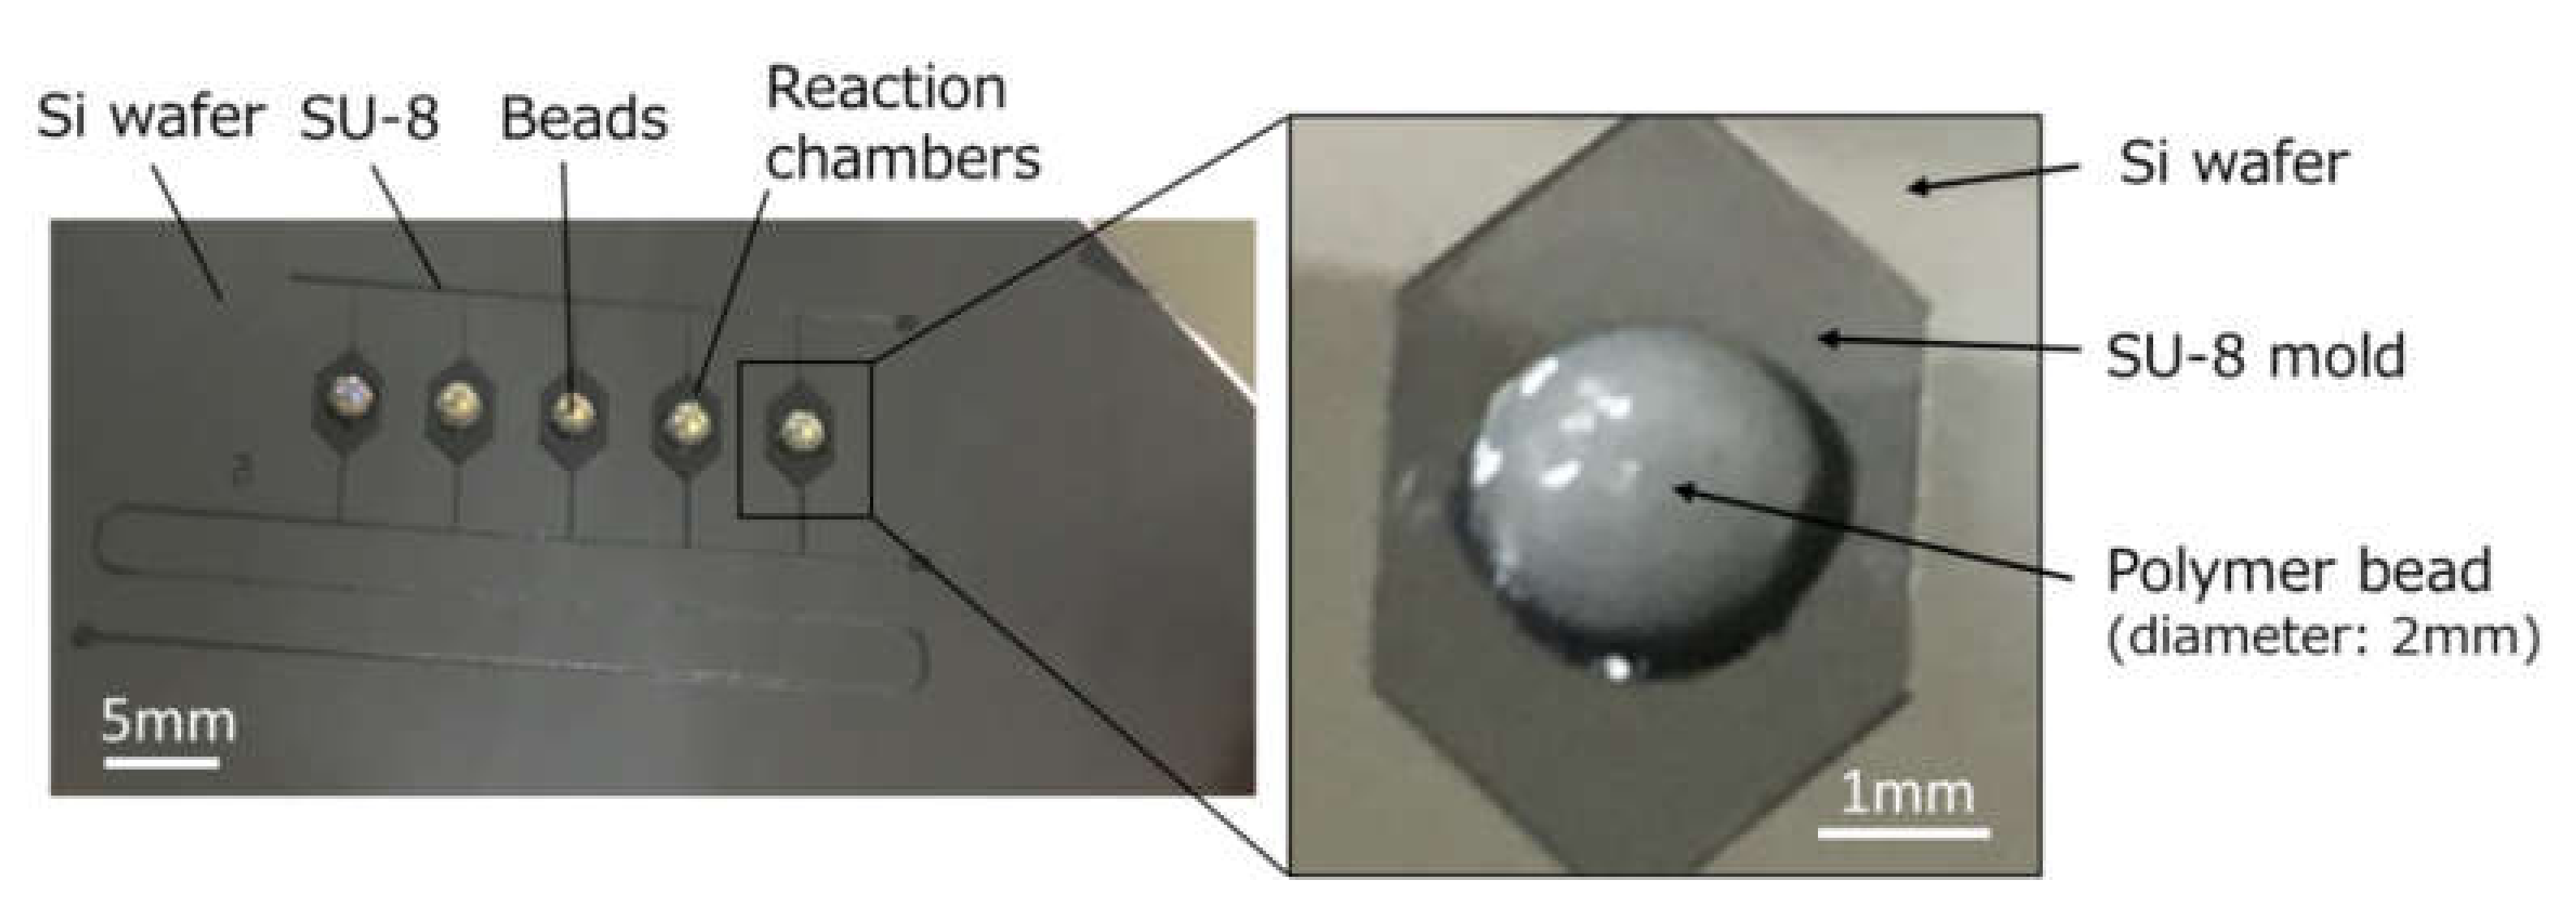
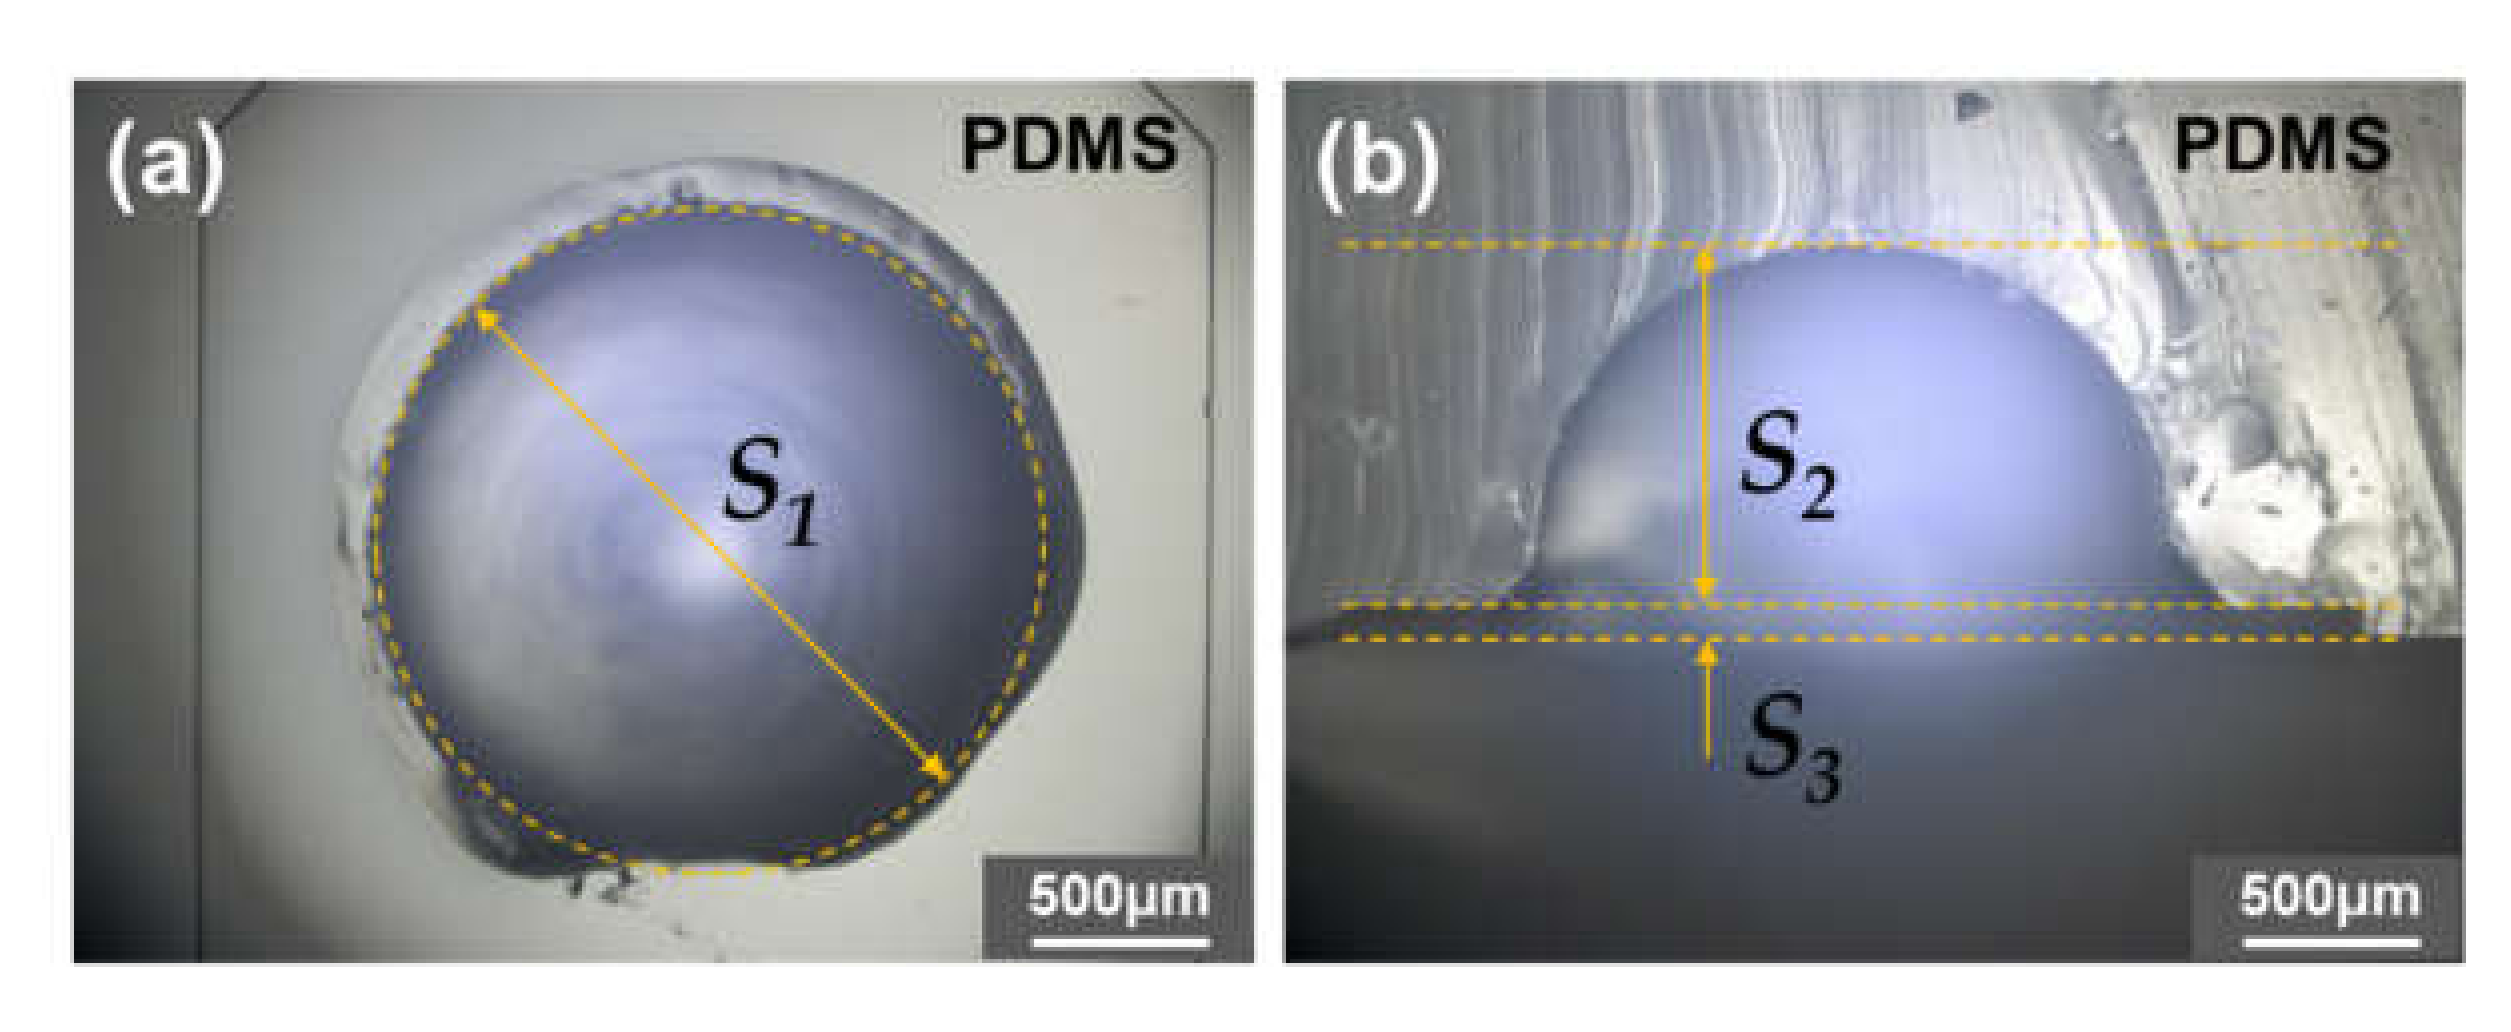
3.1. Fabrication of the Microfluidic Diagnostic Device
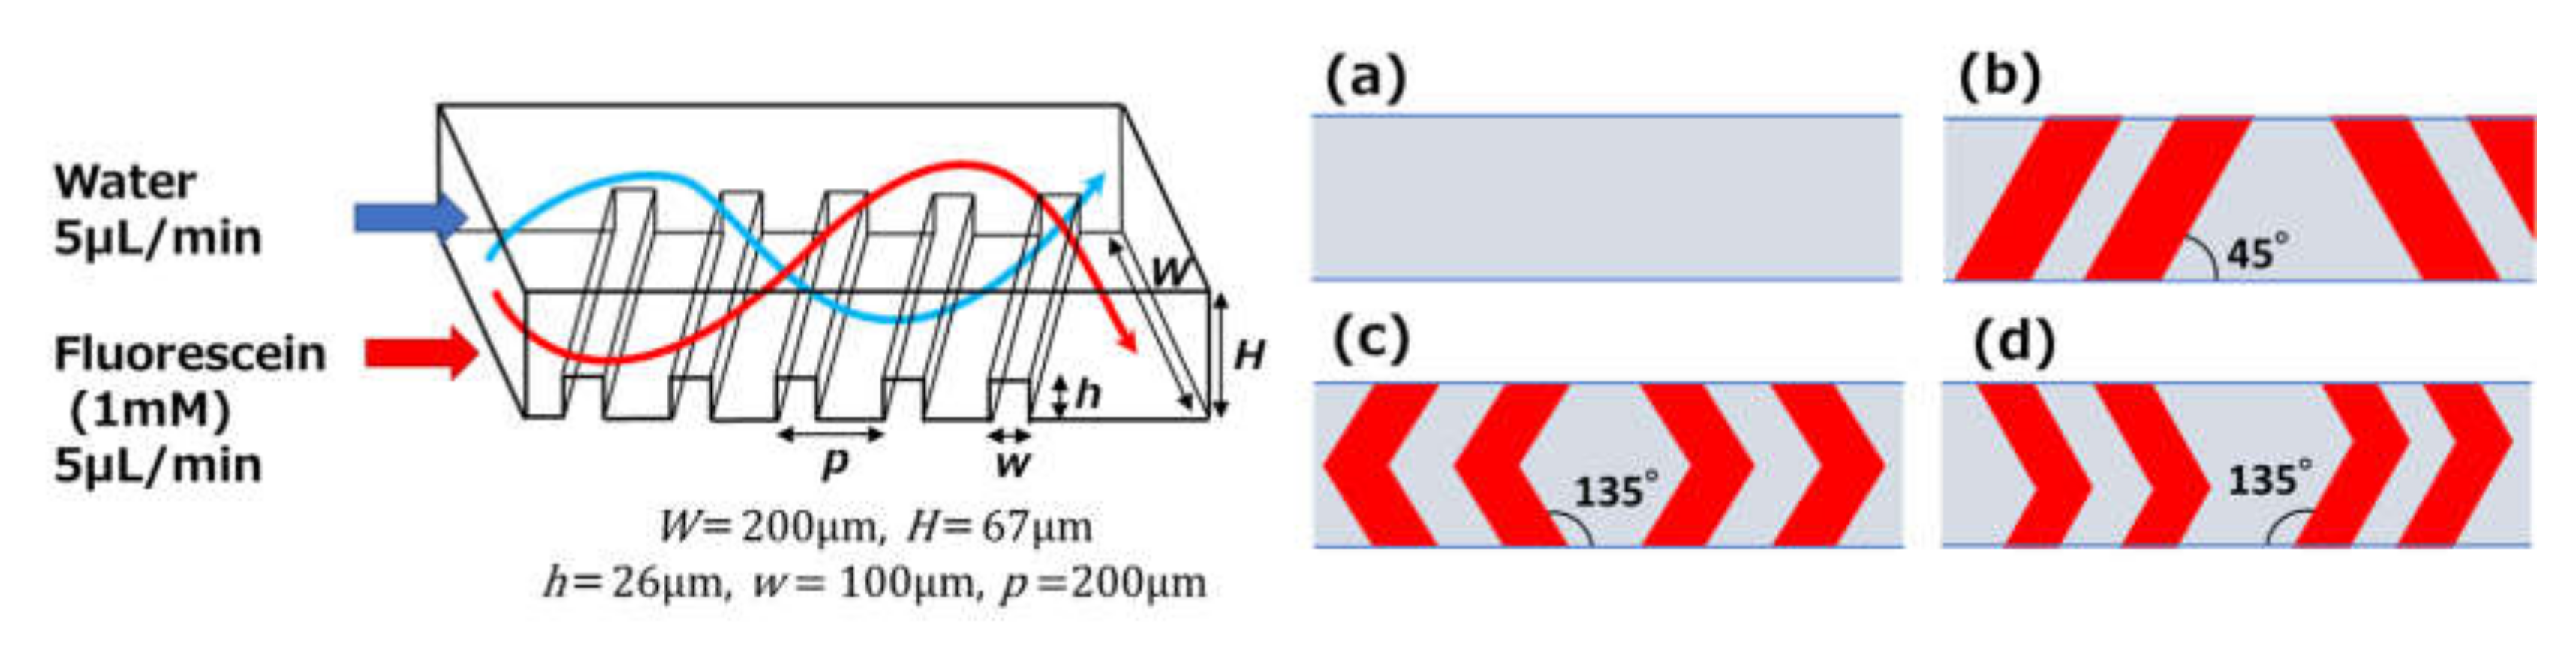
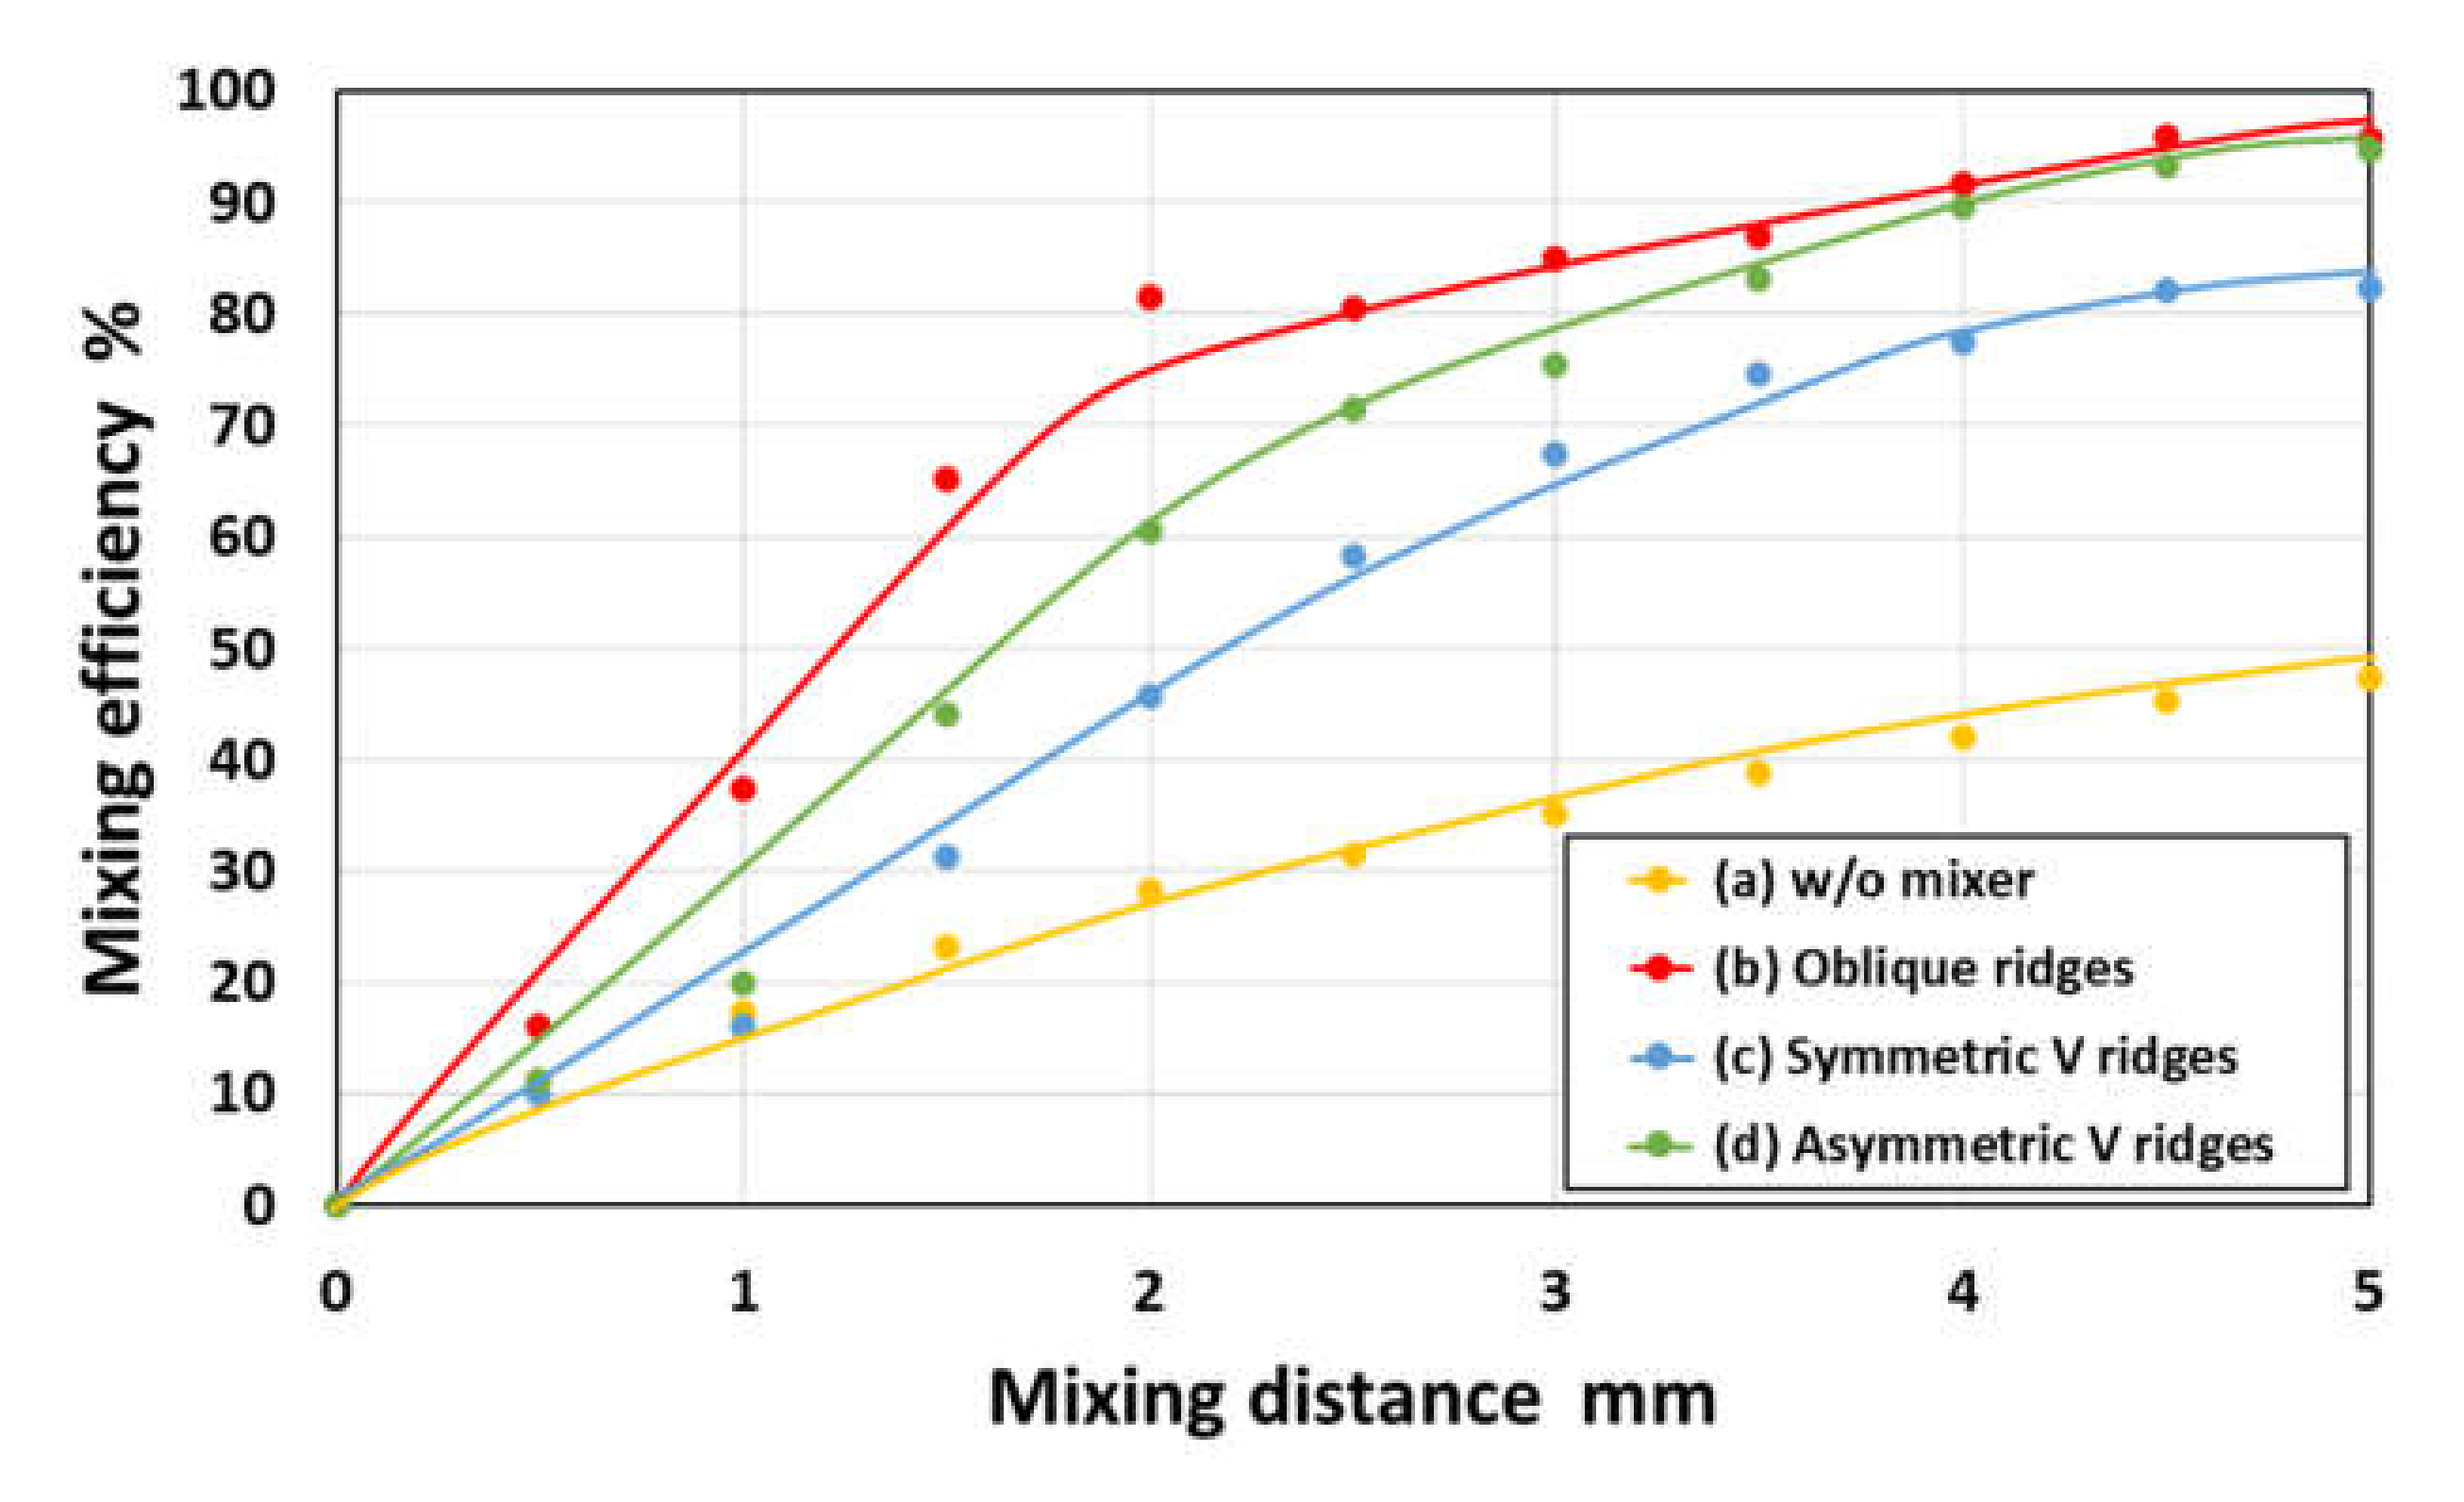
3.2. Evaluation of the Mixing Efficiency for Different Types of Chaotic Mixers
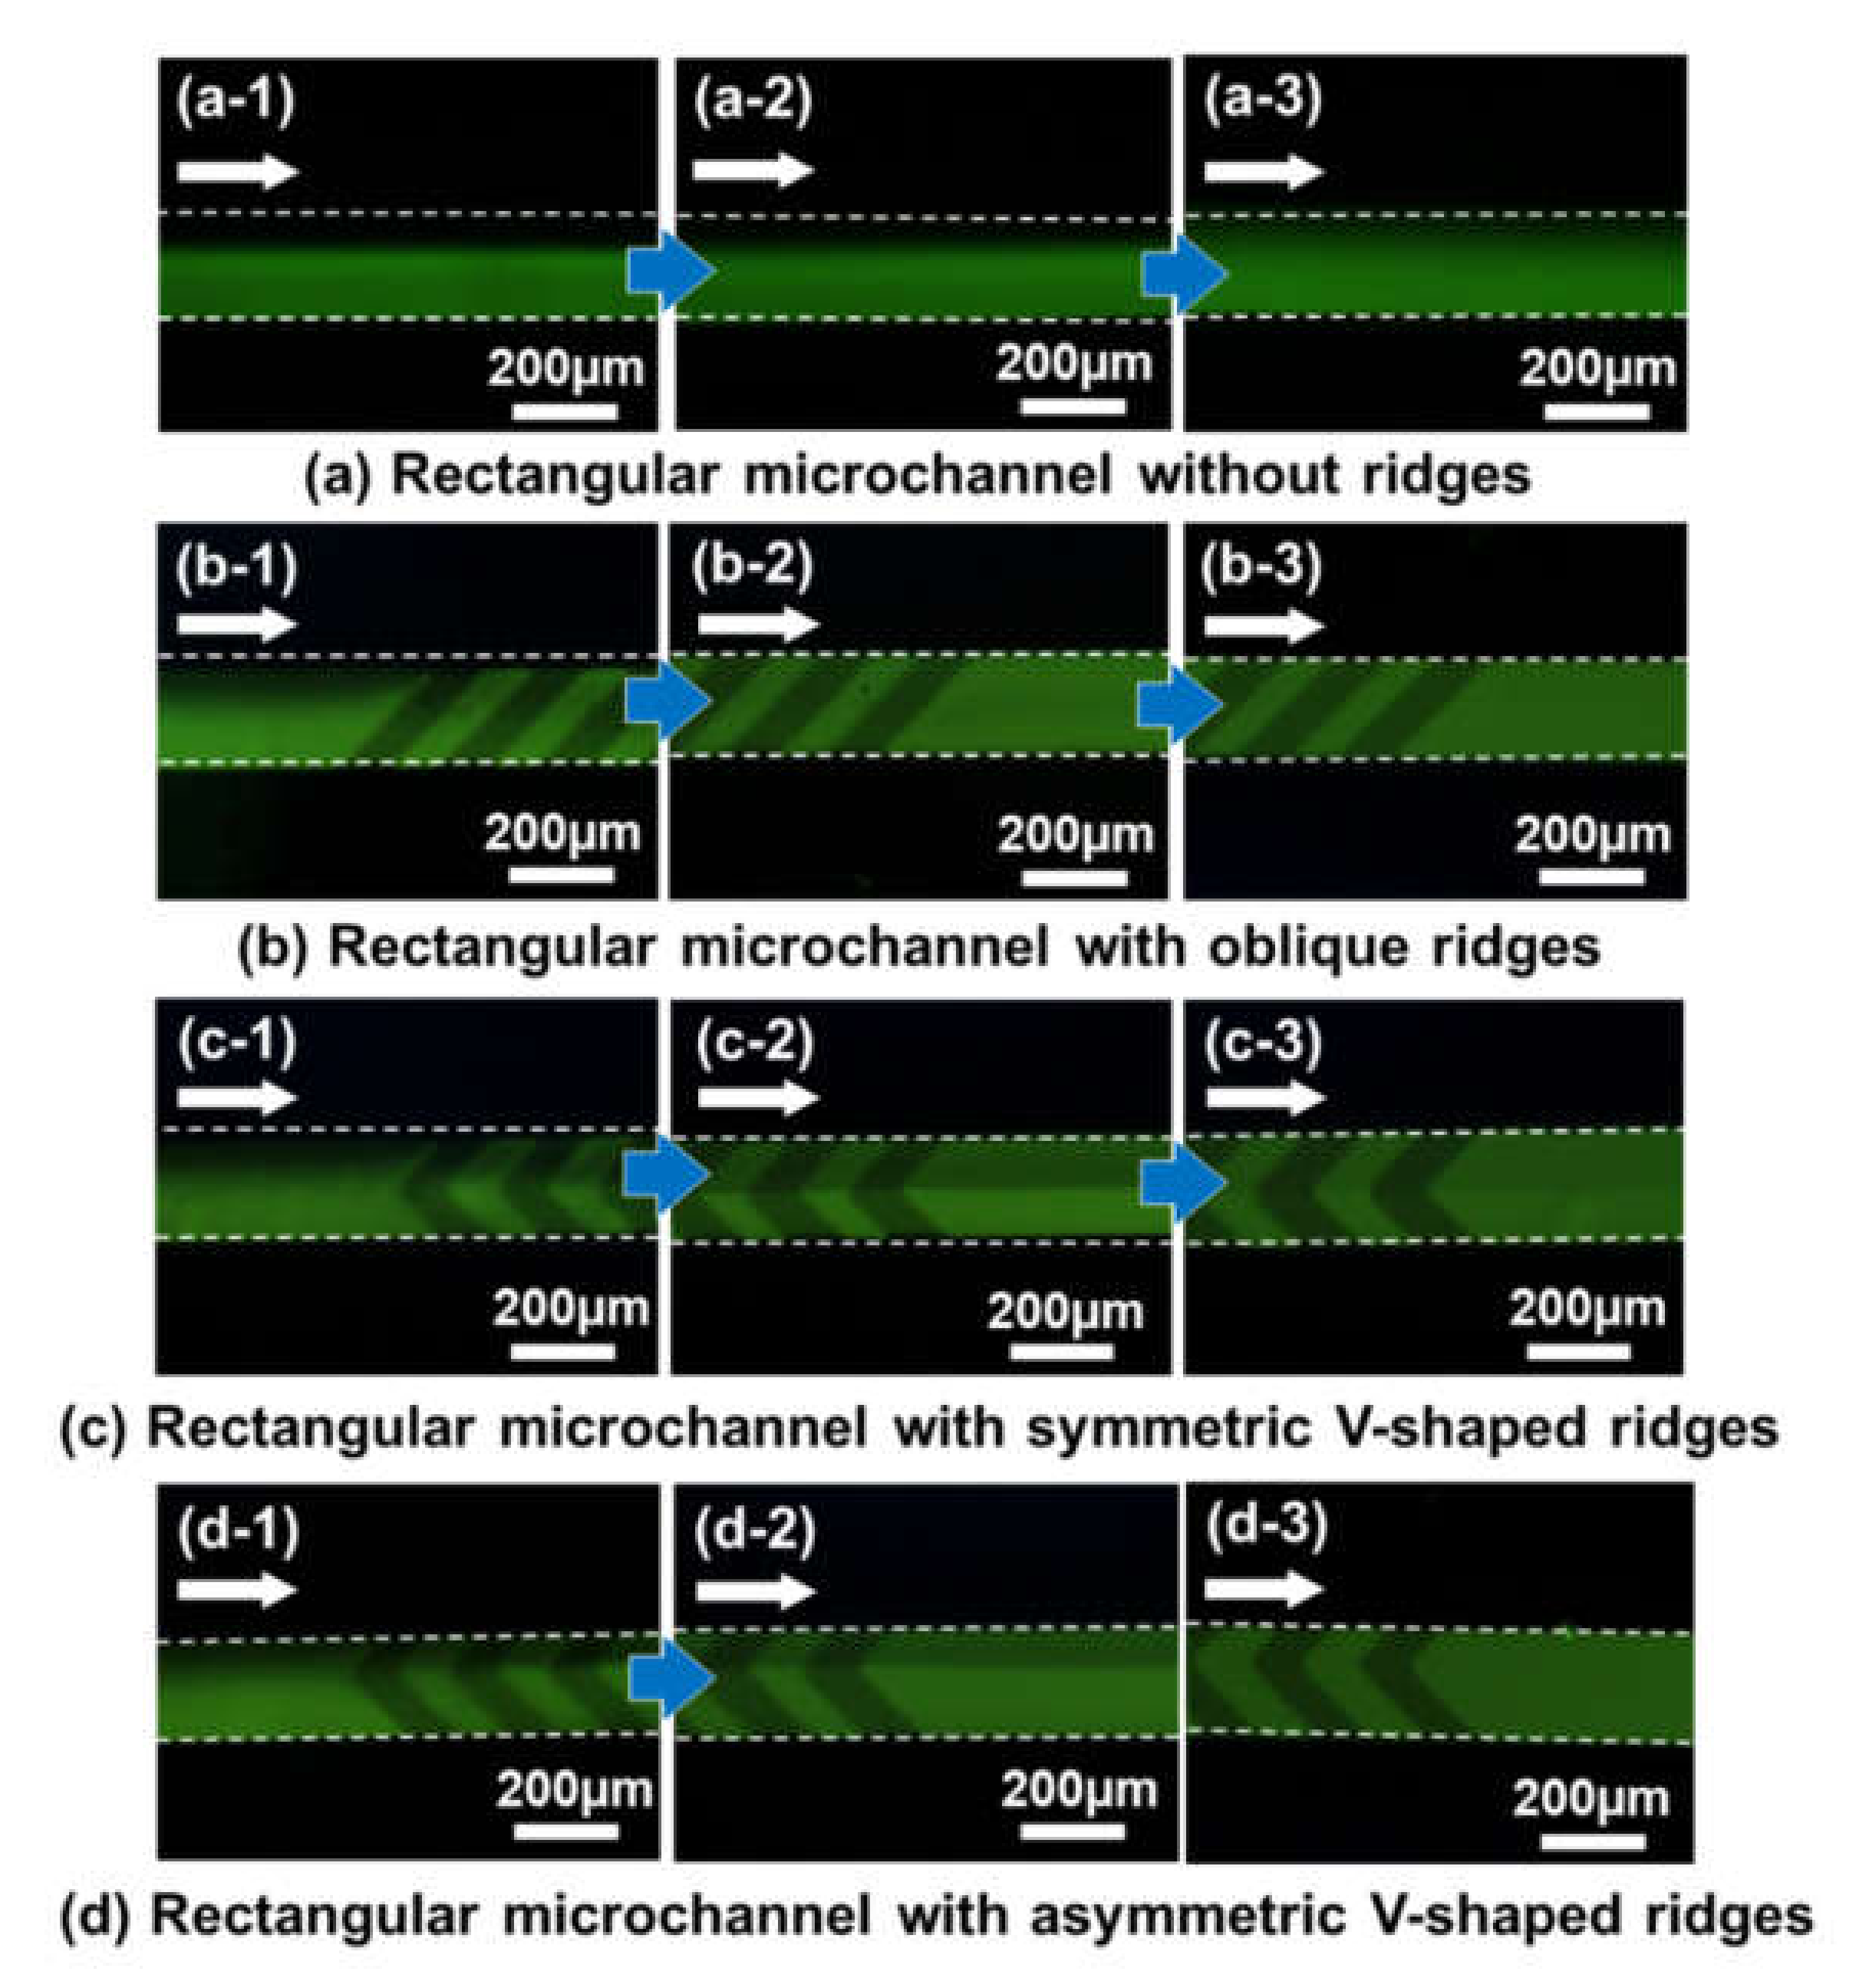
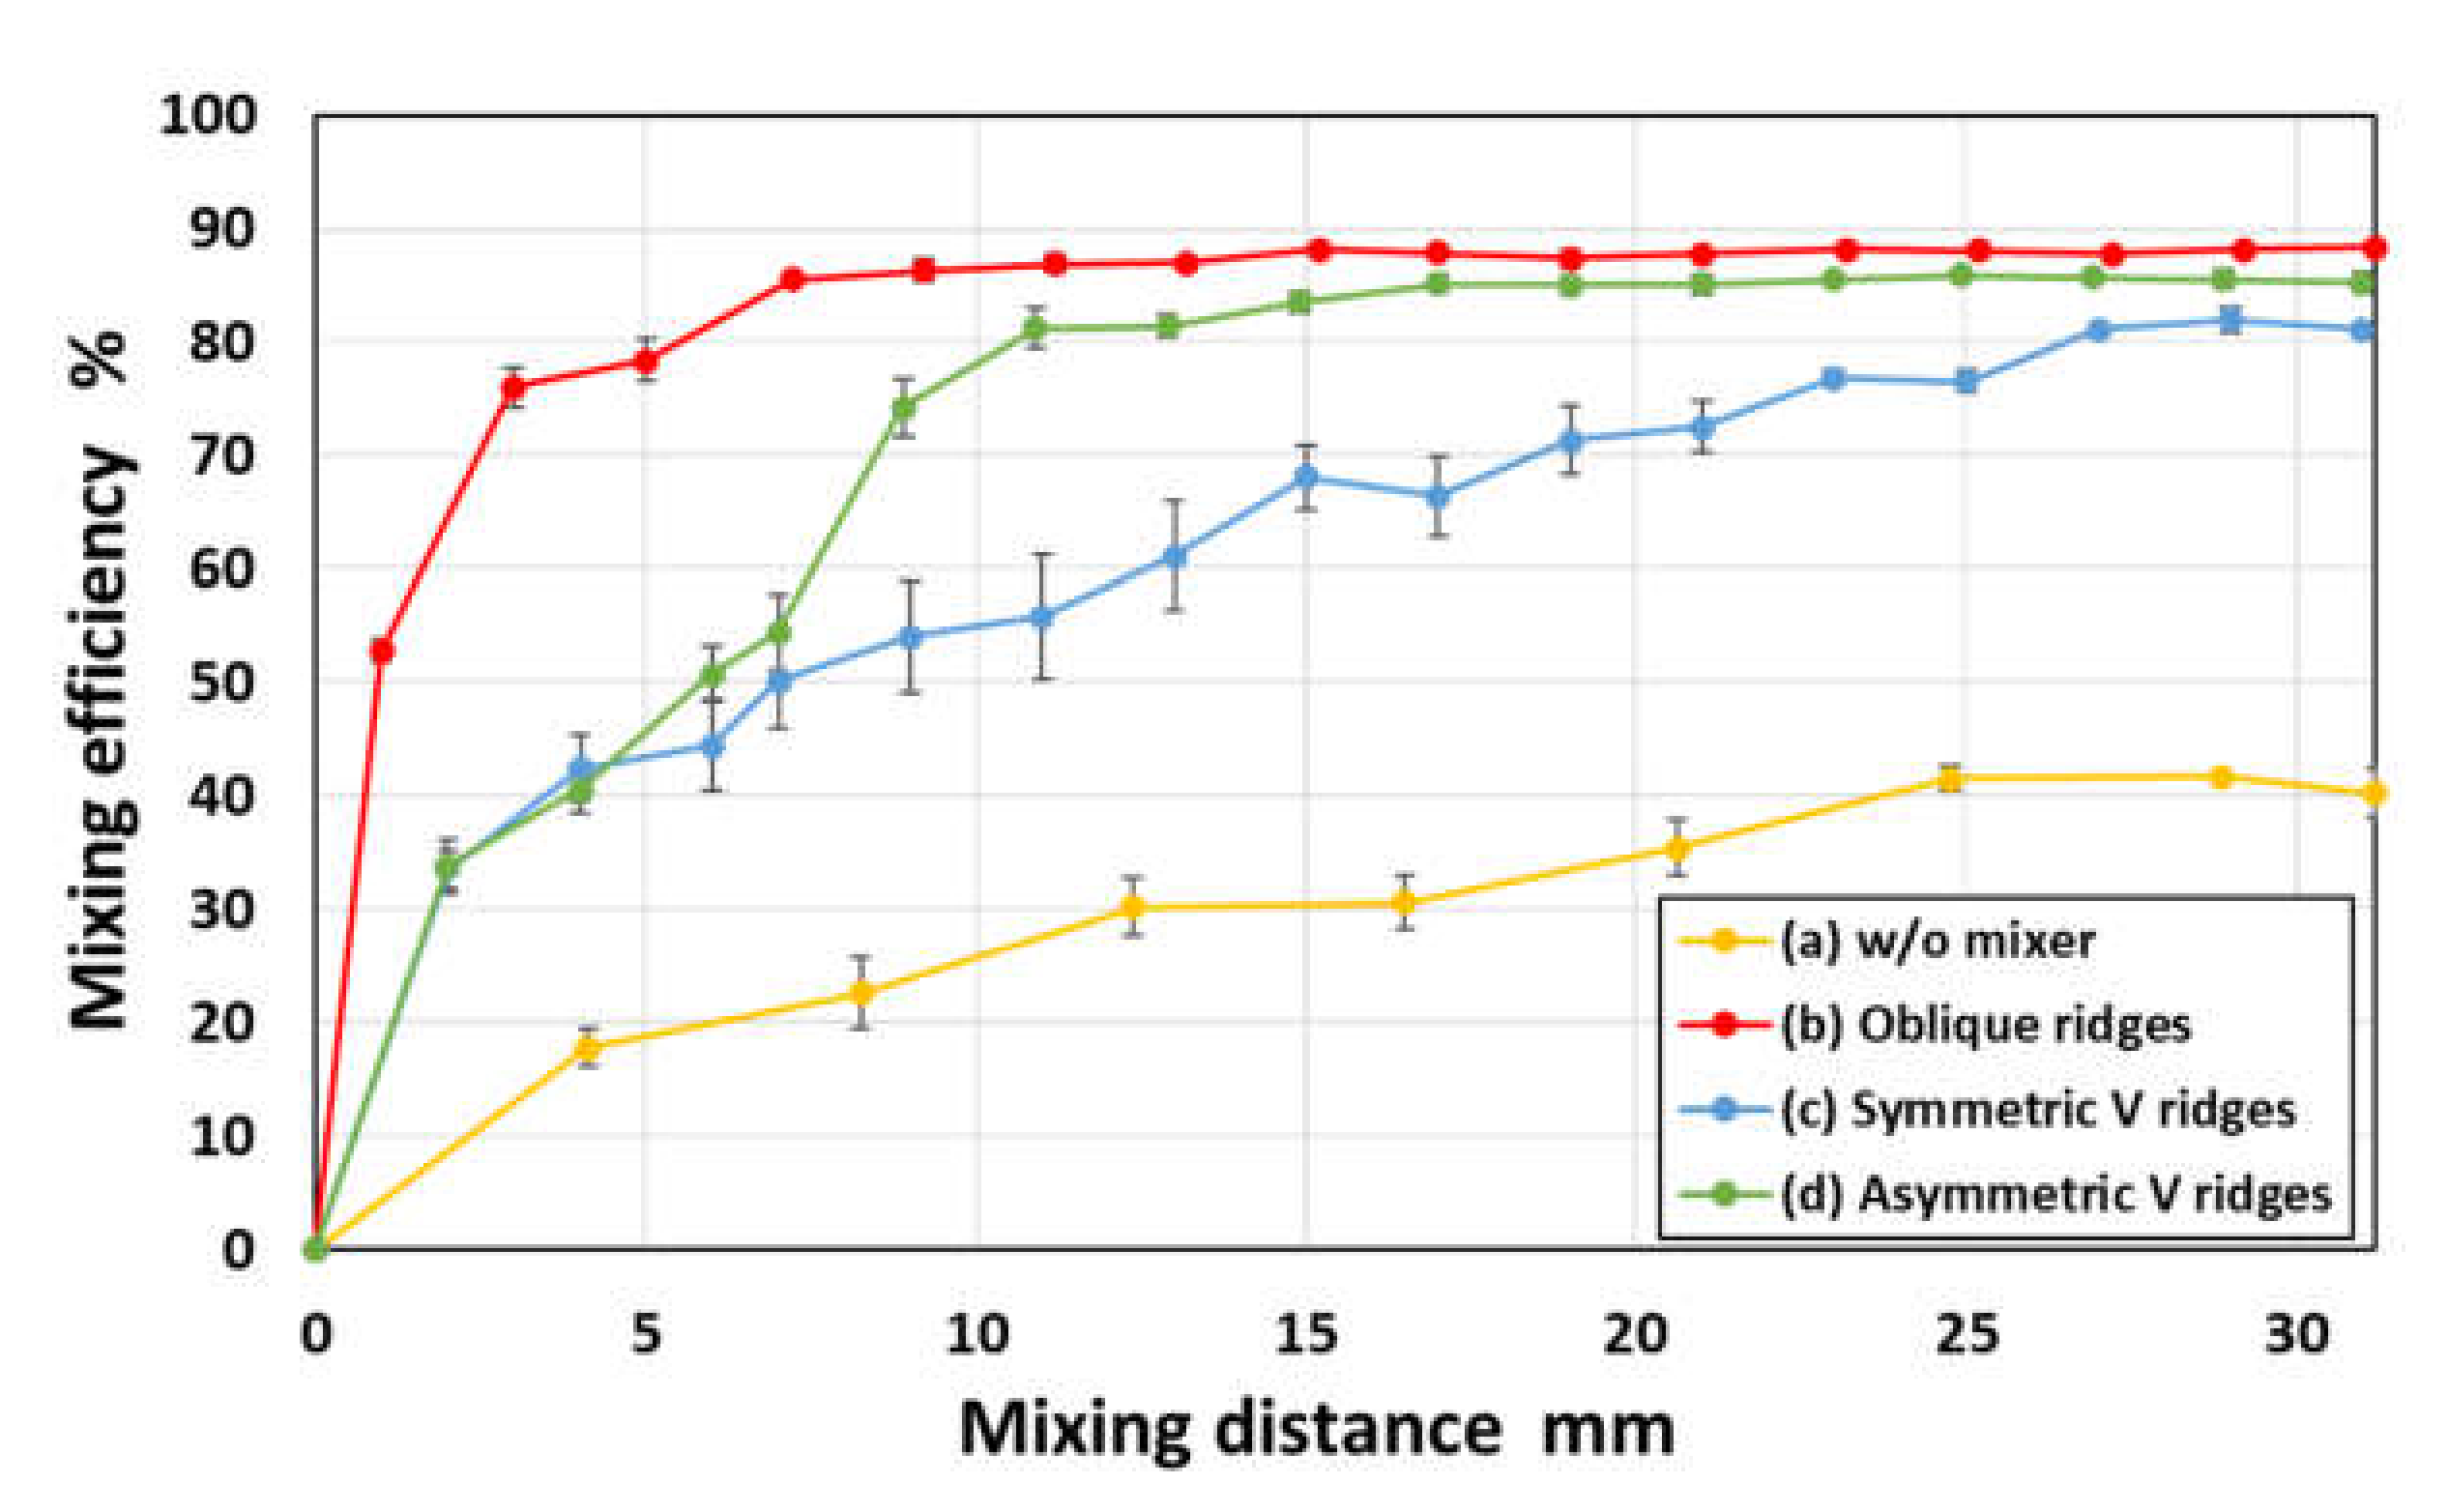
3.2.1. Experimental Investigation of Mixing Phenomena in a Microchannel
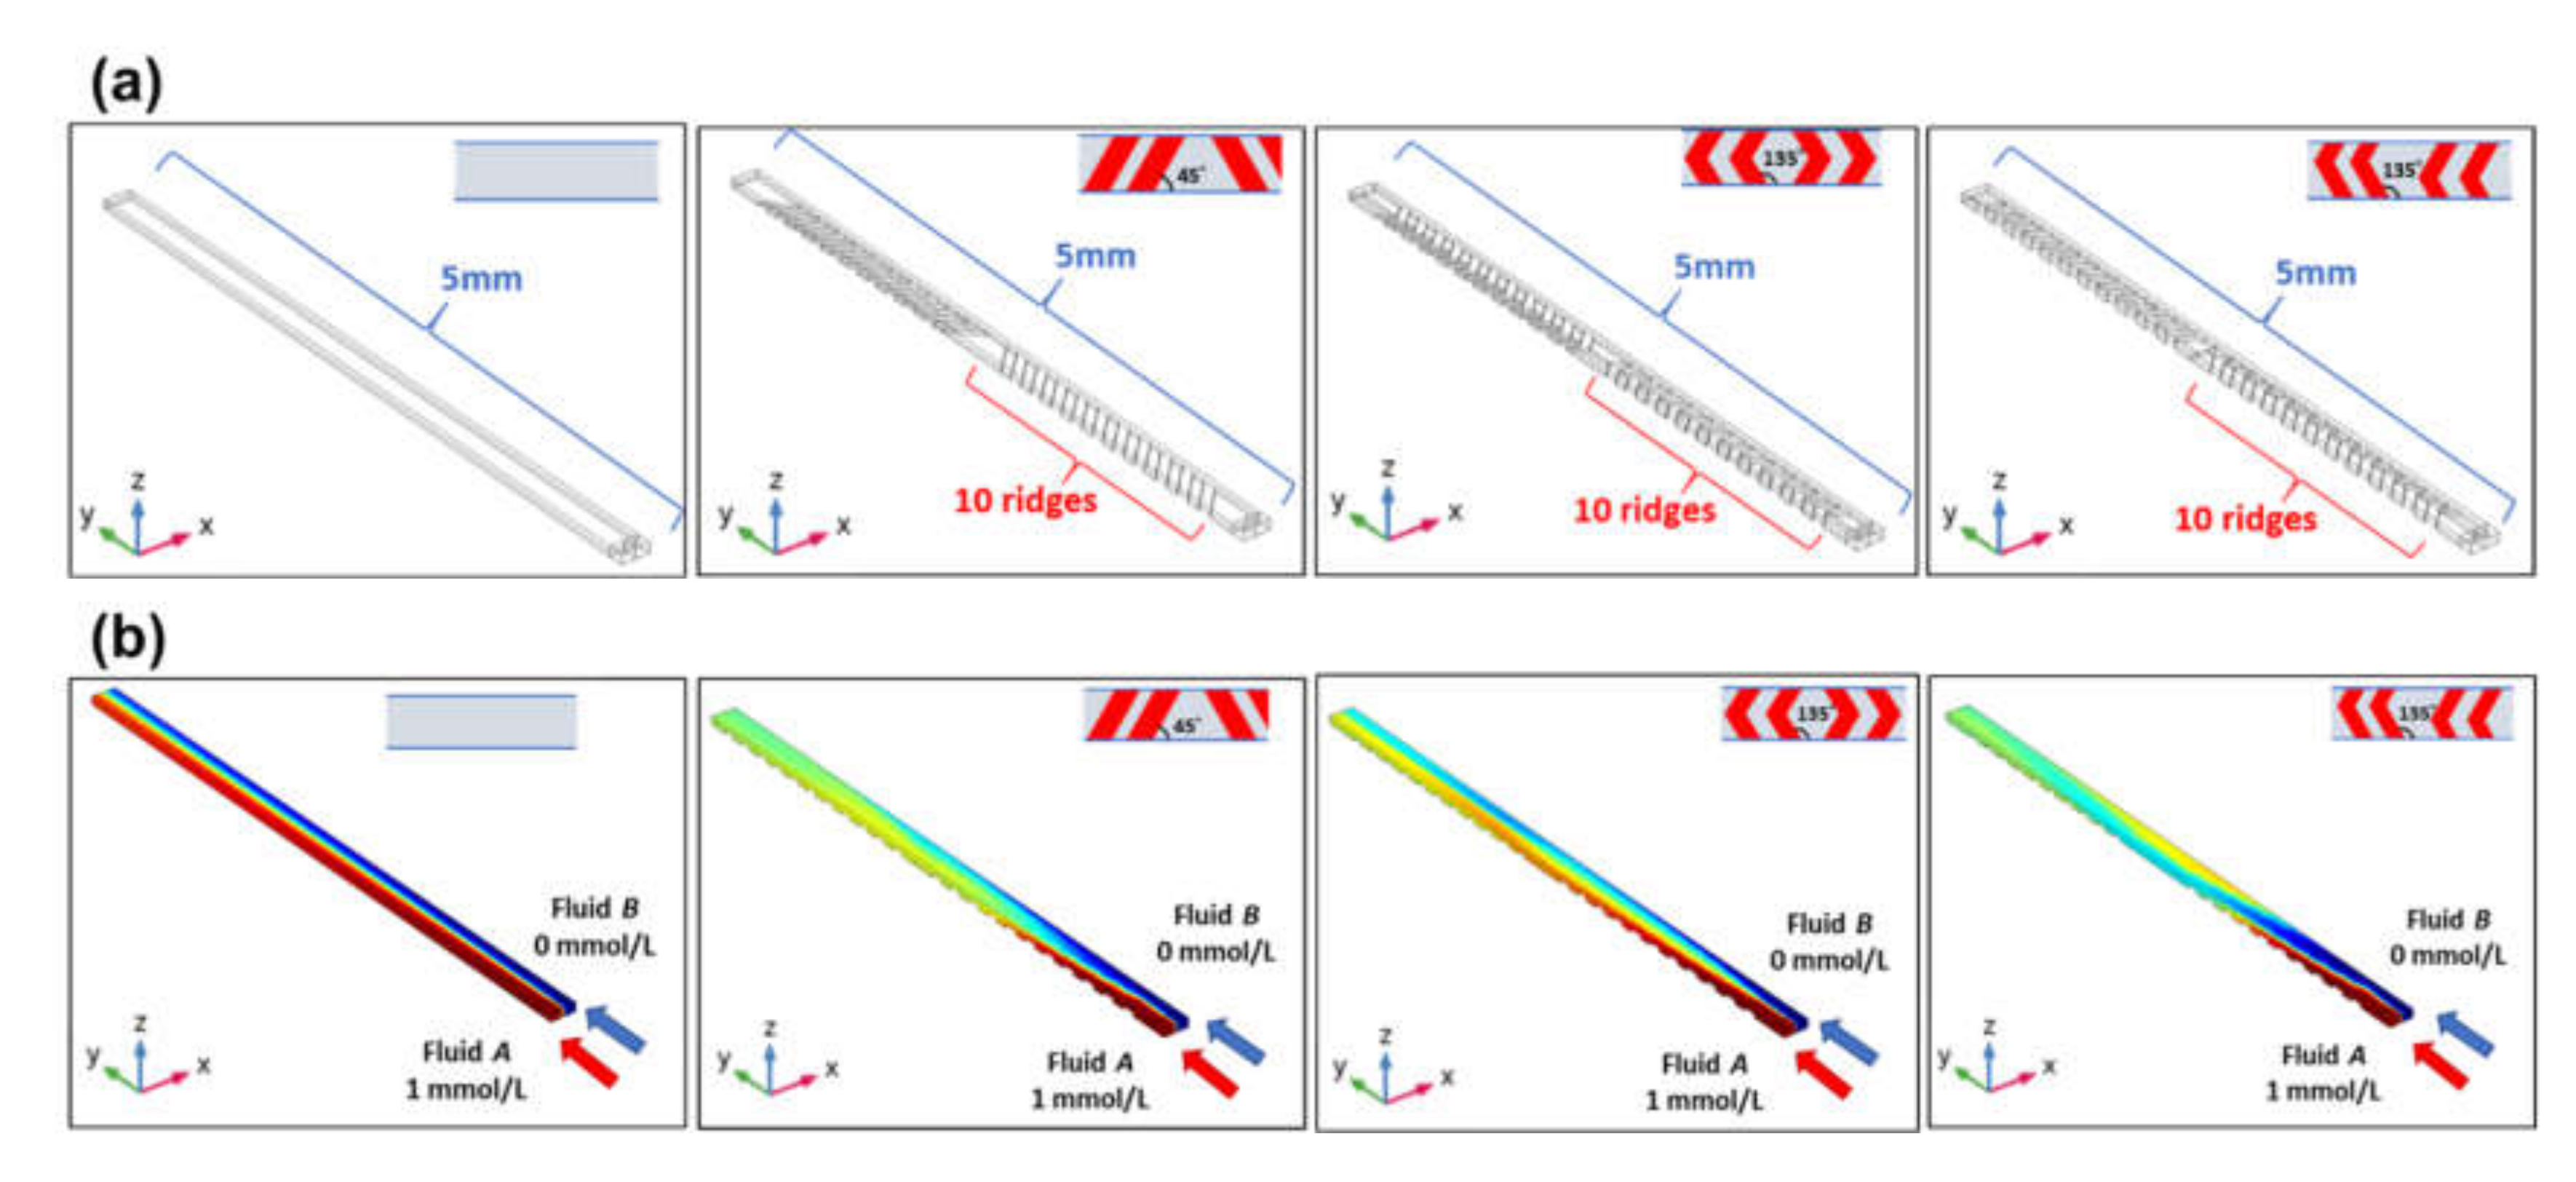
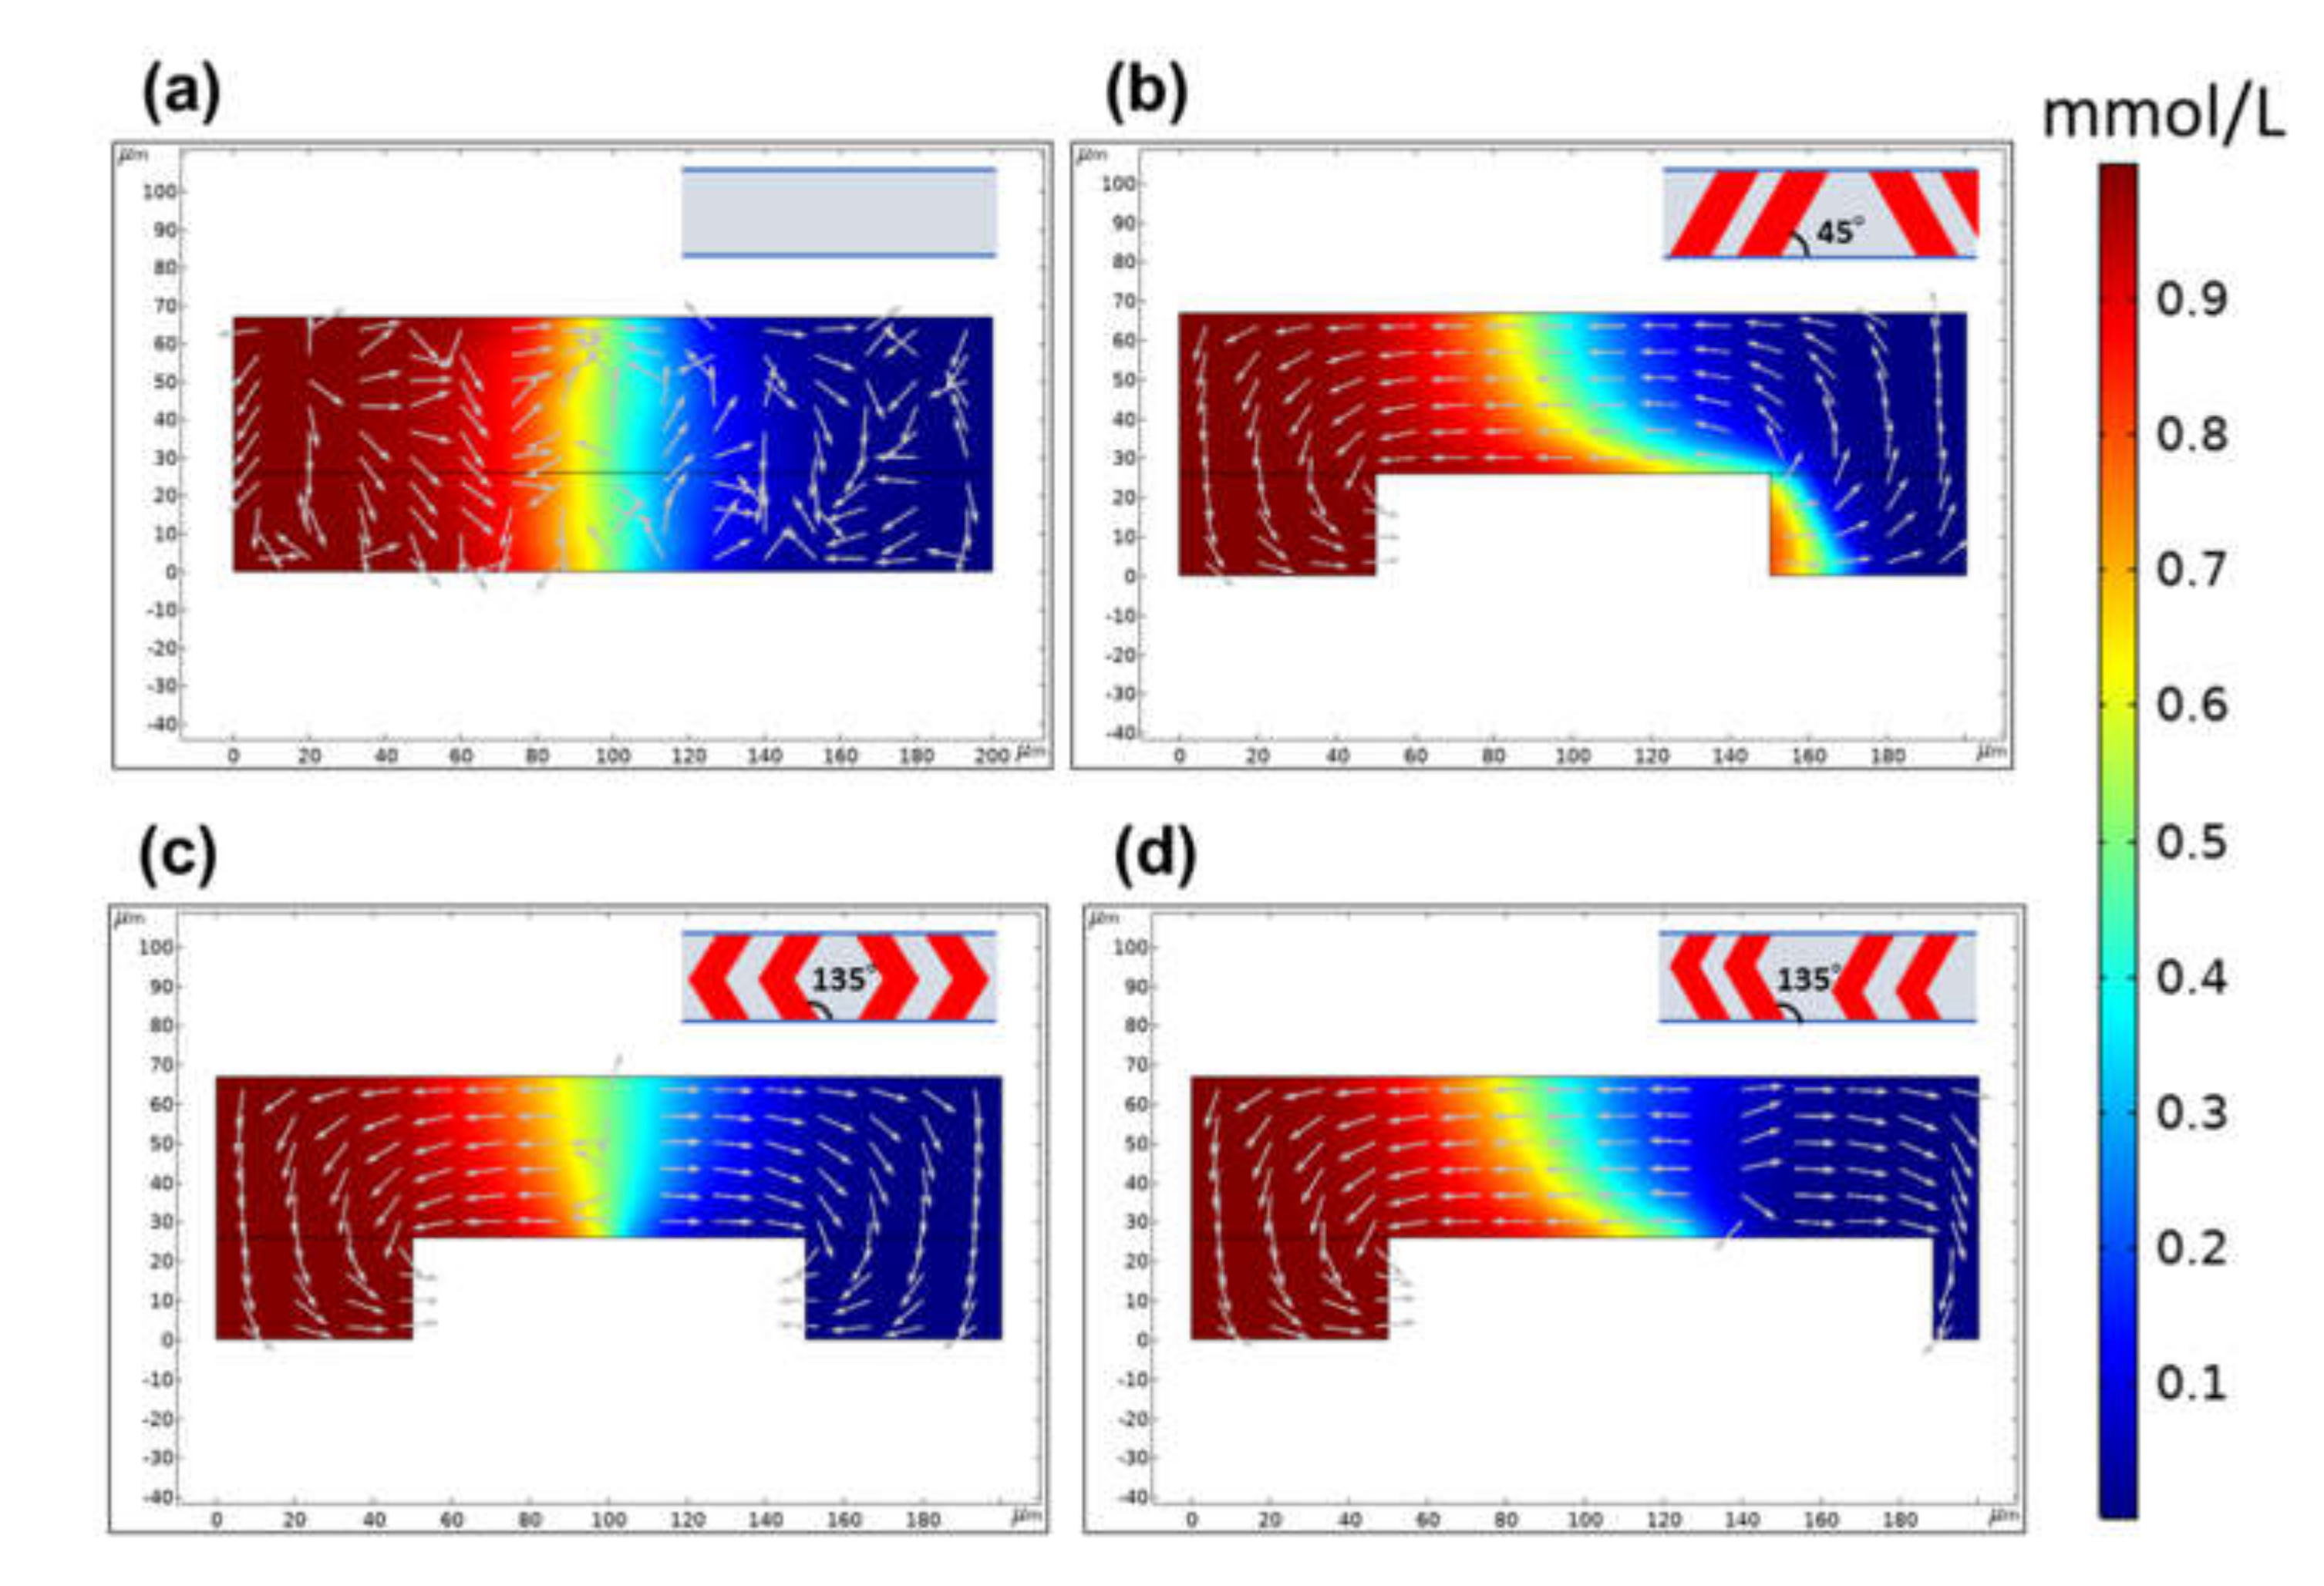
3.2.2. Computational Analysis of Mixing Phenomena in a Microchannel
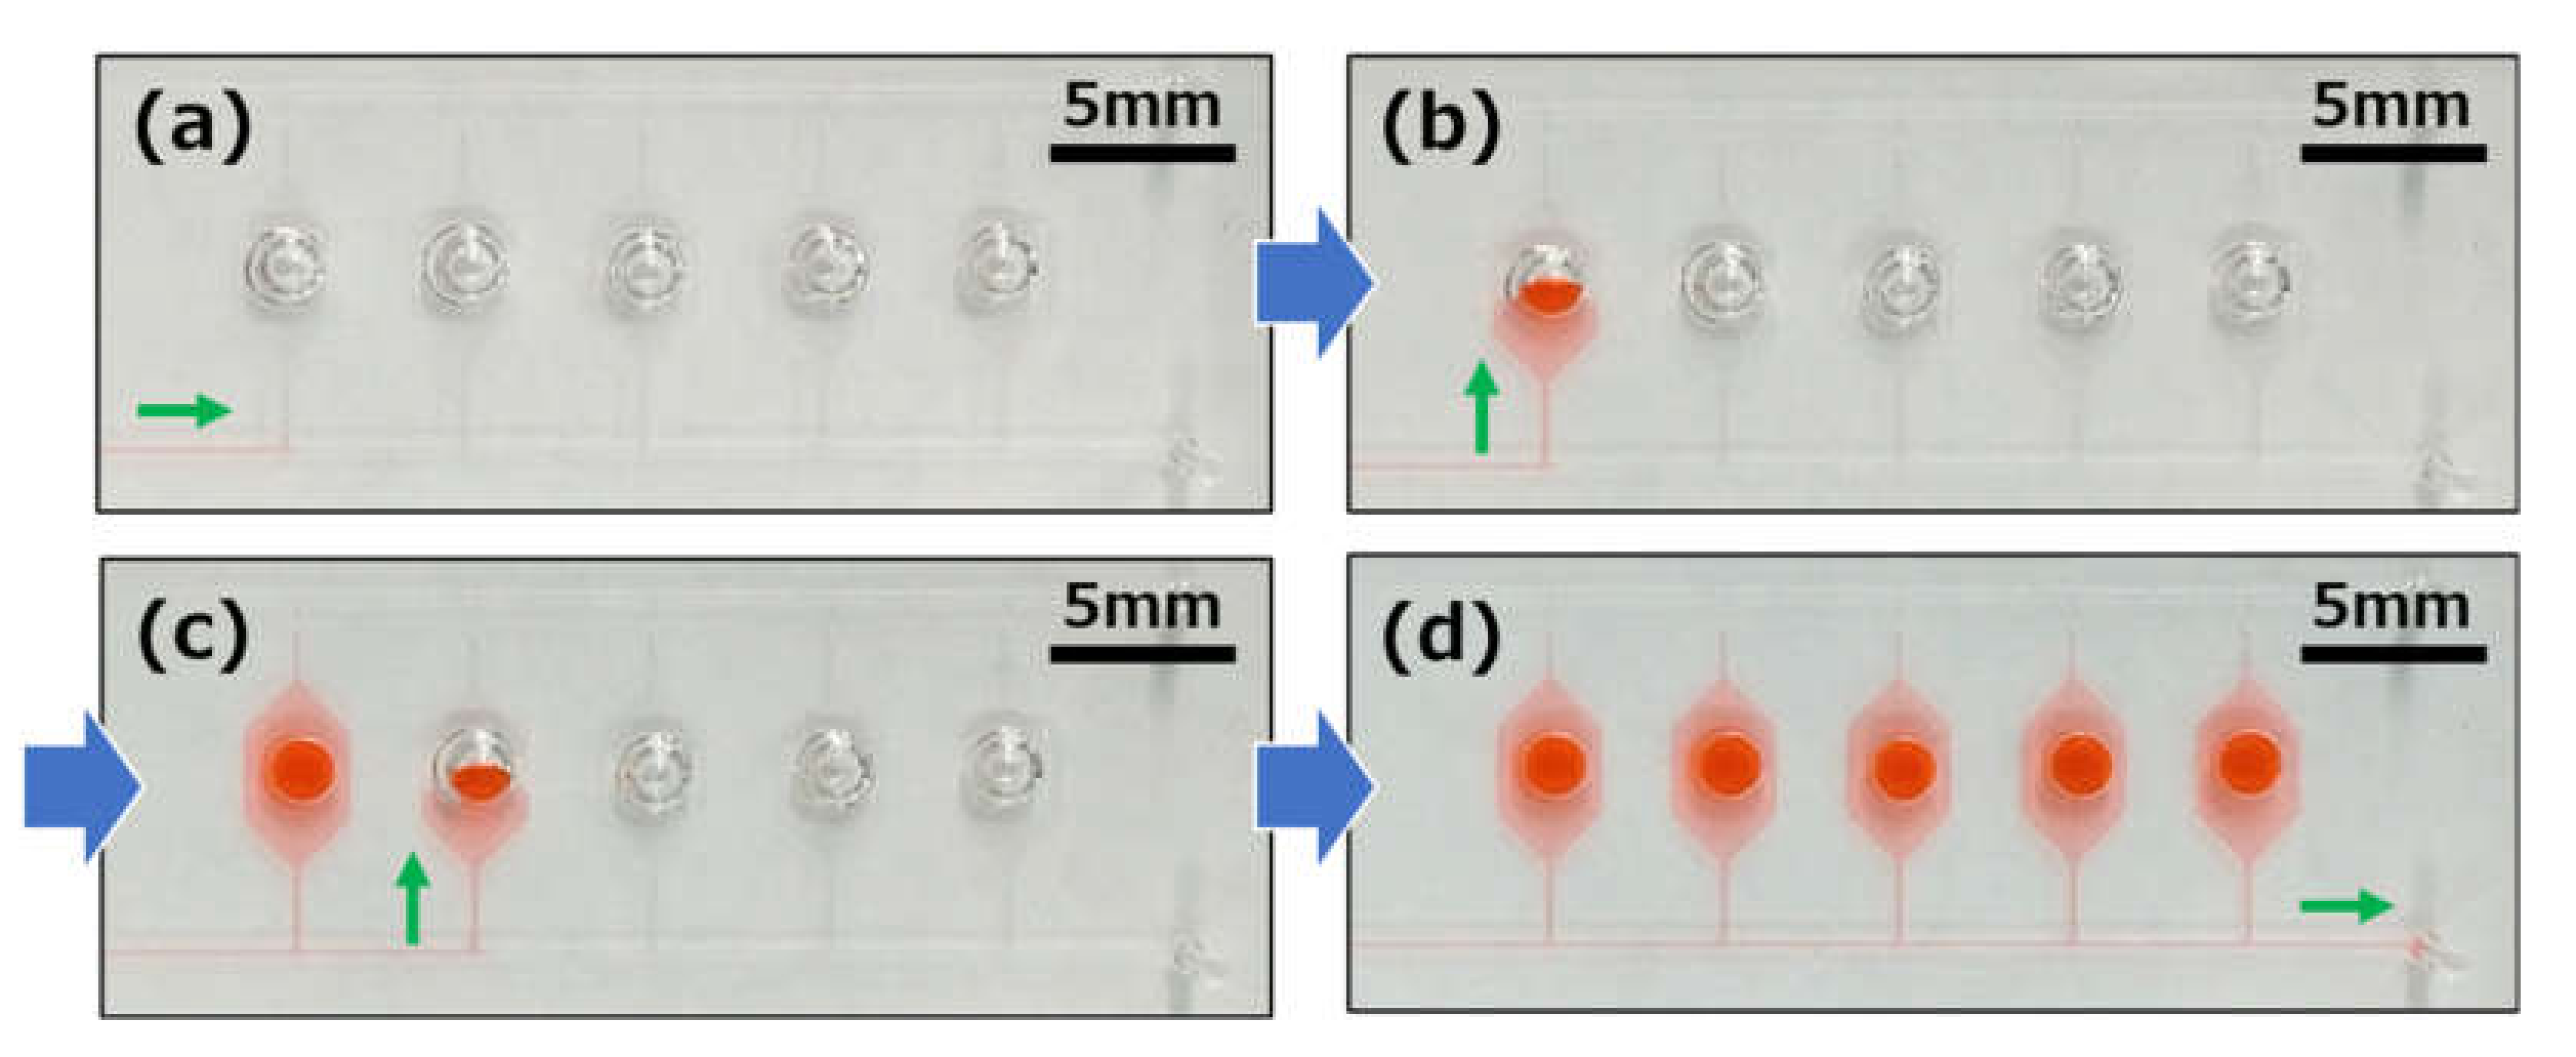
3.3. Investigation of Autonomous Sample Dispensing with Phaseguides
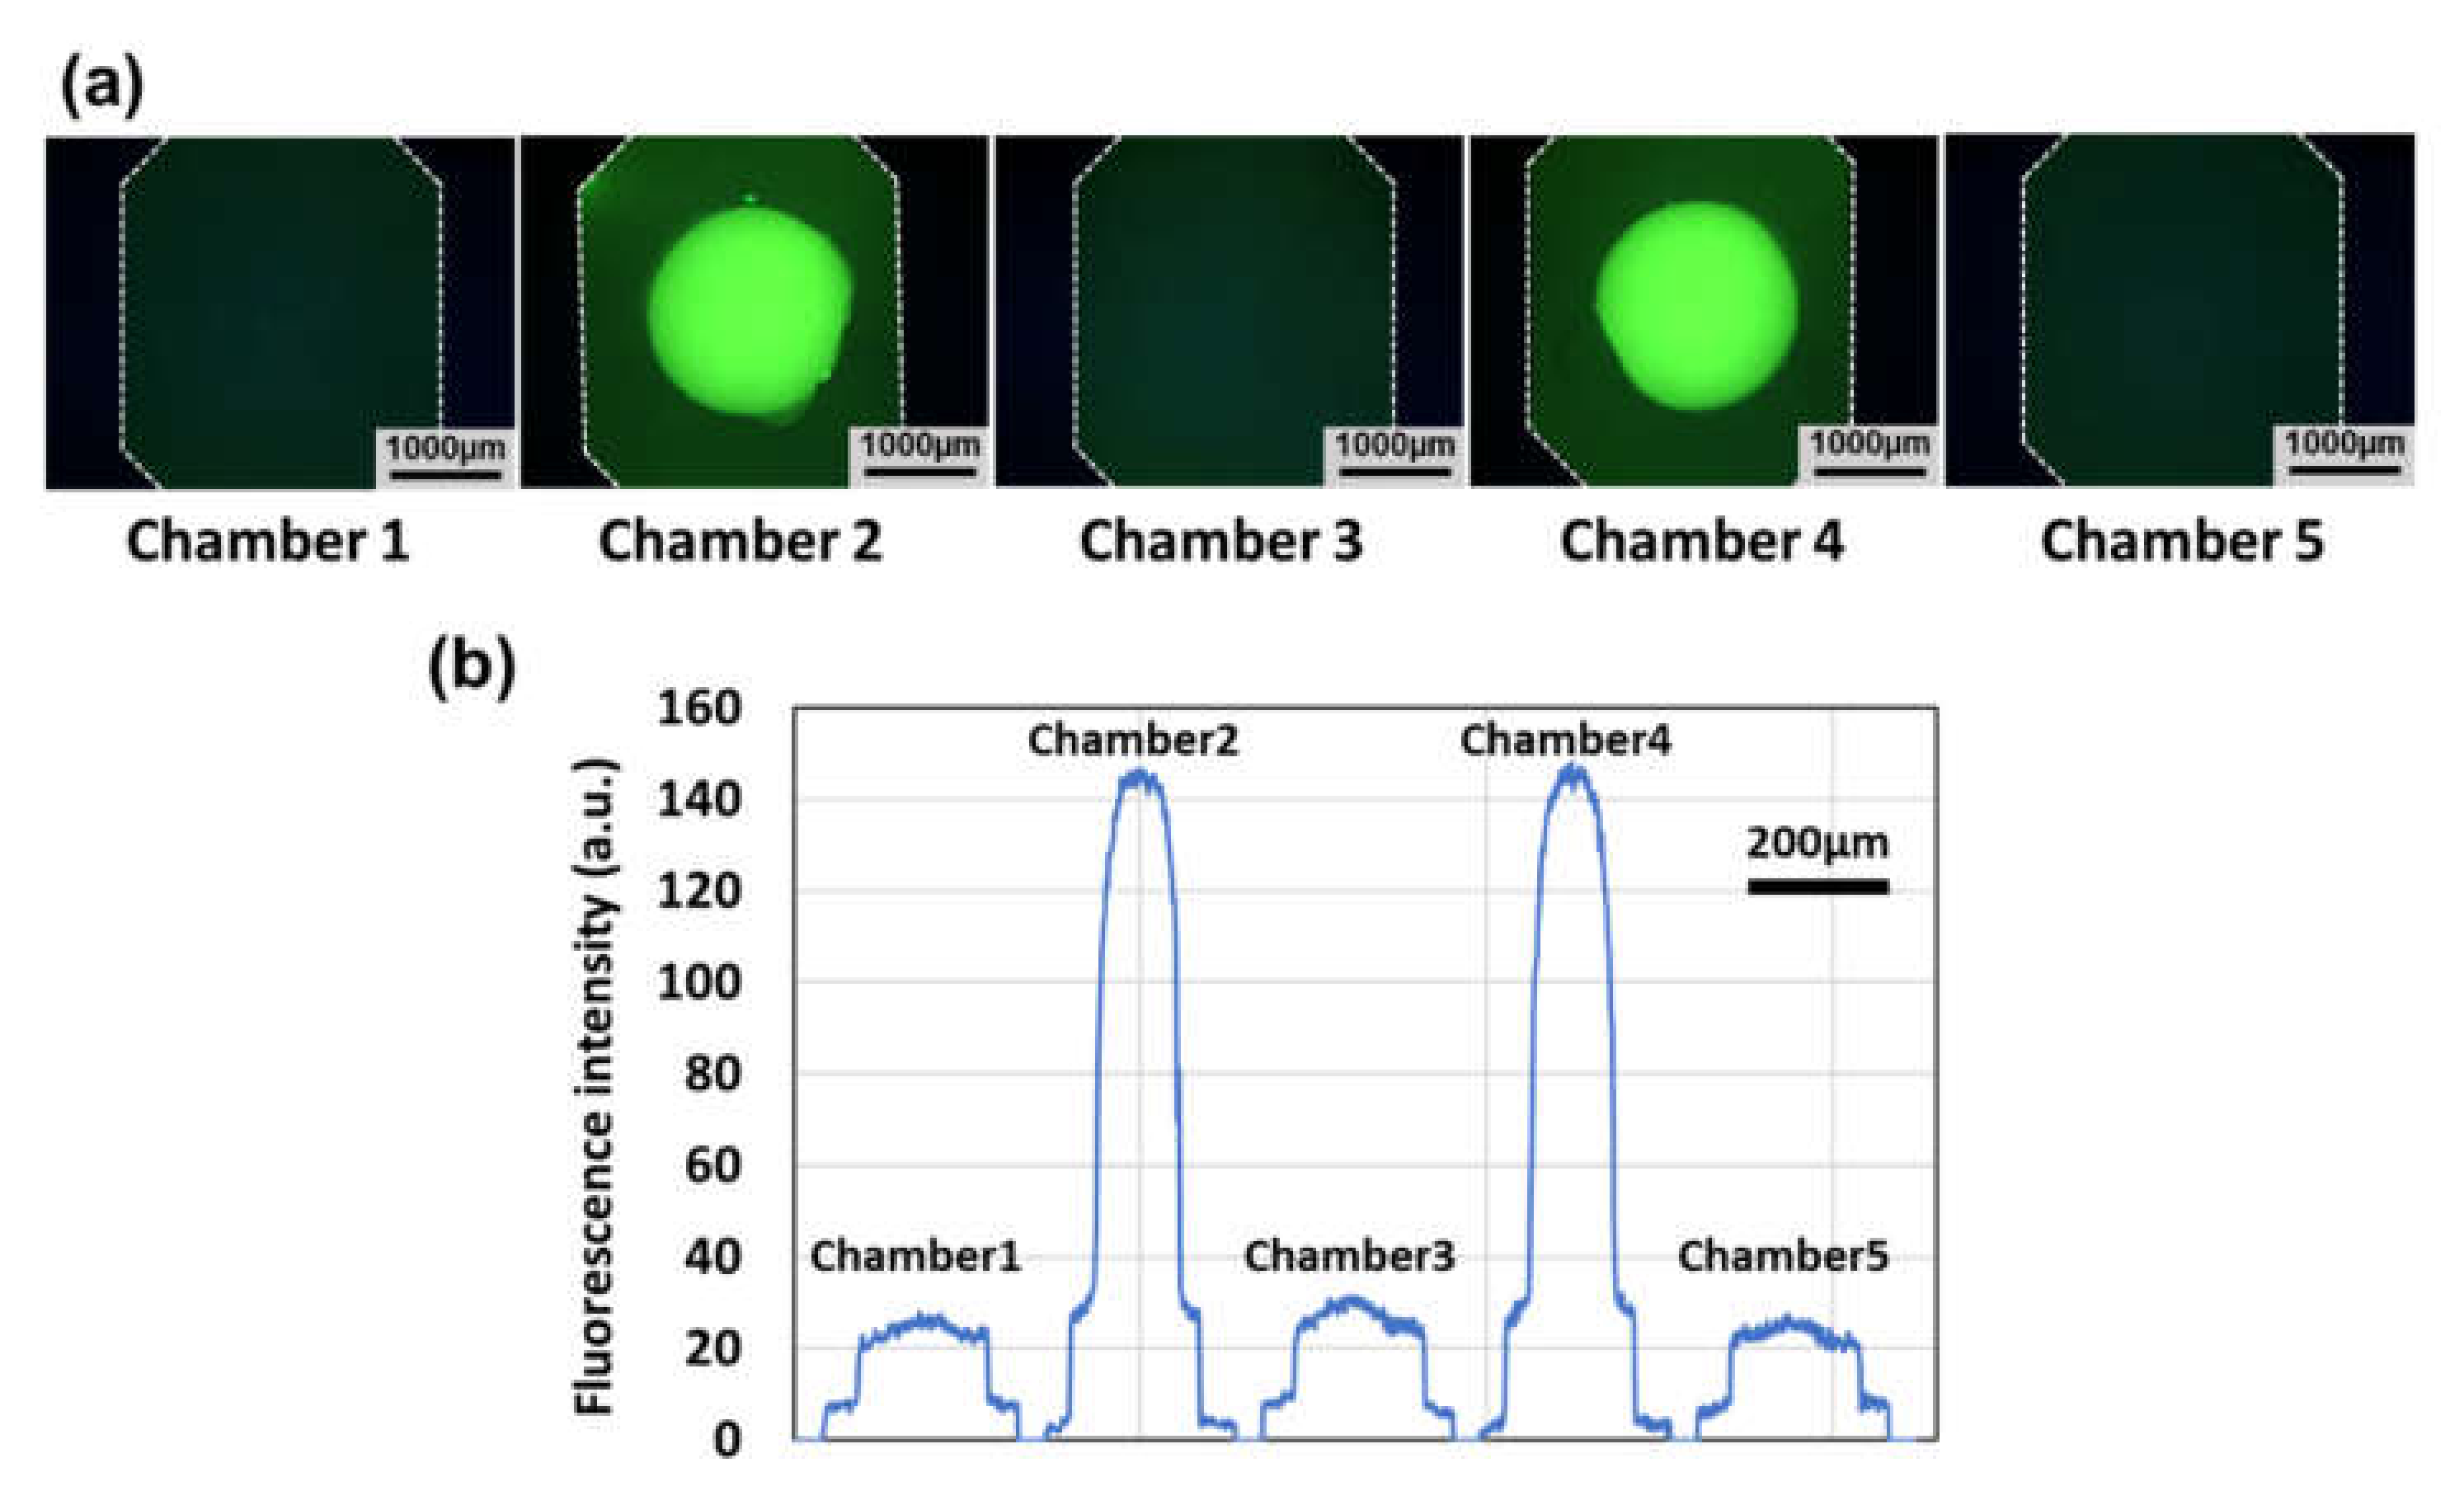
3.4. LAMP Assay in the Microfluidic Diagnostic Device
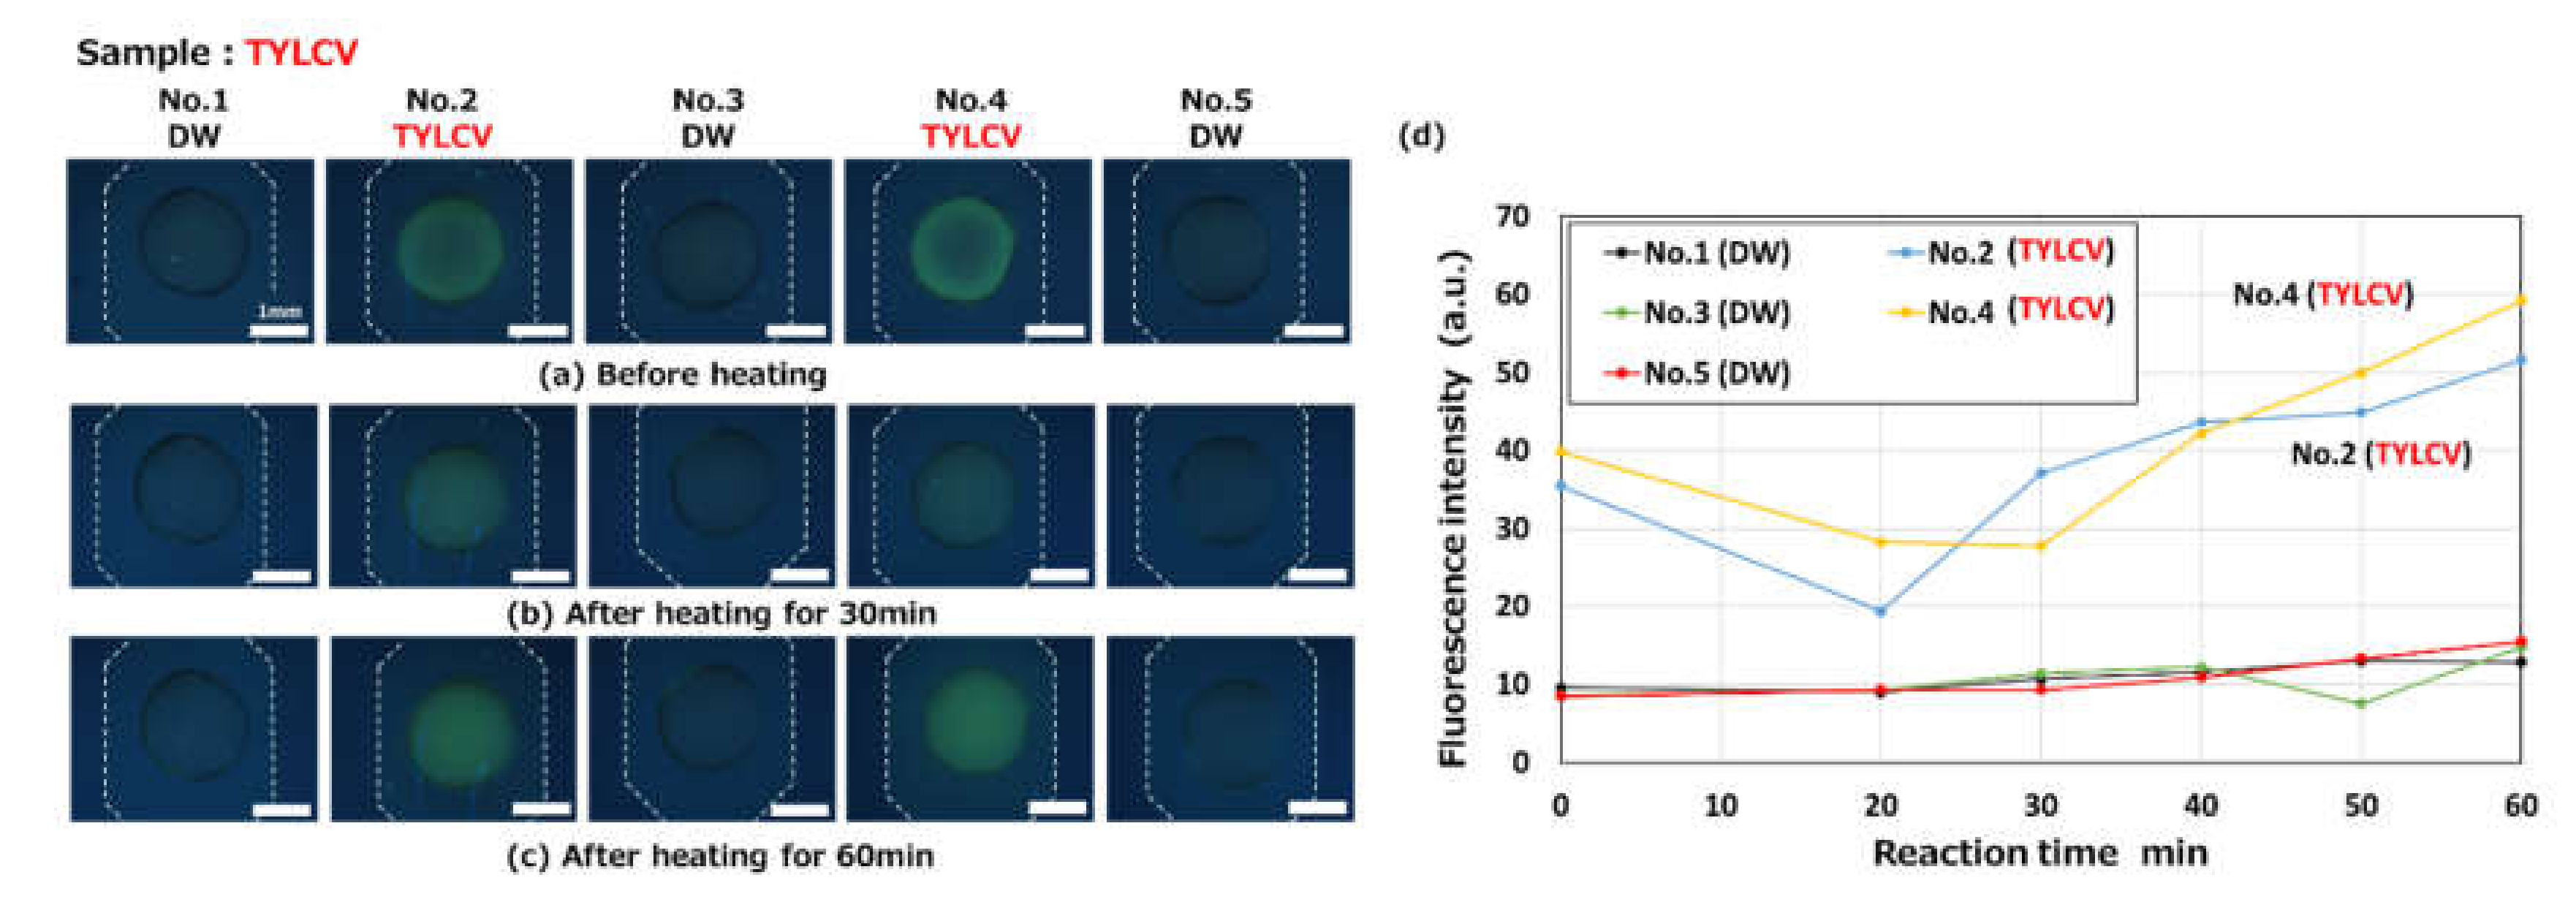
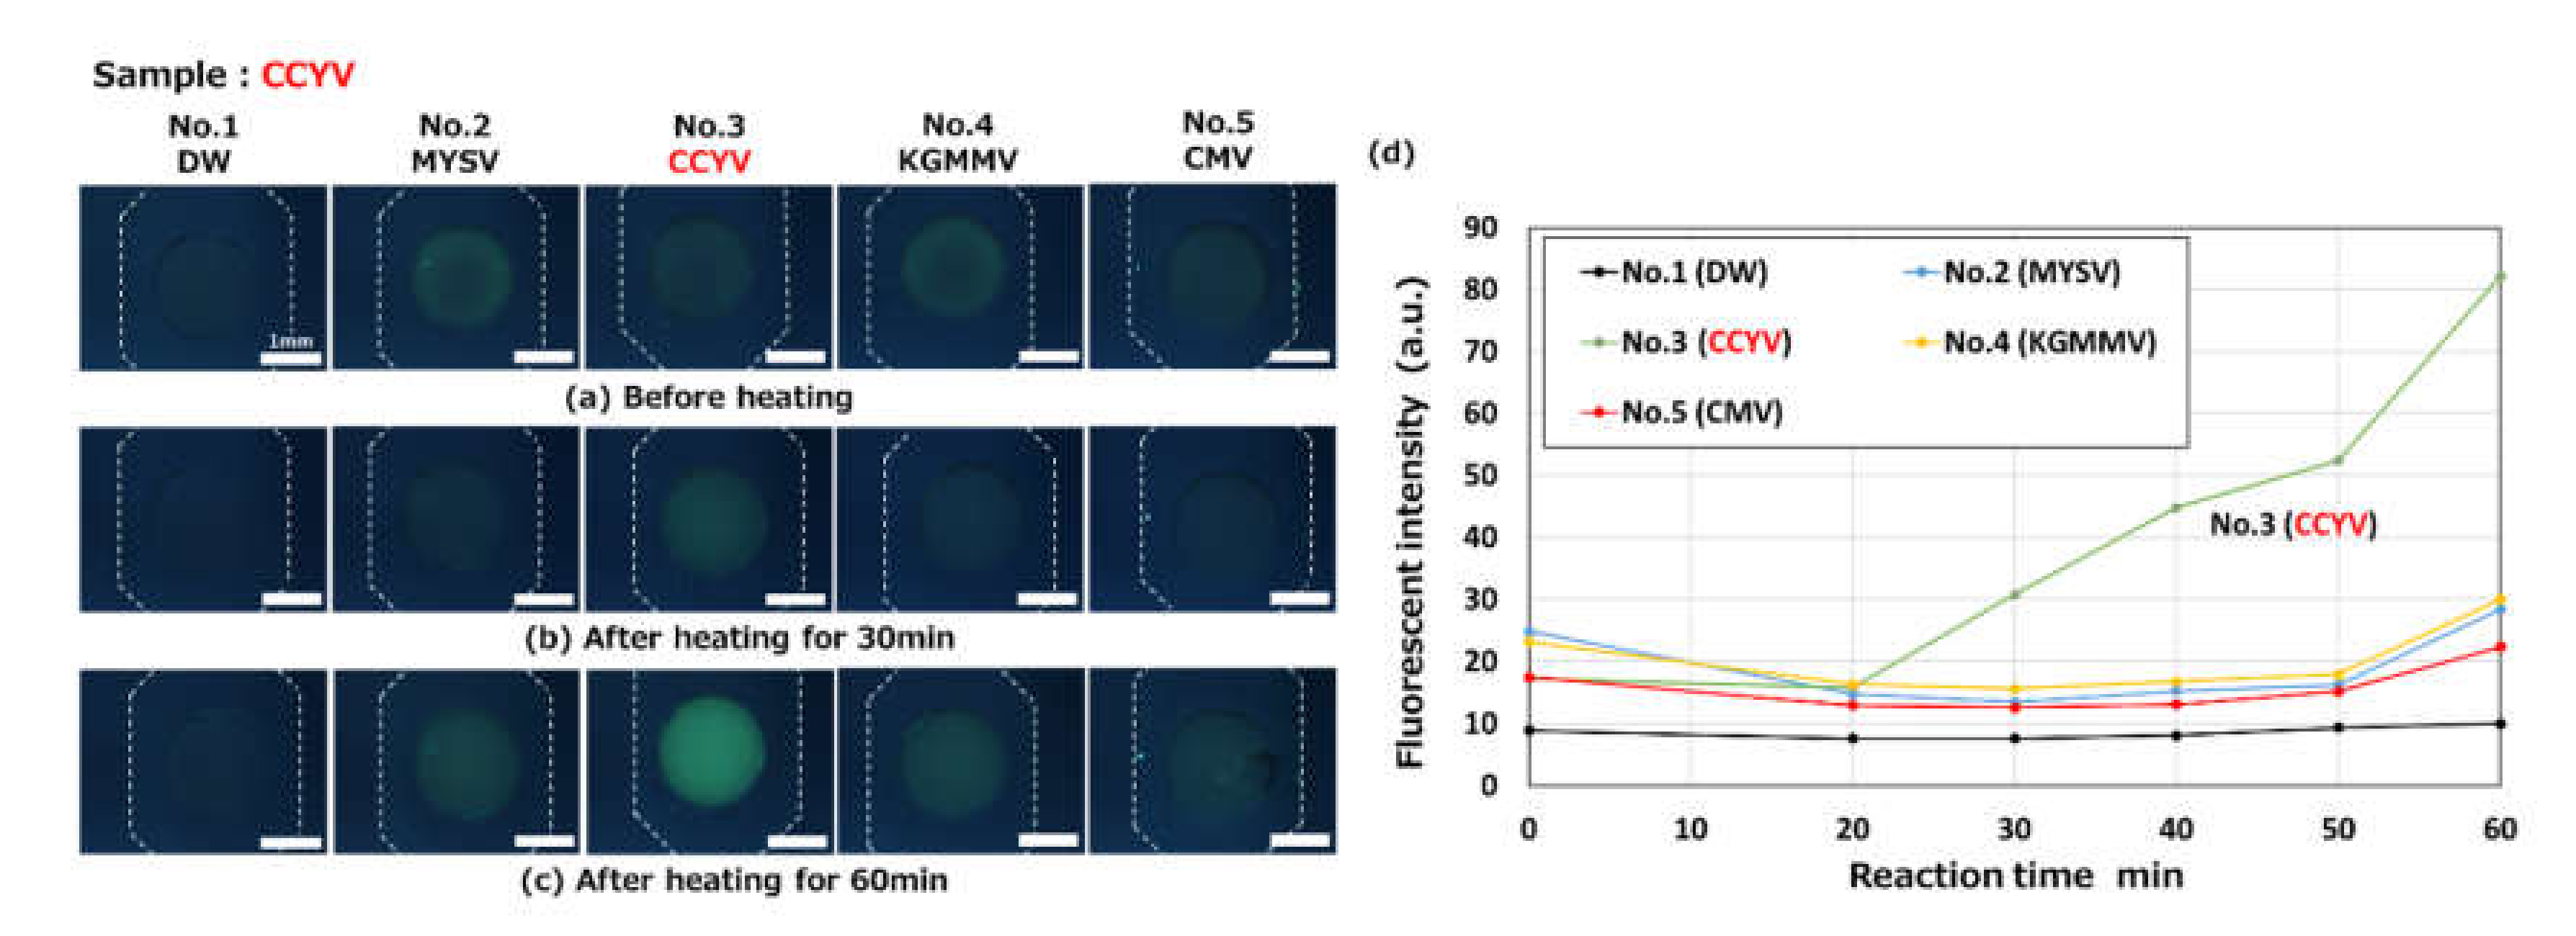
3.4.1. Detection of a DNA-Based Plant Virus
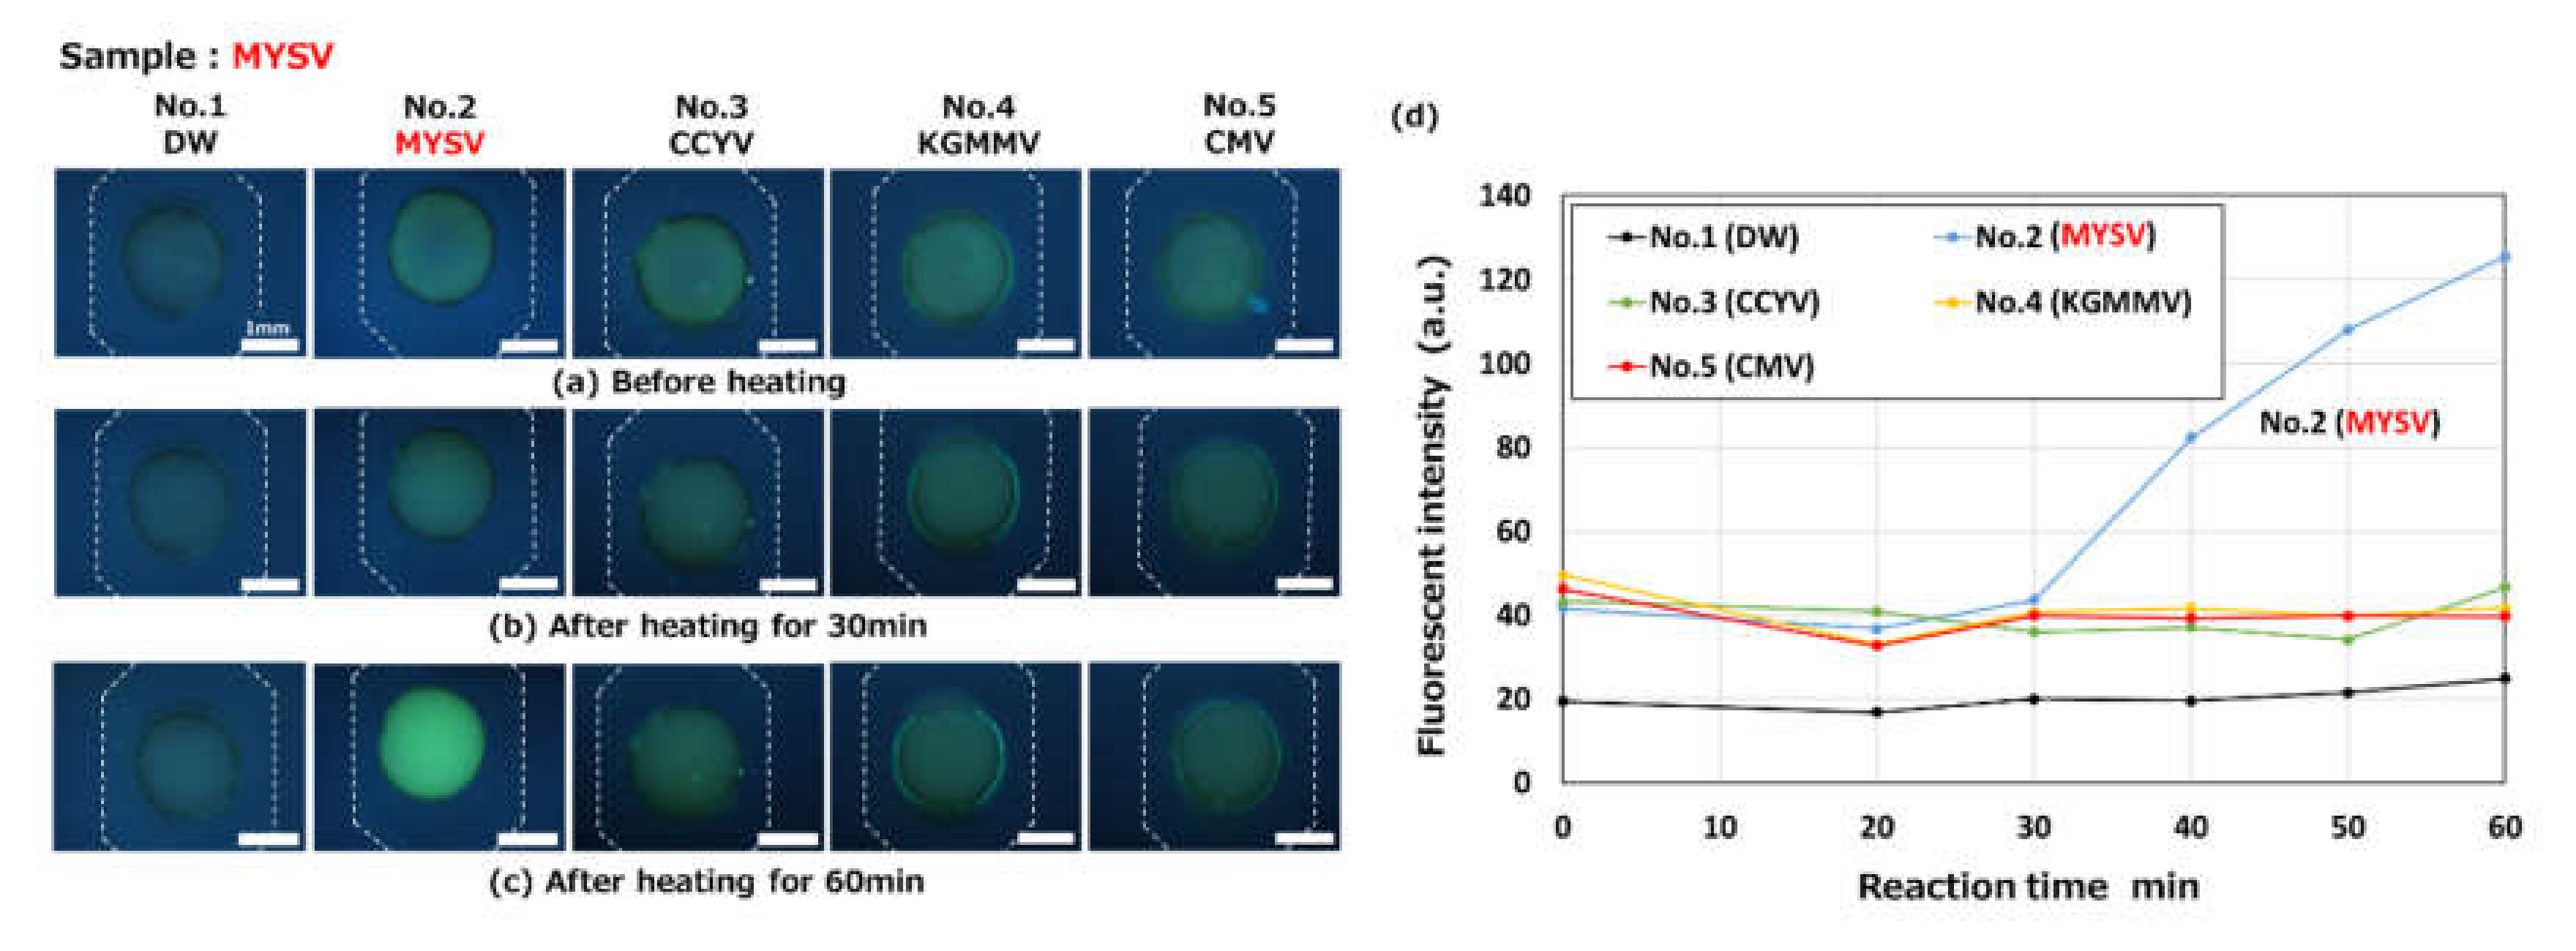
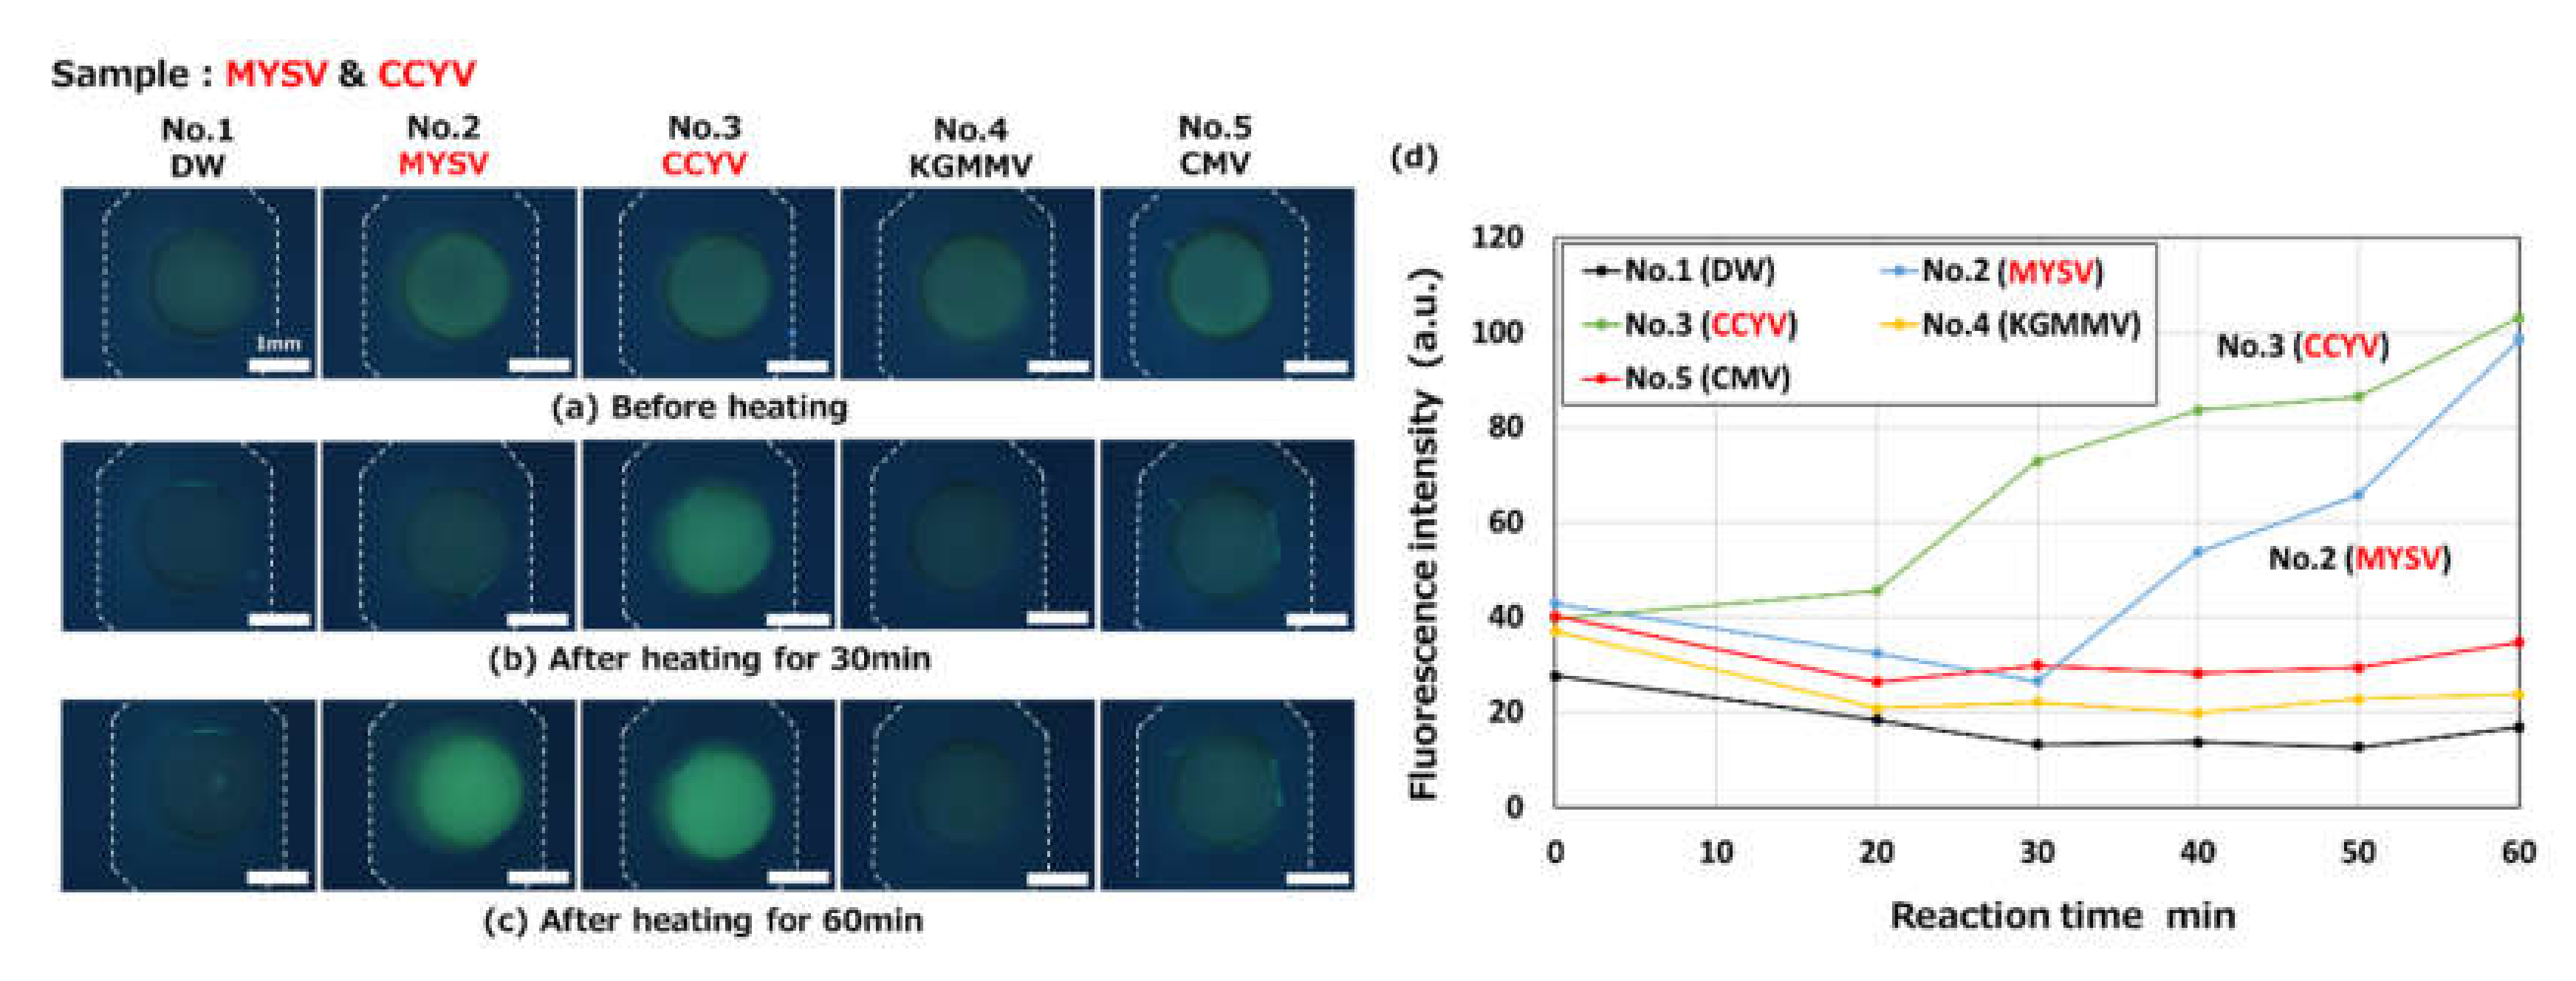
3.4.2. Simultaneous Detection of RNA-Based Plant Viruses
4. Conclusions
Supplementary Materials
Author Contributions
Funding
Acknowledgments
Conflicts of Interest
References
- Mahaman, B.D.; Passam, H.C.; Sideridis, A.B.; Yialouris, C.P. DIARES-IPM: A diagnostic advisory rule-based expert system for integrated pest management in Solanaceous crop systems. Agric. Syst. 2003, 76, 1119–1135. [Google Scholar] [CrossRef]
- Fukuta, S.; Kato, S.; Yoshida, K.; Mizukami, Y.; Ishida, A.; Ueda, J.; Kanbe, M.; Ishimoto, Y. Detection of tomato yellow leaf curl virus by loop-mediated isothermal amplification reaction. J. Virol. Methods 2003, 112, 35–40. [Google Scholar] [CrossRef]
- Tang, X.; Shi, X.; Zhang, D.; Li, F.; Yan, F.; Zhang, Y.; Liu, Y.; Zhou, X. Detection and epidemic dynamic of ToCV and CCYV with Bamisia tabaci and weed in Hainan of China. Virol. J. 2017, 14, 169. [Google Scholar] [CrossRef] [PubMed] [Green Version]
- Abrahamian, P.; Sobh, H.; Seblani, R.; Abou-Jawdah, Y. Co-infection of two criniviruses and a begomovirus enhances the disease severity in cucumber. Eur. J. Plant Pathol. 2015, 142, 521–530. [Google Scholar] [CrossRef]
- Abrahamian, P.E.; Abou-Jawdah, Y. Whitefly-transmitted criniviruses of cucurbits: Current status and future prospects. Virus Dis. 2014, 25, 26–38. [Google Scholar] [CrossRef] [Green Version]
- Navarro, E.; Serrano-Heras, G.; Castañoa, M.J.; Solera, J. Real-time PCR detection chemistry. Clin. Chim. Acta 2015, 439, 231–250. [Google Scholar] [CrossRef]
- Sea-liang, N.; Sereemaspun, A.; Patarakul, K.; Gaywee, J.; Rodkvamtook, W.; Srisawat, N.; Wacharaplusadee, S.; Hemachudha, T. Development of multiplex PCR for neglected infectious diseases. PLoS Negl. Trop. Dis. 2019, 13, e0007440. [Google Scholar] [CrossRef]
- Quan, P.-L.; Sauzade, M.; Brouzes, E. dPCR: A technology review. Sensors 2018, 18, 1271. [Google Scholar] [CrossRef] [Green Version]
- Aslam, S.; Tahir, A.; Aslam, M.F.; Alam, M.W.; Shedayi, A.A.; Sadia, S. Recent advances in molecular techniques for the identification of phytopathogenic fungi—A mini review. J. Plant Interact. 2017, 12, 493–504. [Google Scholar] [CrossRef] [Green Version]
- Abrahamian, P.E.; Seblani, R.; Sobh, H.; Abou-Jawdah, Y. Detection and quantitation of two cucurbit criniviruses in mixed infection by real-time RT-PCR. J. Virol. Methods 2013, 193, 320–326. [Google Scholar] [CrossRef]
- Okuda, S.; Okuda, M.; Sugiyama, M.; Sakata, Y.; Takeshita, M.; Iwai, H. Resistance in melon to Cucurbit chlorotic yellows virus, a whitefly-transmitted crinivirus. Eur. J. Plant Pathol. 2013, 135, 313–321. [Google Scholar] [CrossRef]
- Notomi, T.; Okayama, H.; Masubuchi, H.; Yonekawa, T.; Watanabe, K.; Amino, N.; Hase, T. Loop-mediated isothermal amplification of DNA. Nucleic Acids Res. 2000, 28, e63. [Google Scholar] [CrossRef] [PubMed] [Green Version]
- Mori, Y.; Notomi, T. Loop-mediated isothermal amplification (LAMP): A rapid, accurate, and cost-effective diagnostic method for infectious. J. Infect. Chemother. 2009, 15, 62–69. [Google Scholar] [CrossRef] [PubMed]
- Khan, M.; Wang, R.; Li, B.; Liu, P.; Weng, Q.; Chen, Q. Comparative evaluation of the LAMP assay and PCR-based assays for the rapid detection of Alternaria solani. Front. Microbiol. 2018, 9, 2089. [Google Scholar] [CrossRef] [PubMed]
- Lau, H.Y.; Botella, J.R. Advanced DNA-based point-of-care diagnostic methods for plant diseases detection. Front. Plant Sci. 2017, 8, 2016. [Google Scholar] [CrossRef] [PubMed]
- Kil, E.-J.; Kim, S.; Lee, Y.-J.; Kang, E.-H.; Lee, M.; Cho, S.-H.; Kim, M.-K.; Lee, K.-Y.; Heo, N.-Y.; Choi, H.-S.; et al. Advanced loop-mediated isothermal amplification method for sensitive and specific detection of Tomato chlorosis virus using a uracil DNA glycosylase to control carry-over contamination. J. Virol. Methods 2015, 213, 68–74. [Google Scholar] [CrossRef]
- Zhao, L.; Hao, X.; Liu, H.; Wang, Q.; Wu, Y. Rapid detection of Turnip mosaic virus by reverse transcription loop-mediated isothermal amplification. J. Phytopathol. 2014, 162, 693–696. [Google Scholar] [CrossRef]
- Zhao, L.; Liu, Y.; Wu, Y.; Hao, X. Rapid detection of watermelon viruses by reverse transcription loop-mediated isothermal amplification. J. Phytopathol. 2016, 164, 330–336. [Google Scholar] [CrossRef]
- Syller, J. Facilitative and antagonistic interactions between plant viruses in mixed infections. Mol. Plant Pathol. 2012, 13, 204–216. [Google Scholar] [CrossRef]
- Hindson, B.J.; Ness, K.D.; Masquelier, D.A.; Belgrader, P.; Heredia, N.J.; Makarewicz, A.J.; Bright, I.J.; Lucero, M.Y.; Hiddessen, A.L.; Legler, T.C.; et al. High-throughput droplet digital PCR system for absolute quantitation of DNA copy number. Anal. Chem. 2011, 83, 8604–8610. [Google Scholar] [CrossRef]
- Rane, T.D.; Chen, L.; Zec, H.C.; Wang, T.-H. Microfluidic continuous flow digital loop-mediated isothermal amplification (LAMP). Lab Chip 2015, 15, 776–782. [Google Scholar] [CrossRef] [PubMed] [Green Version]
- Zhou, Q.-J.; Wang, L.; Chen, J.; Wang, R.-N.; Shi, Y.-H.; Li, C.-H.; Zhang, D.-M.; Yan, X.-J.; Zhang, Y.-J. Development and evaluation of real-time fluorogenic loop-mediated isothermal amplification assay integrated on a microfluidic disc chip (on-chip LAMP) for rapid and simultaneous detection of ten pathogenic bacteria in aquatic animals. J. Microbiol. Methods 2014, 104, 26–35. [Google Scholar] [CrossRef] [PubMed]
- Sayad, A.; Ibrahim, F.; Uddin, S.M.; Cho, J.; Madou, M.; Thong, K.L. A microdevice for rapid monoplex and colorimetric detection of foodborne pathogens using a centrifugal microfluidic platform. Biosens. Bioelectron. 2018, 100, 96–104. [Google Scholar] [CrossRef]
- Liu, C.; Mauk, M.G.; Hart, R.; Bonizzoni, M.; Yan, G.; Bau, H.H. A low-cost microfluidic chip for rapid genotyping of malaria-transmitting mosquitoes. PLoS ONE 2012, 7, e42222. [Google Scholar] [CrossRef] [PubMed] [Green Version]
- Chen, W.; Yu, H.; Sun, F.; Ornob, A.; Brisbin, R.; Ganguli, A.; Vemuri, V.; Strzebonski, P.; Cui, G.; Allen, K.J.; et al. Mobile platform for multiplexed detection and differentiation of disease-specific nucleic acid sequences, using microfluidic loop-mediated isothermal amplification and smartphone detection. Anal. Chem. 2017, 89, 11219–11226. [Google Scholar] [CrossRef] [PubMed]
- Ottesen, E.A.; Hong, J.W.; Quake, S.R.; Leadbetter, J.R. Microfluidic digital PCR enables multigene analysis of individual environmental bacteria. Science 2006, 314, 1464–1467. [Google Scholar] [CrossRef] [PubMed] [Green Version]
- Strook, A.D.; Dertinger, S.K.W.; Ajdari, A.; Mezić, I.; Stone, H.A.; Whitesides, G.M. Chaotic mixer for microchannels. Science 2002, 295, 647–651. [Google Scholar] [CrossRef] [Green Version]
- Yildirim, E.; Trietsch, S.J.; Joore, J.; van den Berg, A.; Hankemeier, T.; Vulto, P. Phaseguides as turnable passive microvalves for liquid routing in complex microfluidic networks. Lab Chip 2014, 14, 3334–3340. [Google Scholar] [CrossRef]
- Garbarino, F.; Kistrup, K.; Rizzi, G.; Hansen, M.F. Burst pressure of phaseguide structures of different heights in all-polymer microfluidic channels. J. Micromech. Microeng. 2017, 27, aa97b7. [Google Scholar] [CrossRef] [Green Version]
- Fischbach, J.; Xander, N.C.; Frohme, M.; Glökler, J.F. Shining a light on LAMP assays—A comparison of LAMP visualization methods including the novel use of berberine. BioTechniques 2015, 58, 189–194. [Google Scholar] [CrossRef] [Green Version]
- Xu, L.; Hong, S.; Sun, N.; Wang, K.; Zhou, L.; Ji, L.; Pei, R. Berberine as a novel light-up i-motif fluorescence ligand and its application in designing molecular logic systems. Chem. Commun. 2016, 52, 179–182. [Google Scholar] [CrossRef] [PubMed]
- Cai, G.; Xue, L.; Zhang, H.; Lin, J. A review on micromixers. Micromachines 2017, 8, 274. [Google Scholar] [CrossRef] [PubMed]
- Culbertson, C.T.; Jacobson, S.C.; Ramsey, M. Diffusion coefficient measurements in microfluidic devices. Talanta 2002, 56, 365–373. [Google Scholar] [CrossRef]
- Suzuki, R.; Kato, M.; Fukuta, S.; Oyabu, T.; Saka, N. Selection of resistant tomato strains by simple inoculation method using Tomato yellow leaf curl virus infectious clones. Hortic. Res. (Jpn.) 2019, 18, 363–371. (In Japanese) [Google Scholar] [CrossRef] [Green Version]
- Takeuchi, Y.; Fukuta, S.; Oya, T. Detection of melon yellow spot virus by reverse transcription loop-mediated isothermal amplification. Res. Bull. Aichi Agric. Res. Cent. 2006, 38, 57–63. (In Japanese) [Google Scholar]
- Fukuta, S.; Takeyama, K.; Suzuki, M.; Shichi, A.; Ichikawa, K.; Nakanishi, H. Detection of kyuri green mottle virus from soil by immnocapture reverse transcription loop-mediated isothermal amplification reaction. Plant Pathol. J. 2012, 11, 51–59. [Google Scholar] [CrossRef]
- Fukuta, S.; Nimi, Y.; Ohishi, K.; Yoshimura, Y.; Anai, N.; Hotta, M.; Fukaya, M.; Kato, T.; Oya, T.; Kanbe, M. Development of reverse transcription loop-mediated isothermal amplification (RT-LAMP) method for detection of two viruses and chrysanthemum stunt viroid. Ann. Rep. Kansai PI Prot. 2005, 47, 31–36. (In Japanese) [Google Scholar] [CrossRef]
- Zeng, R.; Xu, L.-H.; Gau, S.-G.; Ni, X.-H.; Chen, C.-L.; Chen, J.-C.; Dai, F.-M. One-step reverse transcription loop-mediated isothermal amplification assay for rapid detection of melon yellow spot virus. Eur. J. Plant Pathol. 2016, 145, 119–124. [Google Scholar] [CrossRef]
- Wang, Z.; Gu, Q.; Sun, H.; Li, H.; Sun, B.; Liang, X.; Yuan, Y.; Liu, R.; Shi, Y. One-step reverse transcription loop mediated isothermal amplification assay for sensitive and rapid detection of Cucurbit chlorotic yellows virus. J. Virol. Methods 2014, 195, 63–66. [Google Scholar] [CrossRef]


© 2020 by the authors. Licensee MDPI, Basel, Switzerland. This article is an open access article distributed under the terms and conditions of the Creative Commons Attribution (CC BY) license (http://creativecommons.org/licenses/by/4.0/).
Share and Cite
Natsuhara, D.; Takishita, K.; Tanaka, K.; Kage, A.; Suzuki, R.; Mizukami, Y.; Saka, N.; Nagai, M.; Shibata, T. A Microfluidic Diagnostic Device Capable of Autonomous Sample Mixing and Dispensing for the Simultaneous Genetic Detection of Multiple Plant Viruses. Micromachines 2020, 11, 540. https://doi.org/10.3390/mi11060540
Natsuhara D, Takishita K, Tanaka K, Kage A, Suzuki R, Mizukami Y, Saka N, Nagai M, Shibata T. A Microfluidic Diagnostic Device Capable of Autonomous Sample Mixing and Dispensing for the Simultaneous Genetic Detection of Multiple Plant Viruses. Micromachines. 2020; 11(6):540. https://doi.org/10.3390/mi11060540
Chicago/Turabian StyleNatsuhara, Daigo, Keisuke Takishita, Kisuke Tanaka, Azusa Kage, Ryoji Suzuki, Yuko Mizukami, Norikuni Saka, Moeto Nagai, and Takayuki Shibata. 2020. "A Microfluidic Diagnostic Device Capable of Autonomous Sample Mixing and Dispensing for the Simultaneous Genetic Detection of Multiple Plant Viruses" Micromachines 11, no. 6: 540. https://doi.org/10.3390/mi11060540