Individualized Meal Replacement Therapy Improves Clinically Relevant Long-Term Glycemic Control in Poorly Controlled Type 2 Diabetes Patients

 , ,
, ,
Abstract
:1. Introduction
2. Materials and Methods
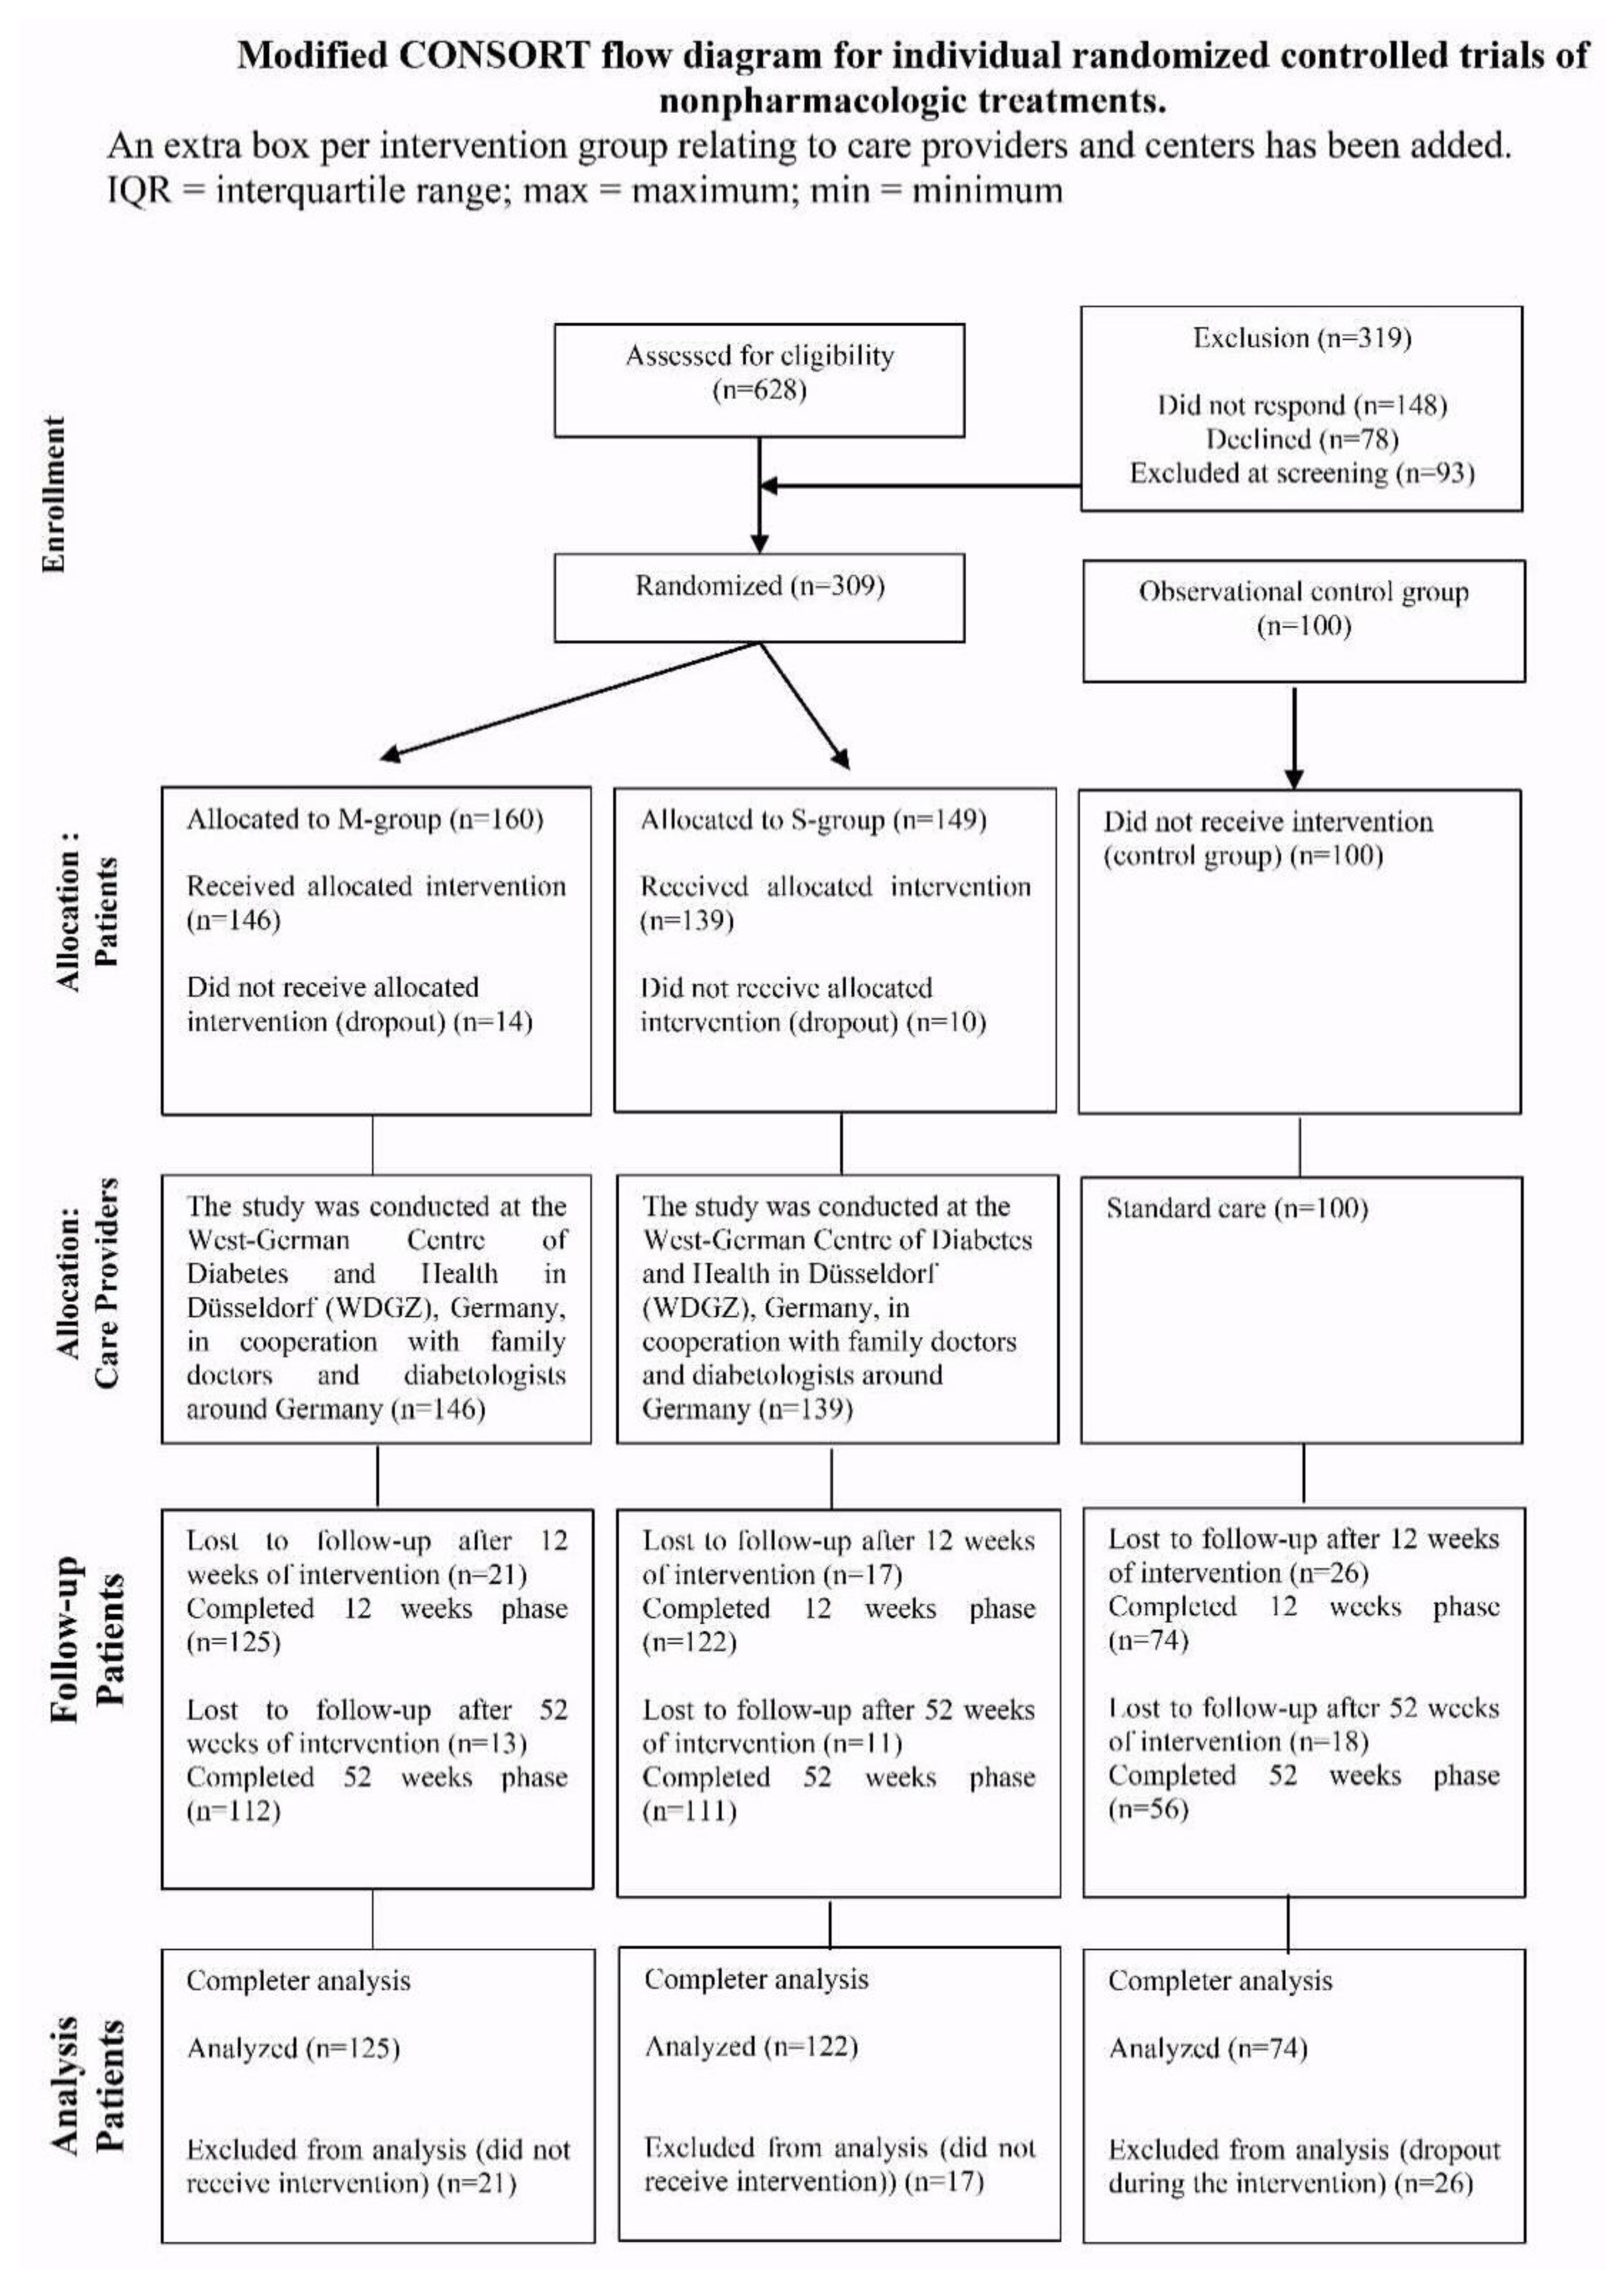
2.1. Study Design
2.2. Study Population
2.3. Intervention
2.4. Outcomes and Measurements
2.5. Diet Regimen
2.6. Statistics
3. Results
4. Discussion
Supplementary Materials
Author Contributions
Funding
Acknowledgments
Conflicts of Interest
References
- Dunkley, A.J.; Bodicoat, D.H.; Greaves, C.J.; Russell, C.; Yates, T.; Davies, M.J.; Khunti, K. Diabetes prevention in the real world: Effectiveness of pragmatic lifestyle interventions for the prevention of type 2 diabetes and of the impact of adherence to guideline recommendations: A systematic review and meta-analysis. Diabetes Care 2014, 37, 922–933. [Google Scholar] [CrossRef] [PubMed]
- Rise, M.B.; Pellerud, A.; Rygg, L.O.; Steinsbekk, A. Making and maintaining lifestyle changes after participating in group based type 2 diabetes self-management educations: A qualitative study. PLoS ONE 2013, 8, e64009. [Google Scholar] [CrossRef] [PubMed] [Green Version]
- Giorgino, F.; Home, P.D.; Tuomilehto, J. Glucose Control and Vascular Outcomes in Type 2 Diabetes: Is the Picture Clear? Diabetes Care 2016, 39 (Suppl. S2), S187–S195. [Google Scholar] [CrossRef] [PubMed]
- U.K. Prospective Diabetes Study Group. U.K. prospective diabetes study 16. Overview of 6 years’ therapy of type II diabetes: A progressive disease. U.K. Prospective Diabetes Study Group. Diabetes 1995, 44, 1249–1258. [Google Scholar] [CrossRef]
- Yki-Jarvinen, H.; Ryysy, L.; Kauppila, M.; Kujansuu, E.; Lahti, J.; Marjanen, T.; Niskanen, L.; Rajala, S.; Salo, S.; Seppala, P.; et al. Effect of obesity on the response to insulin therapy in noninsulin-dependent diabetes mellitus. J. Clin. Endocrinol. Metab. 1997, 82, 4037–4043. [Google Scholar] [CrossRef] [PubMed]
- Gloy, V.L.; Briel, M.; Bhatt, D.L.; Kashyap, S.R.; Schauer, P.R.; Mingrone, G.; Bucher, H.C.; Nordmann, A.J. Bariatric surgery versus non-surgical treatment for obesity: A systematic review and meta-analysis of randomised controlled trials. BMJ 2013, 347, f5934. [Google Scholar] [CrossRef] [PubMed] [Green Version]
- Ackerman, N.B. Observations on the improvements in carbohydrate metabolism in diabetic and other morbidly obese patients after jejunoileal bypass. Surg. Gynecol. Obstet. 1981, 152, 581–586. [Google Scholar] [PubMed]
- Backman, O.; Stockeld, D.; Rasmussen, F.; Naslund, E.; Marsk, R. Alcohol and substance abuse, depression and suicide attempts after Roux-en-Y gastric bypass surgery. Br. J. Surg. 2016, 103, 1336–1342. [Google Scholar] [CrossRef] [PubMed]
- Colquitt, J.L.; Pickett, K.; Loveman, E.; Frampton, G.K. Surgery for weight loss in adults. Cochrane Database Syst. Rev. 2014, 8, Cd003641. [Google Scholar] [CrossRef] [PubMed]
- Jackness, C.; Karmally, W.; Febres, G.; Conwell, I.M.; Ahmed, L.; Bessler, M.; McMahon, D.J.; Korner, J. Very low-calorie diet mimics the early beneficial effect of Roux-en-Y gastric bypass on insulin sensitivity and beta-cell Function in type 2 diabetic patients. Diabetes 2013, 62, 3027–3032. [Google Scholar] [CrossRef] [PubMed]
- Steven, S.; Hollingsworth, K.G.; Al-Mrabeh, A.; Avery, L.; Aribisala, B.; Caslake, M.; Taylor, R. Very Low-Calorie Diet and 6 Months of Weight Stability in Type 2 Diabetes: Pathophysiological Changes in Responders and Nonresponders. Diabetes Care 2016, 39, 808–815. [Google Scholar] [CrossRef] [PubMed] [Green Version]
- Kempf, K.; Schloot, N.C.; Gartner, B.; Keil, R.; Schadewaldt, P.; Martin, S. Meal replacement reduces insulin requirement, HbA1c and weight long-term in type 2 diabetes patients with >100 U insulin per day. J. Hum. Nutr. Diet. 2014, 27 (Suppl. S2), 21–27. [Google Scholar] [CrossRef] [PubMed]
- Lean, M.E.; Leslie, W.S.; Barnes, A.C.; Brosnahan, N.; Thom, G.; McCombie, L.; Peters, C.; Zhyzhneuskaya, S.; Al-Mrabeh, A.; Hollingsworth, K.G.; et al. Primary care-led weight management for remission of type 2 diabetes (DiRECT): An open-label, cluster-randomised trial. Lancet 2017. [Google Scholar] [CrossRef]
- Lim, E.L.; Hollingsworth, K.G.; Aribisala, B.S.; Chen, M.J.; Mathers, J.C.; Taylor, R. Reversal of type 2 diabetes: Normalisation of beta cell function in association with decreased pancreas and liver triacylglycerol. Diabetologia 2011, 54, 2506–2514. [Google Scholar] [CrossRef] [PubMed]
- Steven, S.; Taylor, R. Restoring normoglycaemia by use of a very low calorie diet in long- and short-duration Type 2 diabetes. Diabet. Med. 2015, 32, 1149–1155. [Google Scholar] [CrossRef] [PubMed] [Green Version]
- Kempf, K.; Altpeter, B.; Berger, J.; Reuss, O.; Fuchs, M.; Schneider, M.; Gartner, B.; Niedermeier, K.; Martin, S. Efficacy of the Telemedical Lifestyle intervention Program TeLiPro in Advanced Stages of Type 2 Diabetes: A Randomized Controlled Trial. Diabetes Care 2017, 40, 863–871. [Google Scholar] [CrossRef] [PubMed] [Green Version]
- Kempf, K.; Kruse, J.; Martin, S. ROSSO-in-praxi follow-up: Long-term effects of self-monitoring of blood glucose on weight, hemoglobin A1c, and quality of life in patients with type 2 diabetes mellitus. Diabetes Technol. Ther. 2012, 14, 59–64. [Google Scholar] [CrossRef] [PubMed]
- Thomas, D.E.; Elliott, E.J.; Naughton, G.A. Exercise for type 2 diabetes mellitus. Cochrane Database Syst. Rev. 2006, 3, Cd002968. [Google Scholar] [CrossRef] [PubMed]
- den Braver, N.R.; de Vet, E.; Duijzer, G.; Ter Beek, J.; Jansen, S.C.; Hiddink, G.J.; Feskens, E.J.M.; Haveman-Nies, A. Determinants of lifestyle behavior change to prevent type 2 diabetes in high-risk individuals. Int. J. Behav. Nutr. Phys. Act. 2017, 14, 78. [Google Scholar] [CrossRef] [PubMed]
- Gower, B.A.; Goss, A.M. A lower-carbohydrate, higher-fat diet reduces abdominal and intermuscular fat and increases insulin sensitivity in adults at risk of type 2 diabetes. J. Nutr. 2015, 145, 177s–183s. [Google Scholar] [CrossRef] [PubMed]
- Qian, F.; Korat, A.A.; Malik, V.; Hu, F.B. Metabolic Effects of Monounsaturated Fatty Acid-Enriched Diets Compared With Carbohydrate or Polyunsaturated Fatty Acid-Enriched Diets in Patients with Type 2 Diabetes: A Systematic Review and Meta-analysis of Randomized Controlled Trials. Diabetes Care 2016, 39, 1448–1457. [Google Scholar] [CrossRef] [PubMed]
- Snorgaard, O.; Poulsen, G.M.; Andersen, H.K.; Astrup, A. Systematic review and meta-analysis of dietary carbohydrate restriction in patients with type 2 diabetes. BMJ Open Diabetes Res. Care 2017, 5, e000354. [Google Scholar] [CrossRef] [PubMed] [Green Version]
- Wheeler, M.L.; Dunbar, S.A.; Jaacks, L.M.; Karmally, W.; Mayer-Davis, E.J.; Wylie-Rosett, J.; Yancy, W.S., Jr. Macronutrients, food groups, and eating patterns in the management of diabetes: A systematic review of the literature, 2010. Diabetes Care 2012, 35, 434–445. [Google Scholar] [CrossRef] [PubMed]
- Rubino, F.; Forgione, A.; Cummings, D.E.; Vix, M.; Gnuli, D.; Mingrone, G.; Castagneto, M.; Marescaux, J. The mechanism of diabetes control after gastrointestinal bypass surgery reveals a role of the proximal small intestine in the pathophysiology of type 2 diabetes. Ann. Surg. 2006, 244, 741–749. [Google Scholar] [CrossRef] [PubMed]
- Urbanova, M.; Mraz, M.; Durovcova, V.; Trachta, P.; Klouckova, J.; Kavalkova, P.; Haluzikova, D.; Lacinova, Z.; Hansikova, H.; Wenchich, L.; et al. The effect of very-low-calorie diet on mitochondrial dysfunction in subcutaneous adipose tissue and peripheral monocytes of obese subjects with type 2 diabetes mellitus. Physiol. Res. 2017, 66, 811–822. [Google Scholar] [PubMed]
- Esposito, K.; Maiorino, M.I.; Ciotola, M.; Di Palo, C.; Scognamiglio, P.; Gicchino, M.; Petrizzo, M.; Saccomanno, F.; Beneduce, F.; Ceriello, A.; et al. Effects of a Mediterranean-style diet on the need for antihyperglycemic drug therapy in patients with newly diagnosed type 2 diabetes: A randomized trial. Ann. Intern. Med. 2009, 151, 306–314. [Google Scholar] [CrossRef] [PubMed]
- Kahleova, H.; Belinova, L.; Malinska, H.; Oliyarnyk, O.; Trnovska, J.; Skop, V.; Kazdova, L.; Dezortova, M.; Hajek, M.; Tura, A.; et al. Eating two larger meals a day (breakfast and lunch) is more effective than six smaller meals in a reduced-energy regimen for patients with type 2 diabetes: A randomised crossover study. Diabetologia 2014, 57, 1552–1560. [Google Scholar] [CrossRef] [PubMed]
- Salas-Salvado, J.; Bullo, M.; Babio, N.; Martinez-Gonzalez, M.A.; Ibarrola-Jurado, N.; Basora, J.; Estruch, R.; Covas, M.I.; Corella, D.; Aros, F.; et al. Reduction in the incidence of type 2 diabetes with the Mediterranean diet: Results of the PREDIMED-Reus nutrition intervention randomized trial. Diabetes Care 2011, 34, 14–19. [Google Scholar] [CrossRef] [PubMed]
- Estruch, R.; Ros, E.; Salas-Salvado, J.; Covas, M.I.; Corella, D.; Aros, F.; Gomez-Gracia, E.; Ruiz-Gutierrez, V.; Fiol, M.; Lapetra, J.; et al. Primary prevention of cardiovascular disease with a Mediterranean diet. N. Engl. J. Med. 2013, 368, 1279–1290. [Google Scholar] [CrossRef] [PubMed]
- Estruch, R.; Martinez-Gonzalez, M.A.; Corella, D.; Salas-Salvado, J.; Fito, M.; Chiva-Blanch, G.; Fiol, M.; Gomez-Gracia, E.; Aros, F.; Lapetra, J.; et al. Effect of a high-fat Mediterranean diet on bodyweight and waist circumference: A prespecified secondary outcomes analysis of the PREDIMED randomised controlled trial. Lancet Diabetes Endocrinol. 2016, 4, 666–676. [Google Scholar] [CrossRef]
- Leslie, W.S.; Taylor, R.; Harris, L.; Lean, M.E. Weight losses with low-energy formula diets in obese patients with and without type 2 diabetes: Systematic review and meta-analysis. Int. J. Obes. (Lond.) 2017, 41, 96–101. [Google Scholar] [CrossRef] [PubMed]
- Rehackova, L.; Araujo-Soares, V.; Adamson, A.J.; Steven, S.; Taylor, R.; Sniehotta, F.F. Acceptability of a very-low-energy diet in Type 2 diabetes: Patient experiences and behaviour regulation. Diabet. Med. 2017. [Google Scholar] [CrossRef] [PubMed]
- Stefan, N.; Haring, H.U.; Schulze, M.B. Metabolically healthy obesity: The low-hanging fruit in obesity treatment? Lancet Diabetes Endocrinol. 2017. [Google Scholar] [CrossRef]
- Banasik, J.L.; Walker, M.K.; Randall, J.M.; Netjes, R.B.; Foutz, M.S. Low-calorie diet induced weight loss may alter regulatory hormones and contribute to rebound visceral adiposity in obese persons with a family history of type-2 diabetes. J. Am. Assoc. Nurse Pract. 2013, 25, 440–448. [Google Scholar] [CrossRef] [PubMed]
- Garcia-Perez, L.E.; Alvarez, M.; Dilla, T.; Gil-Guillen, V.; Orozco-Beltran, D. Adherence to therapies in patients with type 2 diabetes. Diabetes Ther. 2013, 4, 175–194. [Google Scholar] [CrossRef] [PubMed]
- Shultz, J.A.; Sprague, M.A.; Branen, L.J.; Lambeth, S. A comparison of views of individuals with type 2 diabetes mellitus and diabetes educators about barriers to diet and exercise. J. Health Commun. 2001, 6, 99–115. [Google Scholar] [CrossRef] [PubMed]
- Sellahewa, L.; Khan, C.; Lakkunarajah, S.; Idris, I. A Systematic Review of Evidence on the Use of Very Low Calorie Diets in People with Diabetes. Curr. Diabetes Rev. 2017, 13, 35–46. [Google Scholar] [CrossRef] [PubMed]
- Cerrelli, F.; Manini, R.; Forlani, G.; Baraldi, L.; Melchionda, N.; Marchesini, G. Eating behavior affects quality of life in type 2 diabetes mellitus. Eat. Weight Disord. 2005, 10, 251–257. [Google Scholar] [CrossRef] [PubMed]
- Carbonneau, E.; Royer, M.M.; Richard, C.; Couture, P.; Desroches, S.; Lemieux, S.; Lamarche, B. Effects of the Mediterranean Diet before and after Weight Loss on Eating Behavioral Traits in Men with Metabolic Syndrome. Nutrients 2017, 9, 305. [Google Scholar] [CrossRef] [PubMed]
- Miller, C.K.; Kristeller, J.L.; Headings, A.; Nagaraja, H. Comparison of a mindful eating intervention to a diabetes self-management intervention among adults with type 2 diabetes: A randomized controlled trial. Health Educ. Behav. 2014, 41, 145–154. [Google Scholar] [CrossRef] [PubMed]
- Shirai, K.; Saiki, A.; Oikawa, S.; Teramoto, T.; Yamada, N.; Ishibashi, S.; Tada, N.; Miyazaki, S.; Inoue, I.; Murano, S.; et al. The effects of partial use of formula diet on weight reduction and metabolic variables in obese type 2 diabetic patients-multicenter trial. Obes. Res. Clin. Pract. 2013, 7, e43–e54. [Google Scholar] [CrossRef] [PubMed]


| M-Group (n = 125) | S-Group (n = 122) | Control Group (n = 74) | |
|---|---|---|---|
| Sex (% male) | 46.4 | 52.5 | 52.7 |
| Age (years) | 60 ± 10 | 59 ± 9 | 60 ± 8 |
| Weight (kg) | 110 ± 24 | 107 ± 20 | 111 ± 21 |
| BMI (kg/m2) | 37.5 ± 7.6 | 36.1 ± 5.9 | 37.0 ± 6.7 |
| HbA1c (%) | 8.4 ± 1.1 | 8.4 ± 1.2 | 8.2 ± 1.2 |
| Known diabetes duration (years) | 9 ± 6 | 8 ± 7 | 11 ± 8 ‡,ⱡ |
| FBG (mg/dL) | 181 ± 53 | 178 ± 63 | 179 ± 54 |
| SBP (mmHg) | 135 ± 17 | 134 ± 14 | 134 ± 13 |
| DBP (mmHg) | 82 ± 8 | 80 ± 8 | 81 ± 9 |
| Total cholesterol (mg/dL) | 200 ± 52 | 198 ± 43 | 194 ± 48 |
| HDL (mg/dL) | 46 ± 10 | 47 ± 11 | 47 ± 11 |
| LDL (mg/dL) | 118 ± 32 | 119 ± 37 | 117 ± 36 |
| Triglyceride (mg/dL) | 383 ± 586 | 220 ± 157 | 194 ± 113 |
| TFEQ [cognitive control] (au) | 10 (7; 13) | 10 (7; 13) | 7 (6; 8) ⱡⱡ, ‡‡ |
| TFEQ [suggestibility] (au) | 7 (5; 10) | 7 (4; 10) | 5 (3; 6) ⱡⱡ, ‡‡ |
| TFEQ [hunger] (au) | 6 (4; 9) | 5 (3; 9) | 5 (4; 8) |
| SF36 [physical health] (au) | 42 (35; 50) | 42 (34; 51) | 40 (31; 52) |
| SF36 [mental health] (au) | 49 (38; 57) | 49 (32; 57) | 39 (35; 42) ⱡⱡ,‡‡ |
| 12 Weeks | 52 Weeks | |||||
|---|---|---|---|---|---|---|
| S-Group (n = 122) | M-Group (n = 125) | P | S-Group (n = 111) | M-Group (n = 112) | P | |
| Sex (% male) | 52.5 | 46.4 | 0.374 | 50.4 | 46.3 | 0.593 |
| Age (years) | 59 ± 9 | 60 ± 10 | 0.966 | 59 ± 9 | 60 ± 10 | 0.523 |
| Weight (kg) | 103 ± 22 | 103 ± 23 | 0.333 | 98 ± 17 | 101 ± 23 | 0.245 |
| BMI (kg/m2) | 33.9 ± 5.6 | 35.1 ± 7.5 | 0.108 | 33.2 ± 5.1 | 34.8 ± 7.6 | 0.074 |
| HbA1c (%) | 7.5 ± 1.3 | 7.6 ± 1.1 | 0.539 | 7.6 ± 1.3 | 7.9 ± 1.4 | 0.085 |
| Known diabetes duration (years) | 7.7 ± 6.6 | 8.6 ± 6.4 | 0.265 | 7.3 ± 5.2 | 8.9 ± 6.6 | 0.053 |
| FBG (mg/dL) | 154 ± 54 | 157 ± 50 | 0.673 | 156 ± 51 | 165 ± 52 | 0.163 |
| RR [syst] (mmHg) | 128 ± 14 | 129 ± 16 | 0.404 | 128 ± 14 | 129 ± 13 | 0.507 |
| RR [dia] (mmHg) | 77 ± 8 | 79 ± 8 | 0.082 | 77 ± 8 | 78 ± 8 | 0.339 |
| Total cholesterol (mg/dL) | 191 ± 43 | 190 ± 38 | 0.829 | 198 ± 50 | 194 ± 48 | 0.571 |
| HDL (mg/dL) | 47 ± 10 | 46 ± 11 | 0.661 | 51 ± 36 | 47 ± 12 | 0.253 |
| LDL (mg/dL) | 116 ± 36 | 112 ± 31 | 0.357 | 120 ± 37 | 111 ± 33 | 0.054 |
| Triglyceride (mg/dL) | 193 ± 111 | 205 ± 193 | 0.564 | 190 ± 102 | 368 ± 534 | 0.025 |
| TFEQ [cognitive control] (au) | 13 (9; 16) | 13 (9; 16) | 0.590 | 13 (9; 16) | 13 (9; 16) | 0.704 |
| TFEQ [suggestibility] (au) | 5 (3; 8) | 6 (3; 10) | 0.313 | 6 (4; 8) | 6 (4; 9) | 0.189 |
| TFEQ [hunger] (au) | 3 (2; 6) | 4 (2; 8) | 0.131 | 3 (1; 6) | 5 (2; 8) | 0.034 |
| SF36 [physical health] (au) | 46 (38; 53) | 46 (35; 52) | 0.277 | 46 (37; 52) | 42 (34; 52) | 0.052 |
| SF36 [mental health] (au) | 51 (35; 58) | 52 (38; 58) | 0.330 | 49 (29; 56) | 52 (37; 58) | 0.074 |
| No medication (%) | 8.2 | 6.4 | 0.632 | 8.2 | 4.5 | 0.285 |
| Metformin (%) | 76.2 | 81.6 | 0.350 | 76.2 | 80.4 | 0.625 |
| DPP4 inhibitors (%) | 23.8 | 29.6 | 0.317 | 23.8 | 33.9 | 0.187 |
| Sulfonylureas (%) | 1.6 | 4.0 | 0.447 | 1.6 | 8.9 | 0.285 |
| Glinides (%) | 0 | 0 | NA | 0 | 2.7 | 0.622 |
| Glitazone (%) | 0 | 0 | NA | 0 | 0.9 | 0.990 |
| Glucosidase inhibitors (%) | 0 | 0 | NA | 0.9 | 0 | 0.990 |
| GLP-1 receptor agonists (%) | 9.0 | 11.2 | 0.674 | 9.0 | 11.6 | 0.661 |
| Sodium-glucose co-transporter-2 (%) | 0.8 | 0.8 | 0.990 | 0.9 | 0.9 | 0.990 |
| Insulin (%) | 18.9 | 13.6 | 0.302 | 18.9 | 15.3 | 0.140 |
| M-Group (n = 125) | S-Group (n = 122) | p | |
|---|---|---|---|
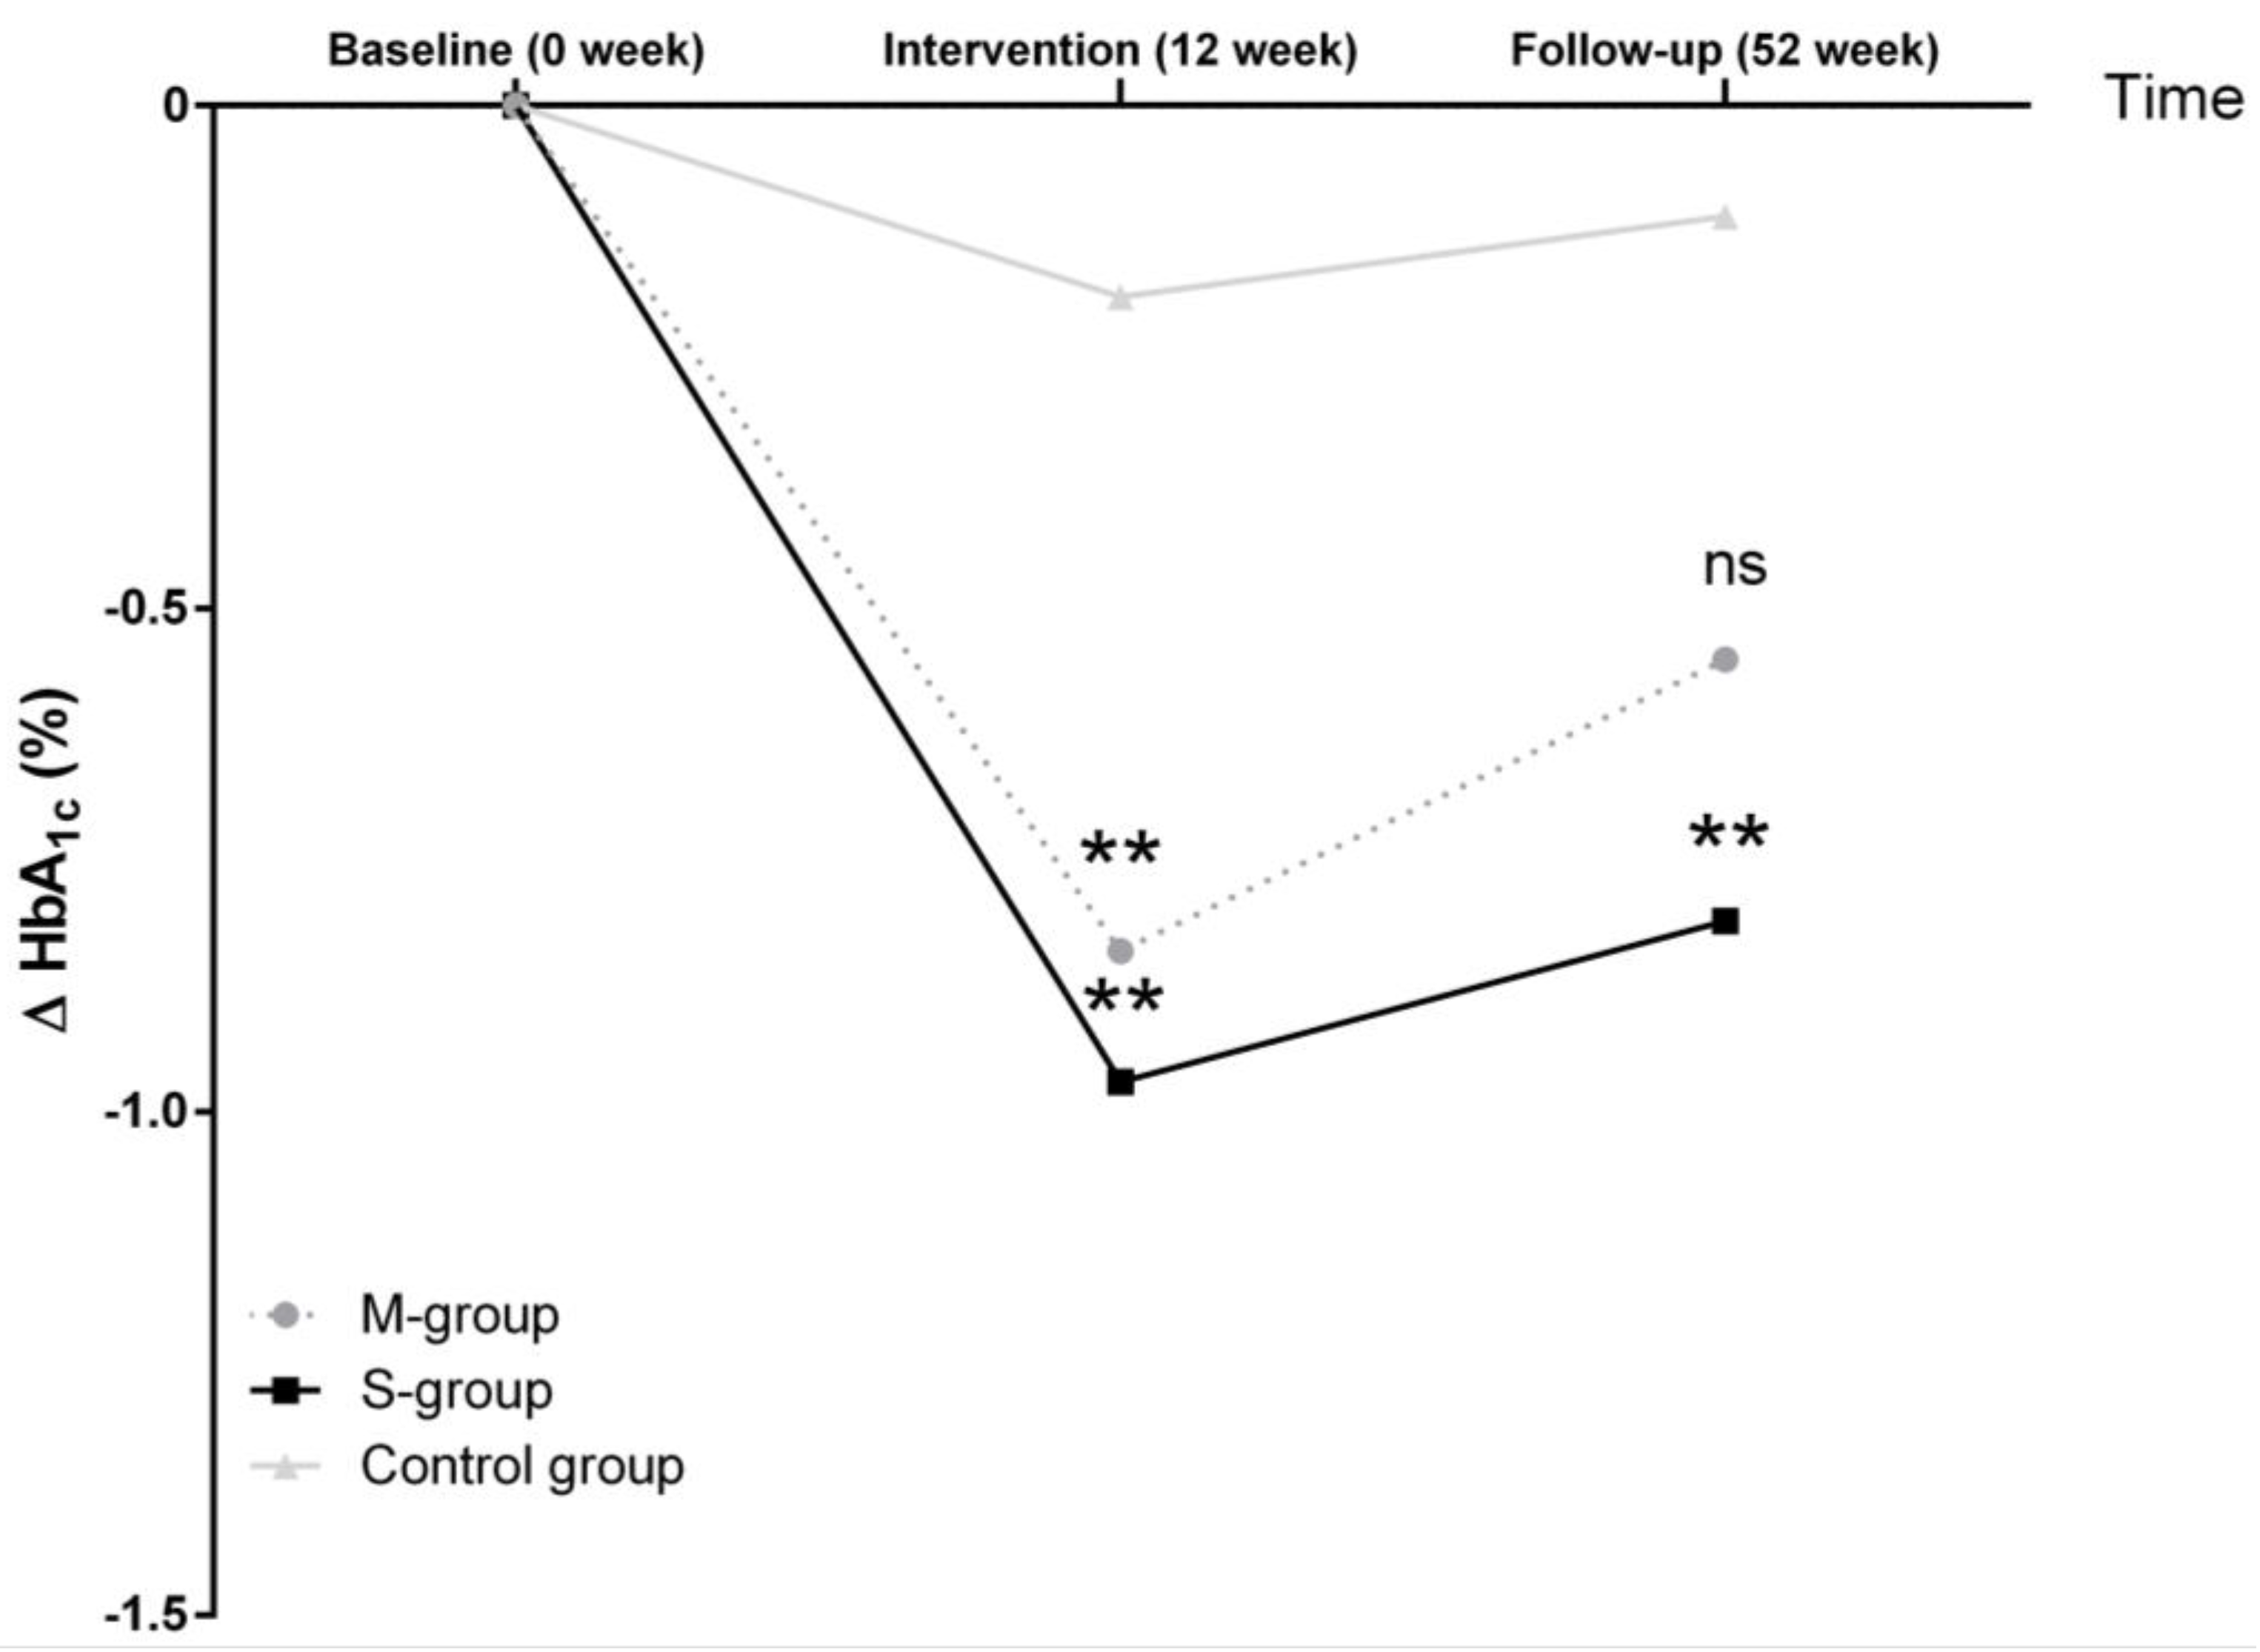
| HbA1c (%) | 8.4 ± 1.1 | 8.4 ± 1.2 | |
| Δ HbA1c (%) 12 weeks | −0.84 [−1.08; −0.61] ***,a | −0.97 [−1.21; −0.74] ***,a | 0.538 |
| Δ HbA1c (%) 52 weeks | −0.55 [−0.80; −0.29] ***,a | −0.81 [−1.06; −0.55] ***,a | 0.149 |
| Weight (kg) | 110 ± 24 | 107 ± 20 | |
| Δ Weight (kg) 12 weeks | −6.93 [−8.08; −5.78] ***,a | −6.91 [−8.07; −5.76] ***,a | 0.999 |
| Δ Weight (kg) 52 weeks | −7.30 [−8.65; −5.95] ***,a | −7.45 [−8.80; −6.10] ***,a | 0.615 |
| BMI (kg/m2) | 37.5 ± 7.6 | 36.1 ± 5.9 | |
| Δ BMI (kg/m2) 12 weeks | −2.38 [−2.78; −1.98] ***,a | −2.35 [−2.75; −1.95] ***,a | 0.911 |
| Δ BMI (kg/m2) 52 weeks | −2.36 [−2.84; −1.88] ***,a | −2.50 [−2.98; −2.02] ***,a | 0.536 |
| FBG (mg/dL) | 181 ± 53 | 178 ± 63 | |
| Δ FBG (mg/dL) 12 weeks | −24 [−34; −13] ***,a | −25 [−36; −15] ***,a | 0.791 |
| Δ FBG (mg/dL) 52 weeks | −17 [−30; −5] ** | −22 [−35; −10] ***,a | 0.196 |
| SBP (mmHg) | 136 ± 17 | 134 ± 14 | |
| Δ SBP (mmHg) 12 weeks | −5.6 [−8.7; −2.5] ***,a | −6.6 [−9.7; −3.5] ***,a | 0.512 |
| Δ SBP (mmHg) 52 weeks | −6.0 [−9.3; −2.7] ***,a | −5.8 [−9.1; −2.5] ***,a | 0.858 |
| DBP (mmHg) | 82 ± 8 | 80 ± 8 | |
| Δ DBP (mmHg) 12 weeks | −2.9 [−4.5; −1.3] ***,a | −3.0 [−4.6; −1.4] ***,a | 0.371 |
| Δ DBP (mmHg) 52 weeks | −3.7 [−5.6; −1.9] ***,a | −2.9 [−4.8; −1.0] ** | 0.992 |
| Total cholesterol (mg/dL) | 200 ± 52 | 198 ± 43 | |
| Δ Total cholesterol (mg/dL) 12 weeks | −11.1 [−18.9; −3.3] ** | −7.0 [−14.7; 0.8] | 0.565 |
| Δ Total cholesterol (mg/dL) 52 weeks | −8.0 [−17.3; 1.3] | 0.1 [−9.3; 9.4] | 0.396 |
| HDL (mg/dL) | 46 ± 10 | 47 ± 11 | |
| Δ HDL (mg/dL) 12 weeks | −0.1 [−1.6; 1.4] | −0.1 [−1.6; 1.4] | 0.908 |
| Δ HDL (mg/dL) 52 weeks | 0.9 [−4.0; 5.9] | 4.5 [−0.5; 9.5] | 0.248 |
| LDL (mg/dL) | 118 ± 32 | 119 ± 37 | |
| Δ LDL (mg/dL) 12 weeks | −6.6 [−10.9; −2.3] ** | −3.3 [−7.6; 1.0] | 0.144 |
| Δ LDL (mg/dL) 52 weeks | −7.6 [−12.8; −2.4] ** | 1.8 [−3.4; 7.0] | 0.012 |
| Triglyceride (mg/dL) | 383 ± 586 | 220 ± 157 | |
| Δ Triglyceride (mg/dL) 12 weeks | −186 [−268; −104] ***,a | −27 [−109; 56] | 0.041 |
| Δ Triglyceride (mg/dL) 52 weeks | −35 [−86; 17] | −31 [−83; 21] | 0.865 |
| TFEQ [cognitive control] (au) | 9.7 ± 3.9 | 10.0 ± 4.3 | |
| Δ TFEQ [cognitive control] (au) 12 weeks | 2.5 [1.7; 3.3] ***,a | 2.5 [1.7; 3.3] ***,a | 0.847 |
| Δ TFEQ [cognitive control] (au) 52 weeks | 2.3 [1.5; 3.1] ***,a | 2.2 [1.4; 3.0] ***,a | 0.633 |
| TFEQ [suggestibility] (au) | 7.4 ± 3.8 | 7.0 ± 3.5 | |
| Δ TFEQ [suggestibility] (au) 12 weeks | −0.8 [−1.3; −0.3] ** | −0.8 [−1.4; −0.3] ***,a | 0.686 |
| Δ TFEQ [suggestibility] (au) 52 weeks | −0.8 [−1.3; −0.2] ** | −0.9 [−1.4; −0.4] ***,a | 0.342 |
| TFEQ [hunger] (au) | 6.3 ± 3.7 | 5.6 ± 3.3 | |
| Δ TFEQ [hunger] (au) 12 weeks | −1.3 [−1.8; −0.7] ***,a | −1.3 [−1.9; −0.7] ***,a | 0.586 |
| Δ TFEQ [hunger] (au) 52 weeks | −1.1 [−1.7; −0.5] ***,a | −1.4 [−2.0; −0.8] ***,a | 0.074 |
| SF36 [physical health] (au) | 42 ± 10 | 43 ± 10 | |
| Δ SF36 [physical health] (au) 12 weeks | 1.5 [−0.2; 3.2] | 1.4 [−0.3; 3.1] | 0.773 |
| Δ SF36 [physical health] (au) 52 weeks | 0.2 [1.4; 1.8] | 1.2 [−0.4; 2.8] | 0.150 |
| SF36 [mental health] (au) | 47 ± 13 | 45 ± 15 | |
| Δ SF36 [mental health] (au) 12 weeks | 0.6 [−2.0; 3.2] | 1.2 [−1.5; 3.8] | 0.953 |
| Δ SF36 [mental health] (au) 52 weeks | −0.4 [−3.0; 2.2] | −1.4 [−3.9; 1.2] | 0.272 |
| No medication (%) | 8.0 | 8.2 | |
| Δ no medication (%) 12 weeks | −1.6 | 0 | 0.652 |
| Δ no medication (%) 52 weeks | −3.5 | −0.1 | 0.179 |
| Metformin (%) | 81.6 | 77.0 | |
| Δ Metformin (%) 12 weeks | 0 | −0.8 | 0.660 |
| Δ Metformin (%) 52 weeks | −1.2 | 0.5 | 0.942 |
| DPP4 inhibitors (%) | 28.8 | 24.6 | |
| Δ DPP4 inhibitors (%) 12 weeks | 0.8 | −0.8 | 0.314 |
| Δ DPP4 inhibitors (%) 52 weeks | 5.1 | 0.6 | 0.377 |
| Sulfonylurea (%) | 6.4 | 4.1 | |
| Δ Sulfonylurea (%) 12 weeks | −2.4 | −2.5 | 1.000 |
| Δ Sulfonylurea (%) 52 weeks | 2.5 | 0.4 | 0.920 |
| Glinides (%) | 0 | 0 | |
| Δ Glinides (%) 12 weeks | 0 | 0 | NA |
| Δ Glinides (%) 52 weeks | 2.7 | 0.9 | 0.622 |
| Glitazone (%) | 1.6 | 0.8 | |
| Δ Glitazone (%) 12 weeks | −1.6 | 0 | 0.428 |
| Δ Glitazone (%) 52 weeks | −0.5 | −0.8 | 1.000 |
| Glucosidase inhibitors (%) | 0 | 0.8 | |
| Δ Glucosidase inhibitors (%) 12 weeks | 0 | 0 | NA |
| Δ Glucosidase inhibitors (%) 52 weeks | 0 | 0.1 | 1.000 |
| GLP−1 receptor agonists (%) | 12.0 | 8.2 | |
| Δ GLP−1 receptor agonists (%) 12 weeks | −0.8 | 0.8 | 0.855 |
| Δ GLP−1 receptor agonists (%) 52 weeks | 0.4 | 0.8 | 1.000 |
| Sodium-glucose co-transporter−2 (%) | 0.8 | 0.8 | |
| Δ Sodium-glucose co-transporter−2 (%) 12 weeks | 0 | 0 | NA |
| Δ Sodium-glucose co-transporter−2 (%) 52 weeks | 0.1 | 0.1 | 1.000 |
| Insulin (%) | 19.2 | 19.7 | |
| Δ Insulin (%) 12 weeks | −5.6 | −0.8 | 0.290 |
| Δ Insulin (%) 52 weeks | −3.9 | −0.8 | 0.256 |
© 2018 by the authors. Licensee MDPI, Basel, Switzerland. This article is an open access article distributed under the terms and conditions of the Creative Commons Attribution (CC BY) license (http://creativecommons.org/licenses/by/4.0/).
Share and Cite
Kempf, K.; Röhling, M.; Niedermeier, K.; Gärtner, B.; Martin, S. Individualized Meal Replacement Therapy Improves Clinically Relevant Long-Term Glycemic Control in Poorly Controlled Type 2 Diabetes Patients. Nutrients 2018, 10, 1022. https://doi.org/10.3390/nu10081022
Kempf K, Röhling M, Niedermeier K, Gärtner B, Martin S. Individualized Meal Replacement Therapy Improves Clinically Relevant Long-Term Glycemic Control in Poorly Controlled Type 2 Diabetes Patients. Nutrients. 2018; 10(8):1022. https://doi.org/10.3390/nu10081022
Chicago/Turabian StyleKempf, Kerstin, Martin Röhling, Katja Niedermeier, Babette Gärtner, and Stephan Martin. 2018. "Individualized Meal Replacement Therapy Improves Clinically Relevant Long-Term Glycemic Control in Poorly Controlled Type 2 Diabetes Patients" Nutrients 10, no. 8: 1022. https://doi.org/10.3390/nu10081022