High Fat Mixed Meal Tolerance Test Leads to Suppression of Osteocalcin Decrease in Obese Insulin Resistant Subjects Compared to Healthy Adults

 , ,
, ,
Abstract
:1. Introduction
2. Materials and Methods
2.1. Subjects
2.2. Anthropometric Parameters
2.3. High Fat Mixed Meal Tolerance Test (HFMTT)
2.4. Biochemical Analyses
2.5. Statistical Analyses
3. Results
4. Discussion
5. Conclusions
Author Contributions
Funding
Acknowledgments
Conflicts of Interest
References
- Greco, E.; Fornari, R.; Rossi, F.; Santiemma, V.; Prossomariti, G.; Annoscia, C.; Aversa, A.; Brama, M.; Marini, M.; Donini, L.M.; et al. Is obesity protective for osteoporosis? Evaluation of bone mineral density in individuals. Int. J. Clin. Pract. 2010, 64, 817–820. [Google Scholar] [CrossRef] [PubMed]
- Greco, E.; Francomano, D.; Fornari, R.; Marocco, C.; Lubrano, C.; Papa, V.; Wannenes, F.; Di Luigi, L.; Donini, L.M.; Lenzi, A.; et al. Negative association between trunk fat, insulinresistance and skeleton in obese women. World J. Diabetes 2013, 4, 31–39. [Google Scholar] [CrossRef] [PubMed]
- Compston, J.; Flahive, J.; Hosmer, D.; Watts, N.; Siris, E.; Silverman, S.; Saag, K.G.; Roux, C.; Rossini, M.; Pfeilschifter, J.; et al. GLOW Investigators.Relationship of weight, height, and body mass index with fracture risk at different sites in postmenopausal women: The Global Longitudinal study of Osteoporosis in Women (GLOW). J. Bone Miner. Res. 2014, 29, 487–493. [Google Scholar] [CrossRef] [PubMed]
- Greco, E.A.; Lenzi, A.; Migliaccio, S. The obesity of bone. Ther. Adv. Endocrinol. Metab. 2015, 6, 273–286. [Google Scholar] [CrossRef] [PubMed] [Green Version]
- Price, P.A.; Rice, J.S.; Williamson, M.K. Conserved phosphorylation of serines in the Ser-X-Glu/Ser(P) sequences of the vitamin K-dependent matrix Gla protein from shark, lamb, rat, cow, and human. Protein Sci. 1994, 3, 822–830. [Google Scholar] [CrossRef] [PubMed]
- Dowd, T.L.; Rosen, J.F.; Li, L.; Gundberg, C.M. The three-dimensional structure of bovine calcium ion-bound osteocalcin using 1 HNMR spectroscopy. Biochemistry 2003, 42, 7769–7779. [Google Scholar] [CrossRef] [PubMed]
- Hauschka, P.V.; Lian, J.B.; Cole, D.E.; Gundberg, C.M. Osteocalcin and matrix Gla protein: Vitamin K-dependent proteins in bone. Physiol. Rev. 1989, 69, 990–1047. [Google Scholar] [CrossRef] [PubMed]
- Lee, N.K.; Sowa, H.; Hinoi, E.; Ferron, M.; Ahn, J.D.; Confavreux, C.; Dacquin, R.; Mee, P.J.; McKee, M.D.; Jung, D.Y.; et al. Endocrine regulation of energy metabolism by the skeleton. Cell 2007, 130, 456–469. [Google Scholar] [CrossRef] [PubMed]
- Ferron, M.; Lacombe, J. Regulation of energy metabolism by the skeleton: Osteocalcin and beyond. Arch. Biochem. Biophys. 2014, 561, 137–146. [Google Scholar] [CrossRef] [PubMed]
- Ferron, M.; Hinoi, E.; Karsenty, G.; Ducy, P. Osteocalcin differentially regulates beta cell and adipocyte gene expression and affects the development of metabolic diseases in wild-type mice. Proc. Natl. Acad. Sci. USA 2008, 105, 5266–5270. [Google Scholar] [CrossRef] [PubMed]
- Wei, J.; Hanna, T.; Suda, N.; Karsenty, G.; Ducy, P. Osteocalcin promotes β-cell proliferation during development and adulthood through Gprc6a. Diabetes 2014, 63, 1021–1031. [Google Scholar] [CrossRef] [PubMed]
- Janghorbani, M.; Van Dam, R.M.; Willett, W.C.; Hu, F.B. Systematic review of type 1 and type 2 diabetes mellitus and risk of fracture. Am. J. Epidemiol. 2007, 166, 495–505. [Google Scholar] [CrossRef] [PubMed]
- Hamann, C.; Kirschner, S.; Gunther, K.P.; Hofbauer, L.C. Bone, sweet bone—Osteoporotic fractures in diabetes mellitus. Nat. Rev. Endocrinol. 2012, 8, 297–305. [Google Scholar] [CrossRef] [PubMed]
- Kanazawa, I.; Yamaguchi, T.; Yamauchi, M.; Yamamoto, M.; Kurioka, S.; Yano, S.; Sugimoto, T. Serum undercarboxylated osteocalcin was inversely associated with plasma glucose level and fat mass in type 2 diabetes mellitus. Osteoporos. Int. 2011, 22, 187–194. [Google Scholar] [CrossRef] [PubMed]
- Razny, U.; Fedak, D.; Kiec-Wilk, B.; Goralska, J.; Gruca, A.; Zdzienicka, A.; Kiec-Klimczak, M.; Solnica, B.; Hubalewska-Dydejczyk, A.; Malczewska-Malec, M. Carboxylated and undercarboxylated osteocalcin in metabolic complications of human obesity and prediabetes. Diabetes Metab. Res. Rev. 2017, 33, e2862. [Google Scholar] [CrossRef] [PubMed]
- Blumsohn, A.; Herrington, K.; Hannon, R.A.; Shao, P.; Eyre, D.R.; Eastell, R. The effect of calcium supplementation on the circadian rhythm of bone resorption. J. Clin. Endocrinol. Metab. 1994, 79, 730–735. [Google Scholar] [PubMed]
- Kruger, M.C.; Booth, C.L.; Coad, J.; Schollum, L.M.; Kuhn-Sherlock, B.; Shearer, M.J. Effect of calcium fortified milk supplementation with or without vitamin K on biochemical markers of bone turnover in premenopausal women. Nutrition 2006, 22, 1120–1128. [Google Scholar] [CrossRef] [PubMed]
- Clowes, J.A.; Yap, T.S.; Li, J.; Hoyle, N.R.; Blumsohn, A.; Eastell, R. The effect of feeding on bone turnover markers and its impact on biological variability of measurements. Bone 2002, 30, 886–890. [Google Scholar] [CrossRef]
- Bjarnason, N.H.; Alexandersen, P.; Christgau, S.; Christgau, S.; Henriksen, D.B.; Christiansen, C. Mechanism of circadian variation in bone resorption. Bone 2002, 30, 307–313. [Google Scholar] [CrossRef]
- Paldanius, P.M.; Ivaska, K.K.; Hovi, P.; Andersson, S.; Eriksson, J.G.; Väänänen, K.; Kajantie, E.; Mäkitie, O. Total and carboxylated osteocalcin associate with insulin levels in young adults born with normal or very low birth weight. PLoS ONE 2013, 8, e63036. [Google Scholar] [CrossRef] [PubMed]
- Viljakainen, H.; Ivaska, K.K.; Paldánius, P.; Lipsanen-Nyman, M.; Saukkonen, T.; Pietiläinen, K.H.; Andersson, S.; Laitinen, K.; Mäkitie, O. Suppressed bone turnover in obesity: A link to energy metabolism? A case-control study. J. Clin. Endocrinol. Metab. 2014, 99, 2155–2163. [Google Scholar] [CrossRef] [PubMed]
- Schwetz, V.; Lerchbaum, E.; Schweighofer, N.; Hacker, N.; Trummer, O.; Borel, O.; Pieber, T.R.; Chapurlat, R.; Obermayer-Pietsch, B. Osteocalcin levels on oral glucose load in women being investigated for polycystic ovary syndrome. Endocr. Pract. 2014, 20, 5–14. [Google Scholar] [CrossRef] [PubMed]
- Coudrec, R.; Peynet, J.; Cambillaud, M.; Tallet, F.; Cosson, C.; Lefèvre, G.; Atger, V. Effects of postprandial hyperlipemia on the vitamin E content of the lipoproteins. GERBAP section Lipoproteins. Groupe d’Evaluation et de Recherche de l’Assistance Publique des Hopitaux de Paris. Clin. Chim. Acta 1998, 277, 141–152. [Google Scholar] [CrossRef]
- Mari, A.; Pacini, G.; Murphy, E.; Ludvik, B.; Nolan, J.J. A model-based method for assessing insulin sensitivity from the oral glucose tolerance test. Diabetes Care 2001, 24, 539–548. [Google Scholar] [CrossRef] [PubMed]
- Gannon, M.C.; Nuttall, F.Q.; Westphal, S.A.; Neil, B.J.; Seaquist, E.R. Effects of dose of ingested glucose on plasma metabolite and hormone responses in type II diabetic subjects. Diabetes Care 1989, 12, 544–552. [Google Scholar] [CrossRef] [PubMed]
- Iglesias, P.; Arrieta, F.; Pinera, M.; Botella-Carretero, J.I.; Balsa, J.A.; Zamarrón, I.; Menacho, M.; Díez, J.J.; Muñoz, T.; Vázquez, C. Serum concentrations of osteocalcin, procollagen type 1 N-terminal propeptide and beta-CrossLaps in obese subjects with varying degrees of glucose tolerance. Clin. Endocrinol. 2011, 75, 184–188. [Google Scholar] [CrossRef] [PubMed]
- Yamamoto, T.; Ozono, K.; Miyauchi, A.; Kasayama, S.; Kojima, Y.; Shima, M.; Okada, S. Role of advanced glycation end products in adynamic bone disease in patients with diabetic nephropathy. Am. J. Kidney Dis. 2001, 38, S161–S164. [Google Scholar] [CrossRef] [PubMed]
- Razny, U.; Goralska, J.; Zdzienicka, A.; Fedak, D.; Masania, J.; Rabbani, N.; Thornalley, P.; Pawlica-Gosiewska, D.; Gawlik, K.; Dembinska-Kiec, A.; et al. Relation of the protein glycation, oxidation and nitration to the osteocalcin level in obese subjects. Acta Biochim. Pol. 2017, 64, 415–422. [Google Scholar] [CrossRef] [PubMed]
- Sinha, R.; Fisch, G.; Teague, B.; Tamborlane, W.V.; Banyas, B.; Allen, K.; Savoye, M.; Rieger, V.; Taksali, S.; Barbetta, G.; et al. Prevalence of impaired glucose tolerance among children and adolescents with marked obesity. N. Engl. J. Med. 2002, 346, 802–810. [Google Scholar] [CrossRef] [PubMed]
- Clemens, T.L.; Karsenty, G. The osteoblast: An insulin target cell controlling glucose homeostasis. J. Bone Miner. Res. 2011, 26, 677–680. [Google Scholar] [CrossRef] [PubMed] [Green Version]
- Pollock, N.K.; Bernard, P.J.; Gower, B.A.; Gundberg, C.M.; Wenger, K.; Misra, S.; Bassali, R.W.; Davis, C.L. Lower uncarboxylated osteocalcin concentrations in children with prediabetes is associated with beta-cell function. J. Clin. Endocrinol. MeTable 2011, 96, E1092–E1099. [Google Scholar] [CrossRef] [PubMed]
- Hyun, W.L.; Sang, Y.K.; Kim, A.Y.; Lee, E.J.; Choi, J.Y.; Kim, J.B. Adiponectin stimulates osteoblast differentiation through induction of COX2 in mesenchymal progenitor cells. Stem Cells 2009, 27, 2254–2262. [Google Scholar]
- Kanazawa, I.; Yamaguchi, T.; Yano, S.; Yamauchi, M.; Yamamoto, M.; Sugimoto, T. Adiponectin and AMP kinase activator stimulate proliferation, differentiation, and mineralization of osteoblastic MC3T3-E1 cells. BMC Cell Biol. 2007, 8, 51. [Google Scholar] [CrossRef] [PubMed]
- Huang, C.Y.; Lee, C.Y.; Chen, M.Y.; Tsai, H.C.; Hsu, H.C.; Tang, C.H. Adiponectin increases BMP-2 expression in osteoblasts via AdipoR receptor signaling pathway. J. Cell. Physiol. 2010, 224, 475–483. [Google Scholar] [CrossRef] [PubMed]
- Oshima, K.; Nampei, A.; Matsuda, M.; Iwaki, M.; Fukuhara, A.; Hashimoto, J.; Yoshikawa, H.; Shimomura, I. Adiponectin increases bone mass by suppressing osteoclast and activating osteoblast. Biochem. Biophys. Res. Commun. 2005, 331, 520–526. [Google Scholar] [CrossRef] [PubMed]
- Yamauchi, T.; Kamon, J.; Waki, H.; Terauchi, Y.; Kubota, N.; Hara, K.; Mori, Y.; Ide, T.; Murakami, K.; Tsuboyama-Kasaoka, N.; et al. The fat-derived hormone adiponectin reverses insulin resistance associated with both lipoatrophy and obesity. Nat. Med. 2001, 7, 941–946. [Google Scholar] [CrossRef] [PubMed]
- Kajimura, D.; Lee, H.W.; Riley, K.J.; Arteaga-Solis, E.; Ferron, M.; Zhou, B.; Clarke, C.J.; Hannun, Y.A.; DePinho, R.A.; Guo, X.E.; et al. Adiponectin regulates bone mass via opposite central and peripheral mechanisms through FoxO1. Cell Metab. 2013, 17, 901–915. [Google Scholar] [CrossRef] [PubMed]
- Henriksen, D.B.; Alexandersen, P.; Bjarnason, N.H.; Vilsbøll, T.; Hartmann, B.; Henriksen, E.E.; Byrjalsen, I.; Krarup, T.; Holst, J.J.; Christiansen, C. Role of gastrointestinal hormones in postprandial reduction of bone resorption. J. Bone Miner. Res. 2003, 18, 2180–2189. [Google Scholar] [CrossRef] [PubMed]
- Christensen, M.B.; Asger Lund, A.; Calanna, S.; Jørgensen, N.R.; Holst, J.J.; Vilsbøll, T.; Knop, F.K. Glucose-Dependent Insulinotropic Polypeptide (GIP) Inhibits Bone Resorption independently of Insulin and Glycemia. J. Clin. Endocrinol. Metab. 2018, 103, 288–294. [Google Scholar] [CrossRef] [PubMed]
- Clowes, J.A.; Allen, H.C.; Prentis, D.M.; Eastell, R.; Blumsohn, A. Octreotide abolishes the acute decrease in bone turnover in response to oral glucose. J. Clin. Endocrinol. Metab. 2003, 88, 4867–4873. [Google Scholar] [CrossRef] [PubMed]


| Components of HFMTT | Amount (g) | Caloric Value (kcal) | Protein (g) | Carbohydrates (g) | Fat (g) | SFA (g) | MUFA (g) | PUFA (g) |
|---|---|---|---|---|---|---|---|---|
| Wheat bread | 50 | 124.5 | 3.4 | 28.0 | 0.7 | 0.1 | 0.08 | 0.3 |
| Butter | 20 | 147.0 | 0.1 | 0.1 | 16.5 | 10.9 | 4.5 | 0.2 |
| Cream cheese | 60 | 178.8 | 8.1 | 0.7 | 16.2 | 9.7 | 5.2 | 0.4 |
| Roasted pork | 100 | 291.0 | 30.4 | 0.7 | 18.7 | 5.5 | 9.7 | 2.3 |
| Mayonnaise | 40 | 285.7 | 0.5 | 1.0 | 31.6 | 3.4 | 6.4 | 20.1 |
| Sum | 270 | 1027.0 | 42.5 | 30.6 | 83.7 | 29.6 | 25.8 | 23.4 |
| en% | 16 | 11 | 73 | |||||
| g/kg diet | 157.4 | 113.3 | 310.0 | 109.7 | 95.6 | 86.7 |
| Parameter | Non-Obese (n = 24) | Obese (n = 70) | p-Value * |
|---|---|---|---|
| Age (years) | 47.52 ± 2.22 2 | 46.38 ± 1.40 | 0.62 |
| Sex, female (%) | 79 | 71 | 0.46 |
| BMI (kg/m2) | 28.58 (27.47–29.08) 1 | 34.16 (32.13–36.28) | <0.001 |
| WHR (waist to hip ratio) | 0.85 (0.82–0.92) | 0.87 (0.82–0.97) | 0.59 |
| Adipose tissue mass (%) | 35.00 (32.35–38.20) | 40.40 (34.48–43.10) | <0.001 |
| Systolic BP (mm Hg) | 120 (110–124) | 130 (120–140) | 0.019 |
| Diastolic BP (mm Hg) | 80 (70–85) | 82 (80–90) | 0.088 |
| Total Cholesterol (mmol/L) | 5.43 ± 0.19 | 5.48 ± 0.13 | 0.82 |
| HDL Cholesterol (mmol/L) | 1.29 ± 0.04 | 1.28 ± 0.03 | 0.83 |
| LDL Cholesterol (mmol/L) | 3.57 ± 0.17 | 3.51 ± 0.12 | 0.79 |
| NEFA (mmol/L) | 0.66 ± 0.04 | 0.76 ± 0.03 | 0.048 |
| TG (mmol/L) | 1.09 (0.81–1.41) | 1.31 (0.88–2.01) | 0.10 |
| Glucose (mmol/L) | 5.26 ± 0.11 | 5.19 ± 0.06 | 0.93 |
| Insulin (µIU/mL) | 10.00 (7.80–11.10) | 16.45 (11.68–20.85) | <0.001 |
| HOMA-IR | 2.17 (1.92–2.57) | 3.49 (2.37–4.66) | <0.001 |
| Leptin (ng/mL) | 22.64 ± 2.29 | 39.94 ± 2.75 | 0.001 |
| Adiponectin (µg/mL) | 6.76 ± 0.63 | 7.06 ± 0.52 | 0.62 |
| IL-6 (pg/mL) | 0.89 (0.73–1.30) | 1.30 (0.90–1.91) | 0.010 |
| hsCRP (mg/L) | 0.80 (0.38–1.82) | 2.22 (0.99–3.89) | 0.008 |
| Resistin (ng/mL) | 9.60 ± 0.67 | 10.14 ± 0.49 | 0.007 |
| Visfatin (ng/mL) | 1.07 ± 0.21 | 1.16 ± 0.09 | 0.39 |
| sE-selectin (pg/mL) | 34.08 ± 3.26 | 39.51 ± 1.68 | 0.09 |
| MCP-1(pg/mL) | 343.91 ± 19.41 | 363.06 ± 11.99 | 0.23 |
| sVCAM-1 (ng/mL) | 582.93 ± 24.05 | 622.37 ± 18.59 | 0.25 |
| Glu-OC (ng/mL) | 3.95 ± 0.42 | 2.92 ± 0.26 | 0.016 |
| Gla-OC (ng/mL) | 5.89 ± 0.45 | 4.95 ± 0.20 | 0.037 |
| Total-OC (ng/mL) | 9.84 ± 0.64 | 7.87 ± 0.32 | 0.005 |
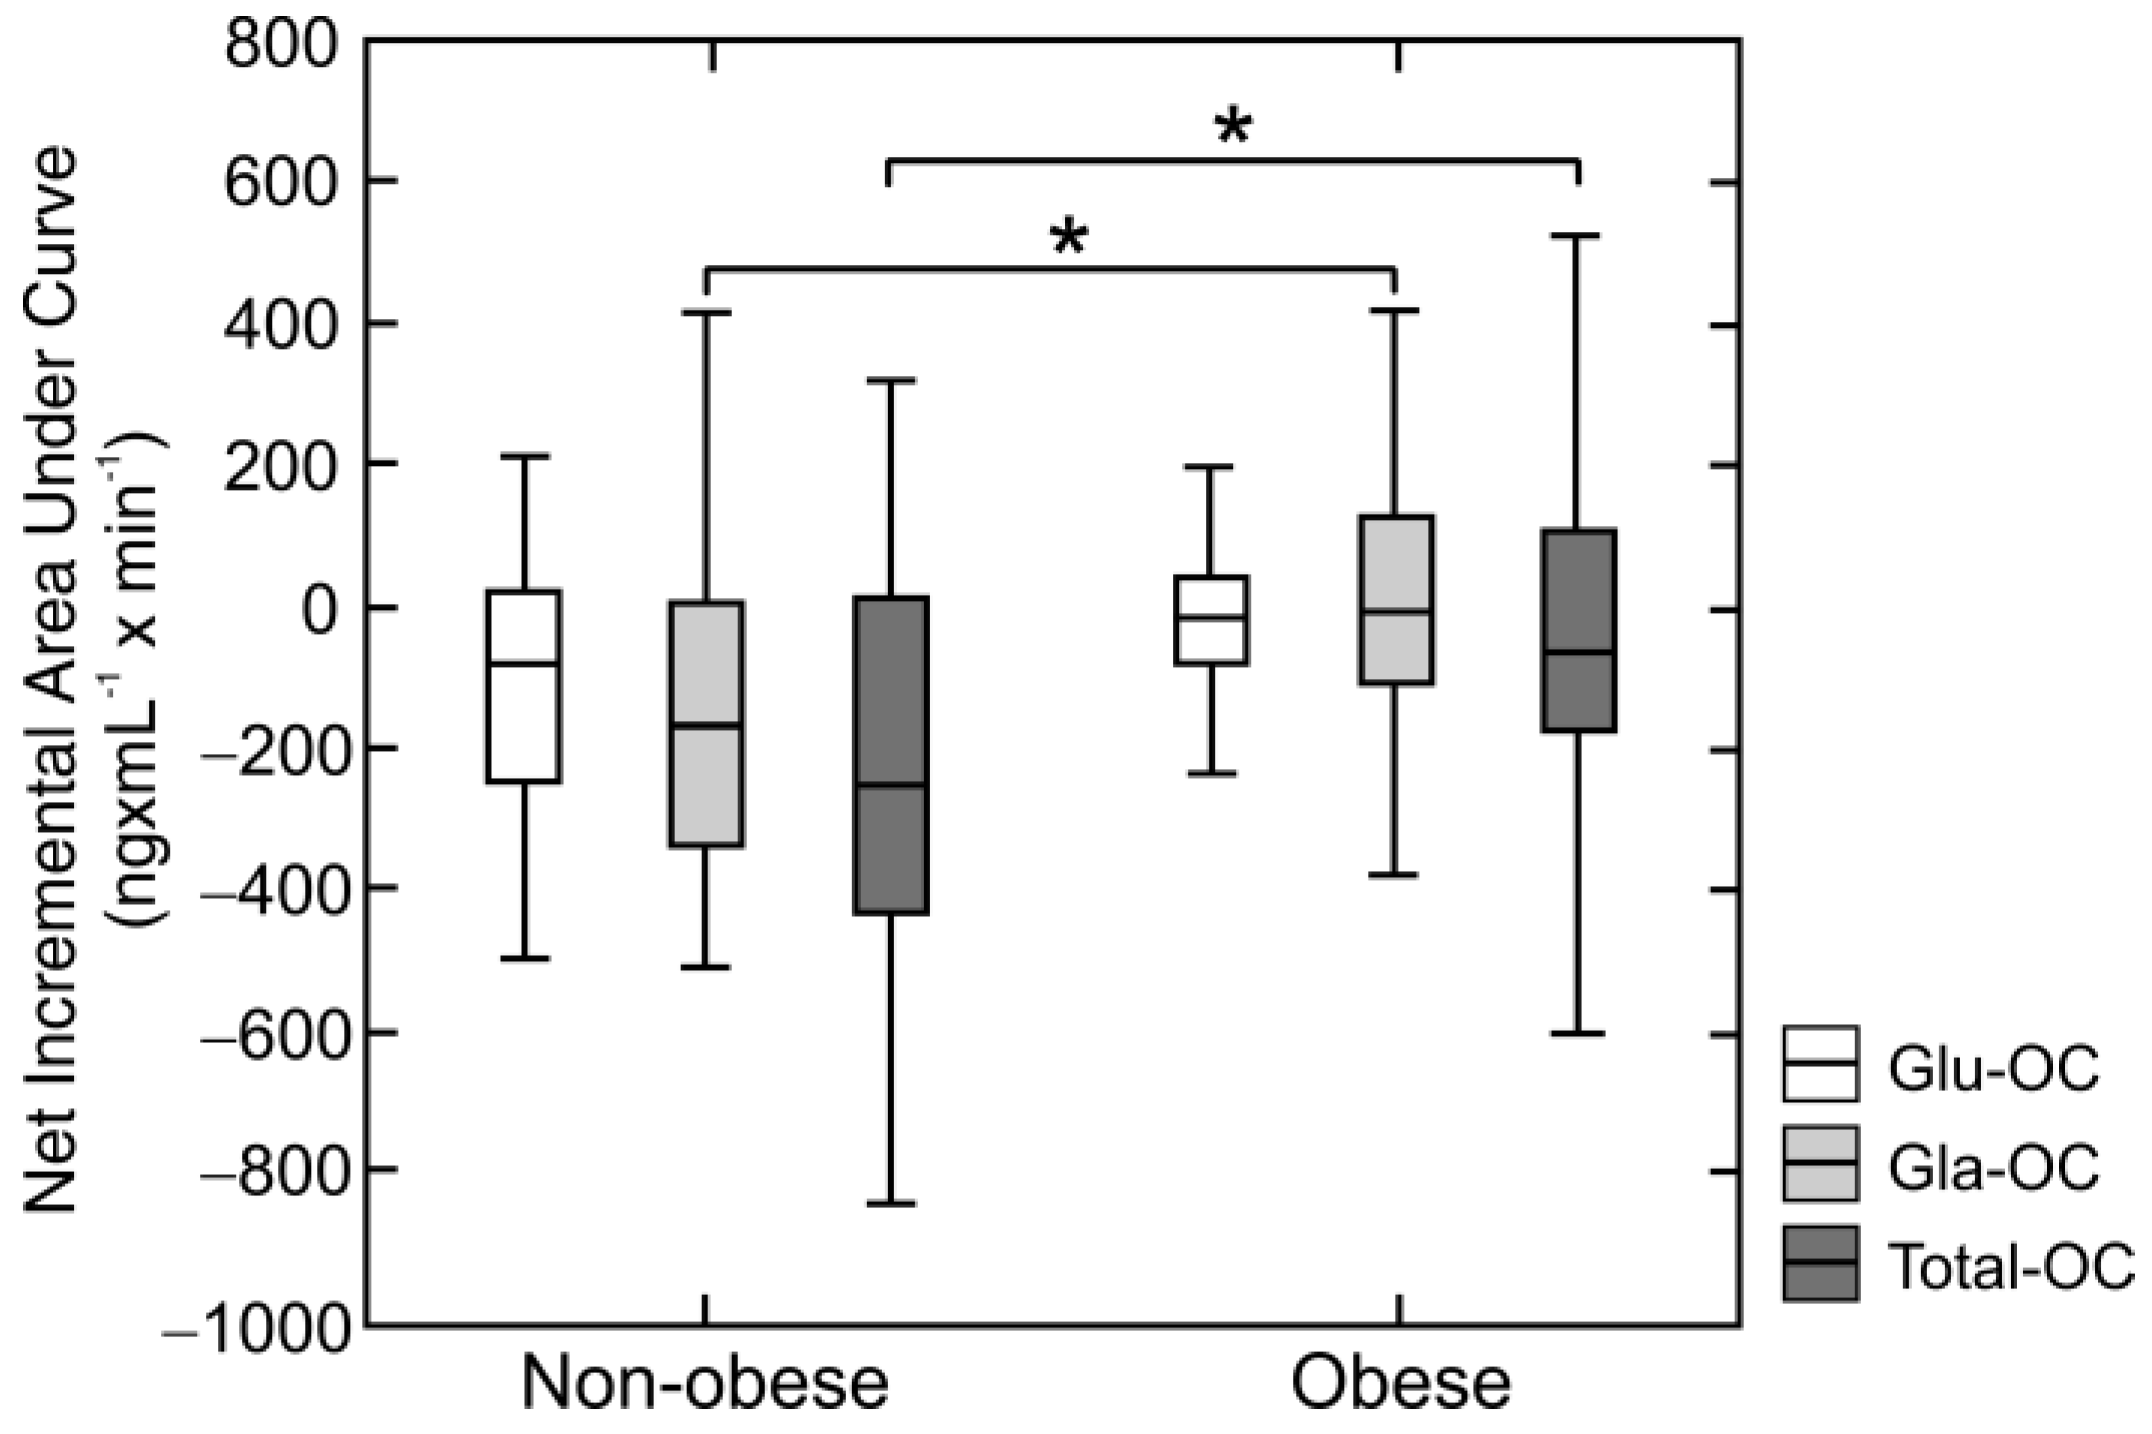
| Parameter | Net Incremental Total-OC AUC | Net Incremental Gla-OC AUC | ||
|---|---|---|---|---|
| rho | p | rho | p | |
| BMI | 0.28 | 0.007 | 0.26 | 0.014 |
| Fasting Insulin | 0.30 | 0.007 | 0.23 | 0.042 |
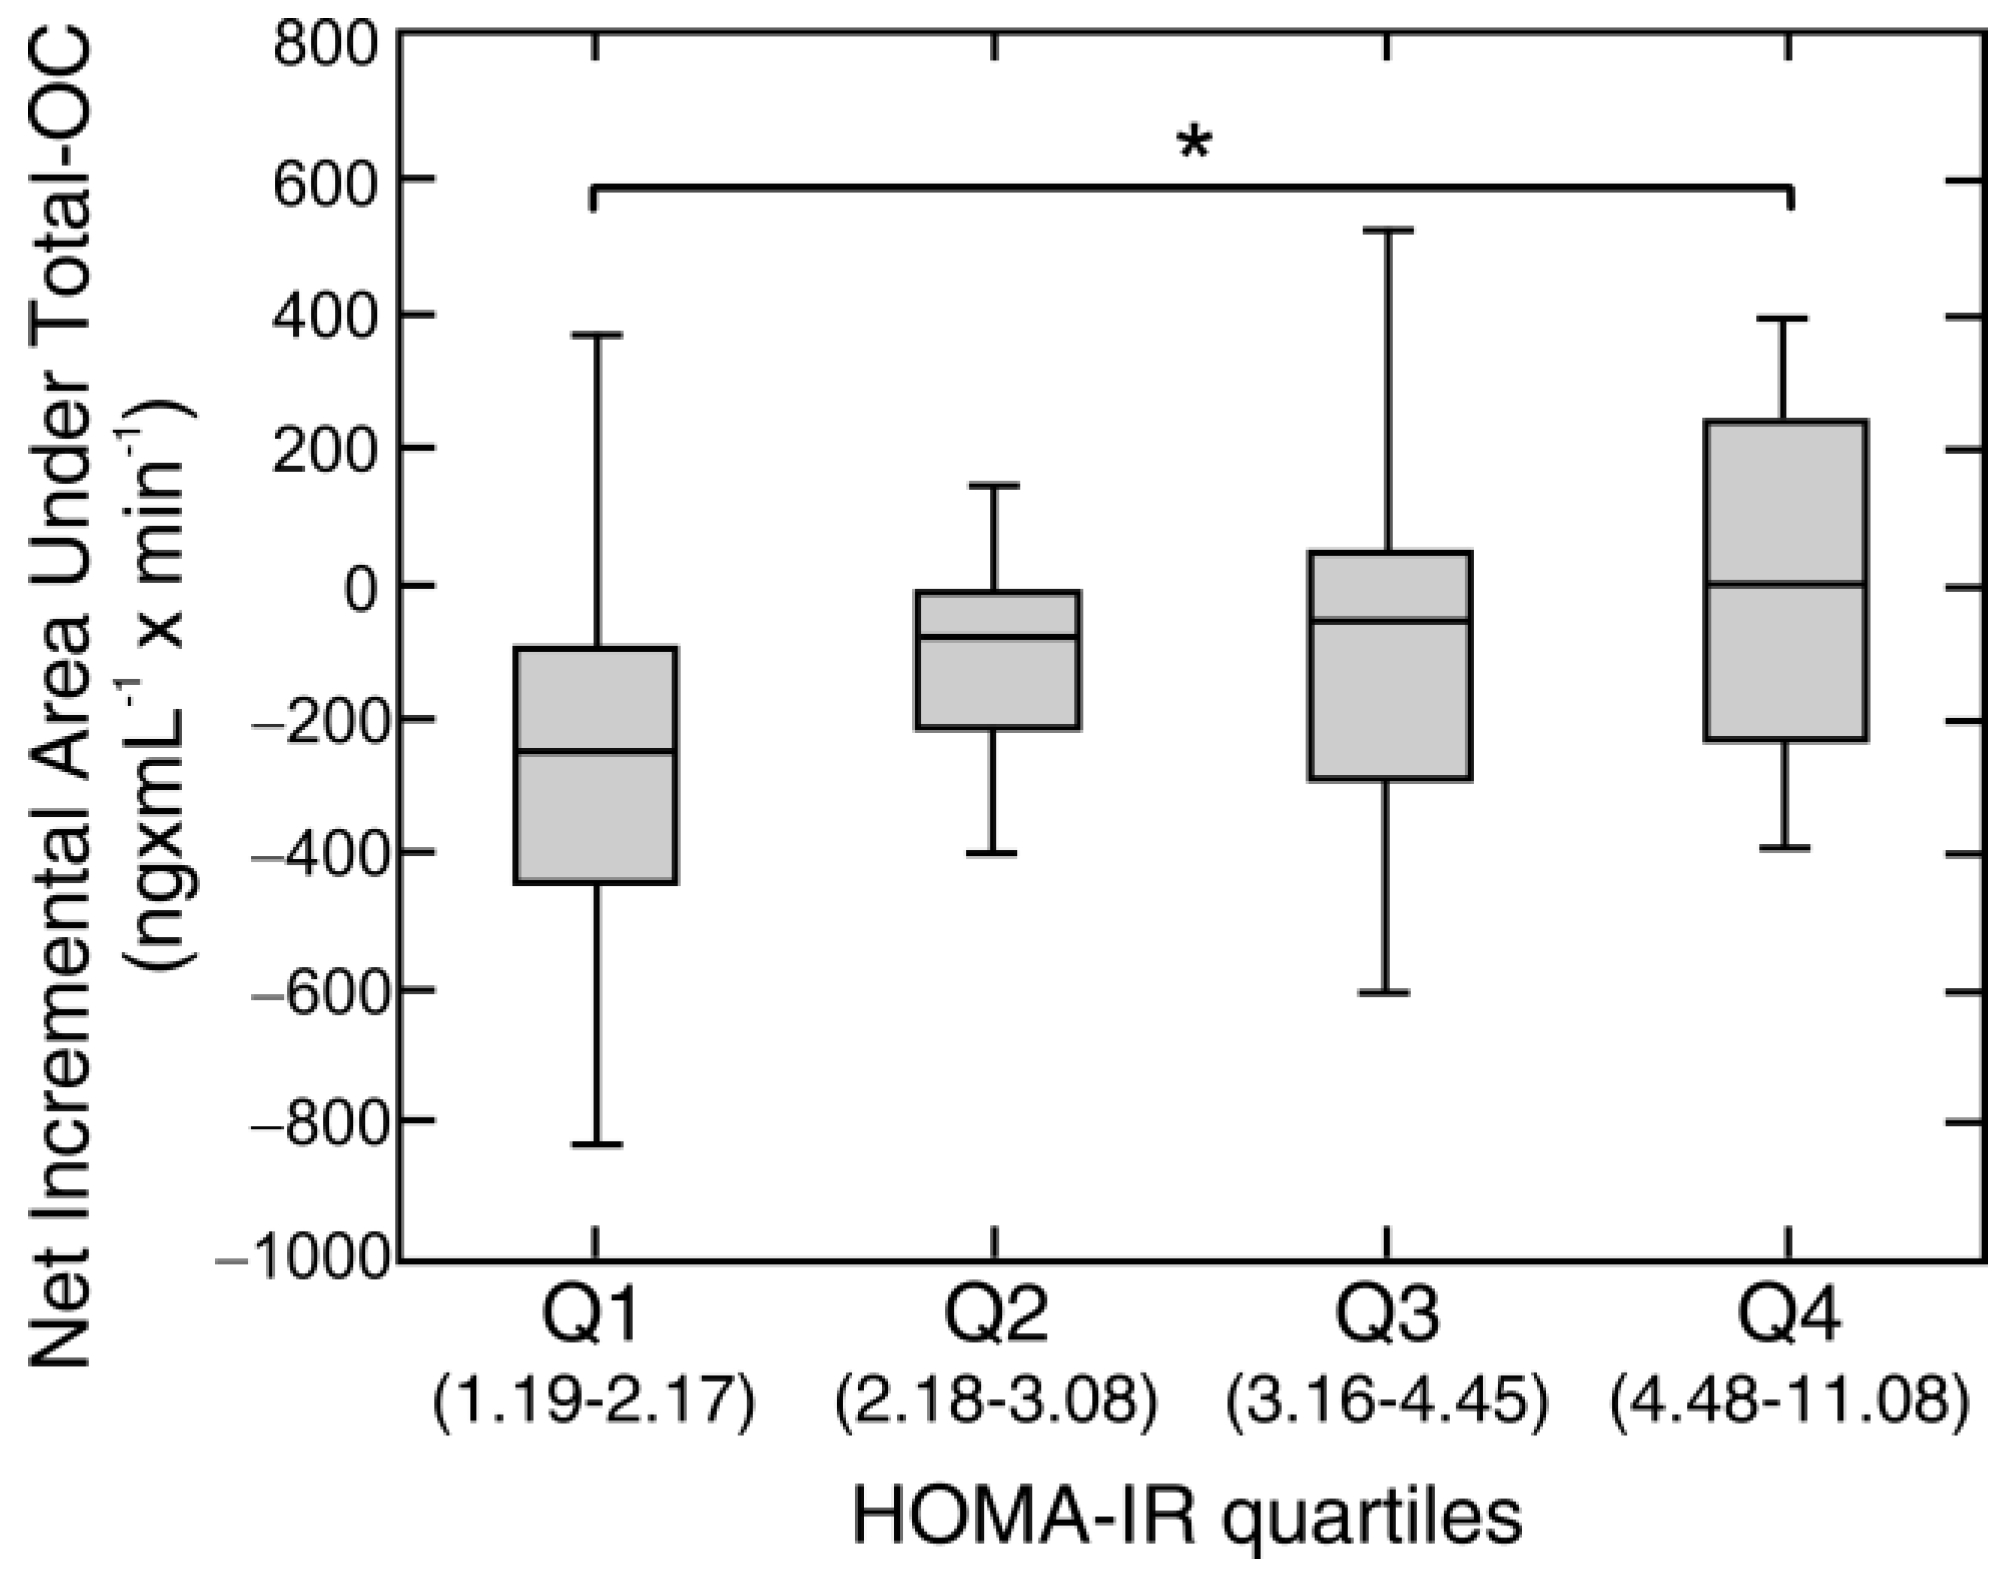
| HOMA-IR | 0.29 | 0.008 | 0.19 | 0.07 |
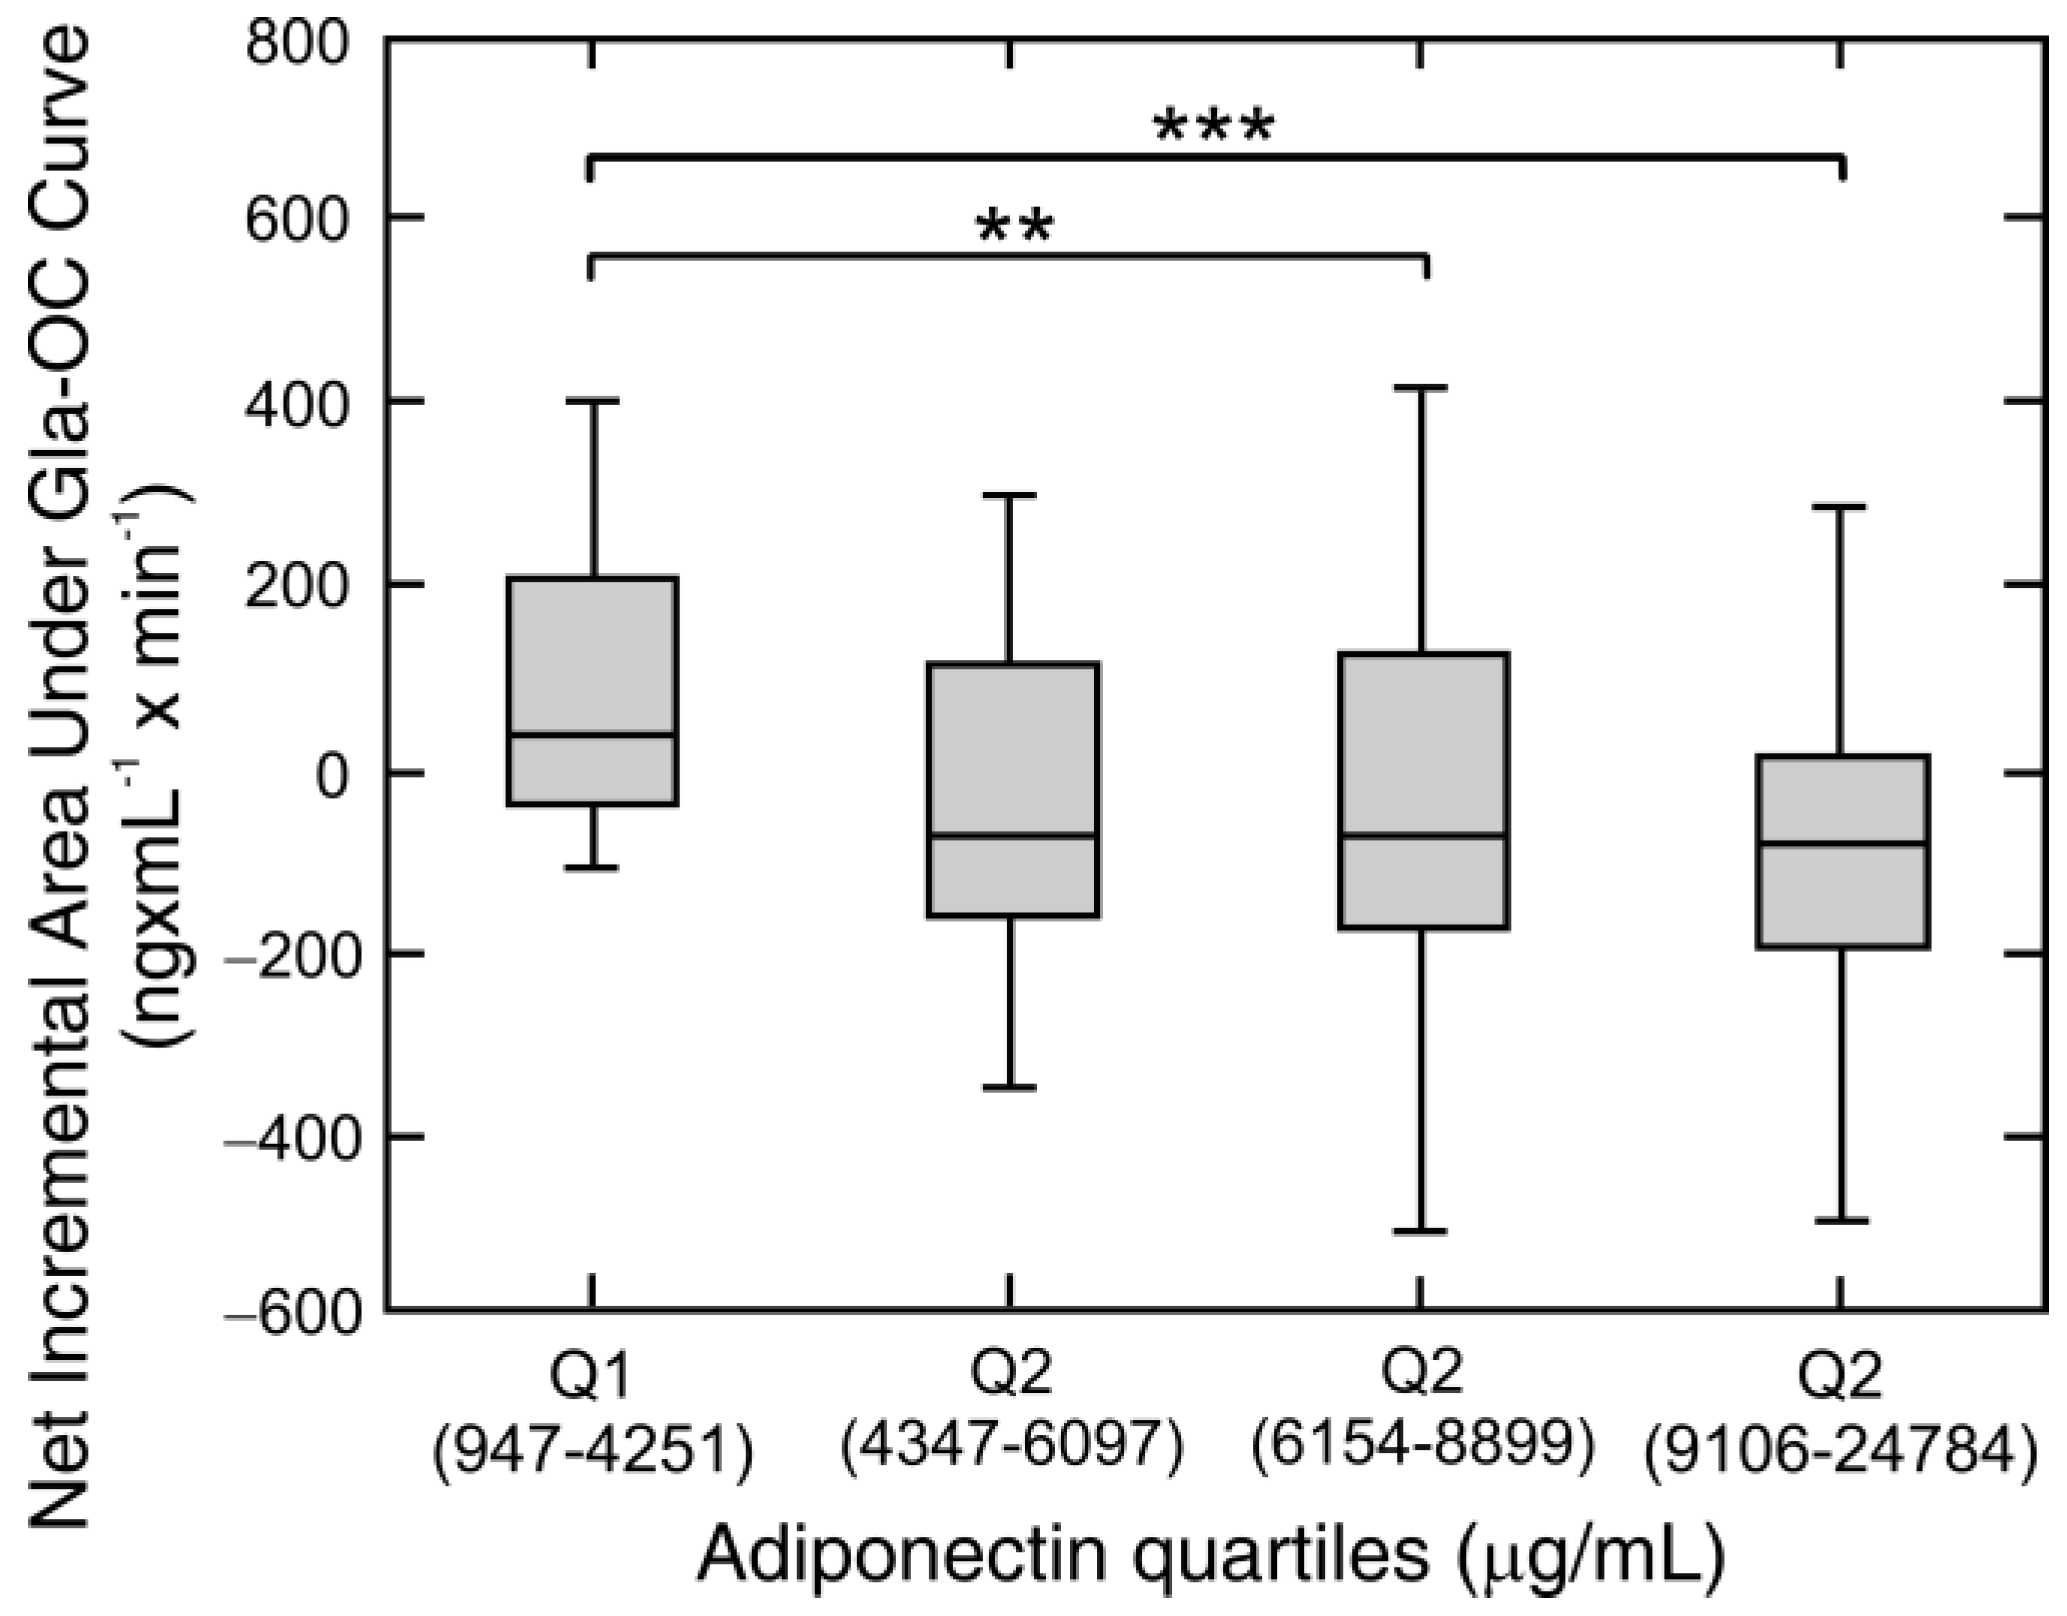
| Adiponectin | −0.27 | 0.011 | −0.35 | 0.001 |
© 2018 by the authors. Licensee MDPI, Basel, Switzerland. This article is an open access article distributed under the terms and conditions of the Creative Commons Attribution (CC BY) license (http://creativecommons.org/licenses/by/4.0/).
Share and Cite
Razny, U.; Goralska, J.; Zdzienicka, A.; Gruca, A.; Zapala, B.; Micek, A.; Dembinska-Kiec, A.; Solnica, B.; Malczewska-Malec, M. High Fat Mixed Meal Tolerance Test Leads to Suppression of Osteocalcin Decrease in Obese Insulin Resistant Subjects Compared to Healthy Adults. Nutrients 2018, 10, 1611. https://doi.org/10.3390/nu10111611
Razny U, Goralska J, Zdzienicka A, Gruca A, Zapala B, Micek A, Dembinska-Kiec A, Solnica B, Malczewska-Malec M. High Fat Mixed Meal Tolerance Test Leads to Suppression of Osteocalcin Decrease in Obese Insulin Resistant Subjects Compared to Healthy Adults. Nutrients. 2018; 10(11):1611. https://doi.org/10.3390/nu10111611
Chicago/Turabian StyleRazny, Urszula, Joanna Goralska, Anna Zdzienicka, Anna Gruca, Barbara Zapala, Agnieszka Micek, Aldona Dembinska-Kiec, Bogdan Solnica, and Malgorzata Malczewska-Malec. 2018. "High Fat Mixed Meal Tolerance Test Leads to Suppression of Osteocalcin Decrease in Obese Insulin Resistant Subjects Compared to Healthy Adults" Nutrients 10, no. 11: 1611. https://doi.org/10.3390/nu10111611