Article

Proteomic and Metabolomic Correlates of Healthy Dietary Patterns: The Framingham Heart Study

1
Section of Preventive Medicine and Epidemiology, Department of Medicine, Boston University School of Medicine, Boston, MA 02118, USA
2
Department of Epidemiology, Boston University School of Public Health, Boston, MA 02118, USA
3
Department of Mathematics and Statistics, Boston University College of Arts and Sciences, Boston, MA 02215, USA
4
Division of Cardiovascular Medicine Beth Israel Deaconess Medical Center, Boston, MA 02215, USA
5
Broad Institute of Massachusetts Institute of Technology and Harvard, Cambridge, MA 02142, USA
6
Department of Public Health and Community Medicine, Tufts University School of Medicine, Boston, MA 02111, USA
7
Framingham Heart Study, Framingham, MA 01702, USA
8
Nutrition Epidemiology and Data Science, Tufts University Friedman School of Nutrition Science and Policy, Boston, MA 02111, USA
9
Department of Biostatistics, Boston University School of Public Health, Boston, MA 02118, USA
10
Nutrition Epidemiology, Jean Mayer USDA Human Nutrition Research Center on Aging at Tufts University, Boston, MA 02111, USA
11
Section of Cardiovascular Medicine, Department of Medicine, Boston University School of Medicine, Boston, MA 02118, USA
12
Center for Computing and Data Sciences, Boston University, Boston, MA 02215, USA
*
Author to whom correspondence should be addressed.
Nutrients 2020, 12(5), 1476; https://doi.org/10.3390/nu12051476
Submission received: 16 April 2020 / Revised: 12 May 2020 / Accepted: 16 May 2020 / Published: 19 May 2020
(This article belongs to the Section Nutrigenetics and Nutrigenomics)

Abstract

:
Data on proteomic and metabolomic signatures of healthy dietary patterns are limited. We evaluated the cross-sectional association of serum proteomic and metabolomic markers with three dietary patterns: the Alternative Healthy Eating Index (AHEI), the Dietary Approaches to Stop Hypertension (DASH) diet; and a Mediterranean-style (MDS) diet. We examined participants from the Framingham Offspring Study (mean age; 55 years; 52% women) who had complete proteomic (n = 1713) and metabolomic (n = 2284) data; using food frequency questionnaires to derive dietary pattern indices. Proteins and metabolites were quantified using the SomaScan platform and liquid chromatography/tandem mass spectrometry; respectively. We used multivariable-adjusted linear regression models to relate each dietary pattern index (independent variables) to each proteomic and metabolomic marker (dependent variables). Of the 1373 proteins; 103 were associated with at least one dietary pattern (48 with AHEI; 83 with DASH; and 8 with MDS; all false discovery rate [FDR] ≤ 0.05). We identified unique associations between dietary patterns and proteins (17 with AHEI; 52 with DASH; and 3 with MDS; all FDR ≤ 0.05). Significant proteins enriched biological pathways involved in cellular metabolism/proliferation and immune response/inflammation. Of the 216 metabolites; 65 were associated with at least one dietary pattern (38 with AHEI; 43 with DASH; and 50 with MDS; all FDR ≤ 0.05). All three dietary patterns were associated with a common signature of 24 metabolites (63% lipids). Proteins and metabolites associated with dietary patterns may help characterize intermediate phenotypes that provide insights into the molecular mechanisms mediating diet-related disease. Our findings warrant replication in independent populations

1. Introduction

Sub-optimal diet quality is a leading cause of death in the United States and is estimated to contribute to approximately 44% of coronary heart disease deaths and 51% of stroke related deaths [1]. Data from clinical trials and prospective cohort studies indicate that healthy dietary patterns are associated with better metabolic health, lower risk of major chronic diseases, and lower mortality [2,3,4,5]. These studies indicate that diet quality may be a key factor in the prevention and mitigation of chronic disease. Yet, the molecular mechanisms [2,3] underlying the beneficial effects of healthy diet are not completely understood.
The identification of molecular biomarkers (proteins and metabolites) related to dietary patterns holds promise to elucidate biological pathways underlying the diet-related risk of chronic disease. Molecular biomarkers related to dietary intake may also relate to risk factors for chronic disease, or overt chronic disease per se. Such molecular markers reflecting dietary patterns have the potential to help inform risk assessment and allow for targeted preventive measures prior to the onset of chronic disease states. Population-based high-throughput proteomic studies of dietary patterns are lacking even though proteomic profiling may identify molecular biomarkers reflective of the biological functions/dysfunctions associated with an exposure (such as diet) or chronic disease states. In contrast, the use of untargeted metabolomics in nutrition research has increased in past years with the primary goal of biomarker discovery for the objective assessment of dietary intake [6]. Fewer studies have sought to relate dietary metabolomic profiles to disease outcomes; some studies have suggested that certain circulating metabolites may contribute to the biological underpinnings of diet–disease relations [7,8,9].
Multi-level omics analyses that combine high-dimensional molecular data from high throughput platforms can provide a comprehensive assessment of intermediate phenotypes (e.g., molecular endophenotypes) that may help link diet (or other exposures) to more distal chronic disease phenotypes. We hypothesized that proteomic and metabolic signatures of habitual dietary patterns encompass the respective functional states and metabolic consequences of unique dietary patterns including the sequelae of chronic disease. The objective of the present investigation was to determine the associations of the Alternative Healthy Eating Index (AHEI), Dietary Approaches to Stop Hypertension (DASH) diet, and a Mediterranean-style diet (MDS) with 1373 plasma proteins and 216 circulating metabolites in a sample of community-dwelling middle-aged adults.

2. Materials and Methods

2.1. Study Sample

The description of the Framingham Offspring Study is located elsewhere [10]. For the present investigation, we evaluated data from participants who attended the fifth examination cycle (1991–1995) of the Framingham Offspring Study. Details of participant inclusion are displayed in Supplementary Figure S1. For our analyses of diet–protein relations, 1913 participants who had proteomic profiling completed on the SOMAscan platform were eligible. Participants were excluded from analysis if they did not have complete dietary data (n = 200) or had missing covariate data (n = 51). This resulted in a final analytical sample of 1662. For analyses of diet–metabolite relations, 2526 participants who had metabolites assayed were eligible. Participants were excluded from analysis if they did not have complete dietary data (n = 242) or if they were missing covariate data (n = 76). This resulted in a second analytical sample of 2208 for diet–metabolite relations.

2.2. Protein Quantification

Proteomics profiling in the Framingham Offspring Study has been described previously [11,12]. Blood samples were collected from participants at the fifth exam Heart Study visit using standard phlebotomy procedures. Using the SOMAscan platform, a total of 1373 proteins were quantified using single-stranded DNA-based aptamers. Samples were assayed in two batches (n = 821 and n = 1092). For each respective batch, age and sex adjusted protein values were loge transformed and standardized to a mean = 0 and standard deviation (SD) = 1. The inter- and intra-assay reproducibility of proteins quantified on the SOMAscan platform in the Framingham Offspring Study has previously been reported [11].

2.3. Metabolite Quantification

Measurements of 216 metabolites in the Framingham Offspring Study has been previously described in detail [13,14,15]. Blood samples were collected at the fifth exam Heart Study visit. Positively charged polar, negatively charged polar, and lipid metabolites were quantified using liquid chromatography with tandem mass spectrometry (LC/MS/MS). Known standards were used to identify metabolites and internal standards were used for quality control [13]. Nomenclature for lipid metabolites includes the total lipid acyl chain-length followed by the total number of double bonds (e.g., twenty-two carbon acyl chain and six double bonds is indicated by = C22:6).

2.4. Dietary Assessment

Dietary intake at examination cycle five was assessed using the Harvard semi-quantitative food frequency questionnaire (FFQ). The Harvard FFQ measures usual frequency of consumption of 126 dietary items over the year preceding the Heart Study visit. Food frequency categories range from none or <1 serving per month to ≥ 6 servings per day. Use of the Harvard FFQ has previously been validated for the assessment of dietary intake using 7-day dietary records [16]. We only used FFQs that were considered valid (<13 blank items and estimated daily caloric intake was ≥600 kcal/d and <4000 kcal/d for women or <4200 kcal/d for men) [17].

2.5. Dietary Pattern Indices

The AHEI, DASH diet score, and MDS were constructed using dietary intake data from the aforementioned FFQ. Components and scoring criteria for each score were based on prior studies and have been described in detail elsewhere [18,19,20].
AHEI components include vegetables, fruits, nuts and legumes, sugar-sweetened beverages and fruit juice, whole grains, red and processed meat, eicosapentaenoic acid and docosahexaenoic acid, polyunsaturated fatty acids (PUFA), trans fatty acids, sodium, and alcohol [20]. For each component, a maximum score of 10 points was possible. Reverse scores (lower consumption receives a higher score) were assigned to sugar-sweetened beverages, trans fatty acids, and sodium. Individual components were summed to a maximum total score of 110 points.
The DASH diet score has 8 components, which includes fruits and fruit juices, vegetables, nuts and legumes, whole grains, low-fat dairy, sodium, red and processed meats, and sugar-sweetened beverages. For each component, scoring was based on quintiles of intake with the first quintile (Q1) receiving a score of 1 and the fifth quintile (Q5) receiving the maximum score of 5 points [19]. Reverse scores were assigned to sodium, red and processed meats, and sugar-sweetened beverages. All components were summed to a maximum DASH diet score of 40.
Lastly, the MDS components included vegetables, fruits, nuts, legumes, whole grains, fish, red meat, ratio of monounsaturated fatty acids (MUFA) to saturated fatty acids (SFA), and alcohol. Except for alcohol, all component scores are based on sex-specific quartiles of intake for our respective sample, with participants in the first quartile (Q1) receiving a score of 0 and the fourth quartile (Q4) having the maximum score of 3 [21]. Reverse scores were assigned to red and processed meat component. Participants received a score of 1 for sex-specific moderate alcohol consumption or a score of 0 for over- or under-consumption [18]. Component scores were summed to a maximum final MDS score of 25.

2.6. Covariate Assessment

We included the following covariates in our analysis: age, sex, total caloric intake, current smoking status, physical activity index, use of lipid lowering medication, use of anti-hypertensive medication, and body mass index (BMI). All covariates were assessed at the fifth examination cycle of the Framingham Offspring Study (1991–1995). We classified participants who smoked regularly in the year preceding the Heart Study visit as current smokers. Use of anti-hypertensive and lipid-lowering medications in the past year was based on self-report. BMI was calculated as measured weight in kilograms divided by the square of height in meters (kg/m2). The physical activity index was calculated based on time and intensity of activities in a day [22]. Lastly, total energy was calculated from the aforementioned semi-quantitative FFQ.

2.7. Statistical Analysis

We used multivariable linear regression models to determine the cross-sectional associations of each dietary pattern index (AHEI, DASH, and MDS; independent variables, a separate model for each) with each protein and metabolite (dependent variables, a separate model for each). We standardized all three dietary pattern indices (mean = 0, SD = 1) and modeled the standardized scores as continuous variable to maximize our statistical power. Results are reported as increments in proteins or metabolite concentrations for each SD-unit increase in the standardized dietary pattern indices (AHEI, DASH or MDS). Multivariable linear regression models included adjustment for age, sex, total caloric intake, current smoking status, physical activity index, use of lipid lowering medication, use of anti-hypertensive medication, and BMI. We calculated age- and sex-adjusted Spearman’s correlation coefficients among proteins and metabolites (separately) identified as statistically significant in our second multivariable regression model.
For all analyses we considered the Benjamini–Hochberg false discover rate (FDR) q value of ≤0.05 to define statistical significance. A Bonferroni adjustment (0.05/1373 proteins and 0.05/216 metabolites) was used to display a condensed list of top significant proteins and metabolites. Statistical analyses were completed using SAS statistical software (version 9.4; SAS Institute, Cary, NC, USA) and R (version 3.6.1) run on RStudio (RStudio: Integrated Development for R. RStudio, Inc., Boston, MA, USA).

2.8. Enrichment Analysis

We completed an enrichment analysis to determine underlying biological significance of proteins that have statistically significant associations with dietary patterns. A pathway over-representation analysis was conducted on significant (FDR q ≤ 0.05) proteins using Web-based Gene Set Analysis Toolkit (WebGestalt) [23]. Proteins were mapped to the Kyoto Encyclopedia of Genes and Genomes (KEGG) functional database [24]. KEGG pathways with less than 5 proteins or more than 2000 proteins were excluded from the analysis. Enriched pathways with an FDR q ≤ 0.05 were considered statistically significant. Significant metabolites were mapped to the KEGG functional database for descriptive annotation.

Overlap between Dietary Protein and Metabolite Quantitative Trait Loci and Prior Genome-Wide Association Study Risk Loci

Previous work in the Framingham Offspring Study has identified genetic loci (protein and metabolite quantitative trait loci [p/mQTL]) of 156 of the proteins and all of the 216 metabolites assayed at examination cycle five [25,26]. Genotyping and the identification of p/mQTLs in the Framingham Offspring Study have been described elsewhere [25,26]. In the present study, we present p/mQTL that were previously identified in the Framingham Offspring Study to be associated with proteins and/or metabolites that we observed to be significantly associated with at least one of the respective dietary patterns. We searched the NHGRI-EBI Catalogue of Published genome-wide association studies (GWAS) [27] to determine overlap between dietary p/mQTL and risk loci identified in prior GWAS.

3. Results

3.1. Sample Characteristics

Our overall study sample had an average age of 55 years and 52 percent were women. Sex-specific participant characteristics, represented as mean (SD) or frequency (proportion), are displayed in Table 1. On average, women had a lower BMI and a small proportion reported use of lipid-lowering and anti-hypertensive medications, compared to men. Additionally, women reported a lower average energy intake and had higher average AHEI and DASH dietary pattern scores.

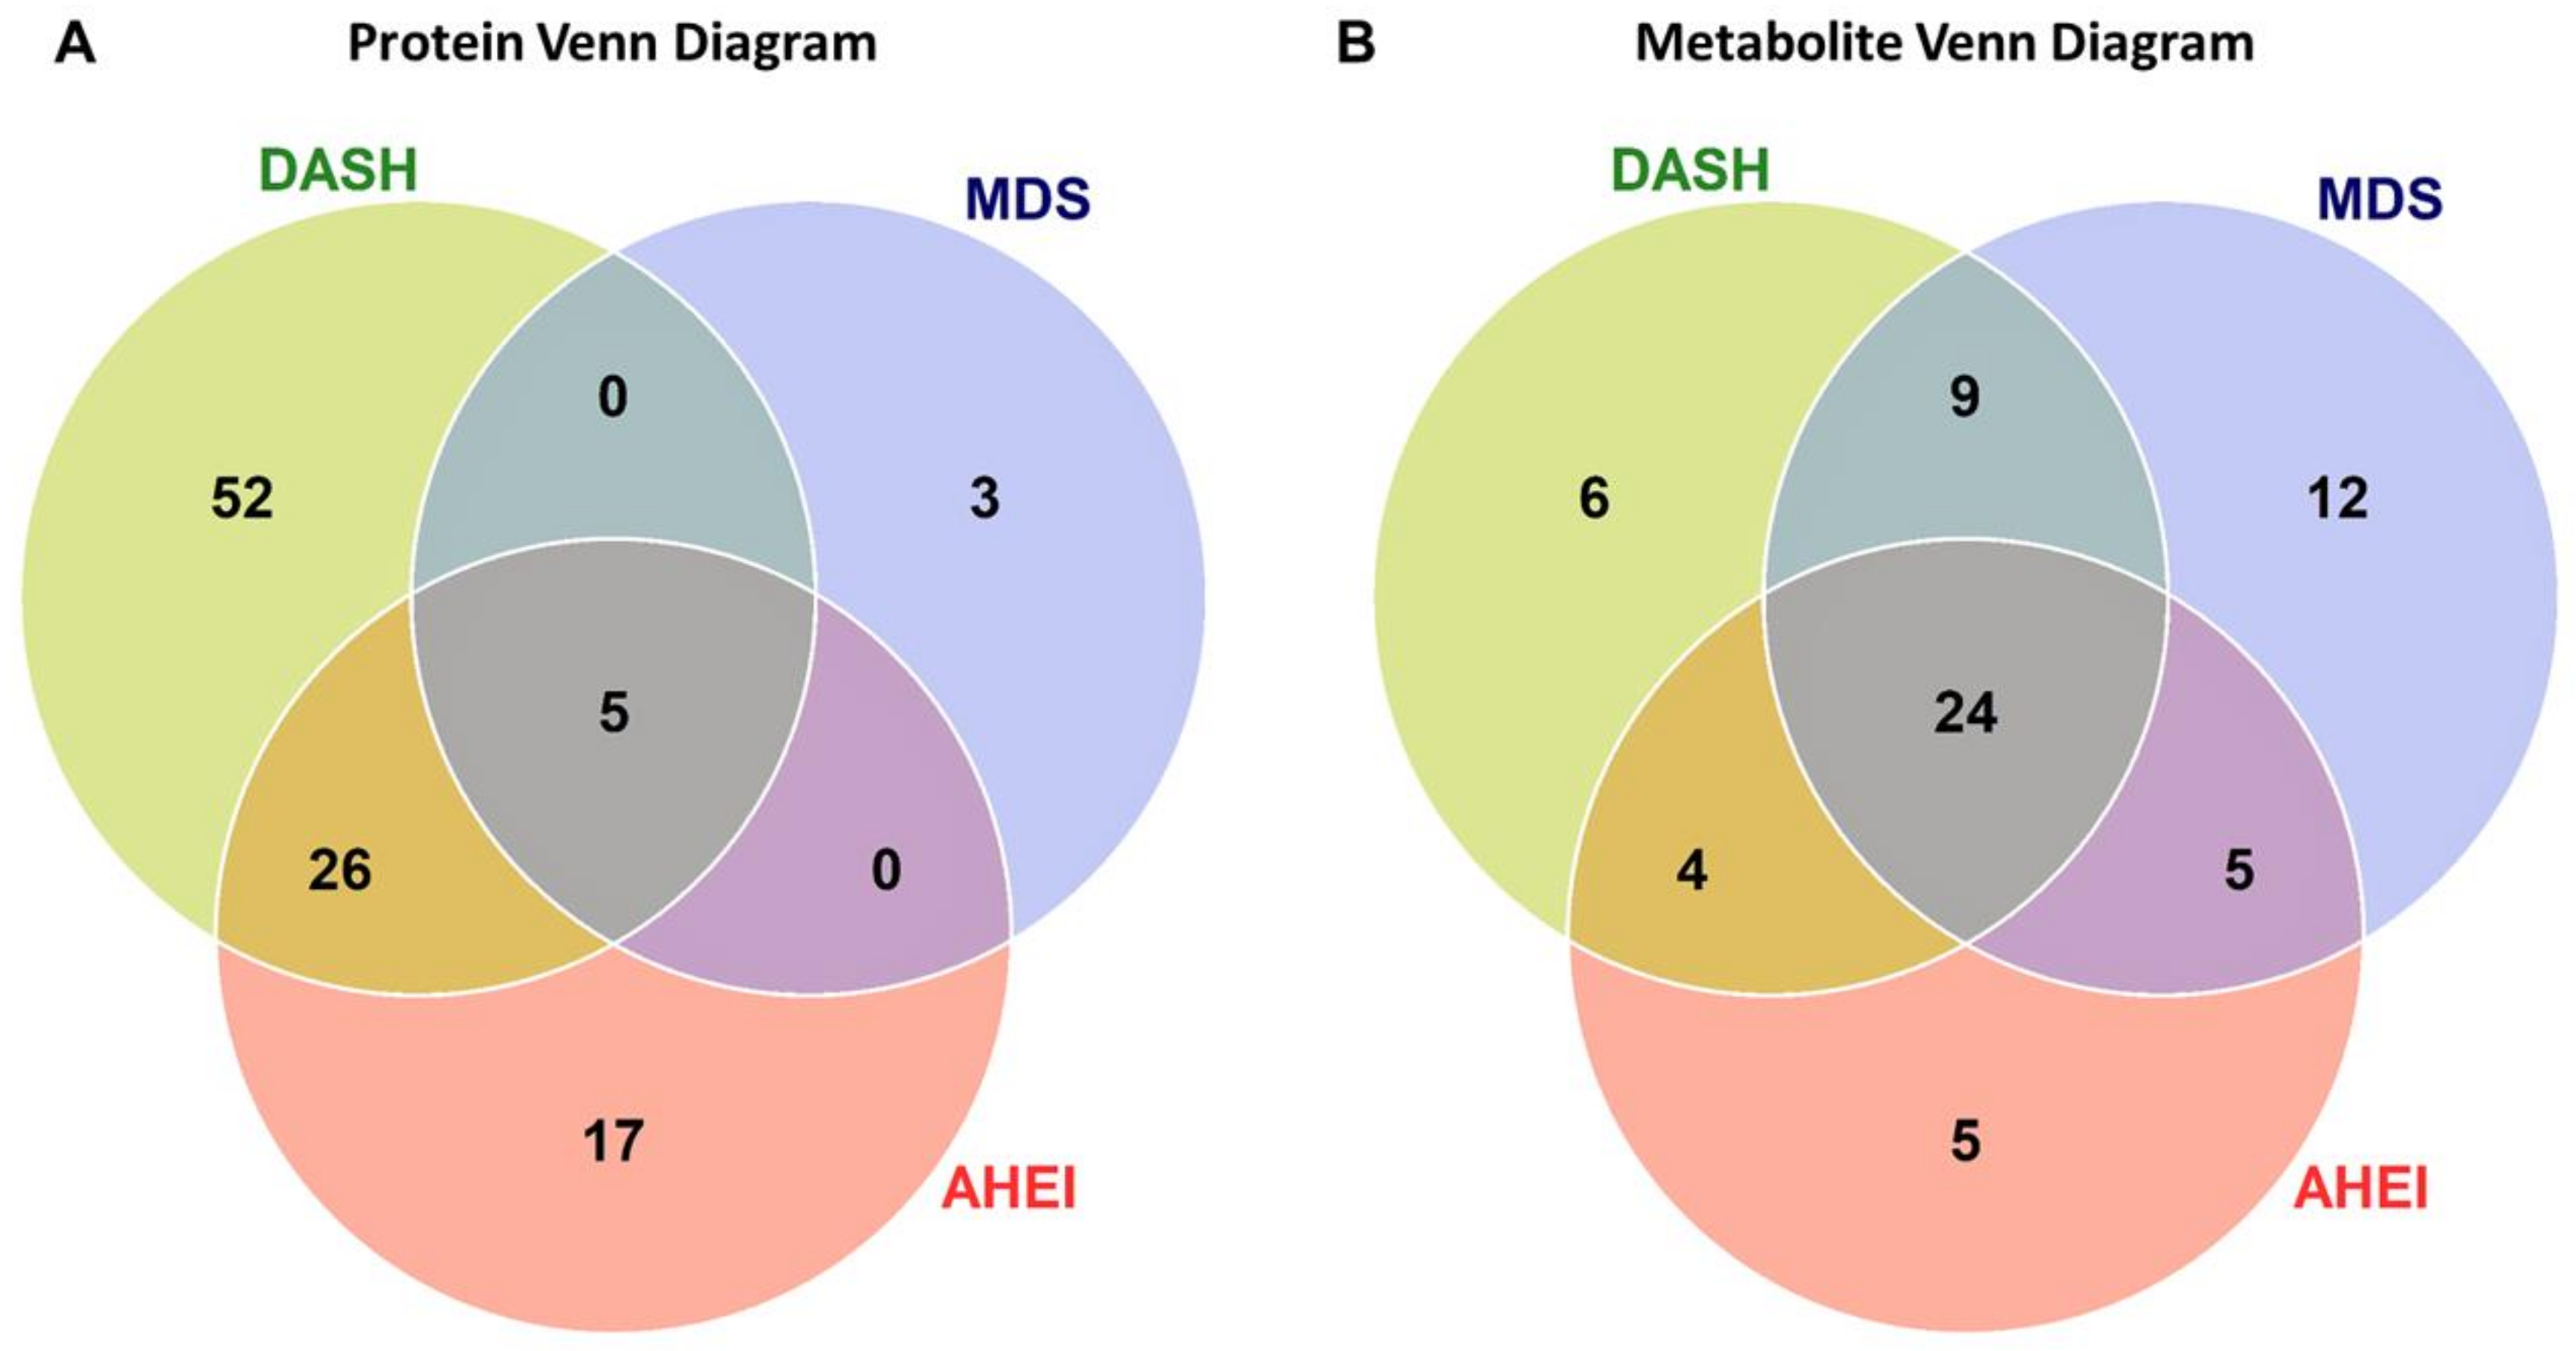
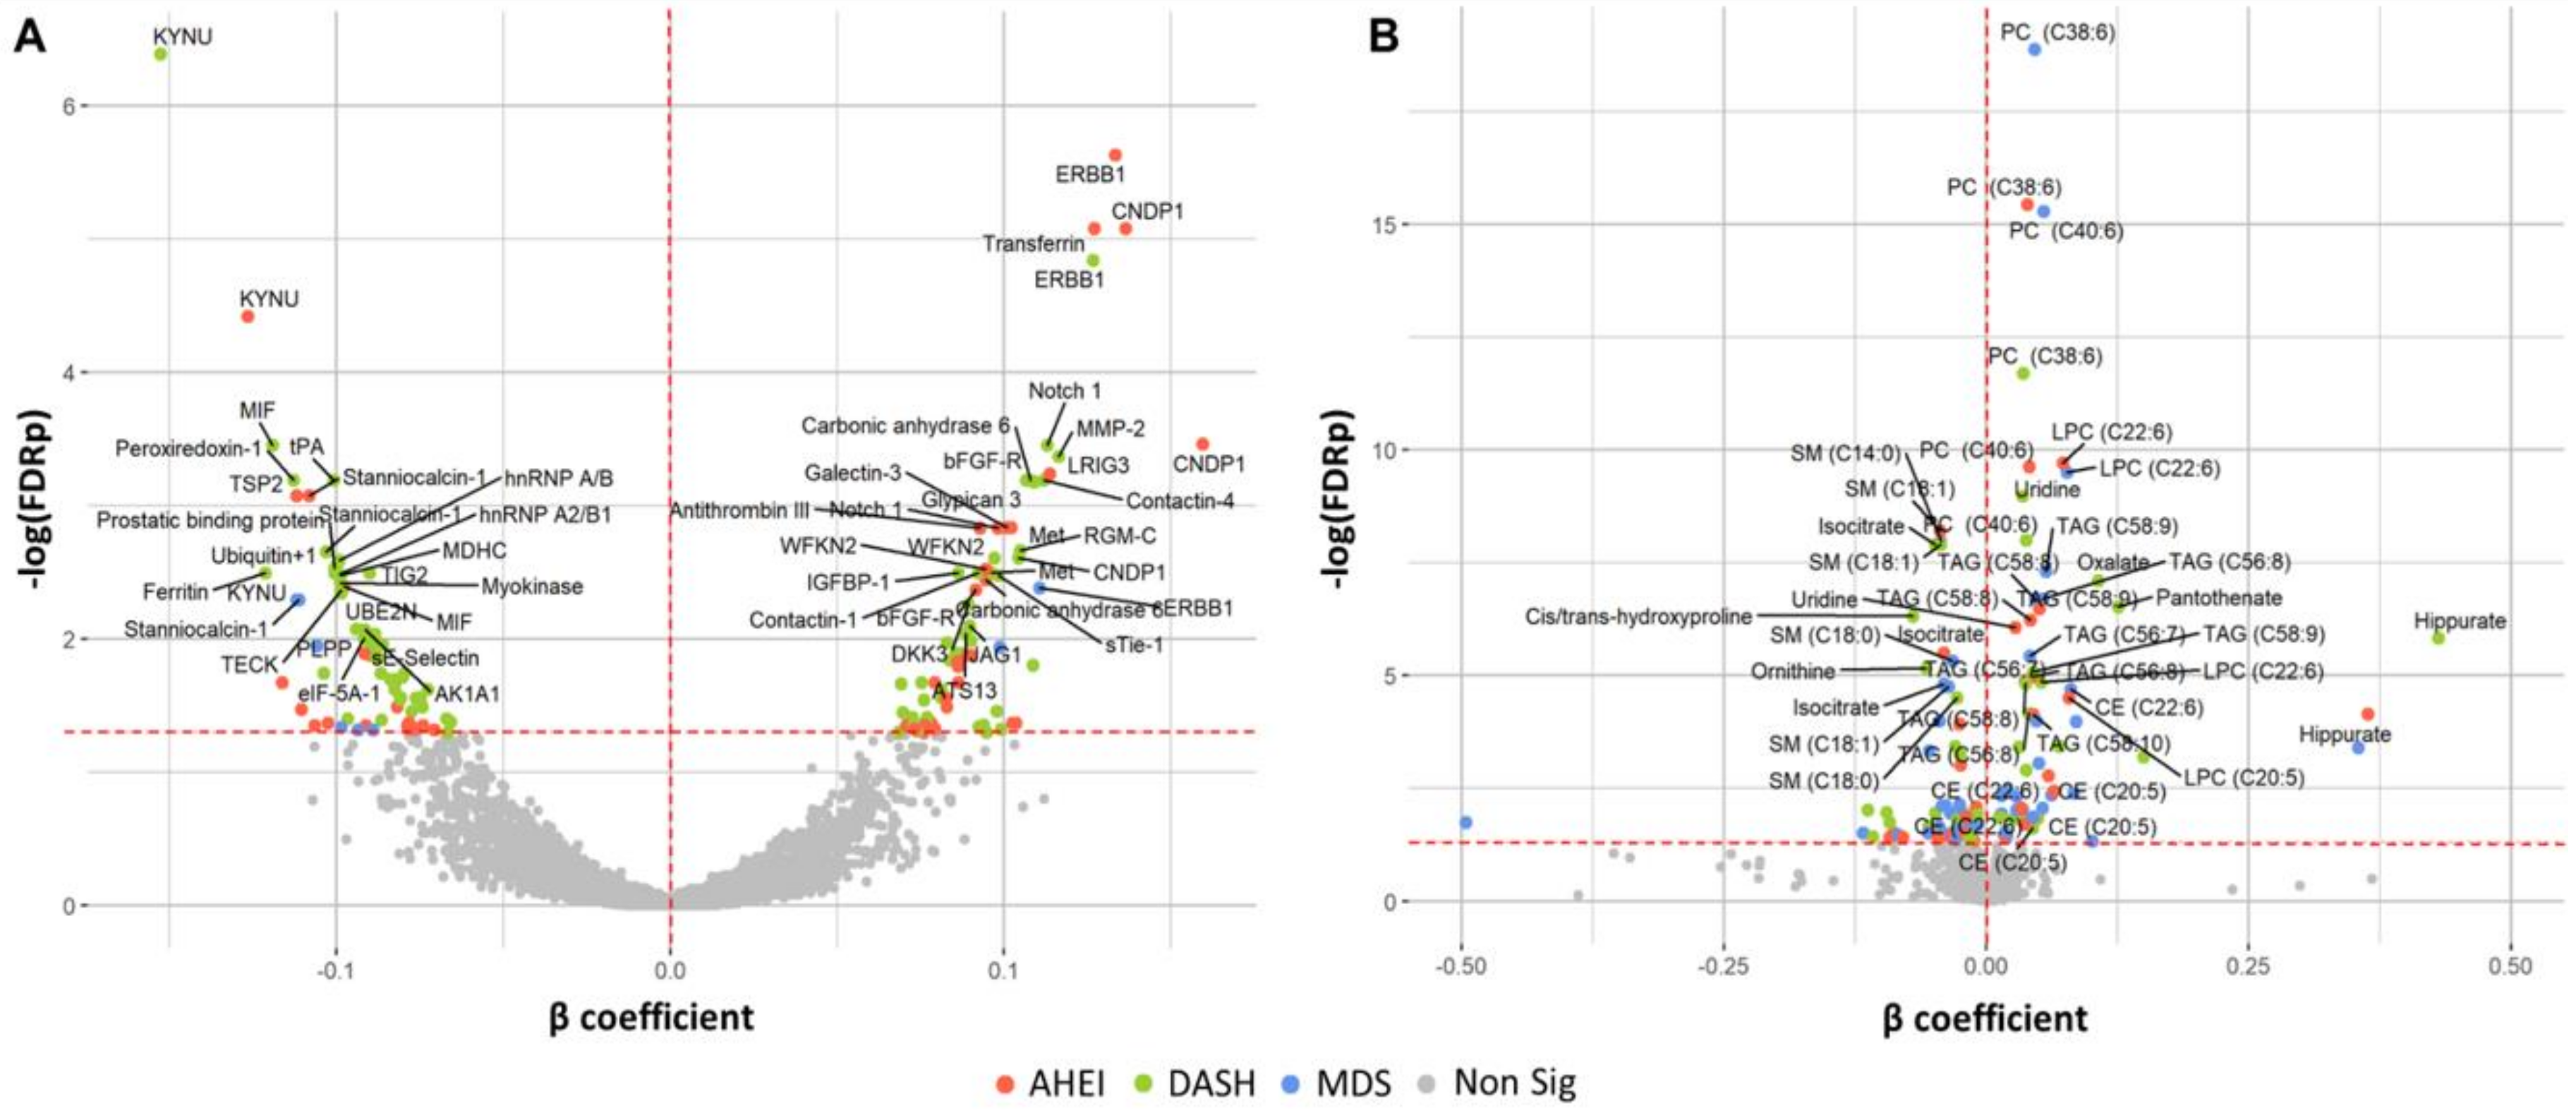
3.2. Associations of Dietary Patterns with Plasma Protein Concentrations

Overall, 103 unique proteins were significantly associated with at least one dietary pattern index (48 with AHEI, 83 with DASH, and 8 with MDS; Figure 1A). Forty-six proteins were directly associated with at least one dietary pattern index and 57 proteins had inverse associations with at least one dietary pattern index (Figure 2A). The top significant results by a Bonferroni adjustment are listed in Table 2. Beta coefficients representing the difference in concentrations of each of the 103 proteins per SD increase in the AHEI, DASH and MDS indices are listed in Supplemental Table S1. Five proteins (epidermal growth factor receptor [ERBB1], kynureninase [KYNU], stanniocalcin 1, macrophage migration inhibitory factor [MIF], and WAP, kazal, immunoglobulin, kunitz and NTR domain-containing protein 2 [WFKN2]) were significantly associated with all three dietary pattern indices. We observed that 52 proteins were uniquely associated with the DASH diet score (19 direct and 33 inverse associations; all FDR q ≤ 0.05) and 17 proteins were uniquely associated with the AHEI (7 direct and 10 inverse associations; all FDR q ≤ 0.05). Additionally, 26 proteins were significantly associated with the DASH diet score and the AHEI but not the MDS (15 direct and 11 inverse associations; all FDR q ≤ 0.05). Unlike the DASH diet score and the AHEI, associations of the MDS with plasma proteins were less evident. The MDS was significantly associated with just 8 proteins, 3 of which (p-selectin, intercellular adhesion molecular 5 [ICAM-5], and cathepsin S) uniquely related to the MDS (all FDR q ≤ 0.05). Among the 103 unique proteins, we observed two groupings of positively correlated proteins (34 proteins and 40 proteins; Figure 3). The first grouping consists of 34 proteins that primarily had inverse associations with dietary patterns and the second grouping consists of 40 proteins that primarily had positive associations with dietary patterns.

3.3. Associations of Dietary Patterns with Plasma Metabolite Concentrations

Of the 216 plasma metabolites, 65 were associated with at least one dietary pattern index (38 with AHEI, 43 with DASH, 50 with MDS; all FDR q ≤ 0.05; Figure 1B and Figure 2B). Of these, 27 metabolites had direct associations and 38 metabolites had inverse associations with a dietary pattern. The top statistically significant results after a Bonferroni correction are listed in Table 3. Beta coefficients representing the difference in concentrations of each of the 65 proteins per one-unit increase in the AHEI, DASH and MDS indices are listed in Supplemental Table S2. The majority of statistically significant metabolites associated with the three dietary patterns were lipids (55%). Additional notable classes of molecules associated with the three dietary patterns included amino acids (11%), bile acids and derivatives (5%), nucleotide metabolism (5%), and tricarboxylic acid and derivatives (5%). We observed that 24 metabolites were significantly associated (15 directly and 9 inversely) with all three dietary pattern indices (all FDR q ≤ 0.05). Half of the 24 metabolites were highly-unsaturated lipid species directly associated with the respective diet indices. Overall, we observed fewer significant unique associations of the three dietary pattern indices with metabolites than with proteins. The MDS was uniquely associated with 11 lipid species and the nucleotide metabolite adenosine monophosphate (AMP, all FDR q ≤ 0.05). The AHEI and DASH indices had fewer unique associations (5 and 6 respectively), all of which were with non-lipid metabolites (all FDR q ≤ 0.05). Of the 65 metabolites, we observed that concentrations of lipid species with a similar degree of saturation had direct correlations with each other (Figure 4).

3.4. Protein Enrichment Analysis

We completed a pathway over-representation analysis of the 103 proteins significantly associated with the AHEI, DASH, or MDS diet indices. Sixty-eight proteins successfully mapped to KEGG pathways. The top ten enriched pathways for these 68 proteins are displayed in Table 4. Seven pathways were significantly enriched by protein related to dietary patterns: complement and coagulation cascades, staphylococcus aureus infection, endocrine resistance, HIF-1 signaling pathway, central carbon metabolism in cancer, PI3K-Akt signaling pathway, and malaria (all FDR q ≤ 0.05). Additionally, three pathways had FDR q < 0.07, including fluid shear stress and atherosclerosis, Prostate cancer, and cell adhesion molecules (CAMs). Pathways were broadly involved in biological processes such as cellular proliferation, cellular metabolism, immune response, and inflammation. We completed separate analyses on the 48 proteins significantly associated with the AHEI and the 83 proteins significantly associated with the DASH diet score (Supplementary Table S3). Thirty-seven of the 48 proteins associated with the AHEI and 49 of the 83 protein associated with the DASH diet score successfully mapped to KEGG pathways. This secondary enrichment analysis suggested that proteins associated with the DASH diet score predominately enriched the HIF-1 signaling pathway, PI3K-Akt signaling pathway, malaria, fluid shear stress and atherosclerosis, and prostate cancer pathways.

3.5. Metabolite Enrichment

In a descriptive assessment, we mapped metabolites to pathways in the KEGG functional database (Supplemental Table S4). Metabolites mapped to notable pathways including bile secretion, cholesterol metabolism, and ABC transporters. Additional pathways include choline metabolism, glycerophospholipid metabolism, and vitamin digestion and absorption.

3.6. Overlap between Dietary Protein and Metabolite Quantitative Trait Loci and Prior Genome-Wide Association Study Risk Loci

Of the previously identified genetic loci associated with 156 proteins from the SOMAscan platform, 39 were related with concentrations of 25 plasma proteins that we identified as having a significant association with at least one respective dietary pattern index (Table 5). Four of these dietary pQTL were associated with clinical traits in prior GWAS analyses. In particular, a variant (rs2519093) of the ABO gene, which is directly associated with concentrations of E-selectin, has direct associations with coronary artery disease [28], venous thromboembolism [29], and cardiometabolic risk factors. Additionally, 19 mQTL were associated with concentrations of 18 metabolites, 15 of which are lipid metabolites (Table 6). Many lipid metabolites were associated with genetic variants of the of the fatty acid desaturase gene family [FADS1-2]. Genetic variants of the FADS gene cluster are associated with plasma concentrations of omega-3 and -6 fatty acids [30,31], and cardiometabolic risk factors (blood lipids, insulin, and glycemic markers) [32,33]. Further, a genetic variant of the APOA gene cluster was associated with concentrations of TAG (C52:4) and has been linked to increased susceptibility of CVD [34].

4. Discussion

Proteomic and metabolomic correlates of dietary patterns (sometimes referred to as ‘signatures’) may collectively represent an intermediate phenotype of the underlying metabolic state and provide insight into the molecular mechanisms mediating diet and chronic disease associations. In the present investigation we identified high-throughput proteomic and metabolomic signatures of dietary patterns that have been previously associated with reduced risk of chronic disease mortality from all causes [4,5]. Our main findings are four-fold; first, we identified unique proteomic correlates of the DASH and AHEI dietary patterns. Second, we identified a shared ‘signature’ of 24 metabolites associated with all three healthy dietary patterns. Third, downstream enrichment analysis indicated that proteins associated with dietary patterns are involved in biological pathways that may underlie associations between dietary patterns and metabolic health. Fourth, overlap between dietary p/mQTL and prior GWAS risk loci suggest the potential utility of dietary pattern-related proteins and metabolites as endophenotypes that may link diet to cardiometabolic health and risk of chronic disease.
Our investigation adds to the literature by relating a broad array of over 1300 plasma proteins to dietary patterns using multiplexed high-throughput single-stranded DNA aptamer technology that allows for efficient and deep profiling of the plasma proteome [35]. Of the 103 dietary pattern-related proteins in our investigation, 16 were associated with various metabolic traits (BMI, visceral adiposity, triglycerides, insulin resistance, and fasting glucose) in the Diet, Obesity, and Genes interventional trial [36,37] and 45 proteins were associated with cardiometabolic risk and/or incidence CVD in the Framingham Offspring Study [11]. In addition, our over representation analysis indicated that diet related proteins enriched biological pathways involved in cellular proliferation/metabolism and immune response/inflammation. However, we observed considerable overlap of proteins among the identified pathways. The relatively modest number of proteins that successfully mapped to KEGG pathways may have hindered a thorough enrichment analysis. Lastly, our observation that concentrations of E selectin were related to a poorer DASH diet score and a variant of the ABO gene that is directly associated with CAD may delineate a functional link between diet and metabolic health.
To the best of our knowledge, only two prior studies have examined proteomic profiles of dietary patterns [38,39]. A recent investigation by Warensjo Lemming et al. examined a panel of 184 proteins and identified 59 proteins associated with Swedish population empirically derived dietary patterns; 21 of which were validated in an independent cohort [39]. We observed significant positive associations with five of the 21 proteins (ERBB1 [EGFR], insulin like growth factor binding protein 1 [IGFBP1], programmed death ligand 2 [PDL2], galectin-3 [Gal3], and contactin 1 [CNTN1]) that are involved in processes including cellular metabolism, cellular proliferation, immune response, and cellular adhesion. Prior experimental studies indicate that gene and/or protein expression of ERBB1, PDL2, and CNTN1 is atheroprotective [40,41,42]. Further, multiple studies have reported that low concentrations of IGEBP1 are directly associated with glucose intolerance and risk of diabetes mellitus [43,44]. Notably, ERBB1 and CNTN1 were found to be inversely associated with cardiometabolic risk and/or incidence CVD [11,45]. In contrast, prior work has identified direct associations between Gal3 and heart failure [46]. Thus, the direct association of Gal3 with healthy dietary patterns warrants further investigation.
Perhaps our most intriguing finding is the unique proteomic signatures, or lack thereof, we observed across dietary patterns. Notably, the DASH diet score was associated with a unique signature of 52 proteins, which enriched pathways involved in cellular metabolism, hypoxia, inflammation, and atherosclerosis. Clinical trials have demonstrated the efficacy of the DASH diet in lowering blood pressure [3] and epidemiological studies have found that adherence to the DASH diet is associated with reduced risk of hypertension, CVD, and mortality [19,47,48]. Additional studies are needed to determine if proteins in this unique signature are associated with blood pressure lowering and other cardio-protective qualities of the DASH diet.
Similar to our investigation, two prior studies comparing hypothesis-driven dietary patterns reported just a modest number of unique dietary pattern and metabolite associations [49,50]. A higher degree of similarities across metabolomic signatures of healthy dietary patterns might indicate a generalized metabolic response of an overall healthy dietary pattern. Prior studies have reported that a large proportion of the metabolites associated with dietary patterns are lipids [49,50,51]. Lipids represented 63% of the metabolites associated with all three dietary patterns. We observed that lipids directly associated with a higher diet quality tended to have ≥5 carbon double bonds. Further, we observed that genetic variants (rs174548 and rs174550) associated with distinct highly-unsaturated lipid species had concordant associations with blood triglycerides and high-density lipoprotein metabolism [52,53]. Previous studies have found that highly-unsaturated lipids, with a longer acyl-chain length have inverse associations with risk of CVD and diabetes mellitus [54,55,56,57]. Hence, lipid correlates of dietary patterns, particularly highly-unsaturated lipids, may serve as markers of overall diet quality and may be directly related to pathogenesis of cardiometabolic and other chronic disease risks.
Lastly, we note that concentrations of several metabolites associated with the respective dietary patterns could be influenced by composition of the gut microbiome. This includes metabolites involved in choline metabolism (phosphotidylcholine, choline, and betaine), bile acid metabolism (glycocholate, deoxycholate, and deoxyglycholoate), and amino acid metabolism (tryptophan, indoxylsufate, proline, and hydroxyproline). Such metabolites have previously been linked to inflammation, chronic kidney disease, and CVD [58,59,60,61]. Metabolites related to dietary patterns and the gut microbiome may represent the functional response of diet—microbial interactions that influence metabolic health, a premise that warrants further evaluation.
The present study has several strengths. The Framingham Offspring Study is a well-established cohort with a comprehensive assessment of phenotypic, lifestyle, and dietary data on participants. We used a multiplexed aptamer-based high-throughput assay to identify and quantify a large number of plasma proteins. Lastly, we assessed three complementary dietary pattern indices that are extensively reviewed in the literature and can be readily reproduced in other study populations. Limitations of our investigation include the use of self-reported dietary data, which is prone to measurement error that may lead to misclassification and attenuation of observed associations. A more comprehensive metabolomic profile would aid in direct comparisons across studies. A large proportion of the metabolites associated with dietary patterns were lipid species that do not map to the KEGG functional database. This precluded a thorough enrichment analysis of metabolites related to dietary patterns. Participants from the Framingham Offspring Study are predominantly white and of European ancestry. Hence, our results may not be generalizable across populations that are more racially/ethnically diverse. We conducted a cross-sectional analysis and, therefore, cannot determine causality of any of the observed associations, and cannot exclude the possibility of uncontrolled or residual confounding.
In summary, the present investigation identified proteomic and metabolomic correlates of three dietary patterns. The DASH and AHEI were associated with unique proteomic signatures; whereas the largest metabolomic ‘signature’ was associated with all three dietary patterns. Proteins and metabolites related to dietary patterns may have prognostic value and inform future clinical interventions. Additional work, in in vitro and in vivo settings, is warranted to identify genetic determinants of dietary correlates and examine how they may relate to the progression of modifiable chronic disease. Findings from this investigation will require replication in independent and ethnically diverse populations.

Supplementary Materials

The following are available online at https://www.mdpi.com/2072-6643/12/5/1476/s1, Supplementary Figure S1. Participant flow diagram, Supplementary Table S1. Statistically significant associations of dietary patterns with plasma protein concentrations, Supplementary Table S2. Statistically significant associations of dietary patterns with plasma metabolite concentrations, Supplementary Table S3. Pathway over representation analysis of protein markers associated with the AHEI and DASH dietary pattern indices, Supplementary Table S4. KEGG pathway mapping of metabolites associated with dietary pattern indices.

Author Contributions

Formal analysis, M.E.W., R.J.S. and X.X.; Funding acquisition, R.E.G. and R.S.V.; Methodology, D.N., C.B.C. and V.X.; Writing—original draft, M.E.W.; Writing—review & editing, R.J.S., X.X., R.E.G., D.N., C.B.C., L.C., J.M., V.X., P.F.J. and R.S.V. All authors have read and agreed to the published version of the manuscript.

Funding

This work was supported by the NIH Multidisciplinary Training Program in Cardiovascular Epidemiology (5T32HL125232), the NIH National Heart Lung and Blood Institute (NHLBI) Framingham Heart Study (Contract Nos. NO1-HC-25195 and HHSN268201500001I and 75N92019D00031; and P20 HL113444 and P30 DK020579), NIH R01 DK108159, NIH R01 HL132320, NIH R01 DK081572, NIH R01 HL133870, and NIH R01 AG063507. Dr. Jacques is supported in part by the U.S. Department of Agriculture, Agricultural Research Service (ARS, Agreement No. #58-1950-4-003). Dr. Ma is supported in part by the NHLBI K22 (K22 HL135075-01) award. Dr. Vasan is supported in part by the Evans Medical Foundation and the Jay and Louis Coffman Endowment from the Department of Medicine, Boston University School of Medicine. Any opinions, findings, conclusions or recommendations expressed in this publication are those of the author(s) and do not necessarily reflect the view of the NIH or the ARS.

Acknowledgments

We thank and acknowledge employees and participants of the Framingham Heart Study, without whom this research would not be possible.

Conflicts of Interest

All authors declare no conflict of interest.

References

  1. Micha, R.; Peñalvo, J.L.; Cudhea, F.; Imamura, F.; Rehm, C.D.; Mozaffarian, D. Association Between Dietary Factors and Mortality From Heart Disease, Stroke, and Type 2 Diabetes in the United States. JAMA 2017, 317, 912–924. [Google Scholar] [CrossRef] [PubMed] [Green Version]
  2. Estruch, R.; Ros, E.; Salas-Salvadó, J.; Covas, M.-I.; Corella, D.; Arós, F.; Gómez-Gracia, E.; Ruiz-Gutiérrez, V.; Fiol, M.; Lapetra, J.; et al. Primary Prevention of Cardiovascular Disease with a Mediterranean Diet Supplemented with Extra-Virgin Olive Oil or Nuts. N. Engl. J. Med. 2018, 378, e34. [Google Scholar] [CrossRef] [PubMed]
  3. Appel, L.J.; Moore, T.J.; Obarzanek, E.; Vollmer, W.M.; Svetkey, L.P.; Sacks, F.M.; Bray, G.A.; Vogt, T.M.; Cutler, J.A.; Windhauser, M.M.; et al. A Clinical Trial of the Effects of Dietary Patterns on Blood Pressure. N. Engl. J. Med. 1997, 336, 1117–1124. [Google Scholar] [CrossRef] [PubMed] [Green Version]
  4. Reedy, J.; Krebs-Smith, S.M.; Miller, P.E.; Liese, A.D.; Kahle, L.L.; Park, Y.; Subar, A.F. Higher diet quality is associated with decreased risk of all-cause, cardiovascular disease, and cancer mortality among older adults. J. Nutr. 2014, 144, 881–889. [Google Scholar] [CrossRef] [Green Version]
  5. Harmon, B.E.; Boushey, C.J.; Shvetsov, Y.B.; Ettienne, R.; Reedy, J.; Wilkens, L.R.; Le Marchand, L.; Henderson, B.E.; Kolonel, L.N. Associations of key diet-quality indexes with mortality in the Multiethnic Cohort: The Dietary Patterns Methods Project. Am. J. Clin. Nutr. 2015, 101, 587–597. [Google Scholar] [CrossRef] [Green Version]
  6. Brennan, L.; Hu, F.B. Metabolomics-Based Dietary Biomarkers in Nutritional Epidemiology-Current Status and Future Opportunities. Mol. Nutr. Food Res. 2019, 63, e1701064. [Google Scholar] [CrossRef]
  7. Playdon, M.C.; Ziegler, R.G.; Sampson, J.N.; Stolzenberg-Solomon, R.; Thompson, H.J.; Irwin, M.L.; Mayne, S.T.; Hoover, R.N.; Moore, S.C. Nutritional metabolomics and breast cancer risk in a prospective study. Am. J. Clin. Nutr. 2017, 106, 637–649. [Google Scholar] [CrossRef]
  8. Guertin, K.A.; Loftfield, E.; Boca, S.M.; Sampson, J.N.; Moore, S.C.; Xiao, Q.; Huang, W.-Y.; Xiong, X.; Freedman, N.D.; Cross, A.J.; et al. Serum biomarkers of habitual coffee consumption may provide insight into the mechanism underlying the association between coffee consumption and colorectal cancer. Am. J. Clin. Nutr. 2015, 101, 1000–1011. [Google Scholar] [CrossRef]
  9. Akbaraly, T.; Würtz, P.; Singh-Manoux, A.; Shipley, M.J.; Haapakoski, R.; Lehto, M.; Desrumaux, C.; Kähönen, M.; Lehtimäki, T.; Mikkilä, V.; et al. Association of circulating metabolites with healthy diet and risk of cardiovascular disease: Analysis of two cohort studies. Sci. Rep. 2018, 8, 1–14. [Google Scholar] [CrossRef]
  10. Kannel, W.B.; Feinleib, M.; McNamara, P.M.; Garrison, R.J.; Castelli, W.P. An investigation of coronary heart disease in families. The Framingham offspring study. Am. J. Epidemiol. 1979, 110, 281–290. [Google Scholar] [CrossRef]
  11. Ngo, D.; Sinha, S.; Shen, D.; Kuhn, E.W.; Keyes, M.J.; Shi, X.; Benson, M.D.; O’Sullivan, J.F.; Keshishian, H.; Farrell, L.A.; et al. Aptamer-Based Proteomic Profiling Reveals Novel Candidate Biomarkers and Pathways in Cardiovascular Disease. Circulation 2016, 134, 270–285. [Google Scholar] [CrossRef] [PubMed] [Green Version]
  12. Ko, D.; Benson, M.D.; Ngo, D.; Yang, Q.; Larson, M.G.; Wang, T.J.; Trinquart, L.; McManus, D.D.; Lubitz, S.A.; Ellinor, P.T.; et al. Proteomics Profiling and Risk of New-Onset Atrial Fibrillation: Framingham Heart Study. J. Am. Heart Assoc. 2019, 8, e010976. [Google Scholar] [CrossRef] [PubMed] [Green Version]
  13. Wang, T.J.; Larson, M.G.; Vasan, R.S.; Cheng, S.; Rhee, E.P.; McCabe, E.; Lewis, G.D.; Fox, C.S.; Jacques, P.F.; Fernandez, C.; et al. Metabolite profiles and the risk of developing diabetes. Nat. Med. 2011, 17, 448–453. [Google Scholar] [CrossRef] [PubMed]
  14. Rhee, E.P.; Cheng, S.; Larson, M.G.; Walford, G.A.; Lewis, G.D.; McCabe, E.; Yang, E.; Farrell, L.; Fox, C.S.; O’Donnell, C.J.; et al. Lipid profiling identifies a triacylglycerol signature of insulin resistance and improves diabetes prediction in humans. J. Clin. Investig. 2011, 121, 1402–1411. [Google Scholar] [CrossRef] [Green Version]
  15. Wang, T.J.; Ngo, D.; Psychogios, N.; Dejam, A.; Larson, M.G.; Vasan, R.S.; Ghorbani, A.; O’Sullivan, J.; Cheng, S.; Rhee, E.P.; et al. 2-Aminoadipic acid is a biomarker for diabetes risk. J. Clin. Investig. 2013, 123, 4309–4317. [Google Scholar] [CrossRef]
  16. Feskanich, D.; Rimm, E.B.; Giovannucci, E.L.; Colditz, G.A.; Stampfer, M.J.; Litin, L.B.; Willett, W.C. Reproducibility and validity of food intake measurements from a semiquantitative food frequency questionnaire. J. Am. Diet. Assoc. 1993, 93, 790–796. [Google Scholar] [CrossRef]
  17. Willett, W. Nutritional Epidemiology; Oxford University Press: Oxford, UK, 2012; ISBN 978-0-19-024084-4. [Google Scholar]
  18. Fung, T.T.; Rexrode, K.M.; Mantzoros, C.S.; Manson, J.E.; Willett, W.C.; Hu, F.B. Mediterranean Diet and Incidence of and Mortality From Coronary Heart Disease and Stroke in Women. Circulation 2009, 119, 1093–1100. [Google Scholar] [CrossRef] [Green Version]
  19. Fung, T.T.; Chiuve, S.E.; McCullough, M.L.; Rexrode, K.M.; Logroscino, G.; Hu, F.B. Adherence to a DASH-style diet and risk of coronary heart disease and stroke in women. Arch. Intern. Med. 2008, 168, 713–720. [Google Scholar] [CrossRef] [Green Version]
  20. Chiuve, S.E.; Fung, T.T.; Rimm, E.B.; Hu, F.B.; McCullough, M.L.; Wang, M.; Stampfer, M.J.; Willett, W.C. Alternative dietary indices both strongly predict risk of chronic disease. J. Nutr. 2012, 142, 1009–1018. [Google Scholar] [CrossRef] [Green Version]
  21. Ma, J.; Hennein, R.; Liu, C.; Long, M.T.; Hoffmann, U.; Jacques, P.F.; Lichtenstein, A.H.; Hu, F.B.; Levy, D. Improved Diet Quality Associates With Reduction in Liver Fat, Particularly in Individuals With High Genetic Risk Scores for Nonalcoholic Fatty Liver Disease. Gastroenterology 2018, 155, 107–117. [Google Scholar] [CrossRef] [Green Version]
  22. Kannel, W.B.; Sorlie, P. Some health benefits of physical activity. The Framingham Study. Arch. Intern. Med. 1979, 139, 857–861. [Google Scholar] [CrossRef] [PubMed]
  23. Liao, Y.; Wang, J.; Jaehnig, E.J.; Shi, Z.; Zhang, B. WebGestalt 2019: Gene set analysis toolkit with revamped UIs and APIs. Nucleic Acids Res. 2019, 47, W199–W205. [Google Scholar] [CrossRef] [PubMed] [Green Version]
  24. Kanehisa, M.; Goto, S. KEGG: Kyoto encyclopedia of genes and genomes. Nucleic Acids Res. 2000, 28, 27–30. [Google Scholar] [CrossRef] [PubMed]
  25. Rhee, E.P.; Ho, J.E.; Chen, M.-H.; Shen, D.; Cheng, S.; Larson, M.G.; Ghorbani, A.; Shi, X.; Helenius, I.T.; O’Donnell, C.J.; et al. A Genome-Wide Association Study of the Human Metabolome in a Community-Based Cohort. Cell Metab. 2013, 18, 130–143. [Google Scholar] [CrossRef] [Green Version]
  26. Benson, M.D.; Yang, Q.; Ngo, D.; Zhu, Y.; Shen, D.; Farrell, L.A.; Sinha, S.; Keyes, M.J.; Vasan, R.S.; Larson, M.G.; et al. Genetic Architecture of the Cardiovascular Risk Proteome. Circulation 2018, 137, 1158–1172. [Google Scholar] [CrossRef]
  27. MacArthur, J.; Bowler, E.; Cerezo, M.; Gil, L.; Hall, P.; Hastings, E.; Junkins, H.; McMahon, A.; Milano, A.; Morales, J.; et al. The new NHGRI-EBI Catalog of published genome-wide association studies (GWAS Catalog). Nucleic Acids Res. 2017, 45, D896–D901. [Google Scholar] [CrossRef]
  28. Van der Harst, P.; Verweij, N. Identification of 64 Novel Genetic Loci Provides an Expanded View on the Genetic Architecture of Coronary Artery Disease. Circ. Res. 2018, 122, 433–443. [Google Scholar] [CrossRef]
  29. Lindström, S.; Wang, L.; Smith, E.N.; Gordon, W.; van Hylckama Vlieg, A.; de Andrade, M.; Brody, J.A.; Pattee, J.W.; Haessler, J.; Brumpton, B.M.; et al. Genomic and transcriptomic association studies identify 16 novel susceptibility loci for venous thromboembolism. Blood 2019, 134, 1645–1657. [Google Scholar] [CrossRef]
  30. Lemaitre, R.N.; Tanaka, T.; Tang, W.; Manichaikul, A.; Foy, M.; Kabagambe, E.K.; Nettleton, J.A.; King, I.B.; Weng, L.-C.; Bhattacharya, S.; et al. Genetic loci associated with plasma phospholipid n-3 fatty acids: A meta-analysis of genome-wide association studies from the CHARGE Consortium. PLoS Genet. 2011, 7, e1002193. [Google Scholar] [CrossRef] [Green Version]
  31. Guan, W.; Steffen, B.T.; Lemaitre, R.N.; Wu, J.H.Y.; Tanaka, T.; Manichaikul, A.; Foy, M.; Rich, S.S.; Wang, L.; Nettleton, J.A.; et al. Genome-wide association study of plasma N6 polyunsaturated fatty acids within the cohorts for heart and aging research in genomic epidemiology consortium. Circ. Cardiovasc. Genet. 2014, 7, 321–331. [Google Scholar] [CrossRef] [Green Version]
  32. Dupuis, J.; Langenberg, C.; Prokopenko, I.; Saxena, R.; Soranzo, N.; Jackson, A.U.; Wheeler, E.; Glazer, N.L.; Bouatia-Naji, N.; Gloyn, A.L.; et al. New genetic loci implicated in fasting glucose homeostasis and their impact on type 2 diabetes risk. Nat. Genet. 2010, 42, 105–116. [Google Scholar] [CrossRef] [PubMed]
  33. Wojcik, G.L.; Graff, M.; Nishimura, K.K.; Tao, R.; Haessler, J.; Gignoux, C.R.; Highland, H.M.; Patel, Y.M.; Sorokin, E.P.; Avery, C.L.; et al. Genetic analyses of diverse populations improves discovery for complex traits. Nature 2019, 570, 514–518. [Google Scholar] [CrossRef] [PubMed]
  34. Nelson, C.P.; Goel, A.; Butterworth, A.S.; Kanoni, S.; Webb, T.R.; Marouli, E.; Zeng, L.; Ntalla, I.; Lai, F.Y.; Hopewell, J.C.; et al. Association analyses based on false discovery rate implicate new loci for coronary artery disease. Nat. Genet. 2017, 49, 1385–1391. [Google Scholar] [CrossRef] [PubMed]
  35. Gold, L.; Ayers, D.; Bertino, J.; Bock, C.; Bock, A.; Brody, E.N.; Carter, J.; Dalby, A.B.; Eaton, B.E.; Fitzwater, T.; et al. Aptamer-based multiplexed proteomic technology for biomarker discovery. PLoS ONE 2010, 5, e15004. [Google Scholar] [CrossRef] [PubMed] [Green Version]
  36. Carayol, J.; Chabert, C.; Cara, A.D.; Armenise, C.; Lefebvre, G.; Langin, D.; Viguerie, N.; Metairon, S.; Saris, W.H.M.; Astrup, A.; et al. Protein quantitative trait locus study in obesity during weight-loss identifies a leptin regulator. Nat. Commun. 2017, 8, 1–14. [Google Scholar] [CrossRef]
  37. Ruffieux, H.; Carayol, J.; Harper, M.E.; Dent, R.; Saris, W.H.M.; Astrup, A.; Davison, A.C.; Hager, J.; Valsesia, A. A large-scale multivariate pQTL study sheds light on the genetic architecture of obesity. bioRxiv 2019, 524405. [Google Scholar] [CrossRef] [Green Version]
  38. García-Bailo, B.; Brenner, D.R.; Nielsen, D.; Lee, H.-J.; Domanski, D.; Kuzyk, M.; Borchers, C.H.; Badawi, A.; Karmali, M.A.; El-Sohemy, A. Dietary patterns and ethnicity are associated with distinct plasma proteomic groups. Am. J. Clin. Nutr. 2012, 95, 352–361. [Google Scholar] [CrossRef]
  39. Warensjö Lemming, E.; Byberg, L.; Stattin, K.; Ahmad, S.; Lind, L.; Elmståhl, S.; Larsson, S.C.; Wolk, A.; Michaëlsson, K. Dietary Pattern Specific Protein Biomarkers for Cardiovascular Disease: A Cross-Sectional Study in 2 Independent Cohorts. J. Am. Heart Assoc. 2019, 8, e011860. [Google Scholar] [CrossRef]
  40. Wang, L.; Huang, Z.; Huang, W.; Chen, X.; Shan, P.; Zhong, P.; Khan, Z.; Wang, J.; Fang, Q.; Liang, G.; et al. Inhibition of epidermal growth factor receptor attenuates atherosclerosis via decreasing inflammation and oxidative stress. Sci. Rep. 2017, 7, 1–14. [Google Scholar] [CrossRef] [Green Version]
  41. Simons, K.H.; de Jong, A.; Jukema, J.W.; de Vries, M.R.; Arens, R.; Quax, P.H.A. T cell co-stimulation and co-inhibition in cardiovascular disease: A double-edged sword. Nat. Rev. Cardiol. 2019, 16, 325–343. [Google Scholar] [CrossRef]
  42. Nai, W.; Threapleton, D.; Lu, J.; Zhang, K.; Wu, H.; Fu, Y.; Wang, Y.; Ou, Z.; Shan, L.; Ding, Y.; et al. Identification of novel genes and pathways in carotid atheroma using integrated bioinformatic methods. Sci. Rep. 2016, 6, 1–11. [Google Scholar] [CrossRef] [PubMed]
  43. Sandhu, M.S.; Heald, A.H.; Gibson, J.M.; Cruickshank, J.K.; Dunger, D.B.; Wareham, N.J. Circulating concentrations of insulin-like growth factor-I and development of glucose intolerance: A prospective observational study. Lancet 2002, 359, 1740–1745. [Google Scholar] [CrossRef]
  44. Lewitt, M.S.; Hilding, A.; Ostenson, C.-G.; Efendic, S.; Brismar, K.; Hall, K. Insulin-like growth factor-binding protein-1 in the prediction and development of type 2 diabetes in middle-aged Swedish men. Diabetologia 2008, 51, 1135–1145. [Google Scholar] [CrossRef] [PubMed] [Green Version]
  45. Ho Jennifer, E.; Lyass, A.; Courchesne, P.; Chen, G.; Liu, C.; Yin, X.; Hwang, S.-J.; Massaro, J.M.; Larson, M.G.; Levy, D. Protein Biomarkers of Cardiovascular Disease and Mortality in the Community. J. Am. Heart Assoc. 2018, 7, e008108. [Google Scholar] [CrossRef] [Green Version]
  46. Ho, J.E.; Liu, C.; Lyass, A.; Courchesne, P.; Pencina, M.J.; Vasan, R.S.; Larson, M.G.; Levy, D. Galectin-3, a Marker of Cardiac Fibrosis, Predicts Incident Heart Failure in the Community. J. Am. Coll. Cardiol. 2012, 60, 1249–1256. [Google Scholar] [CrossRef] [PubMed] [Green Version]
  47. Forman, J.P.; Stampfer, M.J.; Curhan, G.C. Diet and lifestyle risk factors associated with incident hypertension in women. JAMA 2009, 302, 401–411. [Google Scholar] [CrossRef] [PubMed] [Green Version]
  48. Schwingshackl, L.; Hoffmann, G. Diet quality as assessed by the Healthy Eating Index, the Alternate Healthy Eating Index, the Dietary Approaches to Stop Hypertension score, and health outcomes: A systematic review and meta-analysis of cohort studies. J. Acad. Nutr. Diet. 2015, 115, 780–800.e5. [Google Scholar] [CrossRef]
  49. Playdon, M.C.; Moore, S.C.; Derkach, A.; Reedy, J.; Subar, A.F.; Sampson, J.N.; Albanes, D.; Gu, F.; Kontto, J.; Lassale, C.; et al. Identifying biomarkers of dietary patterns by using metabolomics. Am. J. Clin. Nutr. 2017, 105, 450–465. [Google Scholar] [CrossRef] [Green Version]
  50. McCullough, M.L.; Maliniak, M.L.; Stevens, V.L.; Carter, B.D.; Hodge, R.A.; Wang, Y. Metabolomic markers of healthy dietary patterns in US postmenopausal women. Am. J. Clin. Nutr. 2019, 109, 1439–1451. [Google Scholar] [CrossRef]
  51. Rebholz, C.M.; Lichtenstein, A.H.; Zheng, Z.; Appel, L.J.; Coresh, J. Serum untargeted metabolomic profile of the Dietary Approaches to Stop Hypertension (DASH) dietary pattern. Am. J. Clin. Nutr. 2018, 108, 243–255. [Google Scholar] [CrossRef]
  52. Waterworth, D.M.; Ricketts, S.L.; Song, K.; Chen, L.; Zhao, J.H.; Ripatti, S.; Aulchenko, Y.S.; Zhang, W.; Yuan, X.; Lim, N.; et al. Genetic variants influencing circulating lipid levels and risk of coronary artery disease. Arterioscler. Thromb. Vasc. Biol. 2010, 30, 2264–2276. [Google Scholar] [CrossRef]
  53. Hoffmann, T.J.; Theusch, E.; Haldar, T.; Ranatunga, D.K.; Jorgenson, E.; Medina, M.W.; Kvale, M.N.; Kwok, P.-Y.; Schaefer, C.; Krauss, R.M.; et al. A large electronic health record-based genome-wide study of serum lipids. Nat. Genet. 2018, 50, 401–413. [Google Scholar] [CrossRef] [PubMed]
  54. Stegemann, C.; Pechlaner, R.; Willeit, P.; Langley, S.R.; Mangino, M.; Mayr, U.; Menni, C.; Moayyeri, A.; Santer, P.; Rungger, G.; et al. Lipidomics Profiling and Risk of Cardiovascular Disease in the Prospective Population-Based Bruneck Study. Circulation 2014, 129, 1821–1831. [Google Scholar] [CrossRef] [Green Version]
  55. Rhee, E.P.; Yang, Q.; Yu, B.; Liu, X.; Cheng, S.; Deik, A.; Pierce, K.A.; Bullock, K.; Ho, J.E.; Levy, D.; et al. An exome array study of the plasma metabolome. Nat. Commun. 2016, 7, 12360. [Google Scholar] [CrossRef] [PubMed]
  56. Wang, D.D.; Zheng, Y.; Toledo, E.; Razquin, C.; Ruiz-Canela, M.; Guasch-Ferré, M.; Yu, E.; Corella, D.; Gómez-Gracia, E.; Fiol, M.; et al. Lipid metabolic networks, Mediterranean diet and cardiovascular disease in the PREDIMED trial. Int. J. Epidemiol. 2018, 47, 1830–1845. [Google Scholar] [CrossRef] [PubMed] [Green Version]
  57. Toledo, E.; Wang, D.D.; Ruiz-Canela, M.; Clish, C.B.; Razquin, C.; Zheng, Y.; Guasch-Ferré, M.; Hruby, A.; Corella, D.; Gómez-Gracia, E.; et al. Plasma lipidomic profiles and cardiovascular events in a randomized intervention trial with the Mediterranean diet. Am. J. Clin. Nutr. 2017, 106, 973–983. [Google Scholar] [CrossRef]
  58. Ridlon, J.M.; Kang, D.J.; Hylemon, P.B.; Bajaj, J.S. Bile Acids and the Gut Microbiome. Curr. Opin. Gastroenterol. 2014, 30, 332–338. [Google Scholar] [CrossRef] [Green Version]
  59. Roager, H.M.; Licht, T.R. Microbial tryptophan catabolites in health and disease. Nat. Commun. 2018, 9, 1–10. [Google Scholar] [CrossRef] [Green Version]
  60. Yang, C.-Y.; Tarng, D.-C. Diet, gut microbiome and indoxyl sulphate in chronic kidney disease patients. Nephrology (Carlton) 2018, 23, 16–20. [Google Scholar] [CrossRef] [Green Version]
  61. Tang, W.H.W.; Wang, Z.; Levison, B.S.; Koeth, R.A.; Britt, E.B.; Fu, X.; Wu, Y.; Hazen, S.L. Intestinal Microbial Metabolism of Phosphatidylcholine and Cardiovascular Risk. N. Engl. J. Med. 2013, 368, 1575–1584. [Google Scholar] [CrossRef] [Green Version]
Figure 1. The number of protein (A) and metabolite (B) markers associated with dietary pattern indices. Venn diagrams illustrate the overlap of significant proteins (FDR q ≤ 0.05) and metabolites across the AHEI, DASH, and MDS dietary patterns. Significant proteins and metabolites were based on a false discovery rate threshold ≤ 0.05 from multivariable models adjusted for age, sex, total caloric intake, current smoking, physical activity index, lipid lowering medication, anti-hypertensive medication, and body mass index. Abbreviations: AHEI, Alternative Healthy Eating Index; DASH, Dietary Approaches to Stop Hypertension; FDR, false discovery rate; MDS, Mediterranean-style Diet Score.
Nutrients 12 01476 g001
Figure 2. Protein (A) and metabolite (B) markers associated with dietary pattern indices. Colored points (red, green, blue) indicate statistical significance (FDR q ≤ 0.05) by the respective dietary pattern indices. Multivariable regression models are adjusted for age, sex, total caloric intake, current smoking, physical activity index, lipid lowering medication, anti-hypertensive medication, and body mass index. β estimates represent the change in marker per one-unit increase in the respective dietary pattern indices. Eleven metabolites with β coefficients < −0.50 or >0.50 are excluded from the figure. Abbreviations: AHEI, Alternative Healthy Eating Index; CE, cholesterol ester; DASH, Dietary Approaches to Stop Hypertension; FDR, false discovery rate; LPC, lysophosphatidylcholine; LPE, lysophosphatidylethanolamine; MDS, Mediterranean-style Diet Score. PC, phosphatidylcholine; SM, sphingomyelin; TAG, triacylglycerol.
Nutrients 12 01476 g002
Figure 3. Heatmap depicting Spearman’s partial correlation coefficients adjusted for age and sex between proteins that were statistically significant (FDR p ≤ 0.05) in multivariable models adjusting for age, sex, total caloric intake, current smoking, physical activity index, lipid lowering medication, anti-hypertensive medication, and body mass index.
Nutrients 12 01476 g003
Figure 4. Heatmap depicting Spearman’s partial correlation coefficients adjusted for age and sex between metabolites that were statistically significant (FDR p ≤ 0.05) in multivariable models adjusting for age, sex, total caloric intake, current smoking, physical activity index, lipid lowering medication, anti-hypertensive medication, and body mass index. CE, cholesterol ester; FDR, false discovery rate; LPC, lysophosphatidylcholine; LPE, lysophosphatidylethanolamine; PC, phosphatidylcholine; SM, sphingomyelin; TAG, triacylglycerol.
Nutrients 12 01476 g004
Table 1. Sample characteristics at examination five of the Framingham Offspring Study.1
MenWomen
n = 2208Mean ± SDMean ± SD
n = 1054n = 1154
Age, yr55.7 ± 9.954.5 ± 9.6
Current smoker, n (%)190 (18%)210 (18%)
Physical activity score36.0 ± 7.433.4 ± 4.7
BMI, kg/m228.2 ± 4.126.7 ± 5.4
Lipid-lowering medications, n (%)101 (10)67 (6)
Anti-hypertensive medication, n (%)238 (23)195 (17)
Energy intake, kcal/day1992 ± 6421742 ± 566
AHEI (0–110)48.0 ± 9.651.7 ± 9.7
DASH (0–40)23.0 ± 4.925.3 ± 4.7
MDS (0–25)12.3 ± 4.312.0 ± 4.4
Food Group Intake
 Vegetables, svg/d2.0 ± 1.32.4 ± 1.7
 Fruits, svg/d1.2 ± 1.01.4 ± 1.2
 Low-fat dairy, svg/d0.8 ± 0.90.9 ± 1.0
 Nuts, svg/wk0.4 ± 0.60.2 ± 0.4
 Legumes, svg/wk0.3 ± 0.30.3 ± 0.3
 Whole grains, svg/wk1.2 ± 1.21.2 ± 1.2
 Red/processed meat, svg/wk0.9 ± 0.70.6 ± 0.5
 Fish, svg/wk0.3 ± 0.30.3 ± 0.3
 Sugar-sweetened beverage & fruit juice, svg/wk1.4 ± 1.21.1 ± 1.2
 Sugar-sweetened beverage, svg/wk0.5 ± 0.80.3 ± 0.6
 Fruit juice, svg/wk0.9 ± 0.90.8 ± 0.9
 Alcohol, gm/day15.4 ± 20.06.7 ± 11.2
 MUFA:SFA1.1 ± 0.21.1 ± 0.2
 MUFA, %kcal11.3 ± 2.710.9 ± 2.6
 SFA, % kcal10.5 ± 3.010.3 ± 2.8
 PUFA, % kcal5.7 ± 1.76.0 ± 1.7
 Trans fat, % kcal1.6 ± 0.81.4 ± 0.7
 Omega-3 fatty acids, mg/day257.8 ± 235.5253.2 ± 217.8
1 Values presented as mean and standard deviation or proportion and frequency. Abbreviations: AHEI, Alternative Healthy Eating Index; BMI: body mass index; DASH, Dietary Approaches to Stop Hypertension; MDS, Mediterranean Diet-style Score; MUFA, Monounsaturated fatty acid; PUFA, polyunsaturated fatty acids; SFA, saturated fatty acids.
Table 2. Top significant associations of dietary patterns with plasma protein concentrations 1.
NameType/ClassDiet 2AHEIDASHMDS
Β 3SEβSEβSE
Carbonic anhydrase 6EnzymeDASH0.0950.0230.108 *0.0230.0850.025
Carnosine dipeptidase 1 (CNDP1)PeptidaseAHEI, DASH0.135 *0.0240.105 *0.0250.0850.026
Contactin 4EnzymeDASH0.0510.0240.112 *0.0240.0750.025
Epidermal growth factor receptor (ERBB1)KinaseAHEI, MDS, DASH0.133 *0.0220.127 *0.0230.111 *0.024
Fibroblast growth factor receptor 1 (bFGF-R)KinaseAHEI,DASH0.092 *0.0230.107 *0.0230.0760.024
Galectin 3OtherAHEI0.101 *0.0230.0730.0240.0760.025
Glypican 3OtherDASH0.0570.0240.109 *0.0240.0700.025
Hemojuvelin BMP co-receptor (RGM-C)OtherDASH0.0900.0240.105 *0.0250.0880.026
Heterogeneous nuclear ribonucleoprotein A/B (hnRNP A/B)EnzymeDASH−0.0540.023−0.099 *0.024−0.0420.025
Kynureninase (KYNU)EnzymeAHEI, MDS, DASH−0.127 *0.024−0.153 *0.024−0.112 *0.026
Leucine rich repeats and immunoglobulin like domains 3 (LRIG3)OtherAHEI0.114 *0.0240.0870.0250.0690.026
Macrophage migration inhibitory factor (MIF) MDS, DASH−0.0980.024−0.119 *0.024−0.106 *0.026
Matrix metallopeptidase 2 (MMP-2)PeptidaseDASH0.0760.0240.117 *0.0240.0740.025
MET proto-oncogene, receptor tyrosine kinase (MET)KinaseAHEI0.102 *0.0230.0960.0240.0500.025
Notch 1Transcription regulator AHEI, DASH0.098 *0.0230.113 *0.0230.0690.024
Peroxiredoxin 1EnzymeDASH−0.0680.024−0.113 *0.025−0.0770.026
Plasminogen activator, tissue type (tPA)PeptidaseDASH−0.0480.022−0.101 *0.022−0.0680.023
Serpin family C member 1 (Antithrombin III)EnzymeAHEI0.093 *0.0210.0630.0220.0530.023
Stanniocalcin 1KinaseAHEI, MDS, DASH−0.108 *0.024−0.103 *0.024−0.111 *0.025
Thrombospondin 2 (TSP2)OtherAHEI−0.112 *0.024−0.0870.025−0.0770.026
TransferrinTransporterAHEI0.127 *0.0220.0830.0230.0680.024
WAP, follistatin/kazal, immunoglobulin, kunitz and netrin domain containing 2 (WFKN2)OtherAHEI, DASH0.095 *0.0230.097 *0.0230.0990.024
Prostatic binding protein DASH−0.0460.024−0.101 *0.024−0.0420.026
1 Multivariable regression models with proteins as the dependent variable and dietary pattern scores as the independent variable (separate model for each dietary pattern and protein). Models are adjusted for age, sex, total caloric intake, current smoking, physical activity index, lipid lowering medication, anti-hypertensive medication, and body mass index. * Statistically significant following Bonferroni adjustment (0.05/1373 proteins). 2 Diets with a statistically significant association. 3 β estimates represent the change in protein concentration per standardized unit increase in the respective dietary pattern indices. Abbreviations: AHEI, Alternative Healthy Eating Index; DASH, Dietary Approaches to Stop Hypertension; MDS, Mediterranean Diet-style Score.
Table 3. Top significant associations of dietary patterns with plasma metabolite concentrations 1.
NameType\ClassDiet 2AHEI DASH MDS
Β 3SEβSEβSE
AconitateAliphatic acyclic compoundAHEI, DASH−0.025 *0.006−0.025 *0.006−0.0190.007
Cholesterol ester (C22:6)LipidAHEI, MDS0.059 *0.0150.0480.0160.080 *0.017
Cis/trans-hydroxyprolineL-alpha-amino acidMDS, DASH−0.0330.012−0.070 *0.012−0.054 *0.013
Cotinine MDS, DASH−2.0940.723−3.075 *0.734−3.097 *0.772
HippurateAromatic homomonocyclic compoundsAHEI, MDS, DASH 0.364 *0.0790.430 *0.0800.354 *0.085
IsocitrateAliphatic acyclic compoundsAHEI, MDS, DASH−0.041 *0.008−0.049 *0.008−0.041 *0.008
Lysophosphatidylcholine (C20:5)LipidAHEI, DASH0.079 *0.0160.069 *0.0170.0620.018
Lysophosphatidylcholine (C22:6)LipidAHEI, MDS, DASH0.073 *0.0100.052 *0.0110.077 *0.011
Lysophosphatidylethanolamine (C20:4)LipidMDS−0.0220.009−0.0280.009−0.045 *0.010
OrnithineL-alpha-amino acidDASH−0.0280.011−0.057 *0.011−0.0390.012
OxalateAliphatic acyclic compoundsMDS, DASH0.0640.0180.107 *0.0180.086 *0.019
PantothenateWater-soluble vitaminsDASH0.0490.0220.126 *0.0220.0830.023
Phosphatidylcholine (C38:6)LipidAHEI, MDS, DASH0.039 *0.0050.035 *0.0050.046 *0.005
Phosphatidylcholine (40:6)LipidAHEI, MDS, DASH0.041 *0.0060.038 *0.0060.054 *0.006
SerineAmino acidDASH−0.0060.007−0.030 *0.007−0.0180.008
Sphingomyelin (C14:0)LipidMDS−0.0120.006−0.0010.007−0.043 *0.007
Sphingomyelin (C18:0)LipidAHEI, MDS, DASH−0.026 *0.006−0.028 *0.006−0.032 *0.006
Sphingomyelin (C18:1)LipidAHEI, MDS, DASH−0.044 *0.007−0.044 *0.007−0.036 *0.007
ThiamineWater-soluble vitaminsDASH0.0670.0370.150 *0.0370.1010.039
Triacylglycerol (C54:7)LipidMDS0.0360.0120.0370.0120.050 *0.013
Triacylglycerol (C56:7)LipidAHEI, MDS, DASH0.037 *0.0070.031 *0.0070.041 *0.008
Triacylglycerol (C56:8)LipidAHEI, MDS, DASH0.043 *0.0090.040 *0.0090.054 *0.009
Triacylglycerol (C58:10)LipidAHEI, MDS, DASH0.045 *0.0100.038 *0.0100.048 *0.011
Triacylglycerol (C58:8)LipidAHEI, MDS, DASH0.042 *0.0080.037 *0.0080.047 *0.008
Triacylglycerol (C58:9)LipidAHEI, MDS, DASH0.050 *0.0090.045 *0.0090.057 *0.009
UridineRibonucleosidesAHEI, DASH0.028 *0.0050.034 *0.0050.0190.005
1 Multivariable regression models with each metabolite as the dependent variable and dietary pattern scores as the independent variable (separate model for each dietary pattern and protein). Models are adjusted for age, sex, total caloric intake, current smoking, physical activity index, lipid lowering medication, anti-hypertensive medication, and body mass index. * Statistically significant following Bonferroni adjustment (0.05/216 metabolites). 2 Diets with a statistically significant association. 3 β estimates represent the change in metabolite concentration per standardized unit increase in the respective dietary pattern indices Abbreviations: AHEI, Alternative Healthy Eating Index; DASH, Dietary Approaches to Stop Hypertension; MDS, Mediterranean Diet-style Score.
Table 4. Pathway over representation analysis of protein markers associated with dietary pattern 1.
PathwayEnrichment RatioP-Value 2FDR Q-Value 3Matched Molecules
hsa04610Complement and coagulation cascades12.513.1 × 1081.0 × 105PLAT, SERPINC1, C3, SERPINE1, SERPINA5, CFH, C1S, C3AR1, CPB2
hsa05150Staphylococcus aureus infection9.811.4 × 1041.7 × 102C3, CFH, C1S, SELP
hsa01522Endocrine resistance6.722.5 × 1041.7 × 102EGFR, MMP2, BCL2, NOTCH1, MED1, JAG1
hsa04066HIF-1 signaling pathway6.592.8 × 1041.7 × 102EGFR, GAPDH, SERPINE1, TEK, TF, BCL2
hsa05230Central carbon metabolism in cancer8.452.9 × 1041.7 × 102EGFR, FGFR1, KIT, MET, NTRK3
hsa04151PI3K-Akt signaling pathway3.413.1 × 1041.7 × 102CDC37, EGFR, FGFR1, HSP90AB1, MET, TEK, THBS2, BCL2, KIT, YWHAB
hsa05144Malaria8.979.8 × 1044.6 × 102MET, SELE, SELP, THBS2
hsa05418Fluid shear stress and atherosclerosis4.741.6 × 1036.2 × 102HSP90AB1, MMP2, PLAT, BCL2, SELE, BMPR1A
hsa05215Prostate cancer5.661.8 × 1036.2 × 102EGFR, PLAT, HSP90AB1, FGFR1, BCL2
hsa04514Cell adhesion molecules (CAMs)4.581.9 × 1036.2 × 102SELP, SELE, CNTN1, NEGR1, PDCD1LG2, NRXN3
1 All proteins analyzed were significantly (FDR q ≤ 0.05) related to the respective dietary pattern scores in multivariable models adjusting for age, sex, total caloric intake, current smoking, physical activity index, lipid lowering medication, anti-hypertensive medication, and body mass index. Analyzed proteins were annotated to KEGG pathways with >5 and <2000 proteins. 2 Unadjusted p value. 3 False discovery rate p value. Abbreviations: AHEI, Alternative Healthy Eating Index; DASH, Dietary Approaches to Stop Hypertension; KEGG, Kyoto Encyclopedia of Genes and Genomes; MDS, Mediterranean-style Diet Score.
Table 5. Overlap among dietary protein quantitative trait loci and prior genome-wide association study risk loci.1.
Protein 1Variant 2Nearest Gene GWAS Associated Traits 3GWAS Study Accession 4
AK1A1rs72688441NASPBlood protein concentrations GCST006585, GCST005806
AK1A11:46767127:TCTC_LRRC41
AK1A1rs72684498ZSWIM5
AK1A1rs72676591EIF2B3
Antithrombin IIIrs334516TNS3
bFGF-R8:38324424:ACC_AFGFR1
C1srs6695321CFHBlood protein concentrationsGCST004365, GCST005806
C1srs150845796CFHR2
C3ars11583804ACTRT2
Cadherin-5rs8176672ABOBlood protein concentrations, optic cup areaGCST005806, GCST004137
Cadherin-5rs11534419TMEM8C
Carbonic anhydrase 6rs11576766CA6
Cathepsin Drs1558500
Cathepsin Srs72702561HORMAD1Blood protein concentrationsGCST006585
Cathepsin Srs9661107PRUNE1
Cathepsin Srs141935877TARS2
Contactin-1rs11640313MRPL28
ERBB1rs12112554
Factor Hrs10737680CFHMacular degeneration, lung function, blood protein concentrationsGCST004737, GCST003265, GCST004365
Factor Hrs12134610KCNT2
Factor Hrs150845796CFHR2
Factor Hrs1329428 Macular degeneration, central serous retinopathy, lung function GCST000806, GCST006416, GCST003265
Gal 3rs11733361SLC25A31
iC3brs11583804ACTRT2
IGFBP-1rs139504202
KYNUrs35647509KYNU
KYNUrs4733300NRG1
LSAMPrs117955663OR56B2P
METrs635634ABOBlood protein concentrations, LDL-C concentrations, TC concentrations, ischemic stroke, immune cell count, T2DGCST000759, GCST000760, GCST006910, GCST004613, GCST004773, GCST005806
Notch 1rs138015312UGT2B15
PARCrs1102934CCL18Blood protein concentrationsGCST006585
RGM-Crs2381409FAM221B
RGM-C7:57407593:TTCC_
sE-Selectinrs2519093ABOBlood protein concentrations, LDL-C concentrations, venous thromboembolism, TC concentrations, hematocrit, hemoglobin, immune cell count, CADGCST005806, GCST006612, GCST004256, GCST007143, GCST005994, GCST005995, GCST007070, GCST005195
sE-Selectinrs9722289TMEM8C
TIG2rs10282458LOC107986858
Transferrinrs71544591PTPRN2
TSP2rs73043837THBS2
WFKN2rs7207028WFIKKN2
1 Proteins whose concentrations were significantly associated (FDR q ≤ 0.05) with at least one dietary pattern index and had a pQTL previously identified in the Framingham Offspring Study [26]. 2 Previously identified pQTL. 3 Top traits associated with corresponding GWAS risk loci. A complete list of traits can be found in the NHGRI-EBI Catalogue of Published GWAS. 4 GWAS Study accession number of studies linking GWAS risk loci and traits. A complete list of GWAS Study accession number can be found in the NHGRI-EBI Catalogue of Published GWAS. CAD, coronary artery disease; GWAS, genome-wide association study; LDL-C, low-density lipoprotein cholesterol; TC, total cholesterol; T2D; diabetes mellitus; QTL, quantitative trait loci.
Table 6. Overlap among dietary metabolite quantitative trait loci and prior genome-wide association study risk loci.1
Metabolite 1Variant 2Nearest GeneGWAS Associated Traits 3GWAS Study Accession4
Cholesterol ester (C20:5)rs174548FADS1-2Blood metabolite concentrations, metabolite ratios in CKD, TG concentrations, HDL-C concentrations, plasma N6 concentrations, metabolite ratiosGCST000274, GCST005650, GCST000809, GCST000805, GCST003237, GCST002442
Indoxylsulfaters875480CSNK1G3
Lysophosphatidylcholine (C20:5)rs174548FADS1-2Blood metabolite concentrations, metabolite ratios in CKD, TG concentrations, HDL-C concentrations, plasma N6 concentrations, metabolite ratiosGCST000274, GCST005650, GCST000809, GCST000805, GCST003237, GCST002442
Lysophosphatidylcholine (C22:6)rs174550FADS1-2Blood metabolite concentrations, TG concentrations, FBG, HDL-C concentrations, LDL-C concentrations, plasma N6 concentrations, plasma N3 concentrations, HOMA-BGCST002443, GCST004237. GCST005186, GCST004232, GCST007141, GCST002446, GCST001178, GCST005180,
Lysophosphatidylethanolamine (C18:2)rs4246215FADS2Plasma N3 concentrations, platelet count, IBD, RBC fatty acid concentrations, Crohn’s disease, CRCGCST001180, GCST001337, GCST001725, GCST002712, GCST004132, GCST007992
Lysophosphatidylethanolamine (C20:4)rs174548FADS1-2Blood metabolite concentrations, metabolite ratios in CKD, TG concentrations, HDL-C concentrations, plasma N6 concentrations, metabolite ratiosGCST000274, GCST005650, GCST000809, GCST000805, GCST003237, GCST002442
Lysophosphatidylethanolamine (C20:4)rs4149056SLCO1B1Blood metabolite concentrations, TG concentrations, bilirubin, response to statin, ER+ breast cancer, thyroxine concentrations, hemoglobin, metabolite ratiosGCST002442, GCST007133, GCST000386, GCST000213, GCST004359, GCST006896, GCST007068, GCST002442
Phosphatidylcholine (C36:2)rs174541FADS2Blood metabolite concentrations, metabolite ratios in CKD, trans fatty acid concentrations, RBC fatty acids, GCST001852, GCST005650, GCST002721, GCST002712
Phosphatidylcholine (C40:6)rs174535FADS1-2Blood metabolite concentrations, plasma N3 concentrations, RBC fatty acids, trans fatty acid concentrations, inflammatory disease, asthma, glycemic traits, respiratory disease GCST002443, GCST001178, GCST002712, GCST002721, GCST005537, GCST007799, GCST008674, GCST007076
Proliners2078743PRODH
Seriners477992PHGDHBlood metabolite/amino acid concentrations, TC concentrations GCST002966, GCST006614
Sphingomyelin (C14:0)rs11158519SYNE2Sphingomyelin concentrations GCST008933
Triacylglycerol (C54:2)rs964184APOA1/C3/A4/A5Blood metabolite concentrations, TG concentrations, lipoprotein concentrations, CHD, stroke, MetS, phospholipid fatty acids, fat soluble vitamin concentrations, CAD, age related CVDs GCST001639, GCST004550, GCST004759, GCST000998, GCST002290, GCST001436, GCST001414, GCST001142, GCST004787, GCST004045,
Triacylglycerol (C54:4)rs174550FADS1-2TG concentrations, FBG, HDL-C concentrations, LDL-C concentrations, plasma N6 concentrations, HOMA-B, plasma N3 concentrations, RBC fatty acids, trans fatty acid concentrationsGCST004237, GCST008032, GCST004232, GCST007141, GCST002448, GCST005180, GCST001178, GCST002712, GCST002721
Triacylglycerol (C54:5)rs964184APOA1/C3/A4/A5Blood metabolite concentrations, TG concentrations, lipoprotein concentrations, CHD, stroke,, MetS, phospholipid fatty acids, fat soluble vitamin concentrations, CAD, age related CVDs GCST001639, GCST004550, GCST004759, GCST000998, GCST002290, GCST001436, GCST001414, GCST001142, GCST004787, GCST004045,
Triacylglycerol (C56:7)rs6593086
Triacylglycerol (C58:10)rs174548FADS1-2Blood metabolite concentrations, metabolite ratios in CKD, TG concentrations, HDL-C concentrations, plasma N6 concentrations, metabolite ratiosGCST000274, GCST005650, GCST000809, GCST000805, GCST003237, GCST002442
Triacylglycerol (C58:8)rs6593086
Triacylglycerol (C58:9)rs6593086
1 Metabolites whose concentrations were significantly associated (FDR q ≤ 0.05) with at least one dietary pattern index and had a mQTL previously identified in the Framingham Offspring Study (26). 2 Previously identified mQTL. 3 Top traits associated with corresponding GWAS risk loci. A complete list of traits can be found in the NHGRI-EBI Catalogue of Published GWAS. 4 GWAS Study accession number of studies linking GWAS risk loci and traits. A complete list of GWAS Study accession number can be found in the NHGRI-EBI Catalogue of Published GWAS.

