Effects of Labelling and Increasing the Proportion of Lower-Energy Density Products on Online Food Shopping: A Randomised Control Trial in High- and Low-Socioeconomic Position Participants


Abstract
:1. Introduction
2. Materials and Methods
2.1. Settings
2.2. Participants
2.3. Design
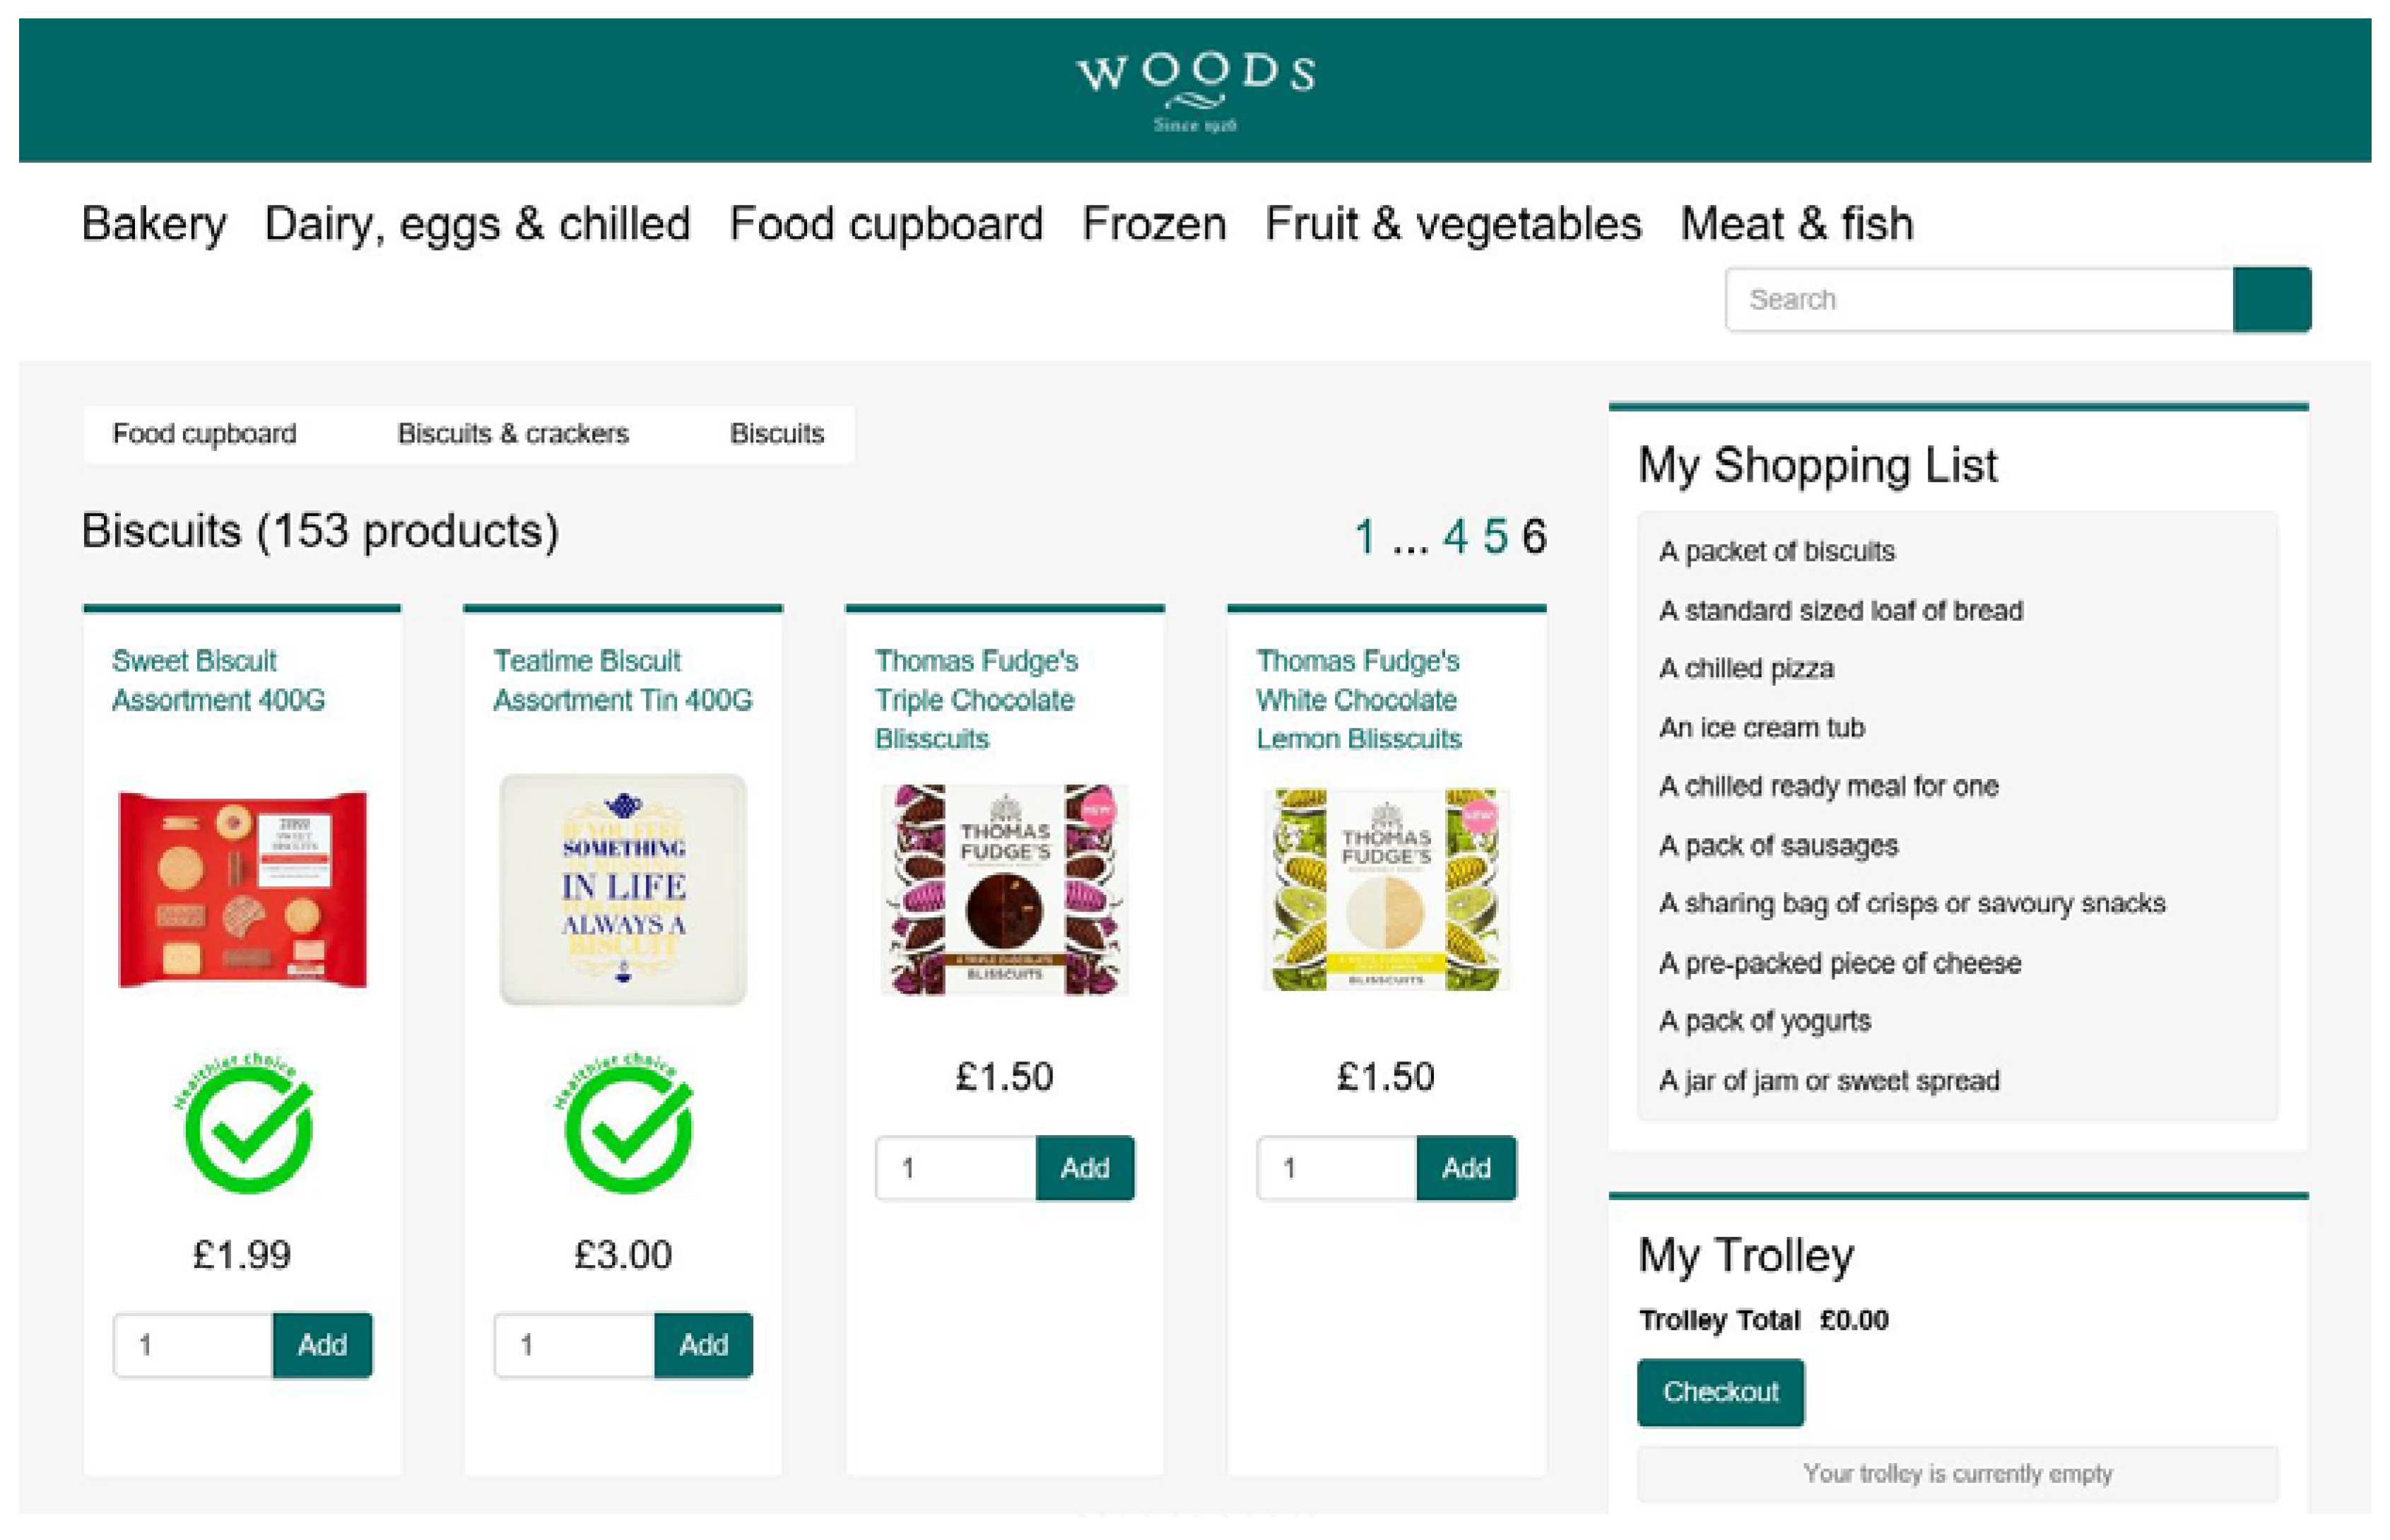
2.4. Online Shopping Task
- A packet of biscuits;
- A standard-sized loaf of bread;
- A chilled pizza;
- An ice cream tub;
- A chilled ready meal for one;
- A pack of sausages;
- A sharing bag of crisps or savoury snacks;
- A pre-packed piece of cheese;
- A pack of yogurts;
- A jar of jam or sweet spread.
2.5. Interventions
2.6. Outcomes
2.7. Measures of SEP
2.8. Health and Weight Control Motives
2.9. Additional Measures
2.10. Procedure
2.11. Statistical Analyses
2.12. Sample Size
3. Results
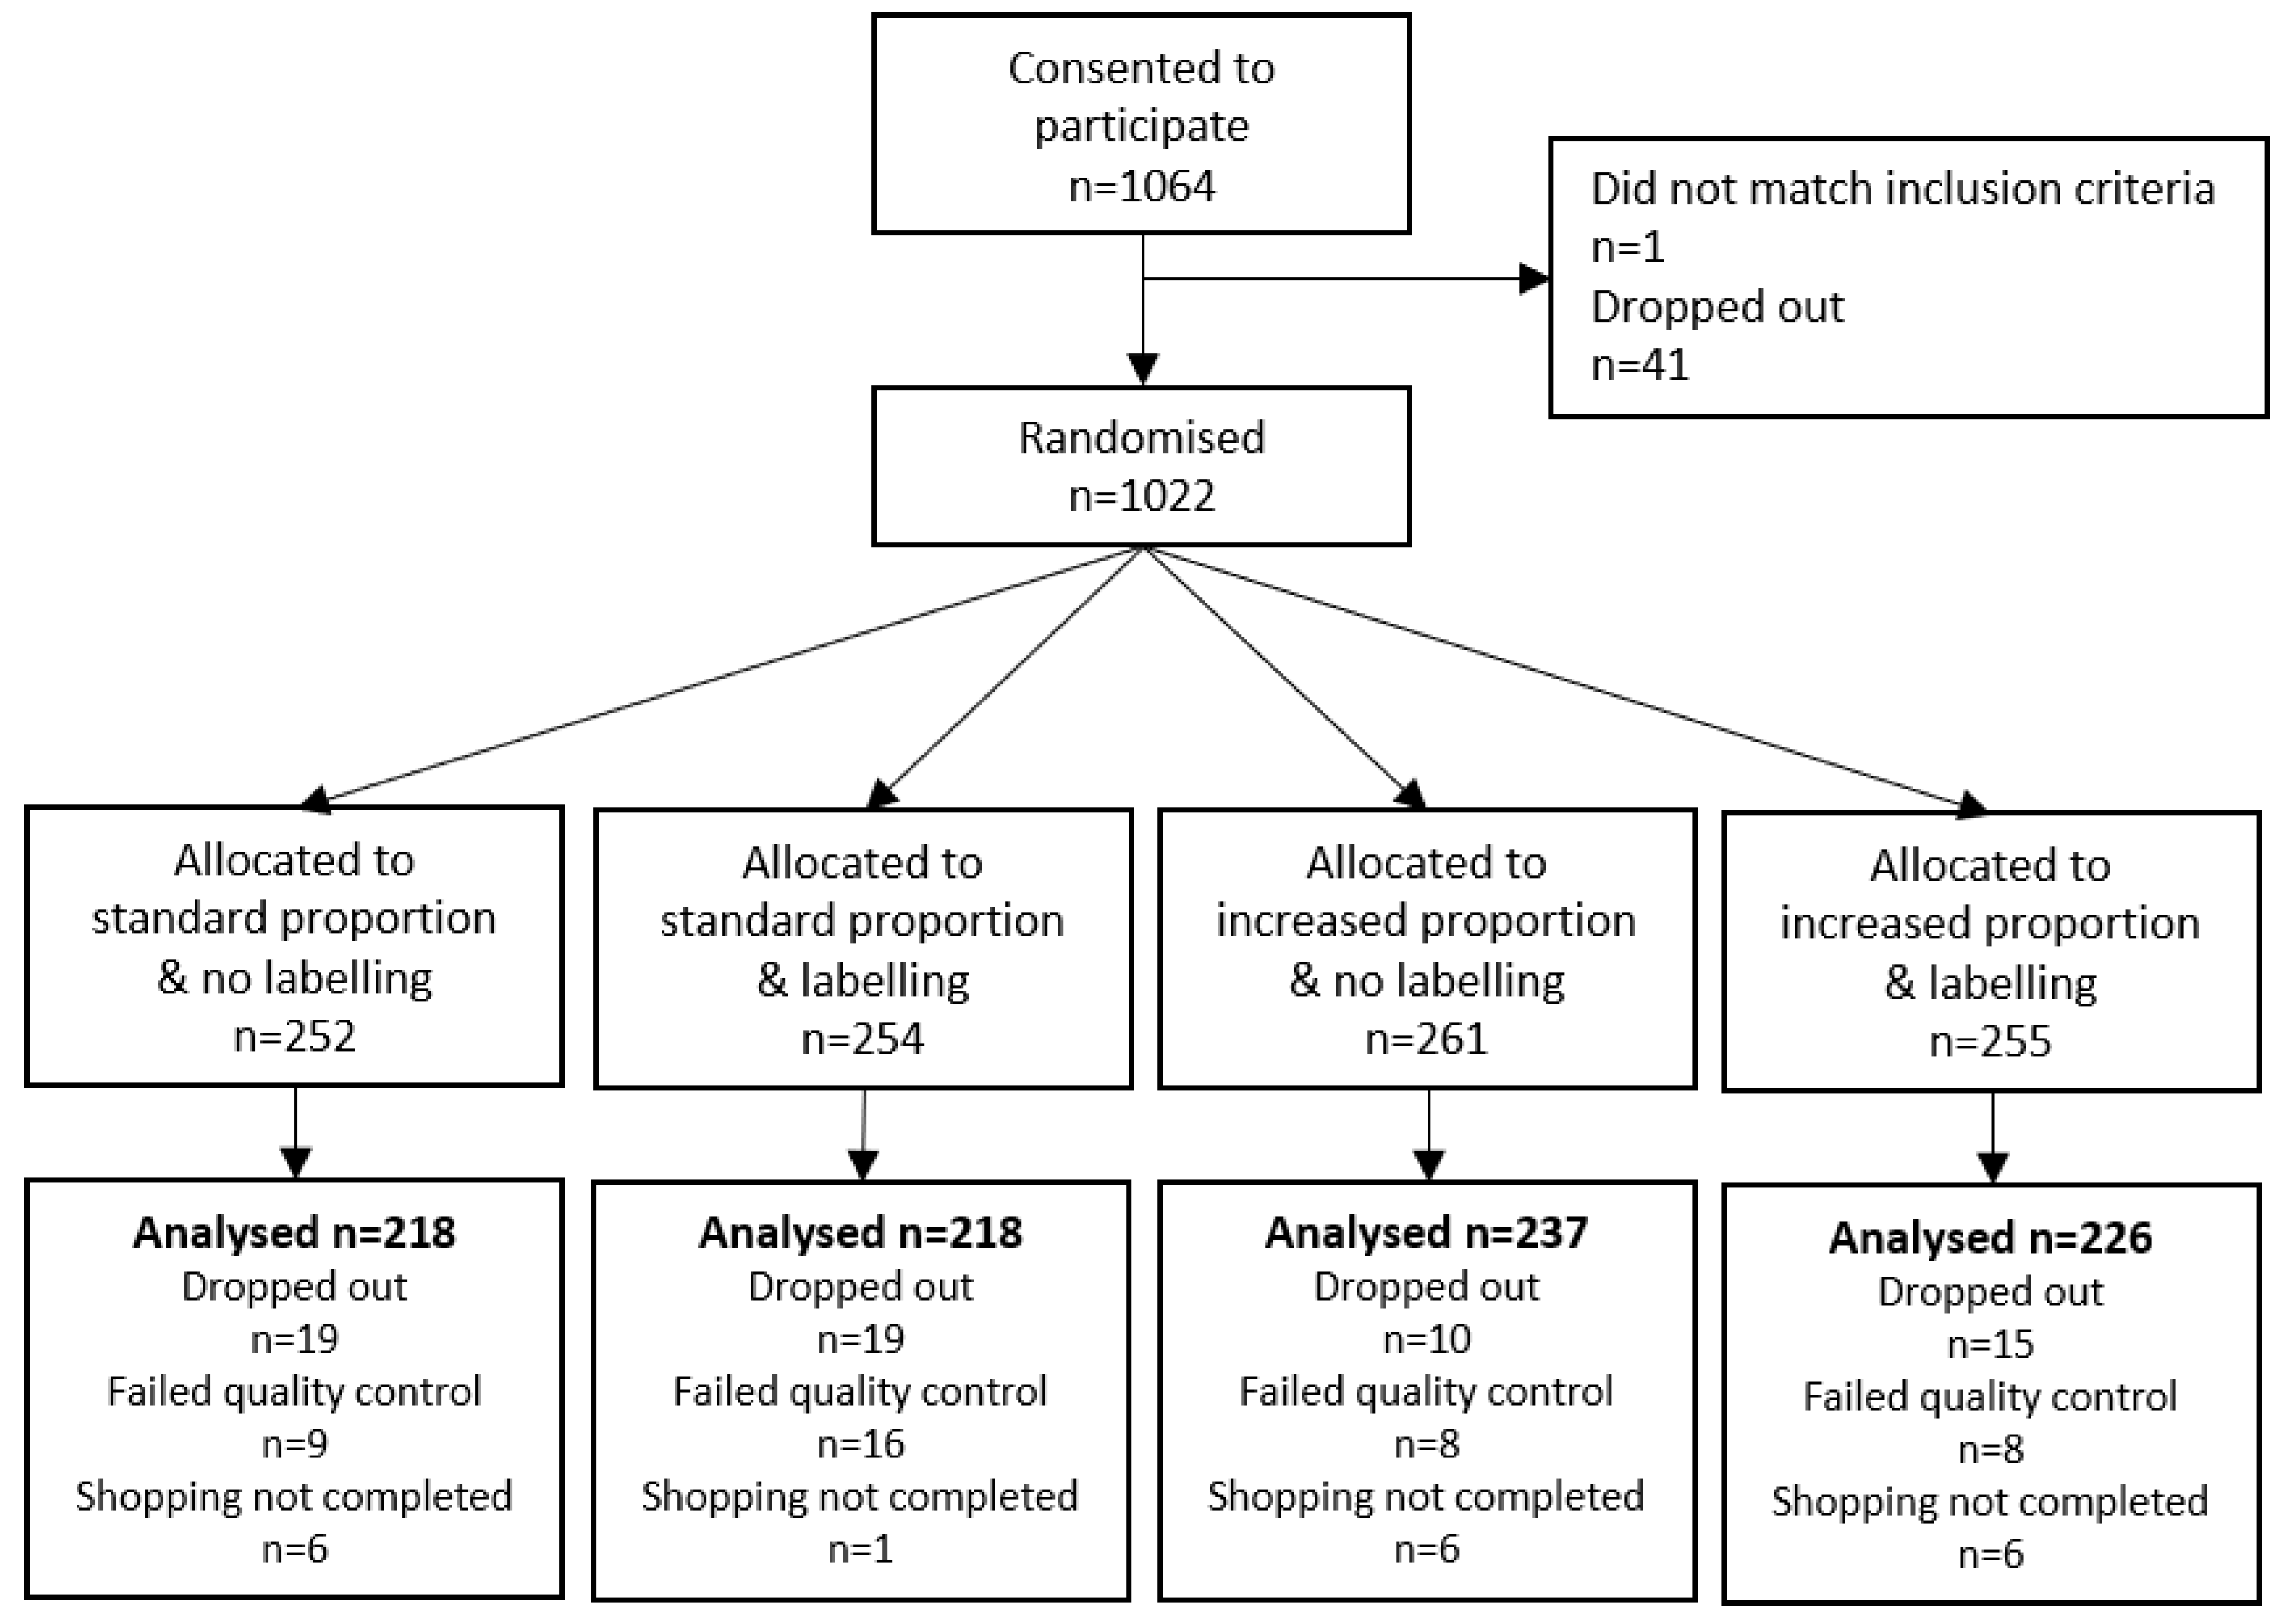
3.1. Participants
3.2. Effect of the Interventions and SEP on Online Grocery Shopping
3.3. Effect of the Interventions and Health Motives on Online Grocery Shopping
3.4. Online Shopping Task Questionnaire
4. Discussion
5. Conclusions
Supplementary Materials
Author Contributions
Funding
Conflicts of Interest
References
- Rouhani, M.H.; Haghighatdoost, F.; Surkan, P.J.; Azadbakht, L. Associations between dietary energy density and obesity: A systematic review and meta-analysis of observational studies. Nutrition 2016, 32, 1037–1047. [Google Scholar] [CrossRef]
- Pérez-Escamilla, R.; Obbagy, J.E.; Altman, J.M.; Essery, E.V.; McGrane, M.M.; Wong, Y.P.; Spahn, J.M.; Williams, C.L. Dietary Energy Density and Body Weight in Adults and Children: A Systematic Review. J. Acad. Nutr. Diet. 2012, 112, 671–684. [Google Scholar] [CrossRef]
- Stelmach-Mardas, M.; Rodacki, T.; Dobrowolska-Iwanek, J.; Brzozowska, A.; Walkowiak, J.; Wojtanowska-Krosniak, A.; Zagrodzki, P.; Bechthold, A.; Mardas, M.; Boeing, H. Link between food energy density and body weight changes in obese adults. Nutrients 2016, 8, 229. [Google Scholar] [CrossRef]
- Rolls, B.J.; Roe, L.S.; Meengs, J.S. Reductions in portion size and energy density of foods are additive and lead to sustained decreases in energy intake. Am. J. Clin. Nutr. 2006, 83, 11–17. [Google Scholar] [CrossRef] [PubMed]
- Rolls, B.J. Dietary Energy Density: Applying Behavioural Science to Weight Management. Nutr. Bull. 2017, 42, 246–253. [Google Scholar] [CrossRef] [PubMed]
- Mintel Brits Spent £12.3 Billion on Online Groceries in 2018. Available online: https://www.mintel.com/press-centre/retail-press-centre/brits-spent-12-3-billion-on-online-groceries-in-2018 (accessed on 15 July 2020).
- Redman, R. Online Grocery Sales to Grow 40% in 2020. Available online: https://www.supermarketnews.com/online-retail/online-grocery-sales-grow-40-2020 (accessed on 31 August 2020).
- Koutoukidis, D.A.; Jebb, S.A.; Ordóñez-mena, J.M.; Noreik, M.; Tsiountsioura, M.; Kennedy, S.; Payne-riches, S.; Aveyard, P.; Ordonez-mena, J.; Noreik, M.; et al. Effectiveness of interventions to reduce the saturated fat content of food purchases: A factorial randomised controlled trial in an experimental online supermarket. Int. J. Behav. Nutr. Phys. Act. 2019, 16, 50. [Google Scholar] [CrossRef] [PubMed] [Green Version]
- Forwood, S.E.; Ahern, A.L.; Marteau, T.M.; Jebb, S.A. Offering within-category food swaps to reduce energy density of food purchases: A study using an experimental online supermarket. Int. J. Behav. Nutr. Phys. Act. 2015, 12, 85. [Google Scholar] [CrossRef] [Green Version]
- Payne Riches, S.; Aveyard, P.; Piernas, C.; Rayner, M.; Jebb, S.A. Optimising swaps to reduce the salt content of food purchases in a virtual online supermarket: A randomised controlled trial. Appetite 2019, 133, 378–386. [Google Scholar] [CrossRef] [PubMed]
- Crockett, R.A.; King, S.E.; Marteau, T.M.; Prevost, A.T.; Bignardi, G.; Roberts, N.W.; Stubbs, B.; Hollands, G.J.; Jebb, S.A. Nutritional labelling for healthier food or non-alcoholic drink purchasing and consumption. Cochrane Database Syst. Rev. 2018, 2, CD009315. [Google Scholar] [CrossRef] [PubMed] [Green Version]
- Hollands, G.J.; Carter, P.; Anwer, S.; King, S.E.; Jebb, S.A.; Ogilvie, D.; Shemilt, I.; Higgins, J.P.T.; Marteau, T.M. Altering the availability or proximity of food, alcohol, and tobacco products to change their selection and consumption. Cochrane Database Syst. Rev. 2019, 9, CD012573. [Google Scholar] [CrossRef] [PubMed]
- Adams, J.; Mytton, O.; White, M.; Monsivais, P. Why Are Some Population Interventions for Diet and Obesity More Equitable and Effective Than Others? The Role of Individual Agency. PLoS Med. 2016, 13, 1–7. [Google Scholar] [CrossRef] [Green Version]
- McGill, R.; Anwar, E.; Orton, L.; Bromley, H.; Lloyd-Williams, F.; O’Flaherty, M.; Taylor-Robinson, D.; Guzman-Castillo, M.; Gillespie, D.; Moreira, P.; et al. Are interventions to promote healthy eating equally effective for all? Systematic review of socioeconomic inequalities in impact Health behavior, health promotion and society. BMC Public Health 2015, 15, 1–15. [Google Scholar] [CrossRef] [Green Version]
- Capewell, S.; Capewell, A. An effectiveness hierarchy of preventive interventions: Neglected paradigm or self-evident truth? J. Public Health (Bangkok) 2017, 40, 350–358. [Google Scholar] [CrossRef] [PubMed]
- Pechey, R.; Monsivais, P.; Ng, Y.-L.; Marteau, T.M. Why don’t poor men eat fruit? Socioeconomic differences in motivations for fruit consumption. Appetite 2014, 84, 271–279. [Google Scholar] [CrossRef] [Green Version]
- Marty, L.; Jones, A.; Robinson, E. Socioeconomic position and the impact of increasing availability of lower energy meals vs. menu energy labelling on food choice: Two randomized controlled trials in a virtual fast-food restaurant. Int. J. Behav. Nutr. Phys. Act. 2020, 17, 10. [Google Scholar] [CrossRef]
- Marty, L.; Reed, S.; Jones, A.; Robinson, E. Socioeconomic position and the impact of increasing availability of lower energy meals vs. menu energy labelling on food choice in virtual full-service restaurants: Two online studies. BMC Public Health Rev. 2020, 17, 10. [Google Scholar]
- Harrington, R.A.; Adhikari, V.; Rayner, M.; Scarborough, P. Nutrient composition databases in the age of big data: FoodDB, a comprehensive, real-time database infrastructure. BMJ Open 2019, 9, 1–10. [Google Scholar] [CrossRef]
- Johnson, L.; Wilks, D.C.; Lindroos, A.K.; Jebb, S.A. Reflections from a systematic review of dietary energy density and weight gain: Is the inclusion of drinks valid? Obes. Rev. 2009, 10, 681–692. [Google Scholar] [CrossRef]
- Peer, E.; Brandimarte, L.; Samat, S.; Acquisti, A. Beyond the Turk: Alternative platforms for crowdsourcing behavioral research. J. Exp. Soc. Psychol. 2017, 70, 153–163. [Google Scholar] [CrossRef] [Green Version]
- Level of Highest Qualification Held by People Aged 19-59/64 in England, Labour Force Survey. Available online: https://assets.publishing.service.gov.uk/government/uploads/system/uploads/attachment_data/file/416566/LFS_supplementary_New_Qualification_Levels-19-5964_March_2015.xls (accessed on 15 July 2020).
- NDNS: Results from Years 7 and 8 (Combined). Available online: https://www.gov.uk/government/statistics/ndns-results-from-years-7-and-8-combined (accessed on 15 July 2020).
- Ikonen, I.; Sotgiu, F.; Aydinli, A.; Verlegh, P.W.J. Consumer effects of front-of-package nutrition labeling: An interdisciplinary meta-analysis. J. Acad. Mark. Sci. 2019, 48, 360–383. [Google Scholar] [CrossRef] [Green Version]
- Cowburn, G.; Stockley, L. Consumer understanding and use of nutrition labelling: A systematic review. Public Health Nutr. 2008, 8, 21–28. [Google Scholar] [CrossRef] [Green Version]
- Breck, A.; Cantor, J.; Martinez, O.; Elbel, B. Who reports noticing and using calorie information posted on fast food restaurant menus? Appetite 2014, 81, 30–36. [Google Scholar] [CrossRef] [Green Version]
- Office for National Statistics Family Spending in the UK. Chapter 3: Equivalised Income. Available online: https://www.ons.gov.uk/peoplepopulationandcommunity/personalandhouseholdfinances/incomeandwealth/compendium/familyspending/2015/chapter3equivalisedincome (accessed on 15 July 2020).
- Adler, N.E.; Epel, E.; Casterllazzo, G.; Ickovics, J. Relationship of subjective and objective social status with psychological and physical health in healthy white women. Health Psychol. 2000, 19, 586–592. [Google Scholar] [CrossRef] [PubMed]
- Steptoe, A.; Pollard, T.M.; Wardle, J. Development of a Measure of the Motives Underlying the Selection of Food: The “Food Choice Questionnaire”. Appetite 1995, 25, 267–284. [Google Scholar] [CrossRef] [PubMed] [Green Version]
- Johnson, P.O.; Neyman, J. Tests of Certain Linear Hypotheses and Their Application to Some Educational Problems. Stat. Res. Mem. 1936, 1, 57–93. [Google Scholar]
- Hayes, A.F. PROCESS: A Versatile Computational Tool for Observed Variable Mediation, Moderation, and Conditional Process Modeling [White Paper]. Available online: http://www.afhayes.com/index.html (accessed on 15 July 2020).
- Miller, Y. Recommendations for the Truncation of Body Mass Index in Population Data. NSW Centre Phys. Act. Health 2003, CPAH 03-0005. Available online: https://www.health.nsw.gov.au/surveys/other/Documents/cpah-recommendations.pdf (accessed on 15 July 2020).
- Hardy, R.; Johnson, J.; Park, A. Harmonised Height, Weight and BMI User Guide; 2016, Creative Commons Attribution-NonCommercial 4.0 International. Available online: http://doc.ukdataservice.ac.uk/doc/8207/mrdoc/pdf/closer_wp1_user_guide_v3_new_edition.pdf (accessed on 15 July 2020).
- Waterlander, W.E.; Jiang, Y.; Steenhuis, I.H.M.; Ni Mhurchu, C. Using a 3D virtual supermarket to measure food purchase behavior: A validation study. J. Med. Internet Res. 2015, 17, e107. [Google Scholar] [CrossRef] [Green Version]
- Siegrist, M.; Ung, C.Y.; Zank, M.; Marinello, M.; Kunz, A.; Hartmann, C.; Menozzi, M. Consumers’ food selection behaviors in three-dimensional (3D) virtual reality. Food Res. Int. 2019, 117, 50–59. [Google Scholar] [CrossRef]


| Variables | All Participants (n = 899) |
|---|---|
| Age, Years, Mean (SD) | 39.5 (13.1) |
| Gender, female, n (%) | 460 (51.2) |
| Ethnicity, white, n (%) | 837 (93.1) |
| Employment status, n (%) | |
| Full or part-time | 669 (74.4) |
| Student | 15 (1.7) |
| Retired | 70 (7.8) |
| Other unemployed | 145 (16.1) |
| Highest educational qualification, n (%) | |
| No formal qualification | 23 (2.5) |
| 1–3 GCSEs | 77 (8.6) |
| 4+ GCSEs | 177 (19.7) |
| A level | 283 (31.5) |
| Certificate of higher education (CertHE) | 33 (3.7) |
| Diploma of higher education (DipHE) | 41 (4.5) |
| Bachelor’s degree | 183 (20.4) |
| Master’s degree | 65 (7.2) |
| Doctorate | 17 (1.9) |
| Years of higher education, mean (SD) | 2.8 (2.5) |
| Equivalised income, GBP, mean (SD) | 22,139 (18,549) |
| Subjective social status, mean (SD) | 5.2 (1.6) |
| BMI, kg/m2, mean (SD) | 27.0 (5.8) |
| Missing or implausible 1, n (%) | 9 (1) |
| Dieting status, yes, n (%) | 90 (10) |
| Supermarket shopping/week, GBP, mean (SD) | 78.9 (44.3) |
| Supermarket grocery shopping frequency, n (%) | |
| Less than once a month | 37 (4.1) |
| 1–3 times per month | 162 (18.0) |
| 1–2 times per week | 558 (62.1) |
| 3–4 times per week | 114 (12.7) |
| 5 times per week or more often | 28 (3.1) |
| Online grocery shopping frequency, n (%) | |
| Never or not in the last year | 240 (26.7) |
| 1–3 times in the last year | 246 (27.4) |
| 4–11 times in the last year | 227 (25.3) |
| 1–3 times per month | 118 (13.1) |
| Once per week or more often | 68 (7.6) |
| P−/L− (n = 218) | P−/L+ (n = 218) | P+/L− (n = 237) | P+/L+ (n = 226) | Labelling L+ vs. L− | Proportion P+ vs. P− | |
|---|---|---|---|---|---|---|
| ED (kcal/100 g) | 262 (29) | 257 (30) | 245 (27) | 241 (24) | −4.2 (−7.8 to −0.6) | −17 (−21 to −14) |
| Total energy (kcal) | 11295 (4274) | 10753 (3943) | 9980 (2005) | 10397 (4802) | −67 (−734 to 601) | −852 (−1519 to −184) |
| Energy from sugar (%) | 4.83 (1.21) | 5.02 (1.18) | 5.42 (1.26) | 5.57 (1.38) | 0.17 (−0.04 to 0.39) | 0.57 (0.36 to 0.79) |
| Energy from SFA (%) | 5.48 (1.07) | 5.44 (1.26) | 4.91 (1.06) | 4.80 (1.04) | −0.07 (−0.26 to 0.12) | −0.60 (−0.79 to −0.41) |
| Salt content (g/100 g) | 0.74 (0.11) | 0.74 (0.10) | 0.74 (0.09) | 0.76 (0.15) | 0.01 (−0.01 to 0.03) | 0.01 (−0.01 to 0.03) |
| Number of products | 11.4 (6.61) | 11.0 (4.94) | 10.3 (1.60) | 11.0 (4.89) | 0.21 (−0.62 to 1.04) | −0.58 (−1.41 to 0.26) |
| Lower-ED choices (%) | 35.7 (15.4) | 42.3 (18.5) | 60.1 (17.2) | 63.1 (17.3) | 4.77 (1.81 to 7.73) | 22.6 (19.7 to 25.6) |
| Cost (GBP) | ||||||
| Total | 20.7 (9.35) | 20.6 (7.69) | 18.6 (3.73) | 19.8 (6.23) | 0.59 (−0.62 to 1.80) | −1.42 (−2.63 to −0.21) |
| /100 g | 0.48 (0.11) | 0.50 (0.11) | 0.47 (0.10) | 0.48 (0.10) | 0.02 (−0.002 to 0.03) | −0.02 (−0.04 to −0.003) |
| /100 kcal | 0.19 (0.05) | 0.20 (0.04) | 0.19 (0.05) | 0.20 (0.05) | 0.01 (0.001 to 0.02) | 0.005 (−0.003 to 0.01) |
Publisher’s Note: MDPI stays neutral with regard to jurisdictional claims in published maps and institutional affiliations. |
© 2020 by the authors. Licensee MDPI, Basel, Switzerland. This article is an open access article distributed under the terms and conditions of the Creative Commons Attribution (CC BY) license (http://creativecommons.org/licenses/by/4.0/).
Share and Cite
Marty, L.; Cook, B.; Piernas, C.; Jebb, S.A.; Robinson, E. Effects of Labelling and Increasing the Proportion of Lower-Energy Density Products on Online Food Shopping: A Randomised Control Trial in High- and Low-Socioeconomic Position Participants. Nutrients 2020, 12, 3618. https://doi.org/10.3390/nu12123618
Marty L, Cook B, Piernas C, Jebb SA, Robinson E. Effects of Labelling and Increasing the Proportion of Lower-Energy Density Products on Online Food Shopping: A Randomised Control Trial in High- and Low-Socioeconomic Position Participants. Nutrients. 2020; 12(12):3618. https://doi.org/10.3390/nu12123618
Chicago/Turabian StyleMarty, Lucile, Brian Cook, Carmen Piernas, Susan A. Jebb, and Eric Robinson. 2020. "Effects of Labelling and Increasing the Proportion of Lower-Energy Density Products on Online Food Shopping: A Randomised Control Trial in High- and Low-Socioeconomic Position Participants" Nutrients 12, no. 12: 3618. https://doi.org/10.3390/nu12123618