Article

The Efficiency and Its Determinants for China’s Medical Care System: Some Policy Implications for Northeast Asia

1
Department of Insurance, Guangdong University of Finance, Guangzhou 510521, China
2
Department of Economics, Institute of Resource, Environment and Sustainable Development, School of Economics, Jinan University, Guangzhou 510632, China
*
Authors to whom correspondence should be addressed.
Sustainability 2015, 7(10), 14092-14111; https://doi.org/10.3390/su71014092
Submission received: 4 July 2015 / Revised: 11 October 2015 / Accepted: 14 October 2015 / Published: 20 October 2015

Abstract

:
The medical care system in China has experienced significant changes during three decades of reform, and thus result in a need to investigate the effects of medical reform. This paper investigates the technical efficiency of Chinese hospitals in 31 provinces during the period from 2002 to 2013 by proposing a new global generalized directional distance function (GGDDF) approach taking account of undesirable output, i.e., mortality. Results show that despite the technical efficiency had being improved with time trend, most Chinese provinces are not performing well on hospitals’ technical efficiency and leave a large potential to improve. Some provinces display better performance compared to other provinces of China. We further investigate the factors that affect the technical efficiency of Chinese hospitals with Tobit models. It concludes that the medical insurance reforms have improved the performance of Chinese hospitals, while public subsidies have decreased it. The provinces with higher GDP per capital and population density, the performance of their hospitals is better. The related policy implications for Northeast Asia are derived, including encouraging the development of private hospitals, enlarging the coverage of medical services, and pursuing different policies for the provinces with higher GDP per capital and population density.

1. Introduction

Since reform and opening up to the outside world in 1978, health status and outcome in China has been significantly improved. According to the World Development Indicators (WDI) published by the World Bank, life expectancy in China increased from 66.5 years in 1978 to 75.0 years in 2013, and the infant mortality rate decreased from 5.3% to 1.1% during the same period. However, the medical care sector in China has still been severely criticized for the high price and low quality of medical service since the market-orientated reform of 1985. It has even been judged as a failure by some researchers in China [1]. In addition, these challenges facing China’s medical system make the government authorities need to find new solutions and correct the distortions when pushing the reform forward. The government approved a new scheme for medical care reform in 2009 and significantly increased the fiscal budget in the medical care, so that to establish a universal coverage of medical care system that efficiently and conveniently provide the affordable and safe medical services in 2020. However, the ongoing reform still needs evaluation and correction. China is the most populated country in the world and has entered into the era of ageing society [2,3]. How to efficiently deliver enough medical service to people is a vitally important problem for the government authorities. Meanwhile, monitoring the efficiency performance of Chinese hospitals can provide useful information for assessing the effectiveness of health policies and measures, and also as a means to improve hospital efficiency and productivity in the most cost-effective way. As most of Chinese hospitals are public hospitals as non-profit enterprises and the price data is missing, we focus on the technical efficiency, which evaluates the ability of a DMU (Decision-making Unit) to produce the current outputs at the minimal amounts of inputs, rather than cost-effectiveness, which assesses the ability of a DMU to produce outputs at the minimum cost by simultaneously adjusting the output levels at the current revenue expressed in terms of the assessed DMU’s own prices and quantities [4,5].
Greater attention has been given to hospital’s technical efficiency and a growing number of studies in recent decades, so that to compare the relative performance given the need to ensure the best use of scarce resources [6], especially when facing the challenges in demands for high quality medical services over the long term in an ageing society [7,8]. The efficiency concept used is that of technical efficiency. A hospital is said to be technically efficient if an increase in an output requires a decrease in at least one other output, or an increase in at least one input. Alternatively, a reduction in any input must require an increase in at least one other input or a decrease in at least one output [9,10]. In the literature, there are two main approaches are employed to evaluate the technical efficiency of hospitals, including the DEA (Data Envelop Analysis) and SFA (Stochastic Frontier Analysis) [6,11,12,13,14,15,16,17]. As mentioned above and the contextual setting that will be introduced later, the medical sector of China is still in transition and facing great challenges. However, focus on the technical efficiency of Chinese hospitals has not been well discussed in the literature. This is the first motivation of present research to fill in this gap. Moreover, other important questions are proposed to address in this paper are as follows:
i.
What are the technical efficiency scores and the dynamics for the hospitals in different provinces of China during the period of 2002–2013?
ii.
How the external environmental factors affect the technical efficiency of Chinese hospitals? Have the medical reform improve the technical efficiency of Chinese hospitals?
Comparing to other various technical efficiency methods, the directional distance function (DDF) approach has gained much attentions and allows for incorporating both desirable outputs and undesirable outputs (pollutant). Generally, there are two kinds of distance functions that are widely used in the literature, including the Shephard distance function and the DDF. More details are introduced by Zhang and Choi [18]. The undesirable outputs are by-products in the production that are typically ignored and may yield biased measured of technical efficiency [19,20,21]. Moreover, a major advantage of the DDF is that it is capable of expanding desirable outputs and contracting inputs or bad outputs simultaneously [18]. The DDF was first introduced by Chambers et al. [22,23] and later has been widely applied to studies in field of Environment Economics and Energy Economics [18,19]. Despite these distinguished features and advantages, the DDF has rarely been applied to analyze the sustainable performance of hospitals. Hence, it is the second motivation for this research.
The basic DDF model that proposed by proposed by Chambers et al. [22,23] has several restrictions. The basic DDF function generalizes radial measures of technical efficiency since it allows for radial expansion of outputs and contraction of inputs as well as a non-radial expansion of outputs and contraction of inputs [24]. It does not provide technical efficiency information for specific inputs or outputs as it adjusts all inputs and outputs by the same proportion to the efficient targets. Moreover, the radial efficiency measures overestimate technical efficiency when there is slack [24]. Therefore, recent research has been developed to modify these drawbacks. Fukuyama and Weber [24] propose a slack-based inefficiency measure by extending the basic DDF model. Meanwhile, Färe and Grosskopf [25,26] propose a generalized non-radial DDF. Yu et al. [18], Zhang et al. [27] and Mei et al. [28] incorporate the meta-frontier approach into a non-radial DDF. In addition, Zhou et al. [29] design a non-radial DDF following an axiomatic approach, while Zhang et al. [19] develop a sequential generalized directional distance function approach to calculate the efficiency. We extend the work of Färe and Grosskopf [25,26], and use an innovative global benchmark technology in the generalized non-radial DDF that envelopes all contemporaneous benchmark technologies by establishing a single reference PPS (production possibility set) from a panel data on inputs and outputs of relevant DMUs, i.e., the global generalized directional distance function [30], so that to improve the discriminating power and comparability of intertemporal observations and analyze the sustainable performance of Chinese hospitals.
With respect to factors that have influences on the technical efficiency of Chinese hospitals, Eggleston et al. [31] and Wagstaff et al. [32] have concluded that the Chinese hospital is quite inefficient after a comprehensive review of Chinese health care system. Hu et al. [14] use the Tobit model to analyze the effects of some factors on the technical efficiency of Chinese hospitals, including the coastal location, public subsidies, the social medical insurance reform, the ratio of third-class hospitals to total hospitals and population characteristics. In addition, they conclude that the former two have insignificant effect on improving the technical efficiency, while the latter two significantly promote the technical efficiency. However, they use the traditional DEA to estimate the technical efficiency score in the first step. Therefore, it still needs more rigorous research to act as robust check.
The remainder of this paper is organized as follows: Section 2 briefly introduces the background of this paper. Then the methodology specification is presented in Section 3. In Section 4, we analyze the empirical results of global generalized directional distance function (GGDDF) approach. In Section 5, it continues to detect the factors that affect the sustainable performance of Chinese hospitals with Tobit models. The Section 6 concludes and provides some policy implications of this research.

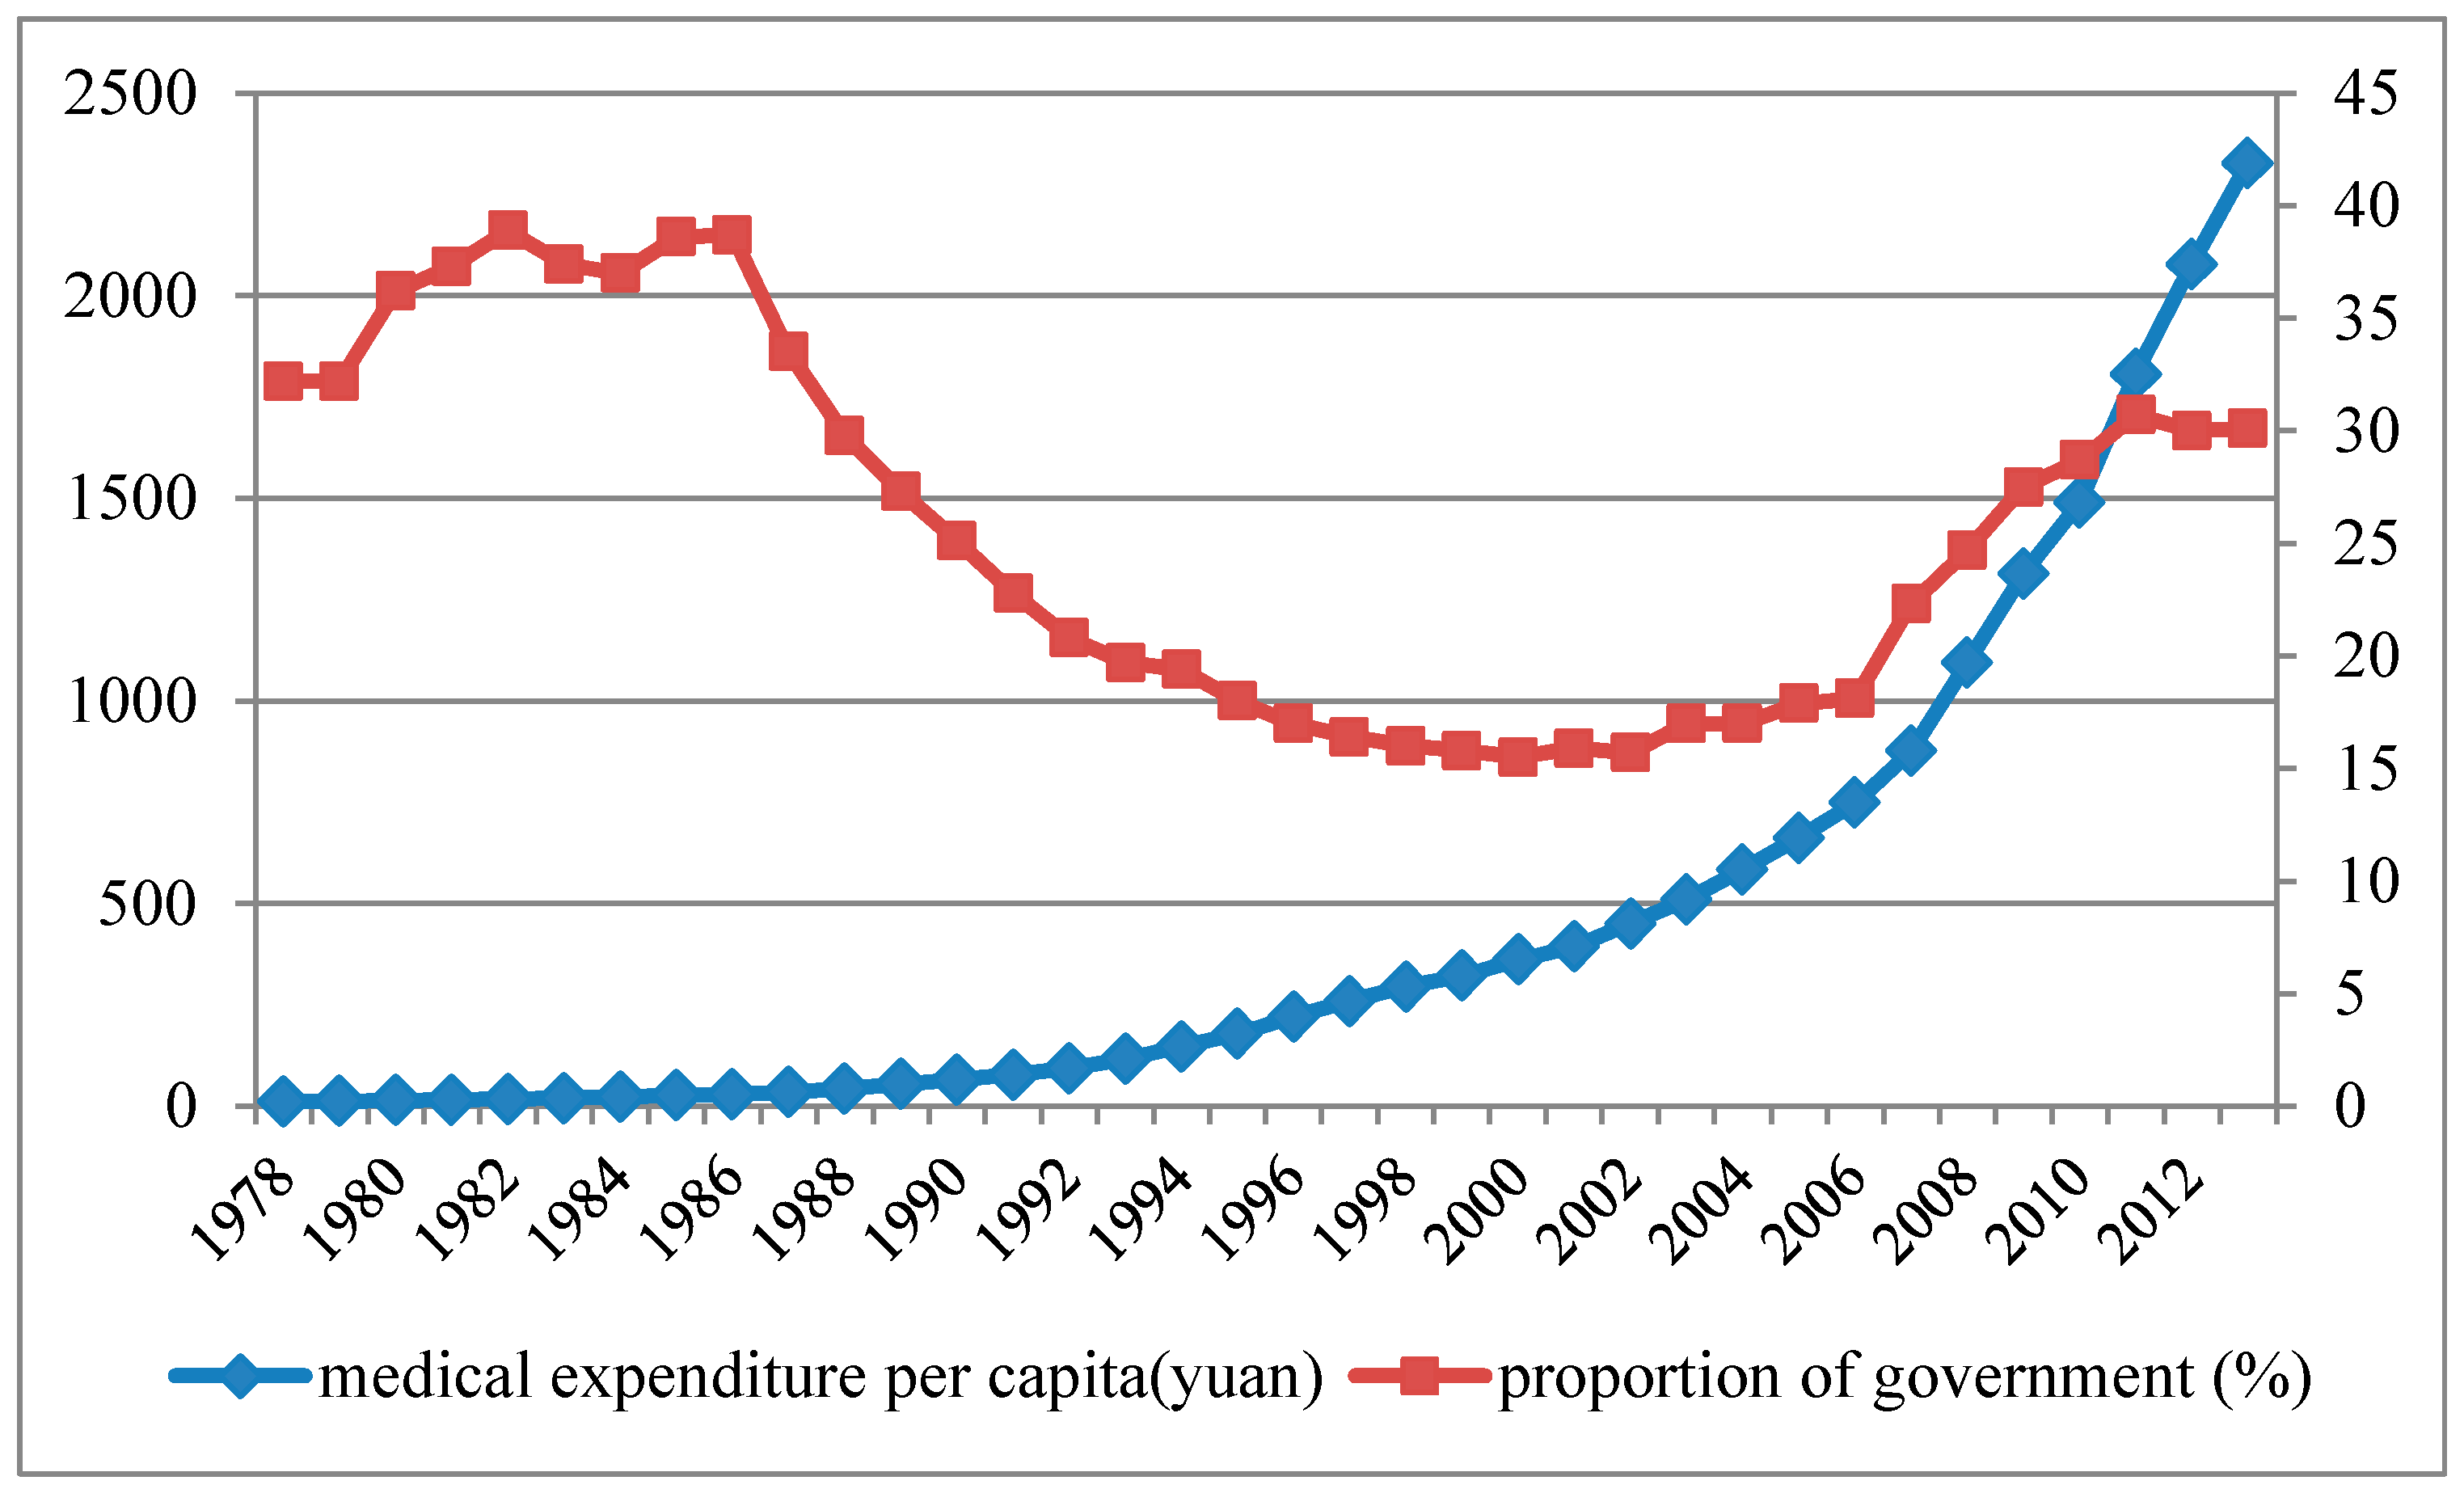
2. The Medical Care System of China

In the period 1949 to 1978, the medical care system of China was characterized by “prevention first”, community organization and cooperative financing. In this stage, the price of medical service was kept low by the Central Price Commission. People’s needs for basic medical service had been satisfied, which helped to improve their health status [33]. As the economic reform moved forward, the government put first priority on economic development when the local government was given more autonomy and competed for economic growth, rather than public services like medical care [34,35]. As a result, the development of the medical care system was challenged by limited public funds and the rapid expansion of medical expenditures [36].
Reform in the medical care system was not implemented until 1985, when the State Council approved the plan proposed by the Ministry of Health (MOH) of China, which intended to encourage the establishment of more hospitals in urban and rural areas. This gave existing hospitals more autonomy and raised the price of medical service, reducing the restrictions on the supply of medical service [37]. Meanwhile, the MOH of China also strengthened the quality of medical service through stipulating a regulation on hospital grading in late of 1989, namely certificating hospitals in China every three year in different grade according to their capacity to supply high-quality medical service. Later in 1992, the MOH of China granted further substantial financial autonomy to hospitals, encouraging the hospitals to increase their revenue by offering higher quality service and allowing hospitals to transform to modern companies and set joint ventures. After these reforms, new hospitals began to spring up and the supply of medical service largely increased [38]. As the regulation and entry barriers, the number of private hospitals had not increased a lot until 2001 when the government abolished some limitations. According to the latest China’s Health Statistical Yearbook, up to the end of 2013, there are 11313 private hospitals in China, while there are 13396 public hospitals. However, the public hospitals still maintain the dominant position in the healthcare sector of China [39]. At the same time, China began market and commercialization reform in the medical care system. Negative side-effects quickly began to emerge, including the poor access and high costs of medical service [31,35]. In addition, the average growth of health expenditure per capita has reached 16.02% during 2001–2013 (See Figure 1). The government just undertook 23.31% of it.
Responding to the rapid increase of costs and the reduction of medical care affordability, the government launched a series of reforms in 1994. The State Council implemented the pilot reform of basic social medical insurance scheme (BSMIS) for urban employees in Jiangsu and Jiangxi province. This was applied to the whole country in 1998. In 2003, the new rural cooperative medical system (NRCMS) was implemented in the four provinces by the State Council. For more details, see Dong [36]. With the outbreak of SARS (Severe Acute Respiratory Syndromes) in 2003 and the scandal of high expenses in medical services, i.e., an inpatient was charged 5.5 million yuan (0.67 million USD) by the hospital in 2005 and the MOH found there existed arbitrage charge and forged diagnosis report in the hospital after investigation, the MOH finally made a prudent review on the medical care system in China and admitted the low coverage of the medical insurance and the failure of market-orientation reform in medical care industry.
Figure 1. Trend of medical expenditure per capita (left) and the share of government medical expenditure (right) in China. Sources: China’s Health and Family Planning Yearbook 2014 [40].
Sustainability 07 14092 g001
After 2005, the government took measures to increase the coverage of medical insurance. The milestone in this period is the publication of new scheme for medical care reform in 2009. The government promised to increase the fiscal subsidies rather than rely on market to sufficiently satisfy people’s needs for basic medical services. Meanwhile, it would invest 850 million yuan (about 124.43 million USD) in the next two years to deepen the reform, including accelerating the establishment of basic medical care insurance system and essential drug system, improving the community-level medical service system, increasing the equalization in the public medical services and the pilot experiments on public hospital reforms. Reform will never cease until people can access to more affordable, accessible and equal medical service in this first largest populated country.

3. Methodology

3.1. Global Generalized Directional Distance Function

In order to introduce the generalized directional distance function, firstly we need to explain the term “production technology with undesirable outputs”. Assume that there are j = 1, ... , N DMUs. These can be hospitals. Suppose that each DMU uses inputs vector x + M to jointly produce good output vector y + S and bad output vector b + J . The production technology is expressed as:
T = { ( x , y , b ) : x  can produce ( y , b )}
where T is often assumed to satisfy the standard axioms of production theory, such as inactivity is always possible, and finite amounts of input can produce only finite amounts of output. In addition, inputs and desirable outputs are often assumed to be strongly or freely disposable. In the presence of undesirable output, a weak disposability needs to be imposed on T. The weak-disposability assumption implies that reducing bad outputs, such as mortality rate, are costly in terms of proportional reductions in hospital production. The DEA piecewise linear production frontier is used to construct the production technology. Then, production technology T for N DMUs exhibiting constant returns to scale can be expressed as follows:
T = {( x , y , b )   : n = 1 N z n x m n x m , m = 1 , ... , M ,                           n = 1 N z n y s n y s , s = 1 , ... , S ,                           n = 1 N z n b j n = b j , j = 1 , ... , J ,                            z n 0 , n = 1 , , N } .
A formal definition of the generalized DDF is proposed in Yu et al. [18] and Zhang et al. [19] with undesirable outputs. Following Yu et al. [18], the generalized DDF is defined as:
D ( x , y , b ; g ) = sup { w T β : ( ( x , y , b ) + g d i a g ( β ) ) T }
where w = ( w m x , w s y , w j b ) T denotes a normalized weight vector relevant to numbers of inputs and outputs, g = ( g x , g y , g b ) is an explicit directional vector, and β = ( β m x , β s y , β j b ) T 0 denotes the scaler of scaling factors. We also incorporate global production technology into the GDDF model to improve the discriminating power and comparability of intertemporal observations.
The value of D ( x , y , b ; g ) under the global production technology can be calculated by solving the following DEA-type model:
D r ( x , y , b ; g ) = max w m x β m x + w s y β s y + w j b β j b                      s.t.  t = 1 T n = 1 N z n x t m n x m β m x g x m , m = 1 , ... , M ,                     t = 1 T n = 1 N z n y t s n y s + β s y g y s , s = 1 , ... S ,                      t = 1 T n = 1 N z n b t j n = b j β j b g b j , j = 1 , ... J ,     z n 0 , n = 1 , 2 , , N     β m x ,   β s y , β j b    0.
The directional vector g can be set up in different ways, based on given policy goals. If D ( x , y , b ; g ) = 0 , then the specific unit to be evaluated is located on the frontier of best practices in the direction of g.
The technical efficiency can be defined based on the generalized DDF. As there are three kinds of variables, three inputs, two desirable outputs, and one undesirable output, we set the weight vector as (1/3M, 1/3S, 1/3J) and the directional vectors as g = ( x , y , b ) , based on Equation (3).
The overall technical efficiency (OTE) for a hospital is defined as the average technical efficiency of each factor. Suppose that β x * , β y * , and β b * represent the optimal solutions to Equation (4), then the OTE can be formulated as:
O T E = 1 1 M + S + J ( m = 1 M β x m * + s = 1 S β y s * + j = 1 J β b j * )

3.2. Tobit Model

After the technical efficiency scores generated from GGDDF, we further regress it on the environmental variables, so that to check the effects of these exogenous on the difference technical efficiency of Chinese hospitals. As the technical efficiency scores must lie between 0 and 1, we adopt the censored (Tobit) regression model. The unobservable latent regression is specified as follows:
O T E i t * = x i t β + ε i t
where x i t is a vector of exogenous environmental variables, and β is a vector of parameters to be estimated. ε i t is the error term and distributed as N (0,σ2).
The observed technical efficiency scores, OTEit, are the censored values of O T E i t * . It is defined as follows:
O T E i t = { 0 , i f O T E i t * < 0 O T E i t * , i f O T E i t * [ 0 , 1 ] 1 , i f O T E i t * > 1
The Tobit model structured in the Equations (6) and (7) are finally estimated by the maximum likelihood method (MLE).

3.3. Background Literature and Descriptive Data

Our analysis includes the province-level data of Chinese hospitals available over the period 2002 to 2013 (372 observations) due to the hospital-level data being rarely disclosed, which cover much longer period than previous research on China, like Ng [13] and Hu et al. [14]. This province-level data was obtained from China's Health Statistical Yearbook that published by MOH of China during 2003–2014. We have obtained approval from the Ethics Board to use data. It covers all the hospitals in different provinces of China. The overwhelming majority of Chinese hospitals are public hospitals. According to the data of China’s Health Statistical Yearbook, the proportion of total assets of private hospitals just account for 4.07% at end of 2013 in China. The criteria used for adopting the inputs and the outputs variables are the practices according to the previous research on hospital efficiency, which include Jacobs [6], Hu et al. [14], Barros et al. [15,16], Koop et al. [41], Rosko and Mutter [42], Varabyova and Schreyögg [43], Li et al. [10], and the accessibility of the data of Chinese hospitals, so that to rigorously estimate the technical efficiency [10]. For the inputs, we choose the total staff, the total assets and the number of beds, which stands for the labor, the capital and the capacity, respectively. For the curse of dimensionality is always present in nonparametric estimation, we adopt the total staff as a whole instead of physicians, nurses and technicians, to represent labor input [10,13,14]. Meanwhile, for the outputs, there is still no established consensus on how to accurately measure the outputs of hospital production. Some researchers use the number of outpatient and inpatient to measure the outputs of hospitals [10,13,14]. However, according to Biørn et al. [44] and Ozcan [45], it is more appropriate to adopt the total revenue and the number of surgery as output variables. Furthermore, except for these desirable outputs, we also focus on the bad outputs “mortality rate” under GGDDF method, which has not been paid much attention in the literature of hospital efficiency. It is measured by the morality rate of different provinces in China. We recognize that it is significant to distinguish the death due to the mistakes in the medical services and the natural death. However, according to present literature, Zuckerman et al. [46] and Hu et al. [14] also used this indicator to measure the undesirable outputs. Moreover, as the detailed information of mortality in China is not disclosed [47], we simply use the single indicator “mortality rate”. We also try to find some other alternative indicators to replace it, but we failed at last. If we acquire the more details in the future, we will use more accurate variables to improve present research. By the way, we believe that the simple indicator “mortality rate” could reflect the death due to the mistakes in the medical services to some degree. We just focus on the hospitals in China, and there will be no significant differences in the natural death rate for these domestic areas of China. The detailed definition and descriptive statistics of these inputs and outputs variables are presented in Table 1.
Table 1. The definition and descriptive statistics of input and output variables.
VariableDefinitionObservationMeanStd. Dev.MinMax
total staffthe number of total staff in the hospitals372207,046.2130,728.410,058684,976
total assetsthe total assets of hospitals (million yuan)37243,800.0039,800.00717.00216,000.00
bedsthe number of beds in the hospitals372100,245.9079,129.754238.00 1,027,919.00
total revenuethe total revenue of hospitals (million yuan)37234,200.0034,500.00588.00214,000.00
surgerythe total number of surgeries372748,730.00997,765.20 6230.0016,000,000.00
mortalitythe mortality ratio in different provinces3725.96 0.67 4.21 7.30
Sources: China’s Health Statistical Yearbook 2003–2013 [48,49,50,51,52,53,54,55,56,57,58], China’s Health and Family Planning Yearbook 2014 [40].
We utilize the Lingo package to estimate the technical efficiency of Chinese hospitals with the mentioned data. Thereafter, we adopt the Stata software (StataCorp LP, College Station, TX, USA) to analyze how these environmental variables affect the technical efficiency scores in the second stage.

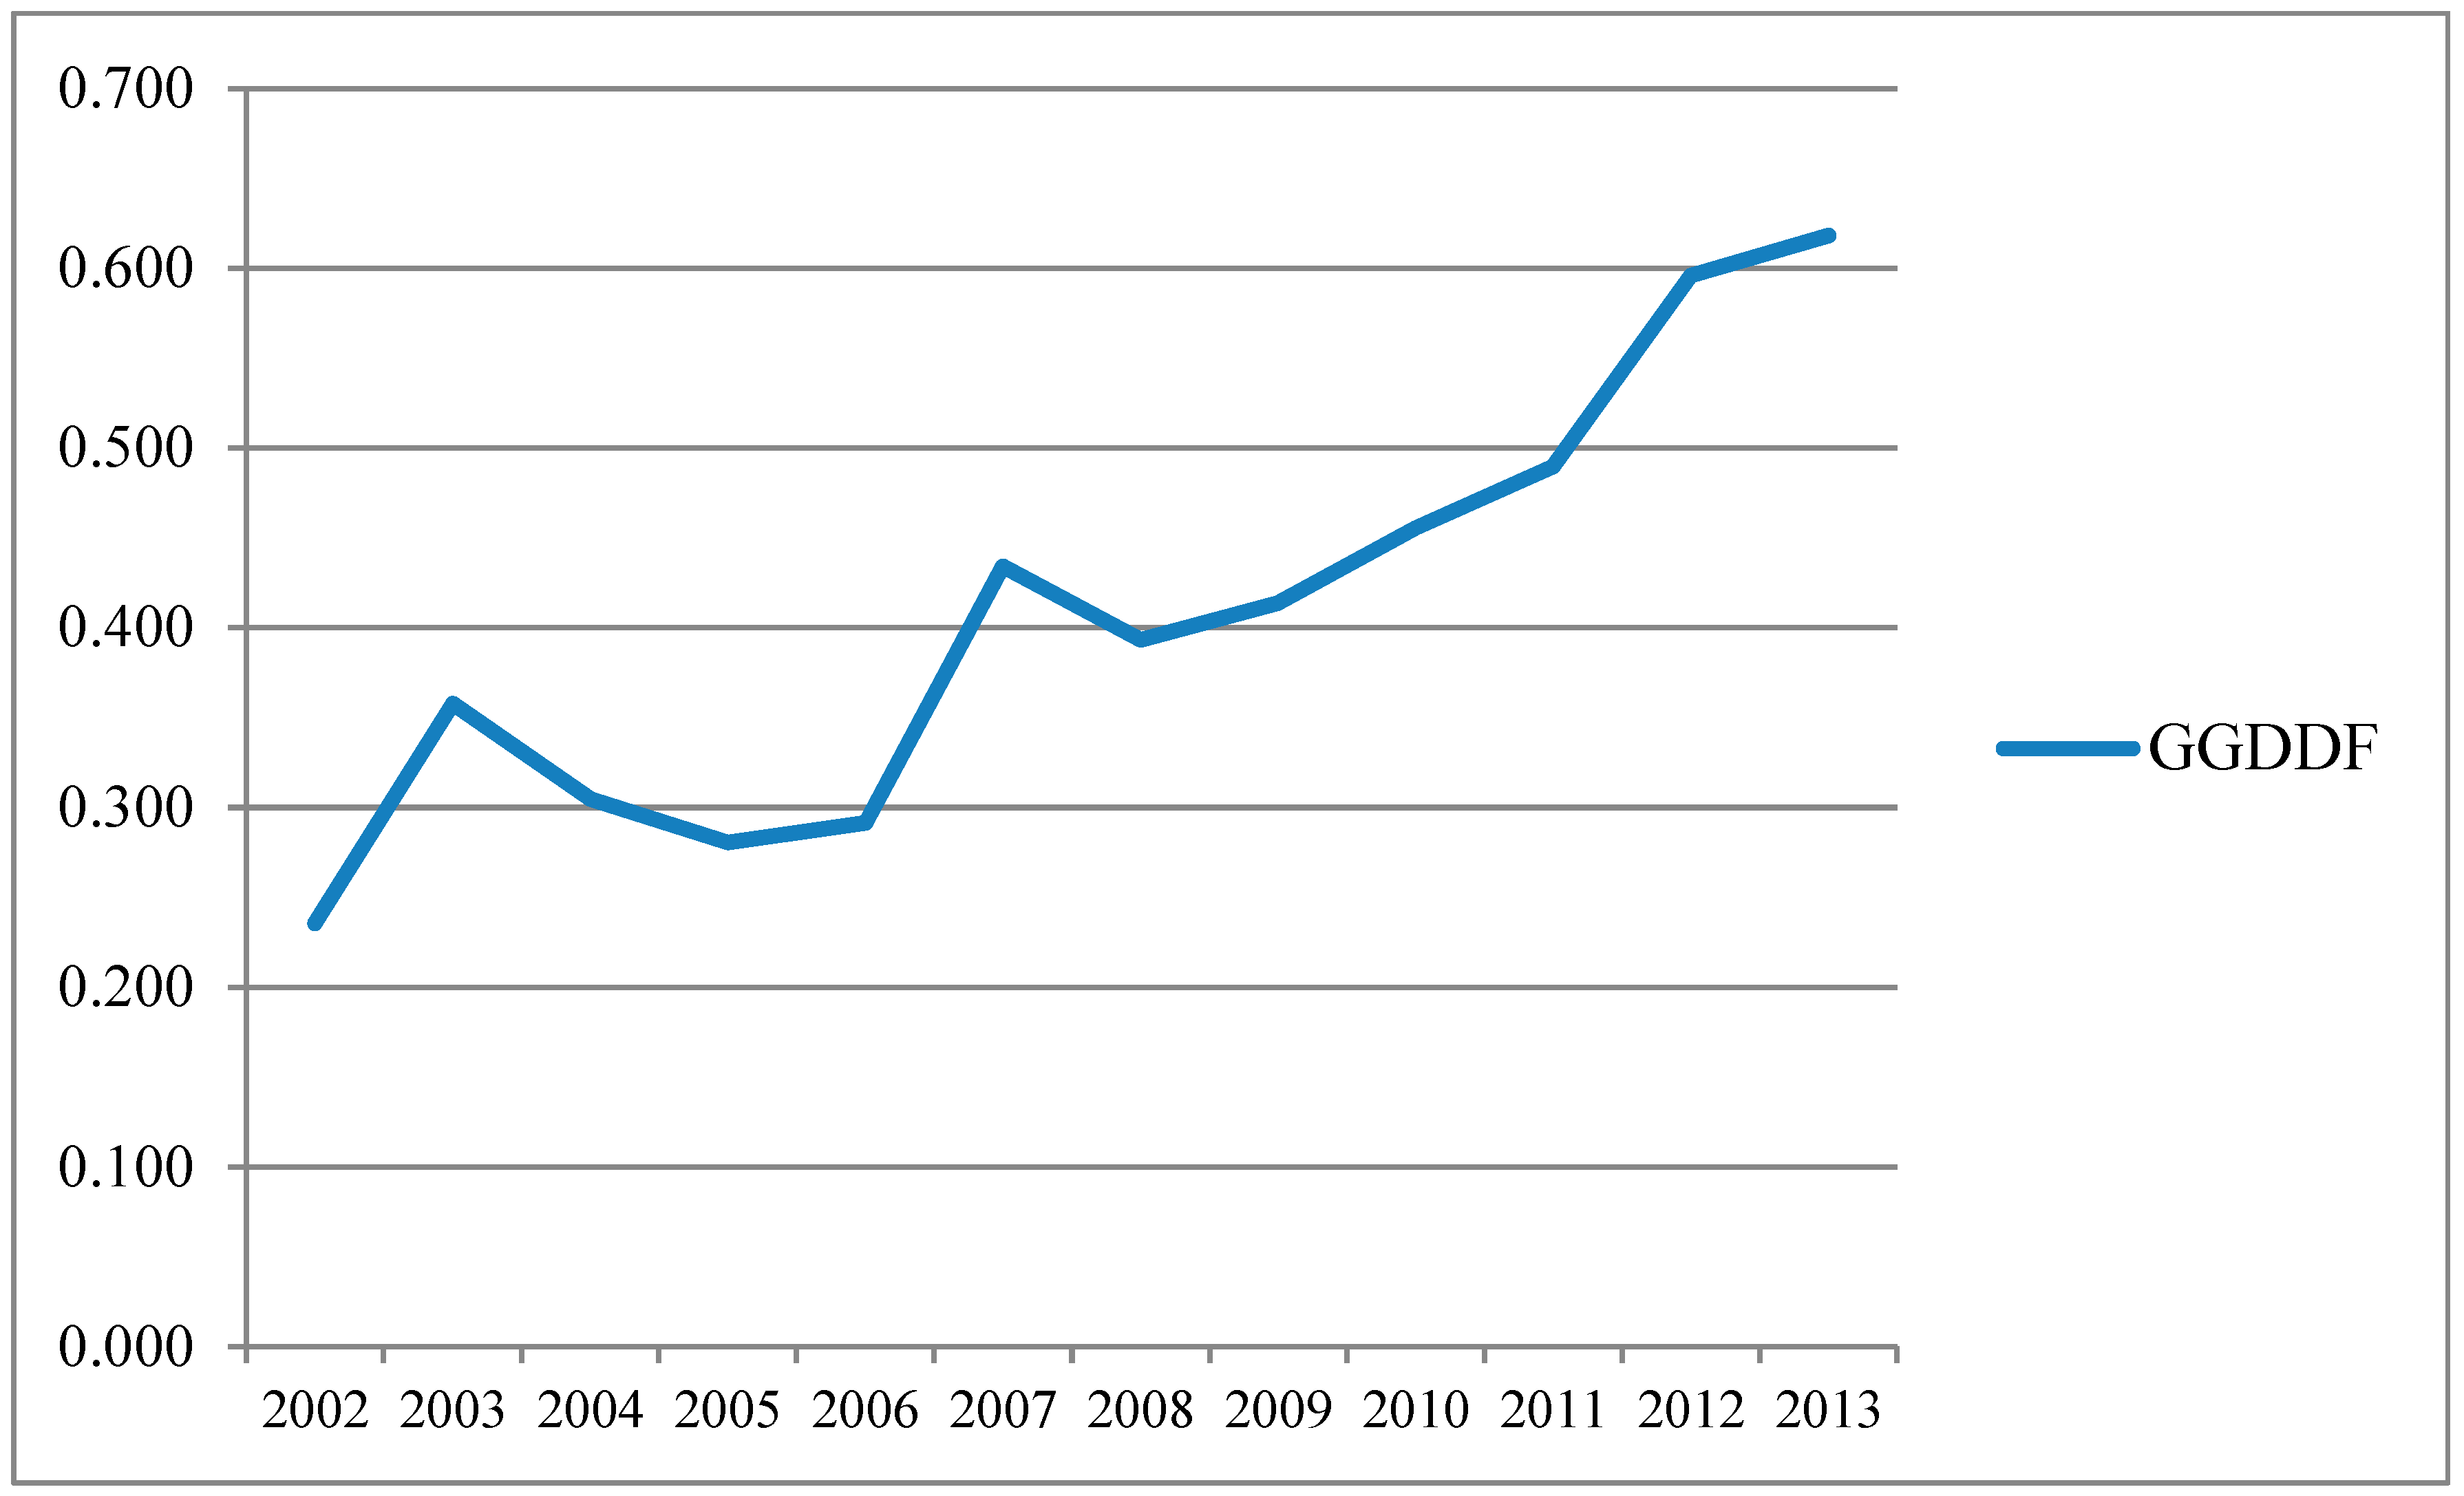
4. Technical Efficiency Estimation

The proposed technical score is applied to hospitals in 31 provinces of China. It is calculated from the GGDDF of Equation (5) and takes values of between 0 and 1. According to this definition, the closer the technical efficiency measure is to 1, the more efficient the hospitals can be considered to be in providing medical services.
The hospital’s overall technical efficiency scores are presented in Table 2. According to Table 2, the overall technical efficiency varies from different provinces and different years. In 2003, the technical efficiency scores of Beijing, Hainan and Tibet all equal to 1, inferring that the hospitals in these three provinces are the most efficient and lie on the frontier. Meanwhile, the overall technical efficiency scores of Beijing, Shanghai and Guangdong also equal to 1 in 2013. However, from the estimated technical efficiency scores of Table 2, most of the Chinese hospitals are inefficient and far from the technical frontier. When the SARS broke out in 2003, it had caused the panic among people as well as the government intervention at that time. Therefore, the technical efficiency of Chinese hospitals also had been affected and showed oscillations. Some provinces, like Beijing, Hainan, Tibet and Qinghai, experienced the sharply increase of technical efficiency, while others, including Guangdong, Hebei, Shandong and Shaanxi undergone large decrease of technical efficiency.
Table 2. The technical efficiency scores of Chinese hospitals in different provinces and years.
Province200220032004200520062007200820092010201120122013
Anhui0.1810.1660.3580.2850.2710.5190.3540.4020.4150.4440.5120.522
Beijing0.3681.0000.3930.3960.5180.4510.5470.5940.6440.7300.9681.000
Chongqing0.1960.3150.2220.2460.2540.3230.6260.4040.4240.4430.5490.574
Fujian0.2670.3440.3060.3200.3260.9340.3640.3320.4180.3890.5790.602
Gansu0.1590.1960.1810.1640.1640.5000.2410.2000.3590.3700.4250.460
Guangdong0.3370.2490.4970.4630.4500.4920.5690.6250.6900.8070.9521.000
Guangxi0.1460.1830.2610.2750.2800.3390.3540.4060.4460.4920.5990.636
Guizhou0.1770.2640.2030.2370.2740.4120.3470.4460.4520.4780.5360.565
Hainan0.2131.0000.1660.1970.1890.2520.2700.3160.3600.3810.4500.473
Hebei0.5340.1180.2780.2910.2890.3740.4050.4860.4870.4680.6060.595
Heilongjiang0.1670.1900.2750.2990.3000.4070.4140.4770.4380.4630.5330.544
Henan0.2170.0920.2840.3110.3100.3630.4150.4720.4960.5140.6220.618
Hubei0.2420.1800.3530.3070.3080.3860.5120.4550.4620.4720.5660.573
Hunan0.2330.1550.2890.2820.2950.6160.3790.3200.4580.4790.5890.641
Inner Mongolia0.1410.1580.2070.2100.2380.2890.2980.2790.3900.4240.4910.490
Jiangsu0.3570.2320.5890.3940.4050.4450.4600.4950.5210.5550.6900.726
Jiangxi0.2230.1720.3210.2600.2640.6270.3420.3400.4420.4670.5460.550
Jilin0.2210.1960.2710.2260.2440.3230.4160.4490.4200.4200.5240.575
Liaoning0.0730.1350.2850.2950.3140.4710.4070.4490.4760.5020.6370.652
Ningxia0.0701.0000.1720.1910.1850.2220.2650.3030.3370.3590.4190.461
Qinghai0.0720.9840.1290.1410.1520.2830.2120.2670.2960.3460.4320.477
Shaanxi0.3520.1790.2120.2070.2250.2700.3200.3540.4120.4540.5530.564
Shandong0.4170.1130.3830.3170.3420.4290.4480.4850.5110.5520.6610.681
Shanghai0.4190.5780.5760.4900.4920.5220.6130.6400.6750.8010.9661.000
Shanxi0.2210.1460.3270.2130.2490.6300.2830.2550.3830.3980.5220.561
Sichuan0.2500.1400.2770.3080.2990.4480.4170.4950.5100.5350.6360.653
Tianjin0.3100.8640.3380.3510.3380.4530.4100.4900.5250.5980.6590.732
Tibet0.0971.0000.2430.0880.1210.4730.2010.2630.2070.2590.3490.300
Xinjiang0.2090.2130.2740.2800.2460.3920.3230.3510.4290.4630.5470.550
Yunnan0.0770.2170.2260.2360.2550.2990.3940.3960.4180.4510.5170.513
Zhejiang0.3570.3160.5440.4190.4400.5200.5840.5790.6200.6570.8390.878
With regard to overall average technical efficiency of hospitals in individual provinces, Shanghai shows the best performance among all the counterpart provinces for highest averaged technical efficiency score 0.648 (See Figure 2, with standard deviation of 0.185). The hospitals in Beijing rank the second place, with averaged technical efficiency score of 0.634 (with standard deviation of 0.239). The hospitals in Guangdong rank the third place for averaged technical efficiency score of 0.594 (with standard deviation of 0.232). Despite the averaged overall technical efficiency scores of hospitals in these three provinces are still much less than 1, they seems much better comparing to other provinces, which also indicates the technical efficiency of hospitals in developed regions will be more excellent. Shanghai, Beijing and Guangdong are provinces with higher level of economic development in the passing decades. Beijing is the capital of China as well as political and cultural center in China. Meanwhile, the Shanghai is the municipality directly under the central government and financial center in China. Guangdong has first experienced the “Open and Reform” policy since 1978 in China and witnessed the sharp expansion of FDI and international trade.
Figure 2. Technical efficiency scores of hospitals in different provinces (Sources: the technical efficiency score estimate with DEA is obtained from Hu et al. [14] “Analysis of hospital technical efficiency in China: Effect of health insurance reform”, China Economic Review).
Sustainability 07 14092 g002
The trends of relative technical efficiency performance of all the hospitals in 31 provinces of China are shown in Figure 3. Although the overall technical efficiency score temporally declined during the period of 2004–2006 and 2008–2009, the long-term technical efficiency is still in an upwards trend. Therefore, the overall technical efficiency of hospitals in China has been improved in the last decade. The fluctuation of the overall technical efficiency score may be due to the rapid increase of medical fees for inpatient and outpatient as well as the outbreak of financial crisis since 2008. As the statistics of China's Health Statistical Yearbook indicated, the average inpatient medical charge and outpatient medical charge both had increased about 7.5%–11.0% during the period of 2004–2006 and 2008–2009, which is much higher than other period.
Figure 3. Trend of technical efficiency score.
Sustainability 07 14092 g003

5. Determinants of Technical Efficiency for Chinese Hospitals

5.1. Model and Variables Specification

From the information of contextual setting part of this paper, the medical sector of China had underwent profound reform in the passing three decades. The social and economic environment was also in rapid transition for emerging of “China’s miracle”. Meanwhile, we need to further investigate the deep reasons for the changes of technical efficiency of Chinese hospitals, so that to acquire more insights on hospital management and public policy implications for further reform in the medical sector of China. Therefore, following the literature on two-stage DEA [14,59,60], we adopts a Tobit model to exam how these exogenous environmental variables affects the technical efficiency for Chinese hospitals.
Based on the literature survey, contextual setting of China and the available data, the independent variables are selected as follows, i.e., we will examine the relationship between hospital’s overall technical efficiency and the following covariates: 3A class (San Ji Jia Deng) hospital proportion (best), public subsidies (suby), medical insurance reforms (reform1) and (reform2). The justification for the selection of these covariates is provided in the following subsections.
The 3A class hospital proportion in the total number of public hospitals indicates the supervision as well as the medical services quality. In China, the hospitals have been divided into three grades according to their capability to supply high-quality medical service. There are three subclasses in each grade. The top is labeled as 3A hospital. They could offer specialized medical service, medical research and tertiary medical education. However, the technological advantage and accumulation of human resources is costly to improve the medical services of hospitals.
The public subsidies are the amount of funds transferred to the hospitals, which could increase the hospitals’ budget for more professional personnel and advanced equipment, as well as induce moral hazard or shirking behavior. The net effects of public subsidy are not clear. Public hospitals in China always hold the major share of the medical market despite flourishing private hospitals since 2001. Furthermore, price regulation on medical service makes the public subsidies very significant to cover expenses for public hospitals.
The social medical insurance reform is measured with two dummy variables. As the contextual setting part indicates, China initiated the NRCMS in 2003. The government launched the basic social medical insurance for urban residents program (BSMIP) in 2007, which is different from BSMIS and covers the elderly, students, children and unemployed. Then the three-tier social medical insurance schemes finally established and increase the affordability of medical service. Follow the research of Hu et al. [14], we also examine whether the introduction of NRCMS and BSMIP have increased the technical efficiency of hospitals. We define that these binary dummy variables equal 1 for post-reform period after 2003 and 2007, respectively.
Moreover, to control the heterogeneity of different provinces, we further introduce explanatory variables of the characteristics of provinces in China, including the GDP per capita (gdpp), the population density (popd) and the geography location (area). According to the China Statistical Yearbook, the eastern area includes 12 provinces like Beijing, Tianjin, Hebei, Liaoning, Jiangsu, Shandong, Shanghai, Zhejiang, Fujian, Guangdong, Guangxi and Hainan. The middle area includes nine provinces, such as Shanxi, Inner Mongolia, Jilin, Heilongjiang, Anhui, Jiangxi, Henan, Hubei and Hunan. The western area includes the rest 10 provinces, i.e., Chongqing, Sichuan, Guizhou, Yunnan, Tibet, Shaanxi, Gansu, Qinghai, Ningxia and Xinjiang. The variable area is a dummy variable. When the province is in the east area, area is labelled 0, and equals 1 for the middle area, 2 for the west area.
The detailed definition and descriptive statistics of these independent variables are presented in Table 3.
Table 3. The definition and descriptive statistics of independent variables.
VariableDescriptionObservationsMeanStd. Dev.MinMax
gdppGDP per capita3729.7660.6488.08911.228
popdpopulation density3720.4130.5980.0023.833
subygovernment subsidy37214.9378.1223.03759.232
bestratio of 3A hospitals3724.1802.4310.79213.143
reform1NRCMS reform3720.8330.37301
reform2BSMIS reform3720.5000.50101
arealocation3720.9350.84102
From the correlation matrix reported in Table 4, the adopted explanatory variables are all significantly related with the technical efficiency of the Chinese hospitals in different provinces. Moreover, most correlation coefficients of these explanatory variables are much lower than 0.5. In addition, the possibility of multi-collinearity problem can be eliminated with further check on VIF (variance inflation factor), which is smaller than 5.
Table 4. The correlation matrix between technical efficiency (TE) and explanatory variables.
TEgdpppopdsubybestreform1reform2
TE1
gdpp0.663 ***1
popd0.401 ***0.529 ***1
suby−0.304 ***−0.172 ***−0.272 ***1
best0.370 ***0.499 ***0.588 ***−0.303 ***1
reform10.260 ***0.433 ***0.026−0.0490.051
reform20.472 ***0.554 ***0.0390.0690.060.447 ***1
Note: The symbols *, **, *** indicate significance at 10%, 5% and 1% levels, respectively.

5.2. Empirical Results

Table 5 reports the empirical results of Tobit model regressed on the explanatory variables mentioned above. It starts from a limited set of regressors and gradually adds in more controls. The column (1) of Table 5 is the baseline results. In the continued columns, we further add more new variables to check the effects of different factors as well as the robustness of the empirical models. The time trends are captured and controlled through year dummy in the models.
Table 5. The results of Tobit models.
(1)(2)(3)(4)(5)
gdpp0.100 ***0.075 ***0.073 ***0.073 ***0.083 ***
(5.79)(4.54)(4.74)(4.74)(4.50)
popd0.066 ***0.052 ***0.050 ***0.050 ***0.049 ***
(5.16)(4.01)(3.65)(3.65)(3.48)
suby −0.007 ***−0.007 ***−0.007 ***−0.007 ***
(−5.47)(−5.39)(−5.39)(−4.96)
best 0.0010.0010.002
(0.34)(0.34)(0.53)
reform1 0.173 ***0.168 ***
(5.06)(4.84)
reform2 0.137 ***0.131 ***
(3.81)(3.57)
area 0.010
(0.75)
_cons−0.694 ***−0.370 **−0.359 **−0.359 **−0.452 ***
(−4.51)(−2.43)(−2.49)(−2.49)(−2.64)
sigma
_cons0.126 ***0.113 ***0.113 ***0.113 ***0.113 ***
(10.61)(11.63)(11.63)(11.63)(11.78)
Year effectsYesYesYesYesYes
Log pseudolikelihood265.97265.53265.53265.49227.14
F55.0959.6659.6563.5158.61
N372372372372372
Note: The t value in parentheses (based on robust standard error). The symbols *, **, *** indicate significance at 10%, 5% and 1% levels, respectively.
According to column (1) of Table 5, the variable gdpp and popd are both significant at 1% and positive with the overall technical efficiency of Chinese hospitals. In column (2) of Table 5, we further investigate the effects of government subsidies (suby) on the sustainable performance of hospitals on the basis of the model of column (1). The results shows that the coefficient of public subsidies is negative at 1-percent significant level, which means that the subsidies make negative impacts on the Chinese hospitals to improve technical efficiency. According to column (3) in Table 5, the coefficient of the 3A class hospital proportion is not significant, implying that it has no effects on technical efficiency of Chinese hospitals. As the definition in Table 3, the binary dummy variables Reform1 and Reform2 are designed to analyze the effects when introducing the social medical insurance reform in 2003 and 2007. Referring to column (4) in Table 5, both coefficients of Reform1 and Reform2 are significantly positive at 1 percent level.
In order to further control the location heterogeneity, an area dummy variable is added into model and the regression results is showed in column (5) of Table 5. The estimated coefficient of area is statistically insignificant, implying there is no apparent difference among eastern, middle and western provinces, after controlling for other factors.
Furthermore, comparing the results of different columns in the Table 5, we find that the estimated results are very robust for each regressor, for example, the variable “gdpp” is statistically significant at 1% in model 1-model 5, and its coefficients fluctuate in small range.

6. Discussion

The results reveal that technical efficiency of Chinese hospitals varies among different provinces and time. Despite the trend of technical efficiency being improved with time, most Chinese provinces are not performing well leave a large potential to improve. Beijing, Shanghai and Guangdong display better performance comparing to other provinces of China. Later, we further investigate the factors that may affect the technical efficiency of Chinese hospitals, which also shed lights on the effects of reforms undergone. It concludes that the social medical insurance reforms that launched in 2003 and 2007 both have promoted the technical efficiency of Chinese hospitals. Meanwhile, the government subsidies have negative influence on the technical efficiency of Chinese hospitals. The proportion of 3A hospitals and the area dummy variable is not statistically significant. With higher GDP per capital and population density, which means greater medical services demand potentials, the technical efficiency scores is higher in China.

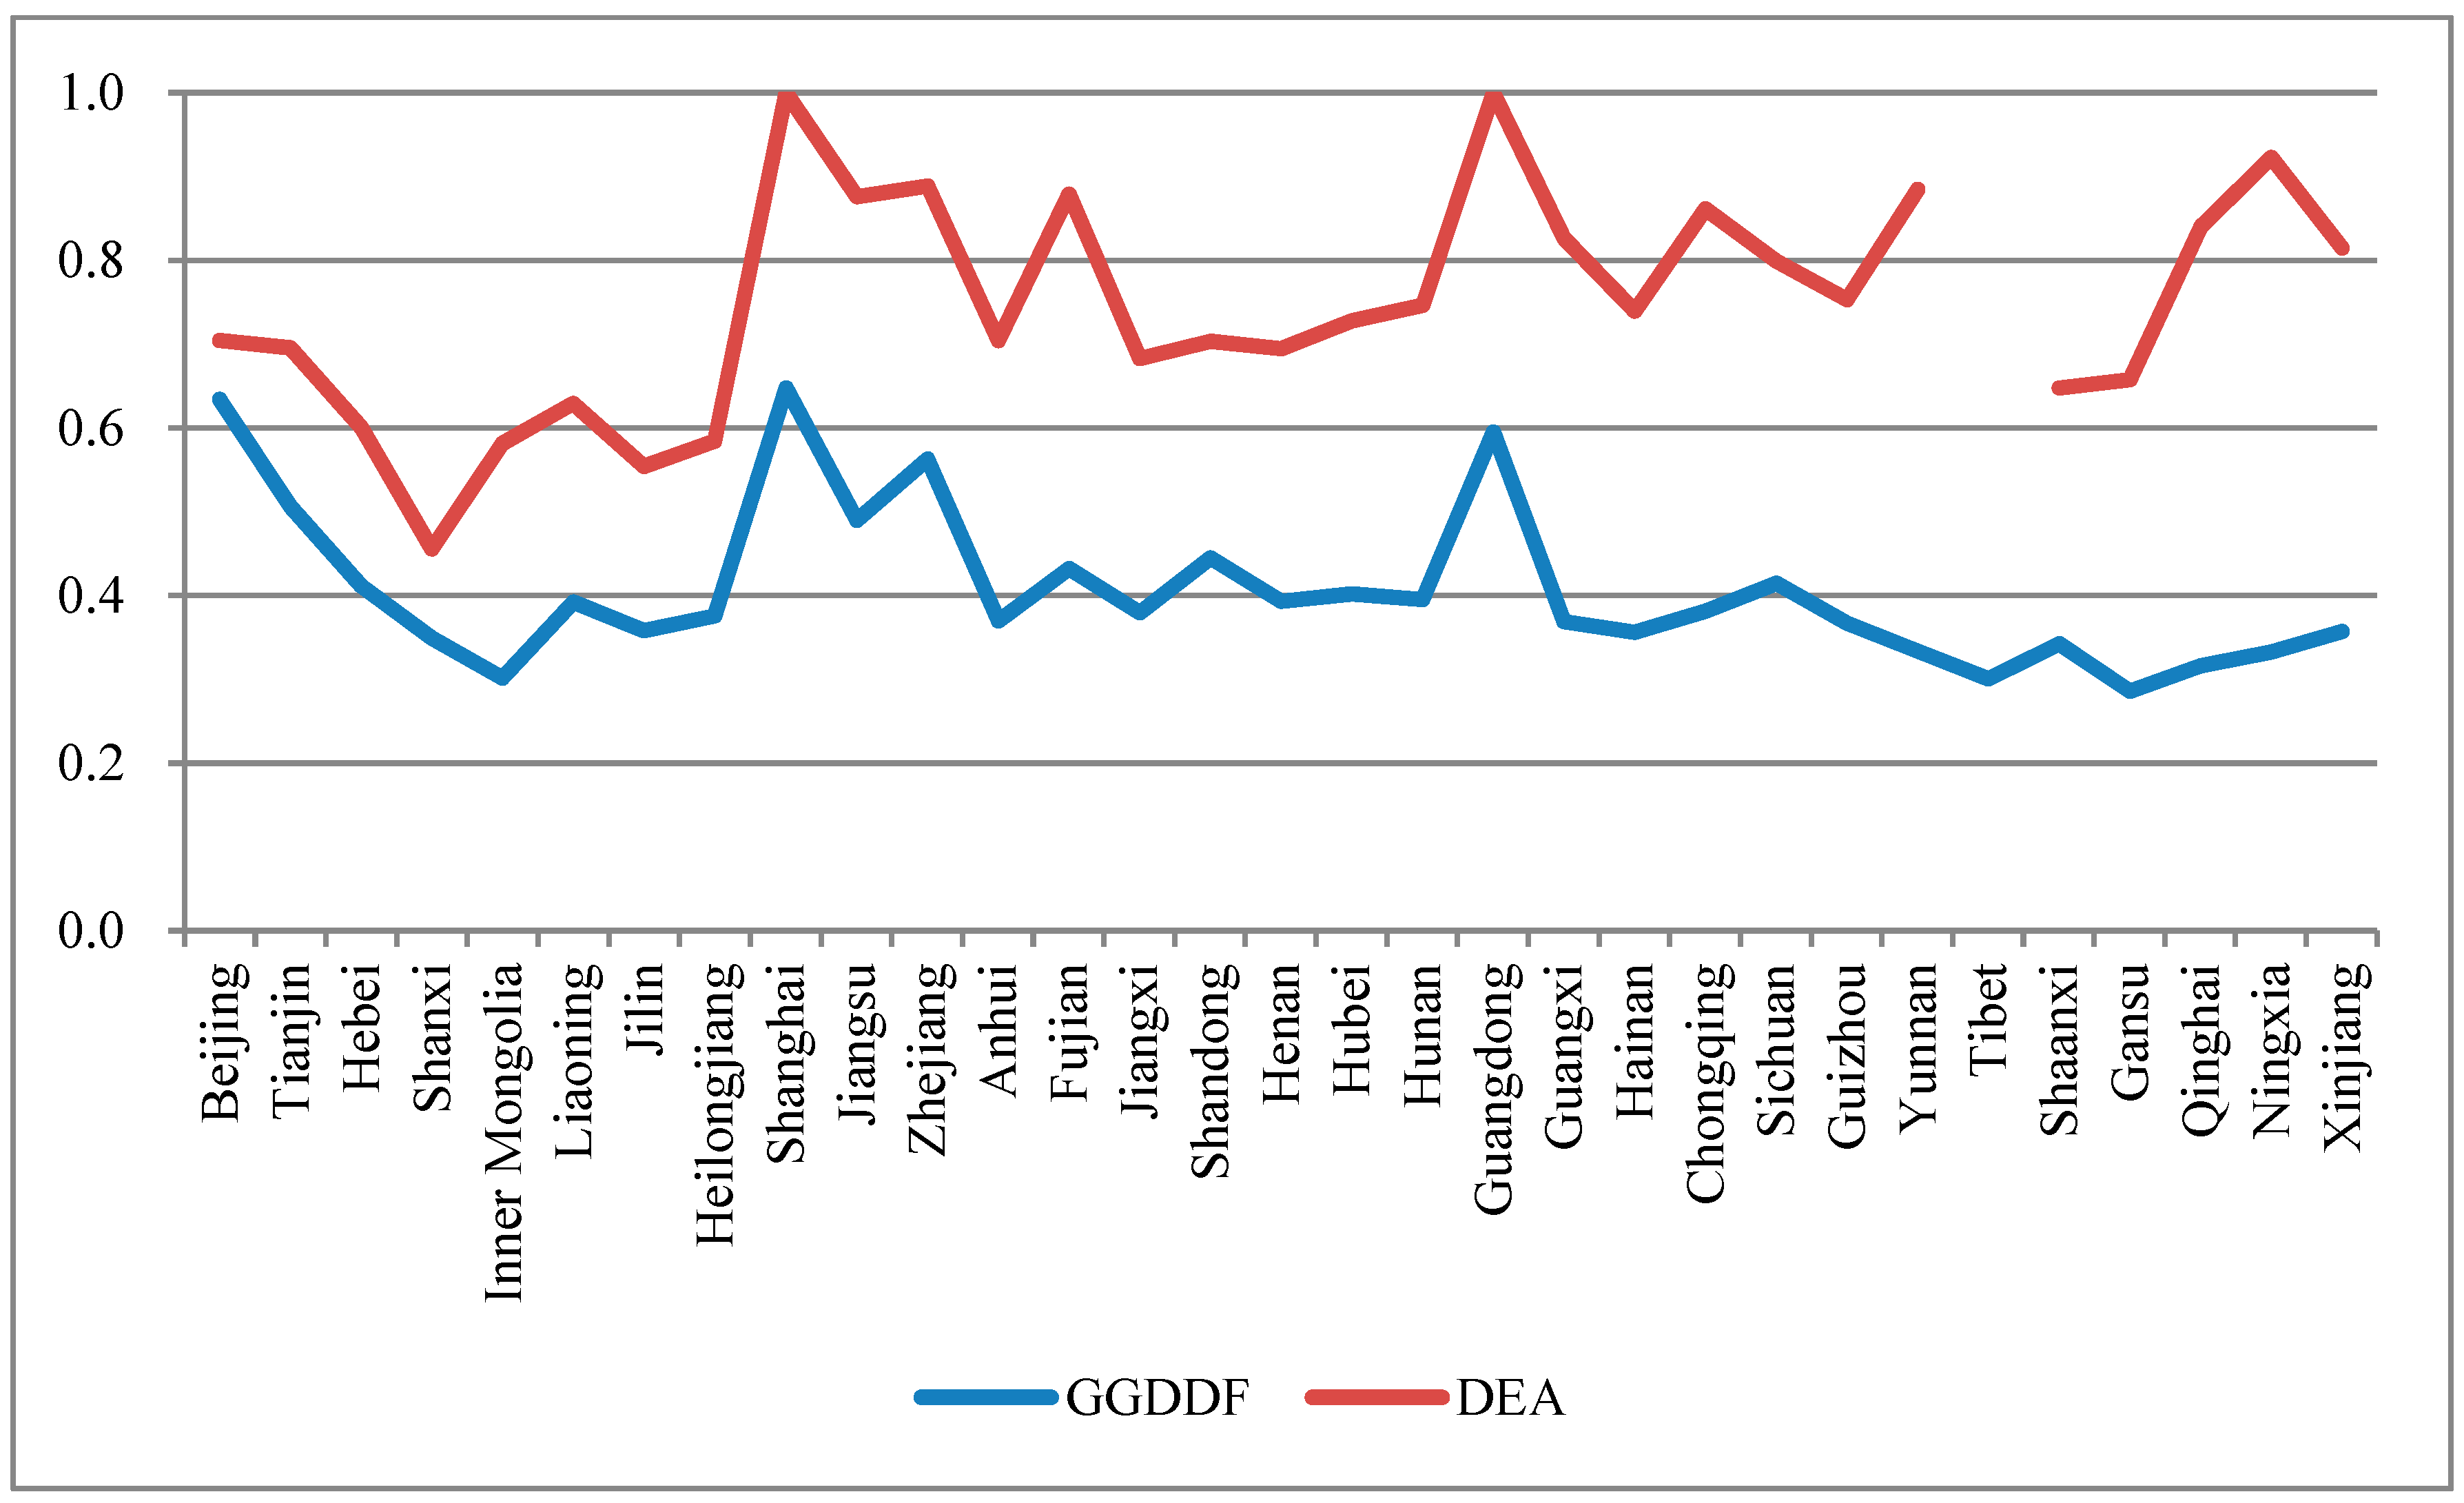
6.1. Technical Efficiency Estimation Compared with Other Research

For comparison purposes, we also provide the technical efficiency estimated by Hu et al. [14] in Figure 2, who also make a research on the technical efficiency of Chinese hospital with province level data during 2002–2008. They employed the output-oriented CCR DEA model and considered both desirable and undesirable outputs in hospital production. The outputs variables are the total number of outpatient and emergency room visits, the total number of inpatient days and patient mortality, while the inputs variables are the number of doctors, medical technicians, other staff and beds as well as the fixed assets. According to the existing research, including Jacobs [6], Barros et al. [16], Koop et al. [41], Rosko and Mutter [42], we add the total revenue as an output of hospitals. As the contextual setting part indicates, after years of medical reforms during the period of 2002–2013, the hospitals in China began to rely more on market and revenue collected from the medical services rather than the government subsidies. For most provinces of China, the proportion of the government subsidies in the total revenue is less than 16% at present. Comparing to our estimation of overall technical efficiency scores, the results of Hu et al. [14] has much higher values (The Tibet’s efficiency score had not been estimated for missing data in Hu et al. [14]), implying an overestimated technical efficiency performance. However, our results and the results of Hu et al. [14] shows similar patterns for different provinces, for example, the technical efficiency scores of Shanghai, Beijing and Guangdong were also much higher than other provinces in Hu et al. [14].

6.2. Discussion on Determinants of Sustainability Technical Efficiency for Chinese Hospitals

As the coefficients of GDP per capita and population density are all positive, it implies that when the economic development and population density is higher, there will be more demands for medical services, and the overall technical efficiency will be pushed to a higher level. This is also confirmed by the facts that hospitals in Beijing, Shanghai and Guangdong display better performance.
Public subsidies may increase the hospitals’ budget for more professional personnel and advanced equipment, as well as induce moral hazard or shirking behavior. Our results indicate that pubic subsidies to hospitals are an incentive to induce moral hazards rather than improve on technical efficiency. In contrast, Hu et al. [14] argued that the government subsidy has ambiguous and insignificant effects on the Chinese hospital efficiency.
The 3A class hospital proportion has positive but not significant effects on Chinese hospital’s technical efficiency, suggesting its limited influences on the performance of Chinese hospitals. The supervising authorities will grade the hospitals according to several standards every three years. Hence, the 3A hospital rating is also a signal for great technology advantage and high quality of medical service. However, without a sound pre-triage system, the 3A hospitals just attract crowded patients for signals and take advantage of the monopoly power in the medical market. Therefore, the net effects are ambiguous and the coefficient of variable “best” is not significant despite it is still positive.
The social medical insurance reforms have a positive influence on the overall technical efficiency of Chinese hospitals, which is consistent with the empirical results of Hu et al. [14]. The medical insurance reforms of the NRCMS and BSMIP has increase the opportunity of the poor to acquire the medical service, namely the government subsidy people to get the basic medical service and therefore increasing the demand for medical service as well as the output of the hospitals. Wagstaff and Lindelow [61] and Wagstaff et al. [62] also witnessed the increase in the medical service utilization after the reform. Moreover, as the column (1) in Table 2 indicates, the absolute value of the coefficients of Reform1 is much larger than the Reform2. It implies that the coverage of social medical insurance in the rural is more effectively lower the cost of Chinese hospitals than that in the urban.
Reform was first initiated in eastern provinces of China, which may enhance the management and incentives in the medical care industry through deregulation. Moreover, the eastern area is much richer and more developed than western and central area of China [63]. The more favorable environment and diversified medical demand of people will drive the hospitals to be more efficient. However, most private hospitals in China were also set up there for deregulation. According to the latest China’s Health and Family Planning Yearbook [40], up to the end of 2013, there are 11,313 private hospitals in China. Therefore, the overall technical efficiency of hospitals may be lowered down mainly for the market share nibbled away by the private hospitals. Therefore, it may be underlying reasons for the insignificancy of variable “area”, despite the results still need further research and tests.
Based on the analysis mentioned above, the policy implications are derived as follows: Firstly, it needs to encourage the development of private hospitals for the government. Meanwhile, the government should cut down the fiscal subsidies on the hospitals and switch from relying on the government to the market. Secondly, a sound pre-triage system is necessary when the pushing the reform of big public hospitals and community-level hospitals. When 3A hospital is evaluated without it, the effects of this monitoring mechanism will be limited. Thirdly, the coverage of medical services should be enlarged, especially for the treatment of critical diseases as well as the essential drugs. Meanwhile, the medical insurance for the rural and urban should be unified an integrated to offer people equal insurance for basic medical service. The present medical insurance in China is in a high degree of fragmentation for different provinces or counties. Finally, the government needs to pursue different policies to improve the technical efficiency of Chinese hospitals for the province with higher GDP per capital and population density having better performance.
As this empirical study just focuses on the Chinese hospitals with province-level data, the further research could try to collect and utilize the hospital-level data to check the robustness of the conclusions and provide more policy implications. Meanwhile, a comparative study can be conducted on the technical efficiency of China, Korea, Japan, etc. Such a benchmarking comparison among the Northeast Asian countries could provide much more comprehensive implications. Moreover, some scholars argue that it should adopt alternative methods to analyze the determinants of technical efficiency of Chinese hospitals. Therefore, we plan to use double-bootstrapped truncated regression [64] and the conditional nonparametric approach [65] to replace the present Tobit model in the second stage and try to check the robustness of results in this paper.

7. Conclusions

In the background of the New Normal, which does not had a clear definition at present and usually refers to a significant regime change of economic growth that display an obvious slow-down, it is significant to quantify its technical efficiency in different sectors for China. The medical sector of China has undergone decades of reform, despite still being criticized for the problems of “poor access and high fee”. As a new round of reform are approaching and its critical importance for the welfare of whole society, this study is the first to analyze the technical efficiency of province-level of Chinese hospitals in the period 2002 to 2013 using a new global generalized directional distance function approach taking account of undesirable output. Meanwhile, this research fills the gap in the literature on the hospital’s technical efficiency in different area of China.
This study shows that the technical efficiency of Chinese hospitals has been improved with time trend. However, most Chinese provinces still do not perform well and have large potentials to improve. Meanwhile, some factors improve the technical efficiency of Chinese hospitals, including economic development, population density and social medical insurance reforms. In contrast, the government subsidies to hospitals reduce the technical efficiency of Chinese hospitals. The proportion of 3A hospitals display limited positive effects on the technical efficiency of Chinese hospitals. These indicate that not all the medical reforms have successfully raised the hospital efficiency in China, and leave clues for future reform.
The present research offers a comprehensive evaluation of Chinese hospitals. This study also proposes suggestions for further medical reform in China. China is the largest Northeast Asian country. The research may shed lights on medical reforms or hospital management in other Northeast Asian countries for the similar culture and contiguity to each other, for example, the medical insurance as well as the government subsidies on public hospitals. Moreover, China has played a significantly important role in the Northeast Asian area. It has the largest land area, population and GDP. The reform and improvement on the technical efficiency for the Chinese medical system will promote the overall welfare in this region as well as boost the economic integration in the medical sector.

Acknowledgments

We thank the financial support provided by the National Science Foundation of China (41461118), Humanities and Social Science Fund of Jiangxi (JJ1420), Philosophy and Social Science fund of Jiangxi (15SKJD21) and the China Postdoctoral Foundation (2014M551849, 2014KY55).

Author Contributions

Kejia Chu designed research; Ning Zhang performed research and analyzed the data; Ning Zhang and Zhongfei Chen wrote and revised the paper. All authors read and approved the final manuscript.

Conflicts of Interest

The authors declare no conflict of interest.

References

  1. State Council DRC Research Project. Assessment of China’s medical and health system reform and suggestions. China Health Policy 2005, 9, 4–7. [Google Scholar]
  2. Flaherty, J.H.; Liu, M.L.; Ding, L.; Dong, B.; Ding, Q.; Li, X.; Xiao, S. China: The aging giant. J. Am. Geriatr. Soc. 2007, 55, 1295–1300. [Google Scholar] [CrossRef] [PubMed]
  3. World Bank. World Development Report 2007: Development and the Next Generation; World Bank Publications: Washington, DC, USA, 2006. [Google Scholar]
  4. Arah, O.A.; Klazinga, N.S.; Delnoij, D.M.J.; Ten Asbroek, A.H.A.; Custers, T. Conceptual frameworks for health systems performance: A quest for effectiveness, quality, and improvement. Int. J. Qual. Health Care 2003, 15, 377–398. [Google Scholar] [CrossRef] [PubMed]
  5. Fukuyama, H.; Shiraz, R.K. Cost-effectiveness measures on convex and nonconvex technologies. Eur. J. Oper. Res. 2015, 246, 307–319. [Google Scholar] [CrossRef]
  6. Jacobs, R. Alternative methods to examine hospital efficiency: Data envelopment analysis and stochastic frontier analysis. Health Care Manag. Sci. 2001, 4, 103–115. [Google Scholar] [CrossRef] [PubMed]
  7. Docherty, P.; Kira, M.; Shani, A.R. Creating Sustainable Work Systems (2nd Ed): Developing Social Sustainability; Routledge: London, UK, 2008. [Google Scholar]
  8. Rosenberg-Yunger, Z.R.; Daar, A.S.; Singer, P.A.; Martin, D.K. Healthcare sustainability and the challenges of innovation to biopharmaceuticals in Canada. Health Policy 2008, 87, 359–368. [Google Scholar] [CrossRef] [PubMed]
  9. Magnussen, J. Efficiency measurement and the operationalization of hospital production. Health Serv. Res. 1996, 31, 21–37. [Google Scholar] [PubMed]
  10. Li, H.; Dong, S.; Liu, T. Relative efficiency and productivity: A preliminary exploration of public hospitals in Beijing, China. BMC Health Serv. Res. 2014. [Google Scholar] [CrossRef] [PubMed]
  11. Hollingsworth, B. The measurement of efficiency and productivity of health care delivery. Health Econ. 2008, 17, 1107–1128. [Google Scholar] [CrossRef] [PubMed]
  12. Hwang, J.; Akdede, S.H. The influence of governance on public sector efficiency: A cross-country analysis. Soc. Sci. J. 2011, 48, 735–738. [Google Scholar] [CrossRef]
  13. Ng, Y.C. The productive efficiency of Chinese hospitals. China Econ. Rev. 2011, 22, 428–439. [Google Scholar] [CrossRef]
  14. Hu, H.H.; Qi, Q.; Yang, C.H. Analysis of hospital technical efficiency in China: Effect of health insurance reform. China Econ. Rev. 2012, 23, 865–877. [Google Scholar] [CrossRef]
  15. Barros, C.P.; de Menezes, A.G.; Vieira, J.C. Measurement of hospital efficiency, using a latent class stochastic frontier model. Appl. Econ. 2013, 45, 47–54. [Google Scholar] [CrossRef]
  16. Barros, C.P.; de Menezes, A.G.; Peypoch, N.; Solonandrasana, B.; Vieira, J.C. An analysis of hospital efficiency and productivity growth using the Luenberger indicator. Health Care Manag. Sci. 2008, 11, 373–381. [Google Scholar] [CrossRef] [PubMed]
  17. Hsu, Y.C. The efficiency of government spending on health: Evidence from Europe and Central Asia. Soc. Sci. J. 2013, 50, 665–673. [Google Scholar] [CrossRef]
  18. Zhang, N.; Choi, Y. A note on the evolution of directional distance function and its development in energy and environmental studies 1997–2013. Renew. Sustain. Energy Rev. 2014, 33, 50–59. [Google Scholar] [CrossRef]
  19. Yu, Y.; Choi, Y.; Zhang, N. Strategic corporate sustainability performance of Chinese state-owned listed firms: A meta-frontier generalized directional distance function approach. Soc. Sci. J. 2014, 52, 300–310. [Google Scholar] [CrossRef]
  20. Zhang, N.; Kong, F.; Choi, Y. Measuring sustainability performance for China: A sequential generalized directional distance function approach. Econ. Model. 2014, 41, 392–397. [Google Scholar] [CrossRef]
  21. Chung, Y.H.; Färe, R.; Grosskopf, S. Productivity and undesirable outputs: A directional distance function approach. J. Environ. Manag. 1997, 51, 229–240. [Google Scholar] [CrossRef]
  22. Chambers, R.G.; Chung, Y.; Färe, R. Benefit and distance functions. J. Econ. Theory 1996, 70, 407–419. [Google Scholar] [CrossRef]
  23. Chambers, R.G.; Chung, Y.; Färe, R. Profit, directional distance functions, and Nerlovian efficiency. J. Optimiz. Theory Appl. 1998, 98, 351–364. [Google Scholar] [CrossRef]
  24. Fukuyama, H.; Weber, W.L. A directional slacks-based measure of technical inefficiency. Socio-Econ. Plan. Sci. 2009, 43, 274–287. [Google Scholar] [CrossRef]
  25. Färe, R.; Grosskopf, S. Directional distance functions and slacks-based measures of efficiency. Eur. J. Oper. Res. 2010, 200, 320–322. [Google Scholar] [CrossRef]
  26. Färe, R.; Grosskopf, S. Directional distance functions and slacks-based measures of efficiency: Some clarifications. Eur. J. Oper. Res. 2010, 206, 702. [Google Scholar] [CrossRef]
  27. Zhang, N.; Zhou, P.; Choi, Y. Energy efficiency, CO2 emission performance and technology gaps in fossil fuel electricity generation in Korea: A meta-frontier non-radial directional distance functionanalysis. Energy Policy 2013, 56, 653–662. [Google Scholar] [CrossRef]
  28. Mei, G.; Gan, J.; Zhang, N. Metafrontier environmental efficiency for China’s regions: A slack-based efficiency measure. Sustainability 2015, 7, 4004–4021. [Google Scholar] [CrossRef]
  29. Zhou, P.; Ang, B.W.; Wang, H. Energy and CO2 emission performance in electricity generation: A non-radial directional distance function approach. Eur. J. Oper. Res. 2012, 221, 625–635. [Google Scholar] [CrossRef]
  30. Oh, D.H. A global Malmquist-Luenberger productivity index. J. Product. Anal. 2010, 34, 183–197. [Google Scholar] [CrossRef]
  31. Eggleston, K.; Ling, L.; Qingyue, M.; Lindelow, M.; Wagstaff, A. Health service delivery in China: A literature review. Health Econ. 2008, 17, 149–165. [Google Scholar] [CrossRef] [PubMed]
  32. Wagstaff, A.; Yip, W.; Lindelow, M.; Hsiao, W.C. China’s health system and its reform: A review of recent studies. Health Econ. 2009, 18, 7–23. [Google Scholar] [CrossRef] [PubMed]
  33. Hsiao, W.C. The Chinese health care system: Lessons for other nations. Soc. Sci. Med. 1995, 41, 1047–1055. [Google Scholar] [CrossRef]
  34. Dong, W. Health Care Reform in Urban China. Available online: Munkschool.utoronto.ca/cphs/wp-content/uploads/2012/03/Weizhen_Dong-2001-02.pdf (accessed on 8 June 2015).
  35. Audibert, M.; Mathonnat, J.; Pelissier, A.; Huang, X.X.; Ma, A. Health insurance reform and efficiency of township hospitals in rural China: An analysis from survey data. China Econ. Rev. 2013, 27, 326–338. [Google Scholar] [CrossRef]
  36. Dong, K. Medical insurance system evolution in China. China Econ. Rev. 2009, 20, 591–597. [Google Scholar] [CrossRef]
  37. Yip, W.; Hsiao, W. China’s health care reform: A tentative assessment. China Econ. Rev. 2009, 20, 613–619. [Google Scholar] [CrossRef]
  38. World Bank. Fixing the Public Hospital System in China: China Health Policy Notes No.2; World Bank Publications: Washington, DC, USA, 2010. [Google Scholar]
  39. Gu, E.; Zhang, J. Health care regime change in urban China: Unmanaged marketization and reluctant privatization. Pac. Aff. 2006, 79, 49–71. [Google Scholar] [CrossRef]
  40. National Health and Family Planning Commission of the People’s Republic of China. China’s Health and Family Planning Yearbook 2014; Peking Union Medical College Press: Beijing, China, 2015. [Google Scholar]
  41. Koop, G.; Osiewalski, J.; Steel, M.F. Bayesian efficiency analysis through individual effects: Hospital cost frontiers. J. Econom. 1997, 76, 77–105. [Google Scholar] [CrossRef]
  42. Rosko, M.D.; Mutter, R.L. Stochastic frontier analysis of hospital inefficiency: A review of empirical issues and an assessment of robustness. Med. Care Res. Rev. 2008, 65, 131–166. [Google Scholar] [CrossRef] [PubMed]
  43. Varabyova, Y.; Schreyögg, J. International comparisons of the technical efficiency of the hospital sector: Panel data analysis of OECD countries using parametric and non-parametric approaches. Health Policy 2013, 112, 70–79. [Google Scholar] [CrossRef] [PubMed]
  44. Biørn, E.; Hagen, T.P.; Iversen, T.; Magnussen, J. The effect of activity-based financing on hospital efficiency: A panel data analysis of DEA efficiency scores 1992–2000. Health Care Manag. Sci. 2003, 6, 271–283. [Google Scholar] [CrossRef] [PubMed]
  45. Ozcan, Y.A. Sensitivity analysis of hospital efficiency under alternative output/input and peer groups: A review. Knowl. Technol. Policy 1992, 5, 1–29. [Google Scholar] [CrossRef]
  46. Zuckerman, S.; Hadley, J.; Iezzoni, L. Measuring hospital efficiency with frontier cost functions. J. Health Econ. 1994, 13, 255–280. [Google Scholar] [CrossRef]
  47. Xue, Y.; Liang, H.; Wu, X.; Gong, H.; Li, B.; Zhang, Y. Effects of electronic medical record in a Chinese hospital: A time series study. Int. J. Med. Inform. 2012, 81, 683–689. [Google Scholar] [CrossRef] [PubMed]
  48. Ministry of Health of the People’s Republic of China. China’s Health Statistical Yearbook 2003; Peking Union Medical College Press: Beijing, China, 2004.
  49. Ministry of Health of the People’s Republic of China. China’s Health Statistical Yearbook 2004; Peking Union Medical College Press: Beijing, China, 2005.
  50. Ministry of Health of the People’s Republic of China. China’s Health Statistical Yearbook 2005; Peking Union Medical College Press: Beijing, China, 2006.
  51. Ministry of Health of the People’s Republic of China. China’s Health Statistical Yearbook 2006; Peking Union Medical College Press: Beijing, China, 2007.
  52. Ministry of Health of the People’s Republic of China. China’s Health Statistical Yearbook 2007; Peking Union Medical College Press: Beijing, China, 2008.
  53. Ministry of Health of the People’s Republic of China. China’s Health Statistical Yearbook 2008; Peking Union Medical College Press: Beijing, China, 2009.
  54. Ministry of Health of the People’s Republic of China. China’s Health Statistical Yearbook 2009; Peking Union Medical College Press: Beijing, China, 2010.
  55. Ministry of Health of the People’s Republic of China. China’s Health Statistical Yearbook 2010; Peking Union Medical College Press: Beijing, China, 2011.
  56. Ministry of Health of the People’s Republic of China. China’s Health Statistical Yearbook 2011; Peking Union Medical College Press: Beijing, China, 2012.
  57. Ministry of Health of the People’s Republic of China. China’s Health Statistical Yearbook 2012; Peking Union Medical College Press: Beijing, China, 2013.
  58. Ministry of Health of the People’s Republic of China. China’s Health Statistical Yearbook 2013; Peking Union Medical College Press: Beijing, China, 2014.
  59. Araújo, C.; Barros, C.P.; Wanke, P. Efficiency determinants and capacity issues in Brazilian for-profit hospitals. Health Care Manag. Sci. 2014, 17, 126–138. [Google Scholar] [CrossRef] [PubMed]
  60. Dutta, A.; Bandyopadhyay, S.; Ghose, A. Measurement and determinants of public hospital efficiency in West Bengal, India. J. Asian Public Policy 2014, 7, 231–244. [Google Scholar] [CrossRef]
  61. Wagstaff, A.; Lindelow, M. Can insurance increase financial risk? The curious case of health insurance in China. J. Health Econ. 2008, 27, 990–1005. [Google Scholar] [CrossRef] [PubMed]
  62. Wagstaff, A.; Lindelow, M.; Jun, G.; Ling, X.; Juncheng, Q. Extending health insurance to the rural population: An impact evaluation of China’s new cooperative medical scheme. J. Health Econ. 2009, 28, 1–19. [Google Scholar] [CrossRef] [PubMed]
  63. Jian, T.; Sachs, J.D.; Warner, A.M. Trends in regional inequality in China. China Econ. Rev. 1996, 7, 1–21. [Google Scholar] [CrossRef]
  64. Simar, L.; Wilson, P.W. Estimation and inference in two-stage, semi-parametric models of production processes. J. Econom. 2007, 136, 31–64. [Google Scholar] [CrossRef]
  65. Bădin, L.; Daraio, C.; Simar, L. Optimal bandwidth selection for conditional efficiency measures: A data-driven approach. Eur. J. Oper. Res. 2010, 201, 633–640. [Google Scholar] [CrossRef]

