


Association between EQ-5D-3L population norms and gross domestic product based on purchasing power parity in European countries
-
Copyright
© 2016 PRO MEDICINA Foundation, Published by PRO MEDICINA Foundation
User License
The journal provides published content under the terms of the Creative Commons 4.0 Attribution-International Non-Commercial Use (CC BY-NC 4.0) license.
Authors
| Name | Affiliation | |
|---|---|---|
Malwina Holownia |
Department of Experimental and Clinical Pharmacology, Medical University of Warsaw
|
|
Dominik Golicki |
Department of Experimental and Clinical Pharmacology, Medical University of Warsaw
|
Abstract
Background
One of the of health-related quality of life (HRQoL) measurement methods is the EQ-5D questionnaire. Population norms of the EQ-5D can be used to compare profiles for patients with specific conditions with data for the general population or to compare countries to each other. The aim of this review is to see whether the gross domestic product based on purchasing-power-parity (GDP PPP) per capita influence the HRQoL, measured by EQ-5D-3L questionnaire in Europe.
Methods
We have searched the databases in order to identify population norms based on EQ-5D-3L from European countries and extracted data of EQ-VAS and percentage of patients with no problems in all five dimensions of the EQ-5D and compared it to GDP PPP per capita, based on 2015 International Monetary Fund data.
Results
Population norms from 16 countries were found: Belgium, Denmark, Finland, France, Germany, Greece, Hungary, Italy, Netherlands, Poland, Portugal, Slovenia, Spain, Sweden Switzerland and the United Kingdom. Subjective HRQoL measured by the EQ-VAS and anxiety and depression dimension were strongly correlated with GDP PPP (R²=0.66 and 0.53, respectively), while the mobility and usual daily activities dimensions were weakly correlated (R²=0.41 and 0.29, respectively). There was no association between self-care, nor pain/discomfort dimensions and GDP PPP per capita (R² = 0.02 and 0.01, respectively).
Conclusion
There is a strong correlation of subjective HRQoL measured by the EQ-VAS and anxiety and depression dimension with GDP PPP. There are only 3 CEE countries and only one former USSR country with published population norms for the EQ-5D questionnaire.
Introduction
Health-related quality of life
The main goal of health care in any country is to maintain or improve the quality of life of its citizens. One of the components of quality of life is health-related quality of life (HRQoL), which is defined as an individual's or a group's perceived physical and mental health over time.[1]
In an attempt to systematize the instruments used to measure the health-related quality of life, one could divide them into general and specific ones. Questionnaires from the first group aim to obtain an overall picture of HRQoL. Generic questionnaires are constructed for a wide audience and enable conducting the comparison of quality of life in remote clinical populations (e.g. patients with multiple sclerosis or diabetes mellitus). As they are composed to minimize the risk of not noticing changes in the area, where such changes are not expected, they, usually, have a wide range of measurement. On the other hand, generic instruments provide a low sensitivity and certain inadequacy in relation to the current health problem, which can result in resistance of respondents during polling. The results are used in health technology assessment to conduct pharmacoeconomic analyses and precisely – to estimate quality-adjusted life years (QALY) in the cost-utility analyses. One of the examples of health profiles is the EQ-5D questionnaire.[2]
Most of HRQoL instruments are developed in English, and its application to the non-English speaking population, which is the majority of Europe population, requires careful translation and cross-cultural validation. There is a need to evaluate whether the content, concept, construct and scoring method of an instrument are valid and whether it is acceptable to the population of the study.[2]
EQ-5D
EQ-5D was first introduced in 1990 by the EuroQol Group that was initially formed in 1987 with the researchers of multidisciplinary areas from five European countries: the Netherlands, the United Kingdom, Sweden, Finland, and Norway. They have developed a standardized instrument not specific to a disease. The questionnaire was meant to be: capable of being sent as a postal questionnaire for self-completion, easy to complete, applicable to everyone that can produce a single index value, and capable of taking into account the health status ‘worse than dead’.[3] EQ-5D consists of two pages – the EQ-5D descriptive system and the EQ VAS. The EQ-5D descriptive system has five dimensions: mobility, self-care, usual activities, pain/discomfort and anxiety/depression. The EQ-5D is available in three- and five-level response options, EQ-5D-3L and EQ-5D-5L, respectively, and a youth version, EQ-5D-Y. In February 2017, there were 172 self-complete official language versions of EQ-5D-3L. Each dimension in EQ-5D-3L has three levels: no problems, some problems, severe problems/unable to. The respondent indicates his/her health state by marking in the box against the most suitable statement in every dimension. The result of this part is a 5-digit number describing the respondent’s health state. The second part of the questionnaire, EQ VAS, is a self-rated visual analogue scale, ranging from 1 to 100, where the endpoints are ‘Worst imaginable health state’ and ‘Best imaginable health state’, accordingly. Because of the five dimensions and three responses to them, there are 243 possible health states defined by the EQ-5D-3L questionnaire. While the EQ-5D index values (and QALYs based on it) are often used in economic evaluation to inform priority setting in health care, the EQ-5D index values are also useful as single index measures in clinical studies as well as in population health surveys.[4]
Population norms
The EuroQol Group is frequently asked to provide EQ-5D population norms for a specific country or region. Population norms can be used to compare profiles for patients with specific conditions with data for the average person in the general population in a similar age and/or gender group. Apart of that, the burden of disease in question can be compared to the general population’s health.[4]
Quality of life
The aim of this review of population norms measured by EQ-5D-3L in Europe is to see whether the Gross domestic product (GDP) per capita influence the health-related quality of life, measured by EQ-5D-3L questionnaire in Europe.
Materials and methods
We have searched the EuroQol Group, PubMed, and EMBASE databases in order to identify population norms based on EQ-5D-3L from European countries. We used keywords “population norms” and “EQ-5D”. No time filter was applied. Studies were included, if original three-level version of EQ-5D was used and authors stated, that the study was representative of the whole country. If more than one population norms studies were available, we have chosen the newest one or the more representative version and excluded the other ones. Only studies published in full text were included.
We have extracted data concerning EQ-VAS and percent of patients that have marked no problems in all five domains of the EQ-5D questionnaire and compared it to gross domestic product based on purchasing-power-parity (GDP PPP) per capita in the current international dollar (2015 International Monetary Fund data [5]). We have used GDP based on PPP, because purchasing-power-parity helps to minimize misleading international comparisons that can arise with the use of market exchange rates. We have also estimated linear correlation coefficient of such a comparison and interpreted it as follows: R²≥0.5 - strong relationship, R²<0.5 - weak relationship.
Results
We have performed the search up to February 2017. Population norms from following sixteen European countries were found: Belgium [6], Denmark [7], Finland [8], France [6], Germany [6], Greece [9], Hungary [10], Italy [11], Netherlands [6], Poland [12], Portugal [13], Slovenia [14], Spain [6], Sweden [15], Switzerland [16] and United Kingdom [17]. One of them is a non-EU member (Switzerland [16]), three of the countries have joined EU in 2004 (Hungary, Slovenia, Poland). It should be noticed, that the studies were conducted from 1993 (United Kingdom [17]), to 2014 (Poland [12]), which could also influence the results of their comparison. As well the studies were different in terms of number of respondents, from 1005 (Greece [9]) to 16 861 (Denmark [7]). Percentage of females out of studies’ respondents varied from 51% to 57%. Characteristics of the studies are presented in Table 1.
Table 1. Number of respondents to EQ-5D-3L population norms study.
|
Country |
Number of respondents |
Percent of females |
Data collection period |
|
Belgium |
2411 |
51% |
2001-2003 |
|
Denmark |
16 861 |
53% |
2000-2001 |
|
Finland |
8028 |
55% |
2000 |
|
France |
2892 |
54% |
2001-2003 |
|
Germany |
3552 |
53% |
2001-2003 |
|
Greece |
1005 |
52% |
2009 |
|
Hungary |
5503 |
55% |
2000 |
|
Italy |
6800 |
52% |
2013 |
|
Netherlands |
2367 |
56% |
2001-2003 |
|
Poland |
3941 |
53% |
2014 |
|
Portugal |
1500 |
53% |
2012 |
|
Slovenia |
742 |
56% |
2000 |
|
Spain |
5473 |
56% |
2001-2003 |
|
Sweden |
534 |
51% |
1994 |
|
Switzerland |
1952 |
56% |
2007 |
|
United Kingdom |
3395 |
57% |
1993 |
In the comparison we have used EQ-5D-3L and EQ VAS data. Not in every study that we have found had EQ-VAS values, so we have excluded Finland and Switzerland from the comparison presented in Figure 1.
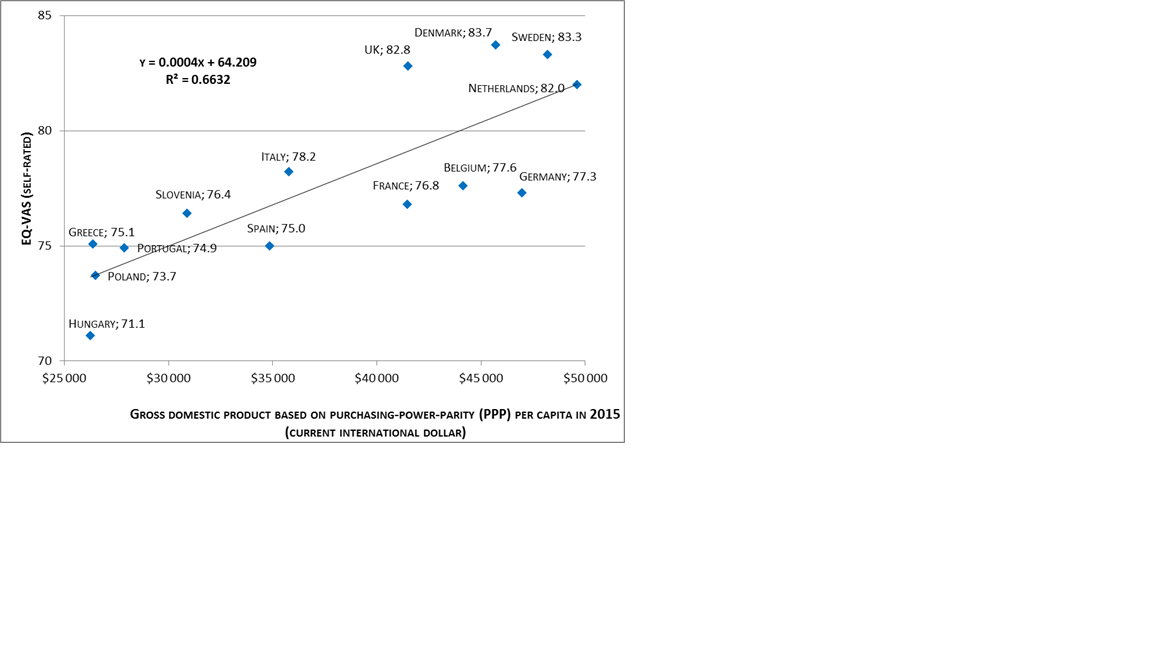
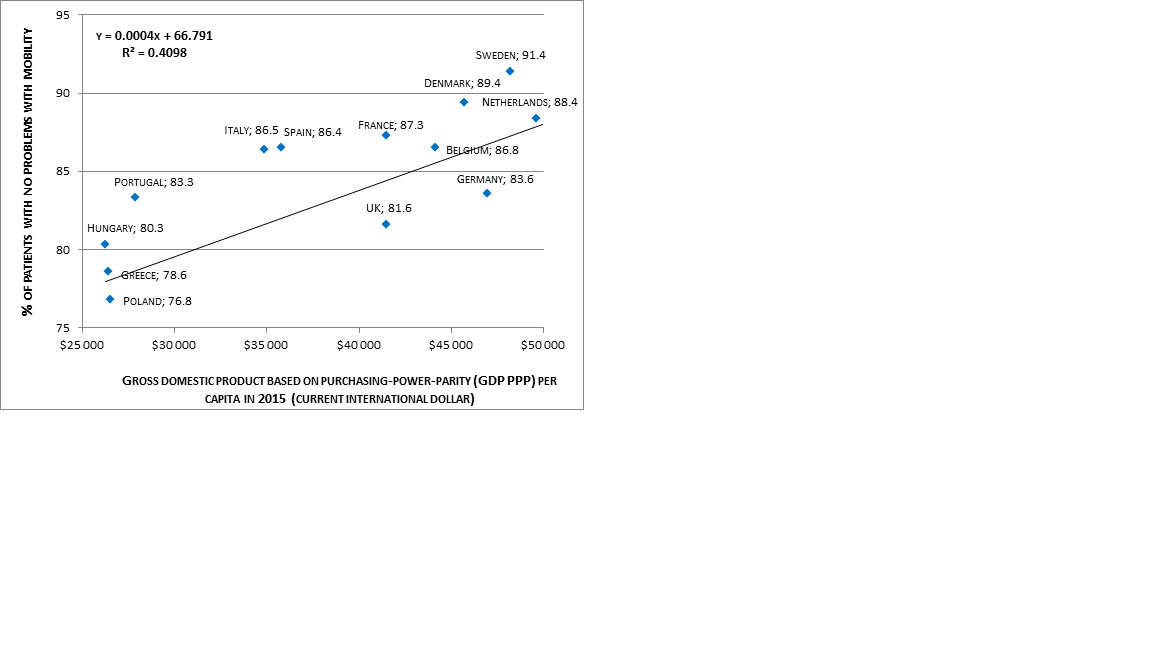
Figure 2. Comparison of percent of patients with no problems with mobility with the use of EQ-5D questionnaire and gross domestic product based on purchasing-power-parity (GDP PPP) per capita in 2015 (current international dollar).
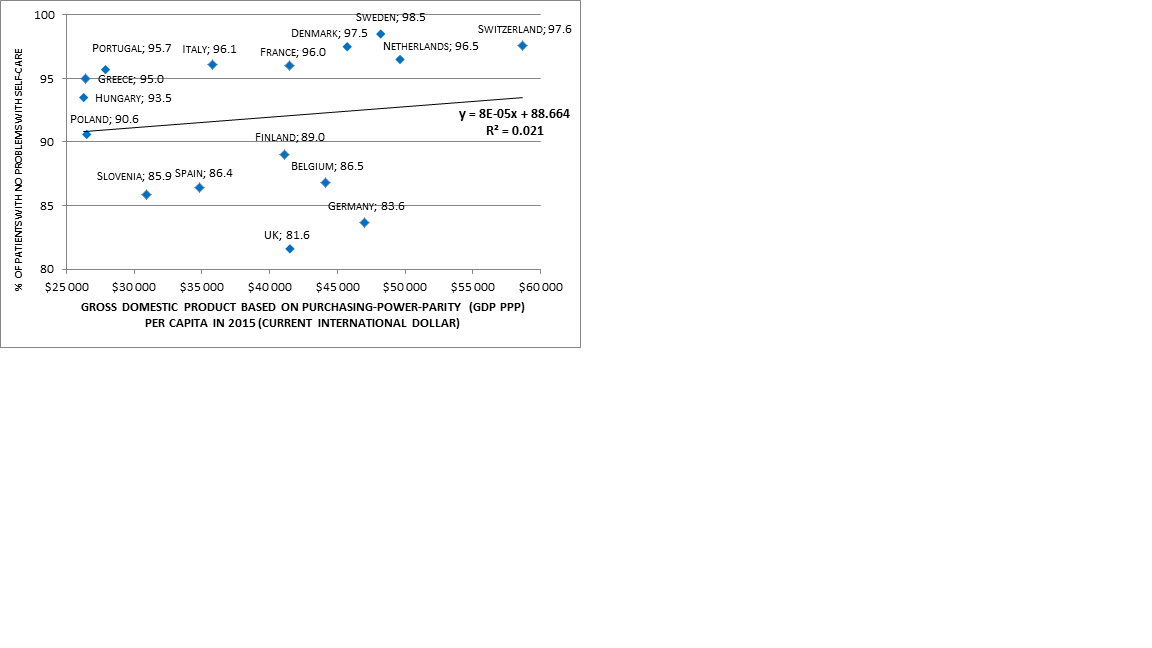
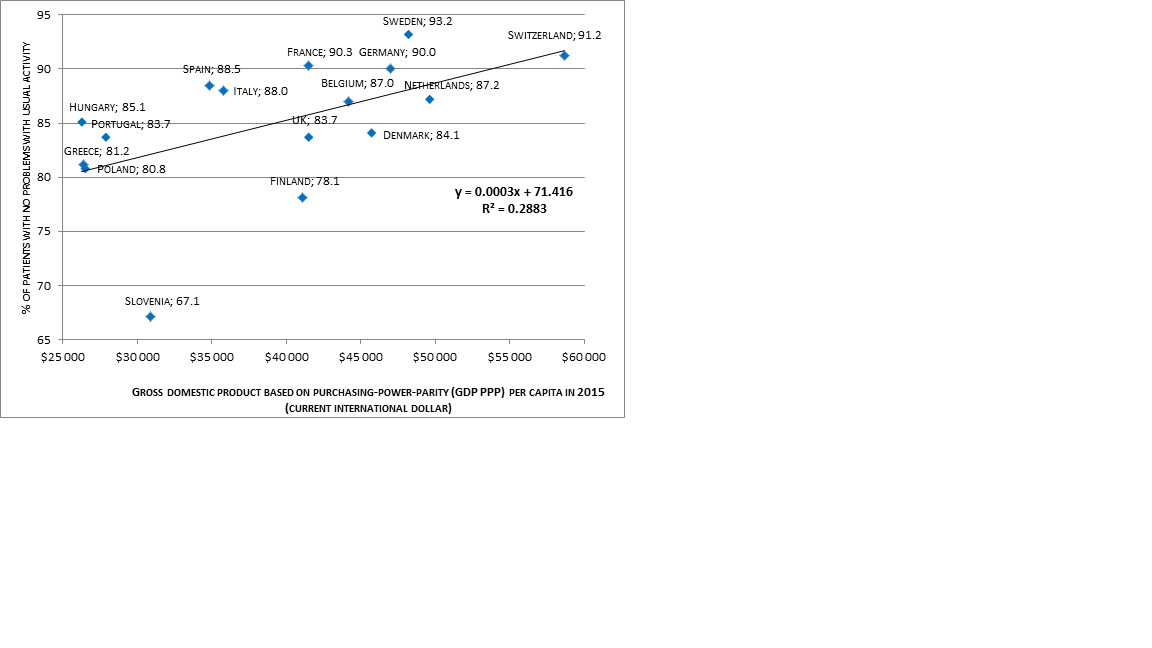
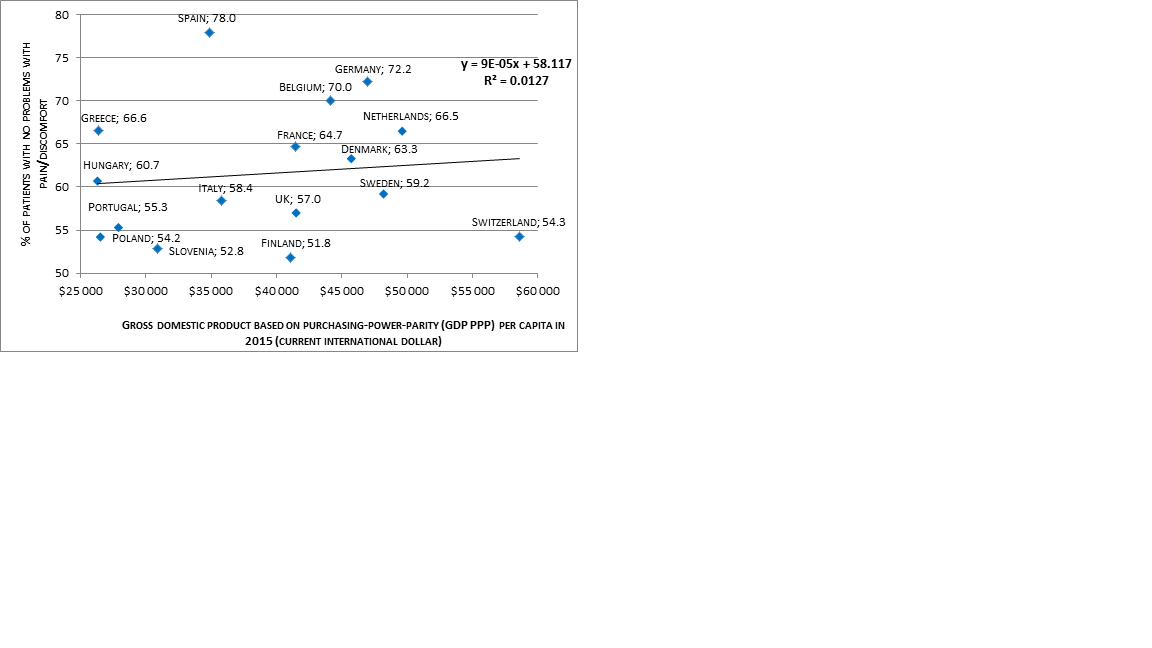
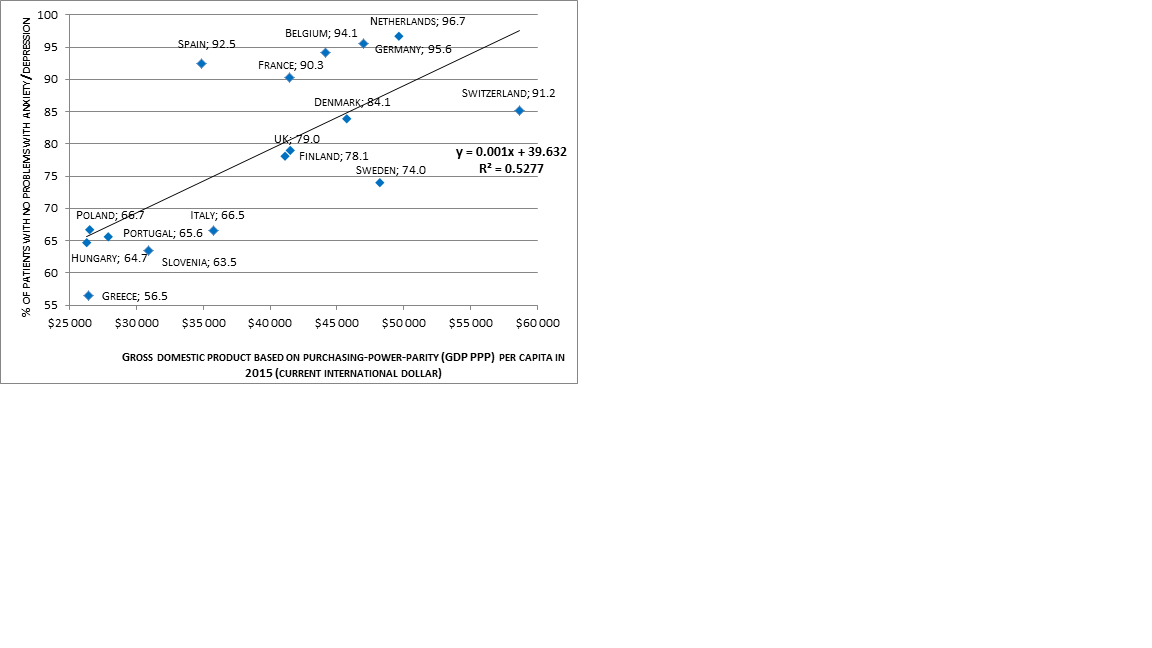
Figure 6. Comparison of percent of patients with no problems with anxiety/depression with the use of EQ-5D questionnaire and gross domestic product based on purchasing-power-parity (GDP PPP) per capita in 2015 (current international dollar).
Subjective quality of life measured by the EQ-VAS and anxiety and depression dimension (AD) were strongly correlated with gross domestic product based on purchasing-power-parity (correlation R² = 0.66 and 0.53, respectively), while the mobility dimension (MO) and the ability to perform usual daily activities (UA) - weakly correlated (R²=0.41 and 0.29, respectively). There was no association between self-care domain (SC), nor pain/discomfort dimension (PD) and economic conditions (R² = 0.02 and 0.01, respectively).
Discussion
We have found population norms from sixteen countries. Gross domestic product based on purchasing-power-parity was strongly correlated with EQ-VAS and anxiety/depression domain. There was no correlation between self-care or pain/discomfort domains and gross domestic product based on purchasing-power-parity.
One limitation of our study is that we have not conducted a formal systematic research. During our search, we have found three more population norms studies’ publications, but we have excluded them because we have found newer publications (Italy [6], Greece [18], Poland [19]). Secondly, we have analyzed data from European developed countries, only. It remains an open question whether analogous dependence could be observed in countries in different continents, cultures or in developing countries.
Comparing to the Agota Szende, Bas Janssen and Juan Cabases’ book “Self-Reported Population Health: An International Perspective based on EQ-5D”[4], published in 2014, we have found five new population norms studies (Greece [9], Italy [11], Portugal [13], Poland [12] and Switzerland [16]).
Apart from that, studies were completed in different time periods - from 1993 in UK [17] to 2014 in Poland [12]. Twenty years of difference could seriously influence the results.
There are forty-eight countries in Europe and we have found population norms for only sixteen of them. Only three countries out of twenty in Central and Eastern Europe have published norms – Hungary [10], Poland [12], and Slovenia [14]. Rates of limitations within pain/discomfort and anxiety/depression dimensions are similar in these countries and low in comparison with the rest of analyzed countries. There is a need for developing population norms for Central and Eastern Europe countries. Out of fifteen post-Soviet countries, only one (Armenia [20]) has published population norms, so the necessity for developing population norms for these countries is especially profound.
Conclusions
1. Subjective perception of health-related quality of life measured by the EQ-VAS and level of limitations within anxiety and depression domain (AD) were strongly dependent on a gross domestic product based on purchasing-power-parity, while the mobility dimension (MO) and the ability to perform usual daily activities (UA) were weakly correlated. There was no correlation between self-care domain (SC) or pain/discomfort (PD) domain and economic conditions.
2. There are only three countries in Central and Eastern Europe and only one former USSR country with published population norms for the EQ-5D questionnaire. Therefore, the great need for developing such normative data should be underlined.
3. There is a huge need to conduct the population studies in some countries, beacuse some of them were conducted almost 25 years ago, and there are lot of countries in Europe, where studies are still in the planning phase.
- Centers for Disease Control and Prevention. [cited 28.02.2017]. Available from: https://www.cdc.gov/hrqol/.
- Golicki D.: Jaki instrument powinienem wybrać do pomiaru jakości życia u pacjenta ze stwardnieniem rozsianym? Przewodnik praktyczny. MS Report. 2013; 2(5): 21-30.
- EuroQol Group. [cited: 28.02.2017]. Available from: http://www.euroqol.org/eq-5d-products/eq-5d-3l/self-complete-version-on-paper.html.
- Szende A., Janssen B., Cabases J. Self-Reported Population Health: An International Perspective based on EQ-5D, Springer, 2014.
- International Monetary Fund. [cited: 28.02.2017]. Available from: http://www.imf.org/external/pubs/ft/weo/2016/02/weodata/weorept.aspx?pr.x=78&pr.y=14&sy=2014&ey=2021&scsm=1&ssd=1&sort=country&ds=.&br=1&c=124%2C138%2C964%2C182%2C128%2C961%2C172%2C132%2C184%2C134%2C174%2C144%2C146%2C944%2C136%2C112&s=PPPPC&grp=0&a=#cs1.
- Konig H., Bernert S., Angermeyer M., Matschinger H., Martinez M., Vilagut G., Haro J.M., de Girolamo G., de Graaf R., Kovess V., Alonso J. Comparison of Population Health Status in Six European Countries Results of a Representative Survey Using the EQ-5D Questionnaire. Medical Care. 2009; 47 (2): 255–261.
- Sørensen J., Davidsen M., Gudex C., Pedersen K.M., Brønnum-Hansen H. Danish EQ-5D population norms. Scandinavian Journal of Public Health.2009 ;37: 467.
- Saarni S.I., Harkanen T., Sintonen H., Suvisaari J., Koskinen S., Aromaa A., Lonnqvist J. The impact of 29 chronic conditions on health-related quality of life: a general population survey in Finland using 15D and EQ-5D. Qual Life Res. 2006; 15:1403–1414
- Kontodimopoulos N., Pappa E., Niakas D., Yfantopoulos J., Dimitrakaki Ch., Tountas Y. Validity of the EuroQoL (EQ-5D) Instrument in a Greek General Population. Value in Health. 2008; 11(7): 1162–1169.
- Szende A., Nemeth R. Health-related quality of life of the Hungarian population. Orv Hetil. 2003; 144(34):1667–1674.
- Scalone L., Cortesi P.A., Ciampichini R., Cesana G., Mantovani L.G. Health Related Quality of Life norm data of the general population in Italy: results using the EQ-5D-3L and EQ-5D-5L instruments. Epidemiology Biostatistics and Public Health. 2015; 12(3): 1-15.
- Golicki D., Niewada M. General population reference values for 3-level EQ-5D (EQ-5D-3L) questionnaire in Poland. Polskie Archiwum Medycyny Wewnętrznej. 2015; 125 (1-2): 18-26.
- Ferreira L.N., Ferreira P.L., Pereira L.N., Oppe M. EQ-5D Portuguese population norms. Quality Life Research. 2014; 23 (2): 425-430.
- Prevolnik Rupel V., Rebolj M. The Slovenian VAS tariff based on valuations of EQ-5D health states from the general population. In: Cabase´s J, Gaminde I (eds) 17th plenary meeting of the EuroQol Group. Discussion papers. Universidad Publica de Navarra. 2001; 11–23.
- Bjork S., Norinder A. The weighting exercise for the Swedish version of the Euroqol. Health Economics. 1999; 8: 117–126.
- Perneger T.V., Combescure Ch., Courvoisier D.S. General Population Reference Values for the French Version of the EuroQol EQ-5D Health Utility Instrument. Value in Health. 2010; 13 (5): 631 - 635
- Kind P., Dolan P., Gudex C., Williams A.Variations in population health status: results from a United Kingdom national questionnaire survey. BMJ. 1998; 316(7133):736–741
- Yfantopoulos Y. Quality of life measurement and health production in Greece. In: Greiner W, Schulenburg J-M. Graf v.d., Piercy J (eds) (EuroQol) Plenary meeting. Discussion papers. Uni-Verlag Witte, Hannover. 1999; 100–114.
- Golicki D., Niewada M., Jakubczyk M., Wrona W., Hermanowski T. Self-assessed health status in Poland: EQ-5D findings from the Polish valuation study. Polskie Archiwum Medycyny Wewnetrznej. 2010; 120(7-8):276-81
- Gharagebakyan T., Ghukasyan H., Williams A., Szende A. Social inequalities in self-reported health: is Armenia different from Slovenia? In: Rupel VP (ed) 20th plenary meeting of the EuroQol Group. Discussion papers. Republic of Slovenia, Ministry of Health. 2003; 79–87

