Addressing shortfalls of laboratory HbA1c using a model that incorporates red cell lifespan
- Abbott Diabetes Care, United States
- International Diabetes Center, Park Nicollet, HealthPartners, United States
- Leeds Institute of Cardiovascular and Metabolic Medicine, University of Leeds, United Kingdom
Abstract
Laboratory HbA1c does not always predict diabetes complications and our aim was to establish a glycaemic measure that better reflects intracellular glucose exposure in organs susceptible to complications. Six months of continuous glucose monitoring data and concurrent laboratory HbA1c were evaluated from 51 type 1 diabetes (T1D) and 80 type 2 diabetes (T2D) patients. Red blood cell (RBC) lifespan was estimated using a kinetic model of glucose and HbA1c, allowing the calculation of person-specific adjusted HbA1c (aHbA1c). Median (IQR) RBC lifespan was 100 (86–102) and 100 (83–101) days in T1D and T2D, respectively. The median (IQR) absolute difference between aHbA1c and laboratory HbA1c was 3.9 (3.0–14.3) mmol/mol [0.4 (0.3–1.3%)] in T1D and 5.3 (4.1–22.5) mmol/mol [0.5 (0.4–2.0%)] in T2D. aHbA1c and laboratory HbA1c showed clinically relevant differences. This suggests that the widely used measurement of HbA1c can underestimate or overestimate diabetes complication risks, which may have future clinical implications.
Introduction
High glucose exposure in specific organs (particularly eye, kidney, and nerve) is a critical factor for the development of diabetes complications (Marcovecchio, 2017; Giacco and Brownlee, 2010). Laboratory HbA1c is routinely used to assess glycaemic control, but studies report a disconnect between this glycaemic marker and diabetes complications in some individuals (Cohen et al., 2003; Bonora and Tuomilehto, 2011). The exact mechanisms for this are not always clear but, at least in some cases, likely related to inaccurate estimation of intracellular glucose exposure in the affected organs.
While raised intracellular glucose is responsible for diabetes complications (Giacco and Brownlee, 2010; Brownlee, 2005), extracellular hyperglycaemia selectively damages cells with limited ability to adjust cross-membrane glucose transport effectively (Brownlee, 2005). HbA1c has been used as a biomarker for diabetes-related intracellular hyperglycaemia for two main reasons. First, the glycation reaction occurs within red blood cells (RBCs) and therefore HbA1c is modulated by intracellular glucose level. Second, RBCs do not have the capacity to adjust glucose transporter GLUT1 levels and thus are unable to modify glucose uptake, behaving similarly to cells that are selectively damaged by extracellular hyperglycaemia (Brownlee, 2005). Therefore, under conditions of fixed RBC lifespan and glucose uptake, HbA1c mirrors intracellular glucose exposure in organs affected by diabetes complications. However, given the inter-individual variability in both glucose uptake and RBC lifespan (Cohen et al., 2008; Khera et al., 2008), laboratory HbA1c may not always reflect intracellular RBC glucose exposure. While variation in RBC glucose uptake is likely relevant to the risk of diabetes complications in susceptible organs, variation in red cell lifespan can affect haemoglobin glycation and HbA1c values, in turn compromising the accuracy of this glycaemic marker in predicting risk of complications. This explains the inability to clinically rely on laboratory HbA1c in those with haematological disorders characterised by abnormal RBC turnover (American Diabetes Association, 2019) and represents a possible explanation for the apparent ‘disconnect’ between laboratory HbA1c and development of complications in some individuals with diabetes (Figure 1).
Figure 1
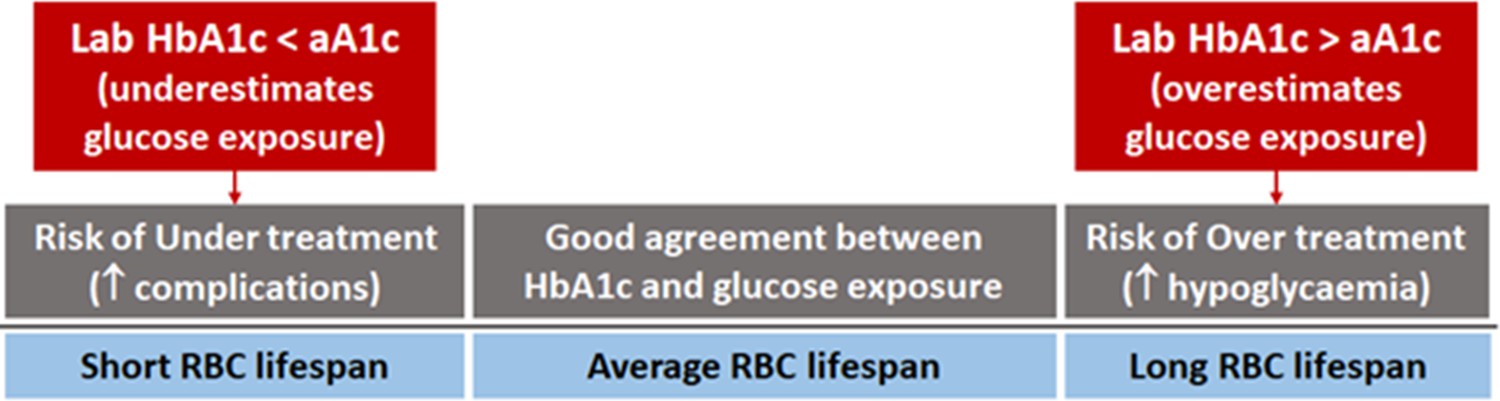
Individual red blood cell (RBC) lifespan can affect HbA1c and diabetes treatment.
In some individuals, laboratory HbA1c can be misleading and resulting in undertreatment, thus increasing the risk of complications, or overtreatment, predisposing to hypoglycaemia.
A kinetic model, which considers individual variations in both RBC turnover and glucose uptake, has been developed to explain the disconcordance of the glucose-HbA1c relationship on individual level (Xu et al., 2021a). The current work aims to extend this model by providing a way to normalise against RBC lifespan variation when individual RBC lifespan becomes available. We propose a new clinical marker, which we term adjusted HbA1c (aHbA1c), by adjusting laboratory HbA1c for a standard RBC lifespan of 106 days (English and Lenters-Westra, 2018) (equivalent to RBC turnover rate of 0.94% per day). The new glyacemic marker, aHbA1c, is likely to be the most accurate marker of organ exposure to hyperglycaemia and risk of future diabetes-related complications.
Results
Of the 287 individuals in the original studies, 218 had predefined continuous glucose monitoring (CGM) coverage between at least two HbA1c measurements. Of these, 131 individuals had adequate continuous glucose data to estimate RBC lifespan and glucose uptake rate. The subject characteristics of this sub-cohort are presented in Table 1.
Table 1
Main characteristics of the cohort studied.
| N | 131 |
|---|---|
| Age [years; mean ± SD (range)] | 53.5 ± 13.7 (18, 77) |
| Gender, male [number (percentage)] | 86 (66%) |
| T1D [number (percentage)]T2D [number (percentage)]BMI [kg/m2; mean ± SD (range)] | 51 (39%)80 (61%)29.8 ± 5.9 (18.8, 54.1) |
| Duration of diabetes (years) | 17.7 ± 8.7 (2, 46) |
| Hypoglycaemic therapy | Multiple daily injections of insulin |
| Data are presented as mean ± SD (min, max) or n (%) | |
Mean (median, IQR) RBC lifespan was 94 (100, 86–102) days in those with T1D and 92 (100, 83–101) in those with T2D (Figure 2). In this cohort, the mean, median, IQR of the absolute difference between aHbA1c and laboratory HbA1c were 11.0, 3.9, 3.0–14.3 mmol/mol (1.0, 0.4, 0.3–1.3%) for T1D, and marginally higher at 15.1, 5.3, 4.1–22.5 mmol/mol (1.4, 0.5, 0.4–2.0%) for T2D subjects. As illustrated in the figure, those with the shorter RBC lifespan of 80 days showed around 22 mmol/mol (2%) lower laboratory HbA1c than aHbA1c. This may lead to underestimating intracellular glucose exposure in susceptible organs, in turn increasing the risk of complications. In contrast, those with RBC lifespan of 130 days demonstrated higher laboratory HbA1c than aHbA1c, which can give the impression of inadequate glycaemic control, leading to therapy escalation and predisposition to hypoglycaemia.
Figure 2
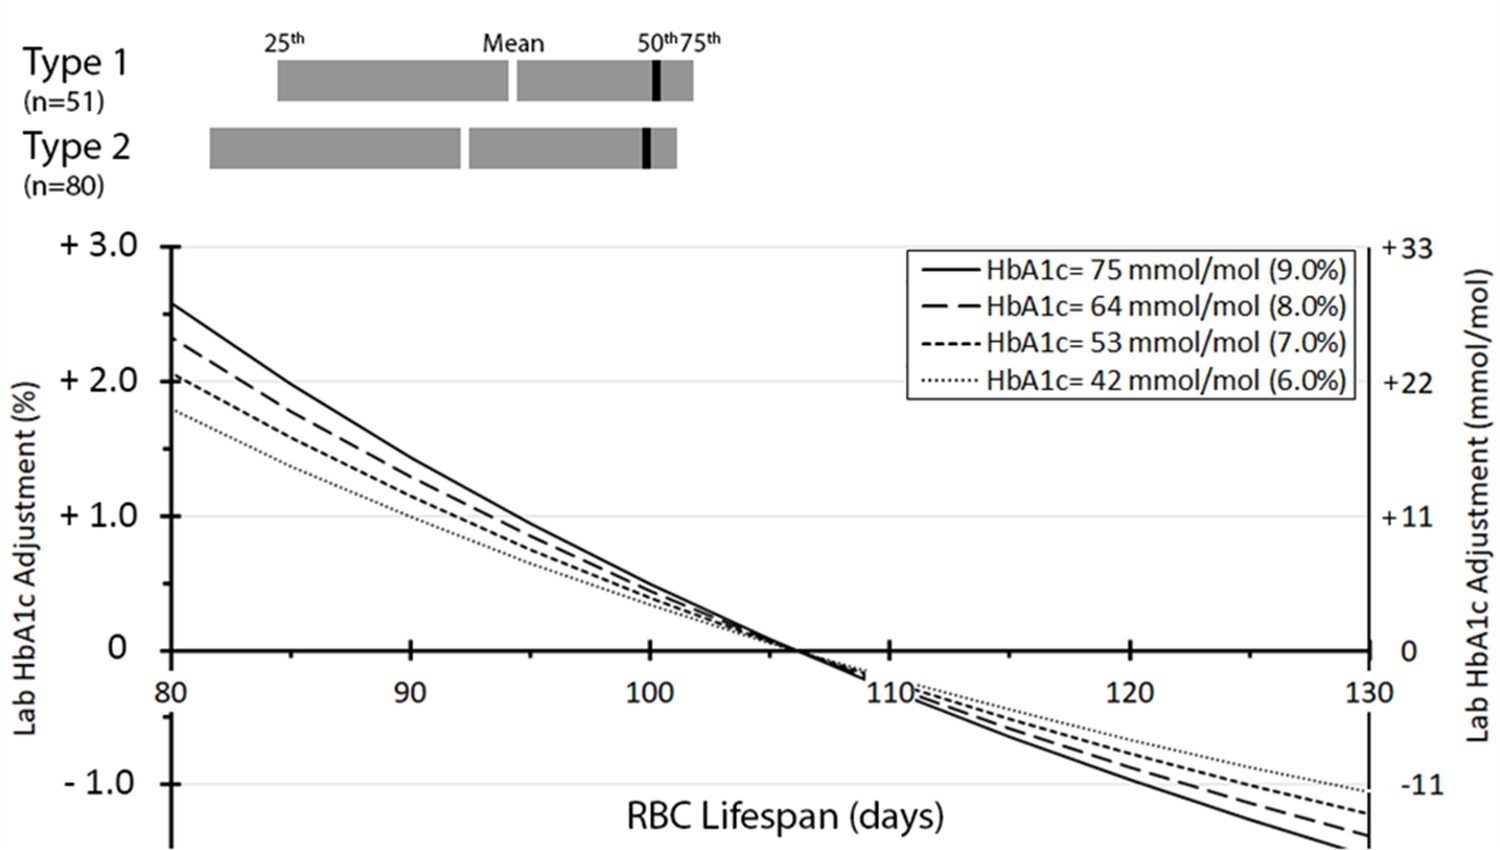
Distribution of red blood cell (RBC) lifespan for type 1 (n = 51) and type 2 (n = 80) diabetes and adjustment to laboratory HbA1c by RBC lifespan.
The number (percentage) of individuals having HbA1c adjustments < 1 % (<11 mmol/mol), 1–2% (11–22 mmol/mol), 2–3% (22–33 mmol/mol), and >3% (>33 mmol/mol) were 90 (68%), 21 (16%), 12 (9%), and 8 (6%), respectively.
To further put these results into clinical context, two subjects with an identical laboratory HbA1c of 63 mmol/mol (7.9%) but different RBC lifespans of 89 and 107 days, would have RBC-lifespan-adjusted aHbA1c values of 78 mmol/mol (9.3%) and 62 mmol/mol (7.8%), respectively, indicating different future risk of diabetes complications. Another two individuals with different laboratory HbA1c of 60 mmol/mol (7.6%) and 75 mmol/mol (9.0%), and corresponding RBC lifespans of 89 and 107 days, would have identical aHbA1c value of 74 mmol/mol (8.9%). This would place them at similar risk of diabetes complications, despite the significantly different laboratory HbA1c values. Generally, in individuals with RBC lifespan of approximately 93–123 days, aHbA1c and laboratory HbA1c showed relatively small differences (<11 mmol/mol or 1% when laboratory HbA1c < 64 mmol/mol or 8%). In this cohort, 90 (69%) subjects were within RBC lifespan range of 93–123 days, while 39 (30%) subjects had RBC lifespan below 93 days and 2 (1.5%) subjects above 123 days.
Discussion
Variation in RBC lifespan and glucose uptake between individuals can lead to different laboratory HbA1c despite similar hyperglycaemic exposure in the organs affected by diabetes complications. In order to individualise care and assess the personal risk of hyperglycaemic complications, laboratory HbA1c levels should be adjusted to account for variability in RBC turnover through our proposed aHbA1c. Without this adjustment, there is a risk of overestimating glucose levels that may cause hypoglycaemia through the unnecessary escalation of diabetes therapies, or alternatively, underestimation that may lead to undertreatment and subsequent high risk of complications. In addition, there are implications for the diagnosis of prediabetes and diabetes, as there may be misclassifications if the diagnosis is based solely on laboratory HbA1c levels due to variable RBC lifespan across individuals.
RBC removal by senescence and erythrocyte apoptosis are complex processes, which can be affected by the presence of hyperglycaemia and known to vary both within and across individuals (Lang et al., 2012). In the meantime, potential differences in RBC glucose uptake (Khera et al., 2008) can also affect the relationship between blood glucose and HbA1c. Several mathematical models (Malka et al., 2016; Fabris et al., 2020) have been developed to estimate laboratory HbA1c from glucose levels or time in range, emphasising the importance of this area. Accurate estimation of ‘clinically relevant HbA1c’ will allow each person with diabetes to have an individualised glycaemic target that ensures adequate treatment, thus reducing the risk of complications while minimising hypoglycaemic risk.
A unique feature of our model (Xu et al., 2021a) is the inclusion of individual-specific RBC lifespan and glycation rate in the calculations. A weakness of this model, however, is the absence of a direct measure of RBC lifespan, which remains an estimate based on a mathematical calculation. However, the ability of the model to reflect laboratory HbA1c, as we have previously shown, indicates a good level of accuracy at estimating RBC lifespan ( Xu et al., 2021c). In addition, the method is far simpler than complex methods for estimating RBC lifespan through labelling experiments that are not suited for routine clinical practice (Cohen et al., 2008). Future work may determine whether other measures, such as reticulocyte count or red cell distribution width (Brodksy, 2021; Kameyama et al., 2018; Kameyama et al., 2020), can further be added to the model to further improve the accuracy of estimating RBC lifespan and this remains an area for future research.
Since aHbA1c reflects intracellular glucose exposure in RBCs, it is difficult to directly compare with extracellular glucose-derived glycaemic markers such as average glucose or time in range. As an intracellular marker, aHbA1c should correlate with intracellular glucose levels, therefore providing a potentially accurate measure of glucose exposure of organs susceptible to diabetes complications. We summarise the advantages and drawbacks of different methods that measure average glucose control in Appendix 1—table 2.
Importantly, our study demonstrates that laboratory HbA1c does not necessarily reflect intracellular glucose exposure of organs prone to diabetes complications. However, future work is required to show that adjusted A1c is a better predictor of diabetes complications than laboratory HbA1c. Moreover, it is unclear whether the use of aHbA1c reduces the risk of hypoglycaemic complications as compared to reliance on laboratory HbA1c, and these remain areas for future research.
In conclusion, quantitative aHbA1c, derived from laboratory HbA1c and CGM readings, has the potential to more accurately assess glycaemic exposure of different organs, providing a safer and more effective glycaemic guide for the management of individuals with diabetes. Future testing in larger populations and different ethnic groups is required to further increase confidence in the model. This to be followed by large prospective clinical studies to test the relationship between aHbA1c and future microvascular/macrovascular diabetes complications as well as reducing the risk of hypoglycaemic exposure through avoidance of unnecessary therapy escalation.
Materials and methods
CGM and laboratory HbA1c data from 139 type 1 (T1D) and 148 type 2 diabetes (T2D) patients, enrolled in two previous European clinical studies (Bolinder et al., 2016; Haak et al., 2017), were evaluated to calculate aHbA1c as detailed below. These studies were designed to evaluate the benefits of CGM in those with T1D and those with T2D using multiple daily injections of insulin. Both studies were conducted after appropriate ethical approval and participants gave written informed consent. A total of 6 months’ CGM data were collected using the sensor-based flash glucose monitoring system (FreeStyle Libre; Abbott Diabetes Care, Witney, UK), while HbA1c was measured by a central laboratory (ICON Laboratories, Dublin, Ireland) at 0, 3, and 6 months of the study. For T1D participants, the mean age was 44 years (range 18–70 years), 17 (33%) of whom were females. For T2D, the mean age was 59 years (range 33–77 years), 28 (35%) of whom were females.
Each subject had at least one data section consisting of two HbA1c measurements connected by CGM data. Since the kinetic parameters are more sensitive to the data sections with larger between-day glucose changes, the parameters were successfully estimated for those individuals with sufficient day-to-day glucose variability, as evidenced by the model fit of RBC life converging between 50 and 180 days. These individual RBC lifespans or turnover rates were calculated according to previous model (Xu et al., 2021a) that considers both RBC turnover rate and glucose uptake. Briefly, the model aligns laboratory HbA1c and the contemporaneous CGM-derived estimate of HbA1c under optimal values for RBC turnover and glucose uptake of each individual. Since there is no simple clinical assay for RBC turnover and glucose uptake, these RBC parameters are estimated using a numerical method such that differences between laboratory HbA1c and CGM-derived estimate are minimized. While the parameter identification method can be performed by repeated permutations across all reasonably possible values for RBC lifespan and uptake, our approach uses a far more efficient and reliable numerical method, as previously described (Xu et al., 2021a). Detailed model description and derivation are provided in Appendix 1. Deriving from the same model, we constructed aHbA1c (Equation 1) that adjusts laboratory HbA1c for individual RBC turnover variation for potential clinical use.
(1)
In an approximation, , where HbA1c is laboratory HbA1c, kage is individual RBC turnover rate (%/day), is standard RBC turnover rate (0.94%/day). HbA1c and aHbA1c are in NGSP unit and decimal values should be used. For example, 8% HbA1c should be applied as 0.08. Equation 1 for IFCC unit is available in Appendix 1.
Under the assumption of individually constant RBC life, the relationship between RBC turnover rate (kage), RBC lifespan (LRBC) and mean RBC age (MARBC) can be inter-converted using the simple formula: . Therefore, 0.94%/day standard RBC turnover rate is equivalent to 106 days of RBC life and 53 days of mean RBC age. Of note, the adjustment is not linear, decreasing RBC lifespan corresponds to more pronounced aHbA1c adjustment than a seemingly comparable increase in RBC lifespan. All calculations in this study were done with Python/SciPy (Virtanen et al., 2020) software package.
Full derivation of the model is further provided in Appendix 1.
Appendix 1
Derivation of Equation (1): kinetic model review
The previously published kinetic model (Xu et al., 2021a) for glucose and HbA1c relationship led to Equation (1), shown in the main text. We further describe here the derivation of the model for the convenience of the reader. We also cover how the model can be used to estimate personal kinetic parameters for RBC glucose uptake and RBC turnover rate.
Our model assumes: (1) first-order dependencies for concentrations of both haemoglobin in RBCs and intracellular glucose; (2) newly generated RBCs have a negligible amount of glycated haemoglobin; (3) RBCs have a fixed life, so that they are generated constantly and eliminated from circulation when they reach an age that is individual-specific.
The rate of change in glycated and non-glycated haemoglobin in RBCs can be modelled by differential equations:
(a1)
(a2)
[HbG] and [Hb] are the concentrations of glycated and non-glycated haemoglobin, respectively, while [GI] is intracellular glucose concentration. The kg is the rate constant of haemoglobin glycation reaction in unit of (concentration*time)–1, with a reported value of about 0.0019 dL/mg/day (Higgins and Bunn, 1981). C is the total haemoglobin concentration C = [Hb] + [HbG]. A1c is the fraction of glycated haemoglobin [HbG]/C, r is RBC removal rate in unit of concentration/time, α is a coefficient used to scale HbA1c to the fraction of glycated haemoglobin to be removed (has no units of measurement).
The glucose transporters on RBC membranes (GLUT1) follows Michaelis-Menten kinetic with a universal KM approximately 26 mM (Ladyzynski et al., 2011). Intracellular glucose can be modelled with , where [G] is the extracellular glucose concentration and kc is the rate of glucose consumption within RBCs. The maximum rate Vmax should be proportional to the GLUT1 level on the membrane and we assume both kc and Vmax can vary between individuals. Since this process is fast, we use the equilibrium condition:
(a3)
where and .
By definition, HbA1c is the fraction of glycated haemoglobin found in RBCs:
In steady state, , Equation (a1) becomes
Combining with Equation (a3):
(a4)
By combining all parameters associated with cross-membrane glucose transport and glycation from the right-hand side of Equation (a4), we define the composite glycation rate constant
, where kg and KM are universal constants for the non-enzymatic haemoglobin glycation reaction and glucose affinity to GLUT1, respectively. Therefore, kgly can vary between individuals depending on kc and Vmax.
We attribute the rest of the parameters to RBC turnover kage = α*r/C, which leads to the definition of the apparent glycation parameter K:
(a5)
Under a hypothetical steady state of constant glucose level, HbA1c should reach an equilibrium level, which is the ‘equilibrium HbA1c’ or EA. Since C=[HbG]+[Hb], Equation (a5) can be re-written to . Applying the definition HbA1c = HbG/C = (C−[Hb])/C, we have:
(a6)
This relationship approximates the average glucose and HbA1c for an individual with a stable day-to-day glucose profile.
From Equation (a3): , and substituting into Equation (a6) gives:
(a7)
Imaging two individuals who have identical intracellular glucose level , one with and the other with reference . The relationship of their equilibrium HbA1c values is:
Again, kg is the universal composite rate constant for glucose haemoglobin composite reaction. Simplifying this equation we have:
In a steady state, is the HbA1c under RBC turnover rate of . The is the HbA1c under the same intracellular glucose level, when RBC turnover rate is a reference value of . Therefore, if we were to compare intracellular glucose exposure, steady-state HbA1c should be adjusted to a reference RBC turnover rate, which lead to the aHbA1c in Equation (a1) by replacing with aHbA1c and with HbA1c:
(1)
To simplify the above, an approximation to Equation (a1) is . Note that , where MRBC is the mean RBC age and LRBC is the RBC lifespan.
The HbA1c and aHbA1c take NGSP unit in decimal form by default. For example, the decimal form of HbA1c of 8% is 0.08. The unit for and should be %/day.
When IFCC unit (mmol/mol) is used for HbA1c and aHbA1c, Equation (a1) becomes:
(2)
Estimations of kgly and kage from glucose and HbA1c data and prospective validation: kinetic model review
Our previous publication (Xu et al., 2021a) gave the following relationship by solving the differential Equation (a1):
(a8)
Equation (a8) is suitable for a short time interval. For a longer time period, a recursive form is required:
(a9)
Equation (a9) describes HbA1c change from time 0 to time z. A1c0 and A1cz are the starting and ending HbA1c values. The time period is split into z time intervals with lengths of ti (i = 1,2,3, …, z), where and , and can be calculated from the average glucose (AG) in the time interval .
The value A1cz is equivalent to calculated HbA1c (cHbA1c) at the end of time interval tz. While shorter time intervals – such as 4–6 hr – are expected to produce better results, we have shown that a time interval of 24 hr has produced acceptable performance (Xu et al., 2021a). Equation (a9) is central to our kinetic model. To estimate personal parameters kgly and kage, one or more data sections are needed, where a data section contains two HbA1c measurements, one at the start of the time period and one at the end, with frequent (i.e. every 15 min) glucose levels in-between. The optimised individual kgly and kage pair should best align the HbA1c and cHbA1c, minimising the preferred error function, such as mean difference or sum-squared difference.
Once an individual’s kgly and kage pair are available, Equation (a9) is used to project future HbA1c if provided frequent glucose measurements. Therefore, prospective model validation is possible when multiple data sections are available, such that one or more can be held out of the parameter estimation to be used for prospective evaluation. Appendix 1—table 1 summarises results (Xu et al., 2021a; Xu et al., 2021c; Xu et al., 2021b) when all but the last data section is used to determine the individual kgly and kage pairs, and the held-out final data section is used for evaluation. The agreement between the last HbA1c and cHbA1c is compared to the agreement between the last HbA1c and the glucose management indicator (GMI) (Xu et al., 2021a; Xu et al., 2021c; Xu et al., 2021b). These studies demonstrated the superior accuracy of the kinetic model compared to the existing GMI method.
Appendix 1—table 1
Summary of kinetic model validation studies.
The mean absolute deviation differences between calculated HbA1c (cHbA1c) and glucose management indicator (GMI) are statically significant with p < 0.0001.
| Study | T1D SAP [22] | DPV T1D [23] | Replace/mpact [9] | ||||
|---|---|---|---|---|---|---|---|
| Country | Japan | Germany | Europe | ||||
| Subject count (male) | 51 (14) | 352 (171) | 120 (79) [TID 54 (37), T2D 66 (42)] | ||||
| Age median (range) | 42 (6–73) | 12.5 (3–19) | 52 (18–77) | ||||
| HbA1c test | Central lab | POC+ central lab | Central lab | ||||
| CGM device | Medtronic | Abbott | Abbott | ||||
| Method | cHbA1c | GMI (14-day AG) | cHbA1c | GMI (14-day AG) | cHbA1c | GMI (14-day AG) | |
| Abs. dev.% (mmol/mol) | Mean | 0.11 (1.2) | 0.47 (5.1) | 0.32 (3.5) | 0.57 (6.2) | 0.31 (3.4) | 0.66 (7.2) |
| SD | 0.06 (0.7) | 0.46 (5.0) | 0.28 (3.0) | 0.55 (6.0) | 0.22 (2.4) | 0.46 (5.0) | |
| Median | 0.10 (1.1) | 0.36 (3.9) | 0.26 (2.8) | 0.46 (5.0) | 0.27 (3.0) | 0.5 (5.5) | |
| Average bias% (mmol/mol) | 0 (0) | –0.3 (–3.3) | 0 (0) | 0.4 (4.4) | 0 (0) | –0.6 (–6.6) | |
| R2 | 0.91 | 0.65 | 0.79 | 0.52 | 0.88 | 0.63 | |
Glycaemic marker comparisons
Given the importance of intracellular glucose level in diabetes management. We provide following table to compare the intracellular aspects of some frequently used glycaemic markers.
Appendix 1—table 2
Main characteristics of markers assessing average glycaemic control.
| Intracellular (I) or extracellular (E) glucose | Affected by mean red blood cell (RBC) lifespan | Advantages | Disadvantages | ||
|---|---|---|---|---|---|
| CGM-derived | Average glucose | E | No |
|
|
| Time in range | |||||
| Average fasting plasma glucose | E | No | |||
| Glycated albumin | E | No |
| ||
| HbA1c | I | Yes |
|
| |
| Adjusted HbA1c | I | No |
|
| |
| Intracellular glucose | I | No |
|
| |
Data availability
Data file for figures have been provided.
References
-
6. Glycemic Targets: Standards of Medical Care in Diabetes-2019Diabetes Care 42:S61–S70.https://doi.org/10.2337/dc19-S006
-
The pros and cons of diagnosing diabetes with A1CDiabetes Care 34:S184–S190.https://doi.org/10.2337/dc11-s216
-
HbA1c method performance: The great success story of global standardizationCritical Reviews in Clinical Laboratory Sciences 55:408–419.https://doi.org/10.1080/10408363.2018.1480591
-
Estimation of Hemoglobin A1c from Continuous Glucose Monitoring Data in Individuals with Type 1 Diabetes: Is Time In Range All We Need?Diabetes Technology & Therapeutics 22:501–508.https://doi.org/10.1089/dia.2020.0236
-
Oxidative stress and diabetic complicationsCirculation Research 107:1058–1070.https://doi.org/10.1161/CIRCRESAHA.110.223545
-
Kinetic analysis of the nonenzymatic glycosylation of hemoglobinJournal of Biological Chemistry 256:5204–5208.https://doi.org/10.1016/S0021-9258(19)69387-7
-
Steady-state relationship between average glucose, HbA1c and RBC lifespanJournal of Theoretical Biology 447:111–117.https://doi.org/10.1016/j.jtbi.2018.03.023
-
Estimation of the hemoglobin glycation rate constantScientific Reports 11:1–6.https://doi.org/10.1038/s41598-020-80024-7
-
Hemoglobin glycation rate constant in non-diabetic individualsAnnals of Biomedical Engineering 39:2721–2734.https://doi.org/10.1007/s10439-011-0366-6
-
Physiology and pathophysiology of eryptosisTransfusion Medicine and Hemotherapy 39:308–314.https://doi.org/10.1159/000342534
-
Complications of acute and chronic hyperglycemiaUS Endocrinology 13:17–21.https://doi.org/10.17925/USE.2017.13.01.17
-
A kinetic model for glucose levels and hemoglobin A1C provides a novel tool for individualized diabetes managementJournal of Diabetes Science and Technology 15:294–302.https://doi.org/10.1177/1932296819897613
Article and author information
Author details
Funding
Abbott Diabetes Care
- Yongjin Xu
- Timothy C Dunn
The funders had no role in study design, data collection and interpretation, or the decision to submit the work for publication.
Acknowledgements
This work was funded by Abbott Diabetes Care.
Ethics
Data were used from two previously published clinical studies in Europe (reference 10 and 11). Both studies were conducted after appropriate ethical approval and participants gave written informed consent.
Version history
- Received: April 15, 2021
- Accepted: August 24, 2021
- Version of Record published: September 13, 2021 (version 1)
- Version of Record updated: October 5, 2021 (version 2)
Copyright
© 2021, Xu et al.
This article is distributed under the terms of the Creative Commons Attribution License, which permits unrestricted use and redistribution provided that the original author and source are credited.
Metrics
-
- 1,292
- views
-
- 155
- downloads
-
- 13
- citations
Views, downloads and citations are aggregated across all versions of this paper published by eLife.
Download links
A two-part list of links to download the article, or parts of the article, in various formats.
Downloads (link to download the article as PDF)
Open citations (links to open the citations from this article in various online reference manager services)
Cite this article (links to download the citations from this article in formats compatible with various reference manager tools)
Addressing shortfalls of laboratory HbA1c using a model that incorporates red cell lifespan
eLife 10:e69456.
https://doi.org/10.7554/eLife.69456
Further reading
-
- Biochemistry and Chemical Biology
- Neuroscience
In most mammals, conspecific chemosensory communication relies on semiochemical release within complex bodily secretions and subsequent stimulus detection by the vomeronasal organ (VNO). Urine, a rich source of ethologically relevant chemosignals, conveys detailed information about sex, social hierarchy, health, and reproductive state, which becomes accessible to a conspecific via vomeronasal sampling. So far, however, numerous aspects of social chemosignaling along the vomeronasal pathway remain unclear. Moreover, since virtually all research on vomeronasal physiology is based on secretions derived from inbred laboratory mice, it remains uncertain whether such stimuli provide a true representation of potentially more relevant cues found in the wild. Here, we combine a robust low-noise VNO activity assay with comparative molecular profiling of sex- and strain-specific mouse urine samples from two inbred laboratory strains as well as from wild mice. With comprehensive molecular portraits of these secretions, VNO activity analysis now enables us to (i) assess whether and, if so, how much sex/strain-selective ‘raw’ chemical information in urine is accessible via vomeronasal sampling; (ii) identify which chemicals exhibit sufficient discriminatory power to signal an animal’s sex, strain, or both; (iii) determine the extent to which wild mouse secretions are unique; and (iv) analyze whether vomeronasal response profiles differ between strains. We report both sex- and, in particular, strain-selective VNO representations of chemical information. Within the urinary ‘secretome’, both volatile compounds and proteins exhibit sufficient discriminative power to provide sex- and strain-specific molecular fingerprints. While total protein amount is substantially enriched in male urine, females secrete a larger variety at overall comparatively low concentrations. Surprisingly, the molecular spectrum of wild mouse urine does not dramatically exceed that of inbred strains. Finally, vomeronasal response profiles differ between C57BL/6 and BALB/c animals, with particularly disparate representations of female semiochemicals.
-
- Biochemistry and Chemical Biology
- Structural Biology and Molecular Biophysics
Invertebrates use the endoribonuclease Dicer to cleave viral dsRNA during antiviral defense, while vertebrates use RIG-I-like Receptors (RLRs), which bind viral dsRNA to trigger an interferon response. While some invertebrate Dicers act alone during antiviral defense, Caenorhabditis elegans Dicer acts in a complex with a dsRNA binding protein called RDE-4, and an RLR ortholog called DRH-1. We used biochemical and structural techniques to provide mechanistic insight into how these proteins function together. We found RDE-4 is important for ATP-independent and ATP-dependent cleavage reactions, while helicase domains of both DCR-1 and DRH-1 contribute to ATP-dependent cleavage. DRH-1 plays the dominant role in ATP hydrolysis, and like mammalian RLRs, has an N-terminal domain that functions in autoinhibition. A cryo-EM structure indicates DRH-1 interacts with DCR-1’s helicase domain, suggesting this interaction relieves autoinhibition. Our study unravels the mechanistic basis of the collaboration between two helicases from typically distinct innate immune defense pathways.


