
Identification, expression and variation of the GNPDA2 gene, and its association with body weight and fatness traits in chicken
- Published
- Accepted
- Received
- Academic Editor
- Scott Edwards
- Subject Areas
- Genetics, Zoology
- Keywords
- GNPDA2, Chicken, Gene expression, Fatness, Association analysis
- Copyright
- © 2016 Ouyang et al.
- Licence
- This is an open access article distributed under the terms of the Creative Commons Attribution License, which permits unrestricted use, distribution, reproduction and adaptation in any medium and for any purpose provided that it is properly attributed. For attribution, the original author(s), title, publication source (PeerJ) and either DOI or URL of the article must be cited.
- Cite this article
- 2016. Identification, expression and variation of the GNPDA2 gene, and its association with body weight and fatness traits in chicken. PeerJ 4:e2129 https://doi.org/10.7717/peerj.2129
Abstract
Background. The GNPDA2 (glucosamine-6-phosphate deaminase 2) gene is a member of Glucosamine-6-phosphate (GlcN6P) deaminase subfamily, which encoded an allosteric enzyme of GlcN6P. Genome-wide association studies (GWAS) have shown that variations of human GNPDA2 are associated with body mass index and obesity risk, but its function and metabolic implications remain to be elucidated.The object of this study was to characterize the gene structure, expression, and biological functions of GNPDA2 in chickens.
Methods. Variant transcripts of chicken GNPDA2 and their expression were investigated using rapid amplification of cDNA ends (RACE) system and real-time quantitative PCR technology. We detected the GNPDA2 expression in hypothalamic, adipose, and liver tissue of Xinghua chickens with fasting and high-glucose-fat diet treatments, and performed association analysis of variations of GNPDA2 with productive traits in chicken. The function of GNPDA2 was further studied by overexpression and small interfering RNA (siRNA) methods in chicken preadipocytes.
Results.Four chicken GNPDA2 transcripts (cGNPDA2-a∼cGNPDA2-d) were identified in this study. The complete transcript GNPDA2-a was predominantly expressed in adipose tissue (subcutaneous fat and abdominal fat), hypothalamus, and duodenum. In fasting chickens, the mRNA level of GNPDA2 was decreased by 58.8% (P < 0.05) in hypothalamus, and returned to normal level after refeeding. Chicken fed a high-glucose-fat diet increased GNPDA2 gene expression about 2-fold higher in adipose tissue (P < 0.05) than that in the control (fed a basal diet), but decreased its expression in hypothalamus. Two single-nucleotide polymorphisms of the GNPDA2 gene were significantly associated with body weight and a number of fatness traits in chicken (P < 0.05).
Conclusion. Our findings indicated that the GNPDA2 gene has a potential role in the regulation of body weight, fat and energy metabolism in chickens.
Introduction
Obesity is a common nutritional disorder and increase risk of several diseases, such as hypertension, cardiovascular disease and type II diabetes (Kopelman, 2000; Flegal et al., 2007; Finkelstein et al., 2008). It becomes a major public health problem because it has dramatically increased worldwide during the past years. Obesity is modulated by environmental and genetic factors. The modern environment contributes to the increasing prevalence of obesity, but genetic factors modulate the susceptibility of each individual (Maes, Neale & Eaves, 1997; Barsh, Farooqi & O’Rahilly, 2000).
The GNPDA2 gene encodes an allosteric enzyme of Glucosamine-6-phosphate deaminase (GlcN6P), which can catalyzes the reversible conversion of D-glucosamine-6-phosphate into D-fructose-6-phosphate and ammonium (Arreola et al., 2003). The GlcN6P enzyme was initially characterized in pig kidney; it has been also identified in a variety of organisms (Leloir & Cardini, 1956). This enzyme was annotated include hydrolase activity and glucosamine-6-phosphate deaminase activity, and related the pathways of metabolism and amino sugar and nucleotide sugar metabolism. The SNP near the human GNPDA2 gene (rs10938397) was first identified to be associated with both body mass index (BMI) and weight in adult of European by GWAS in 2009 (Willer et al., 2009), and then it was confirmed in adult of various populations, including Europeans, Americans, East Asians and Arabians (Hotta et al., 2009; Speliotes et al., 2010; Wen et al., 2012; Gong et al., 2013; Tomei et al., 2015). The variations of GNPDA2 were also found to be associated with BMI or risk of obesity in children and old age population (Elks et al., 2010; Mejía-Benítez et al., 2013; Murphy et al., 2013; Xi et al., 2013a; Pillay et al., 2015). Furthermore, it also modulated the susceptibility of hypertension and type II diabetes (Takeuchi et al., 2011; Robiou-du-Pont et al., 2013; Xi et al., 2013b; Xi et al., 2014; Kong et al., 2015).
Fatness traits are important economic traits in chickens because of its relation to meat quality of broiler, suitable content of fat can improve the meat quality (tenderness, juiciness and flavor), but excess fat deposition can greatly reduce the meat quality (Castellini, Mugnai & Bosco, 2002; Zerehdaran et al., 2004; Petracci et al., 2013). In addition, large amounts of fat deposition also can reduce the feed efficiency, even increasing the risk of disease in chicken (Boekholt et al., 1994). In humans, GNPDA2 has been found to be associated with BMI and fat deposition, but the characteristics and functions of GNPDA2 in chickens have not been reported. In this study, we hypothesize that GNPDA2 is also involved in body weight gain and fat mass accumulation in chickens. Therefore, we identified the chicken GNPDA2 gene and monitored its mRNA level in various tissues under different conditions of nutrition, and performed association analysis of variations of GNPDA2 with fatness traits in chickens, so as to characterize the functions of the GNPDA2 gene in the fat metabolism of chickens.
Materials and Methods
Animals and DNA samples
A total of 45 Xinghua chickens (20 chickens (10 males and 10 females) at 14 weeks of age; 25 female chickens at 23 weeks of age) were obtained from Poultry Farm of the South China Agricultural University (SCAU). All birds were raised in individual cages, kept in identical light/dark cycles and had ad libitum access to water throughout the experimental period. Birds were allocated to the one of three different treatments (T) as follows: T1, the 14-week-old chickens were divided into two groups (in each group; n = 10, 5 males and 5 females) and fed a high-glucose-fat diet (Table S1) or a basal diet for 4 weeks, respectively. T2, the 23-week-old chickens with significant different body weight were divided into high body weight group (n = 5, 1388.5 ± 122.4 g) and low body weight group (n = 5, 1132.7 ± 108.5 g). In T3, the remain 15 23-week-old female chickens were divided into three groups of five birds each and subjected to the following treatments: (I) Fed a basal diet ad libitum (Control); (II) Fasted for two days (Fasted); (III) Fasted for two days and refed a basal diet for one day (Re-Fed).
The DNA samples from an F2 resource population which derived from reciprocal crossed between Xinghua (XH) and White Recessive Rock (WRR) chickens were used for GNPDA2 variations identifying and association analysis (Lei et al., 2005). The population was made up of 17 full-sibling families, which had 434 F2 individuals (221 male and 213 female chickens) with a detailed record of growth traits, carcass traits, and meat quality traits.
Primers and siRNA
All primers were designed using Premier Primer 5.0 software (Premier Bio-soft International, Palo Alto, CA, USA) and synthesized by Biosune Co. Ltd (Shanghai, China). Primers G1 and G2 were used to clone cGNPDA2. G5′-outer and G5′-inner were used for 5’RACE PCR, G3′-outer and G3′-inner were used for 3’RACE PCR. G3 and G4 were used for real-time-PCR analysis of chicken GNPDA2 and β-actin, respectively. Primers G5–G11 were used to identify and genotype SNPs of cGNPDA2. All SR1∼SR3 siRNAs were synthesized by GenePharma Co. Ltd (Suzhou, China). Scrambled siRNA was also synthesized as negative control. Primers of GNPDA2 are summarized in Table S2. Primers for real time quantitative PCR (RT-qPCR) of other GNPDA2-related genes are summarized in Table S3.
RNA isolation, cDNA synthesis and real-time PCR analysis
Upon termination of the experiment, chickens were euthanized and 16 tissues (cerebrum, cerebellum, hypothalamus, pituitary, abdominal fat, subcutaneous fat, breast muscle, heart, liver, spleen, lungs, kidney, muscular stomach, glandular stomach, duodenum and ovary/testis) were rapidly collected, immediately frozen in liquid nitrogen and stored at −80°C prior to use. Total RNA was isolated using Trizol reagent (Invitrogen, Foster City, CA, USA), following the recommended manufacturer’s protocol. The quality and quantity of RNA samples were detected by 1.5% agarose gel electrophoresis and based on absorbance OD (optical density) at 260/280 nm ratio, respectively. For the cDNA synthesis, 2 µg total RNA was subjected to reverse transcription with the use of oligo(dT)18 as the primer and reverse transcriptase was performed using RevertAid™ First Strand cDNA Synthesis Kit (Fementas, Waltham, MA, USA) in total 20 µL reaction volume. The relative quantity of mRNA was detected using SsoFast Eva Green Supermix (BIO-RAD, Hercules, USA) in a final volume of 20 µL and performing in CFX9600 (BIO-RAD) under the following conditions: 95°C for 3 min, followed by 40 cycles of 10 s at 95°C, 30 s at annealing temperature (58–62°C ), 30 s at 72°C and melt curve by 65°C to 95°C, increment 0.5°C for 5 s. Each sample was assayed in triplicate, and chicken β −actin was used as reference gene. The specificity of product was decided by the solubility curve, and the quantitative values were obtained from the threshold PCR quantification cycle (Cq). The relative mRNA level in each sample was calculated using comparative equation (PCR efficiency was considered as 100%) by CFX Manager software (version 2.1). Fold-change values were calculated using the comparative method.
5’RACE and 3’RACE PCR
The RACE system was performed to obtain the full-length cDNA sequence of chicken GNPDA2. The hypothalamus and adipose tissue total RNA were used as template for RACE PCR. RACE PCR was performed with the SMARTer RACE cDNA Amplification Kit (Clontech, Osaka, Japan) following the manufacturer’s instructions. Products of RACE PCR were cloned into pMD-18T vector (Takara, Osaka, Japan) according to the manufacturer’s protocol, and sequenced by Invitrogen Co. Ltd (Guangzhou, China).
GNPDA2 blast analysis and phylogenetic analysis
The GNPDA2 AA sequences of the other 17 species were obtained from Genebank (Table S4). The obtained cDNA sequences were analyzed by BLAST (https://blast.ncbi.nlm.nih.gov/Blast.cgi). On the basis of the 18 GNPDA2 sequences, a phylogenetic tree was constructed by using Neighbor-joining method of the MEGA 4.1 software (http://www.megasoftware.net/mega41.html).
SNP identification and genotyping
Variations of cGNPDA2 were identified and genotyped in DNA samples of F2 resource population (XH&WRR) using PCR amplification and sequencing. PCR was performed in volume of 50 µL of a mixture containing 50 ng of chicken genomic DNA, 10 pmol of primers and 25 µL PCR Master Mix (Transgen, Beijing, China), and using the following protocol: 94°C for 3 min, followed by 32 cycles of 30 s at 94°C, 30 s at annealing temperature (58–62°C; Table S3), 30 s at 72 ∘C and a final extension of 72°C for 5 min. PCR products were sequenced by Invitrogen Co. Ltd (Guangzhou, China). PCR-restriction fragment length polymorphism (PCR-RFLP) was also used to genotyping SNPs. PCR products were digested by fasted restriction enzymes (Fementas) following the manufacturer’s instructions, and then detected through 2% agarose gel electrophoresis.
Plasmid construction, cell culture and transfection
The coding sequences of cGNPDA2-a were amplified from chicken abdominal fat cDNA using PCR, and then cloned into pcDNA3.1(+) vector (Invitrogen, Carlsbad, CA, USA) according to the protocols of the manufacturer, using the XhoI and BamHI (Fementas) restriction sites. Chicken preadipocytes were obtained from 20 days old Xinghua chicks as previous study (Ramsay & Rosebrough, 2003). The cell were maintained in Dulbecco’s modified Eagle medium (DMEM)/F-12 (Gibco, Grand Island, NY, USA) supplemented with 10% (v/v) foetal bovine serum (Hyclone, Logan, UT, USA), and 100 µg/mL penicillin/streptomycin (Invitrogen) at 37°C with 5% CO2, humidified atmosphere. Preadipocytes were seeded in 12-well plate at a density of 5.0 × 10⁴ cells/well, and were transfected plasmid (1 µg/per well) or siRNA (50 nM) using Lipofectamine 3000 (Invitrogen) (1 µL/per well) when the cells growth reach 70%∼80% confluence. After 48 h, all cells were collected to assay the mRNA level of GNPDA2 and its related genes. The pcDNA3.1(+) vector without insert and scrambled siRNA were used as an internal control, respectively.
Statistical analysis
All values are presented as means ± S.E.M. The threshold for significance was set at P < 0.05 and for high significance at P < 0.01. Association analysis of SNPs with productive traits were performed using the General Linear Models Procedures of SAS 9.0 (SAS Institute Inc., Cary, NC, USA) and the genetic effects were analyzed by a mixed procedure according to the following model (Lei et al., 2005): where Y = the traits phenotypic values; μ = the overall population mean; S = the fixed effect of gender; G = the fixed effect of genotype; H = the fixed effect of hatch; F = the fixed effect of family; e = the random residuals.
Animal Ethics
The experimental procedures used in this study met the guidelines of the Animal Care and Use Committee of the South China Agricultural University (SCAU) (Guangzhou, People’s Republic of China) and were approved by SCAU with approval number SCAU#0011. Animal experiments were handled in compliance with the regulations and guidelines established by the Animal Care and Use Committee of SCA, and all efforts were made to minimize animal suffering.
Results
The chicken GNPDA2 cDNA and variant transcripts
Four different GNPDA2 transcripts were identified in chicken in this study, the length of each of them as follows: cGNPDA2-a (NCBI accession number: JX048609) was 1,806 bp, cGNPDA2-b (JX048610) was 1,621 bp, cGNPDA2-c (KF296359) was 1,522 bp and cGNPDA2-d (KF296360) was 1,715 bp. The results of UCSC genome BLAST showed that the chicken GNPDA2 was 7,453 bp long, which located at chromosome 4 and spanned from 67202451 to 67209903. Here, our result cGNPDA2-a, the predominant transcript of GNPDA2, comprised seven exons and six introns. Compared with cGNPDA2-a, cGNPDA2-b was deleted the whole exon5 (185 bp), cGNPDA2-c was deleted the exon5 and part of the exon6 (99 bp), and cGNPDA2-d has a 91 bp deletion in exon2. Exon 5 and 6 are `hot spots' for alternative splicing (Fig. 1A). Due to the deletions located at coding region, four GNPDA2 transcripts have different open reading frame (ORF). The ORF of cGNPDA2-a was 828 bp and encoding 275 amino acids (AA). The ORF length of the other three cGNPDA2 transcripts were 438 bp for cGNPDA2-b, 435 bp for cGNPDA2-b and 737 bp for cGNPDA2-d, respectively (Fig. 1B).
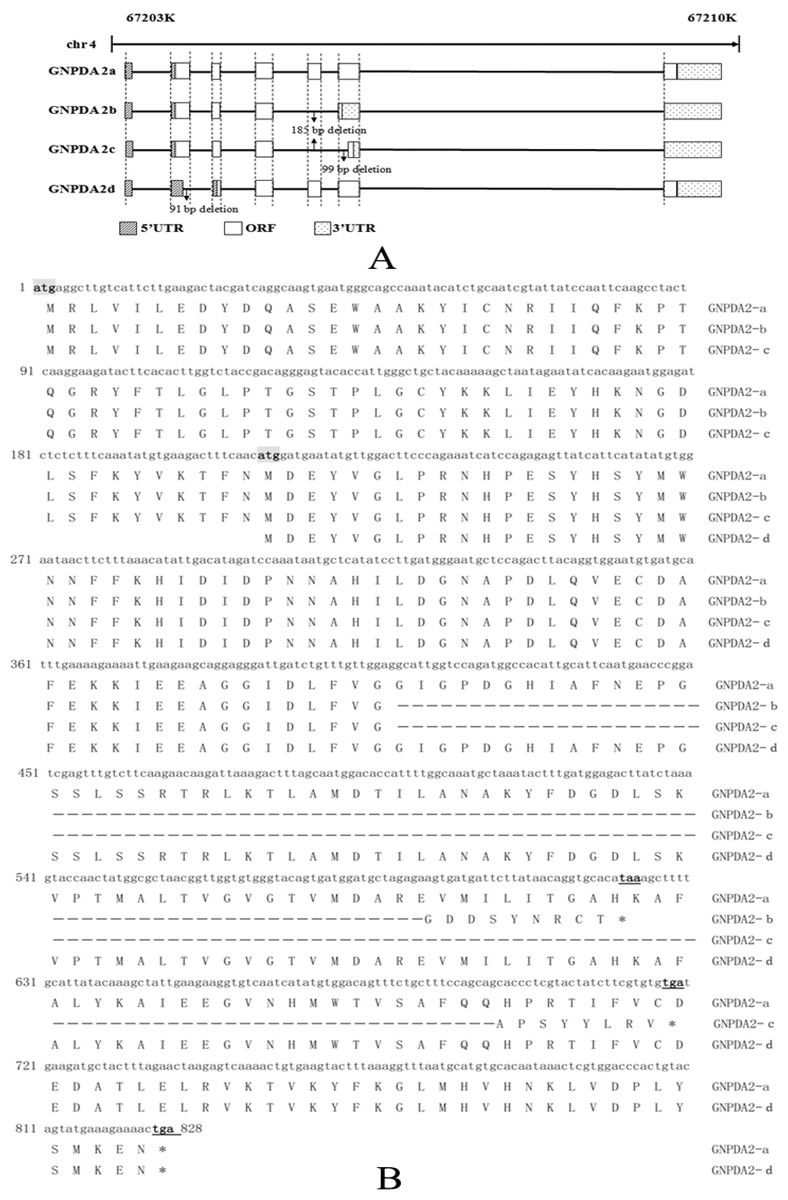
Figure 1: Characterization of four chicken GNPDA2 variant transcripts.
(A) Genomic structure of chicken GNPDA2. UTR, untranslated region; ORF, open reading frame. (B) The open reading frame of four cGNPDA2 variant transcripts. The letter atg with shadow is initiation codon, and the letter taa or tga with underline is termination codon.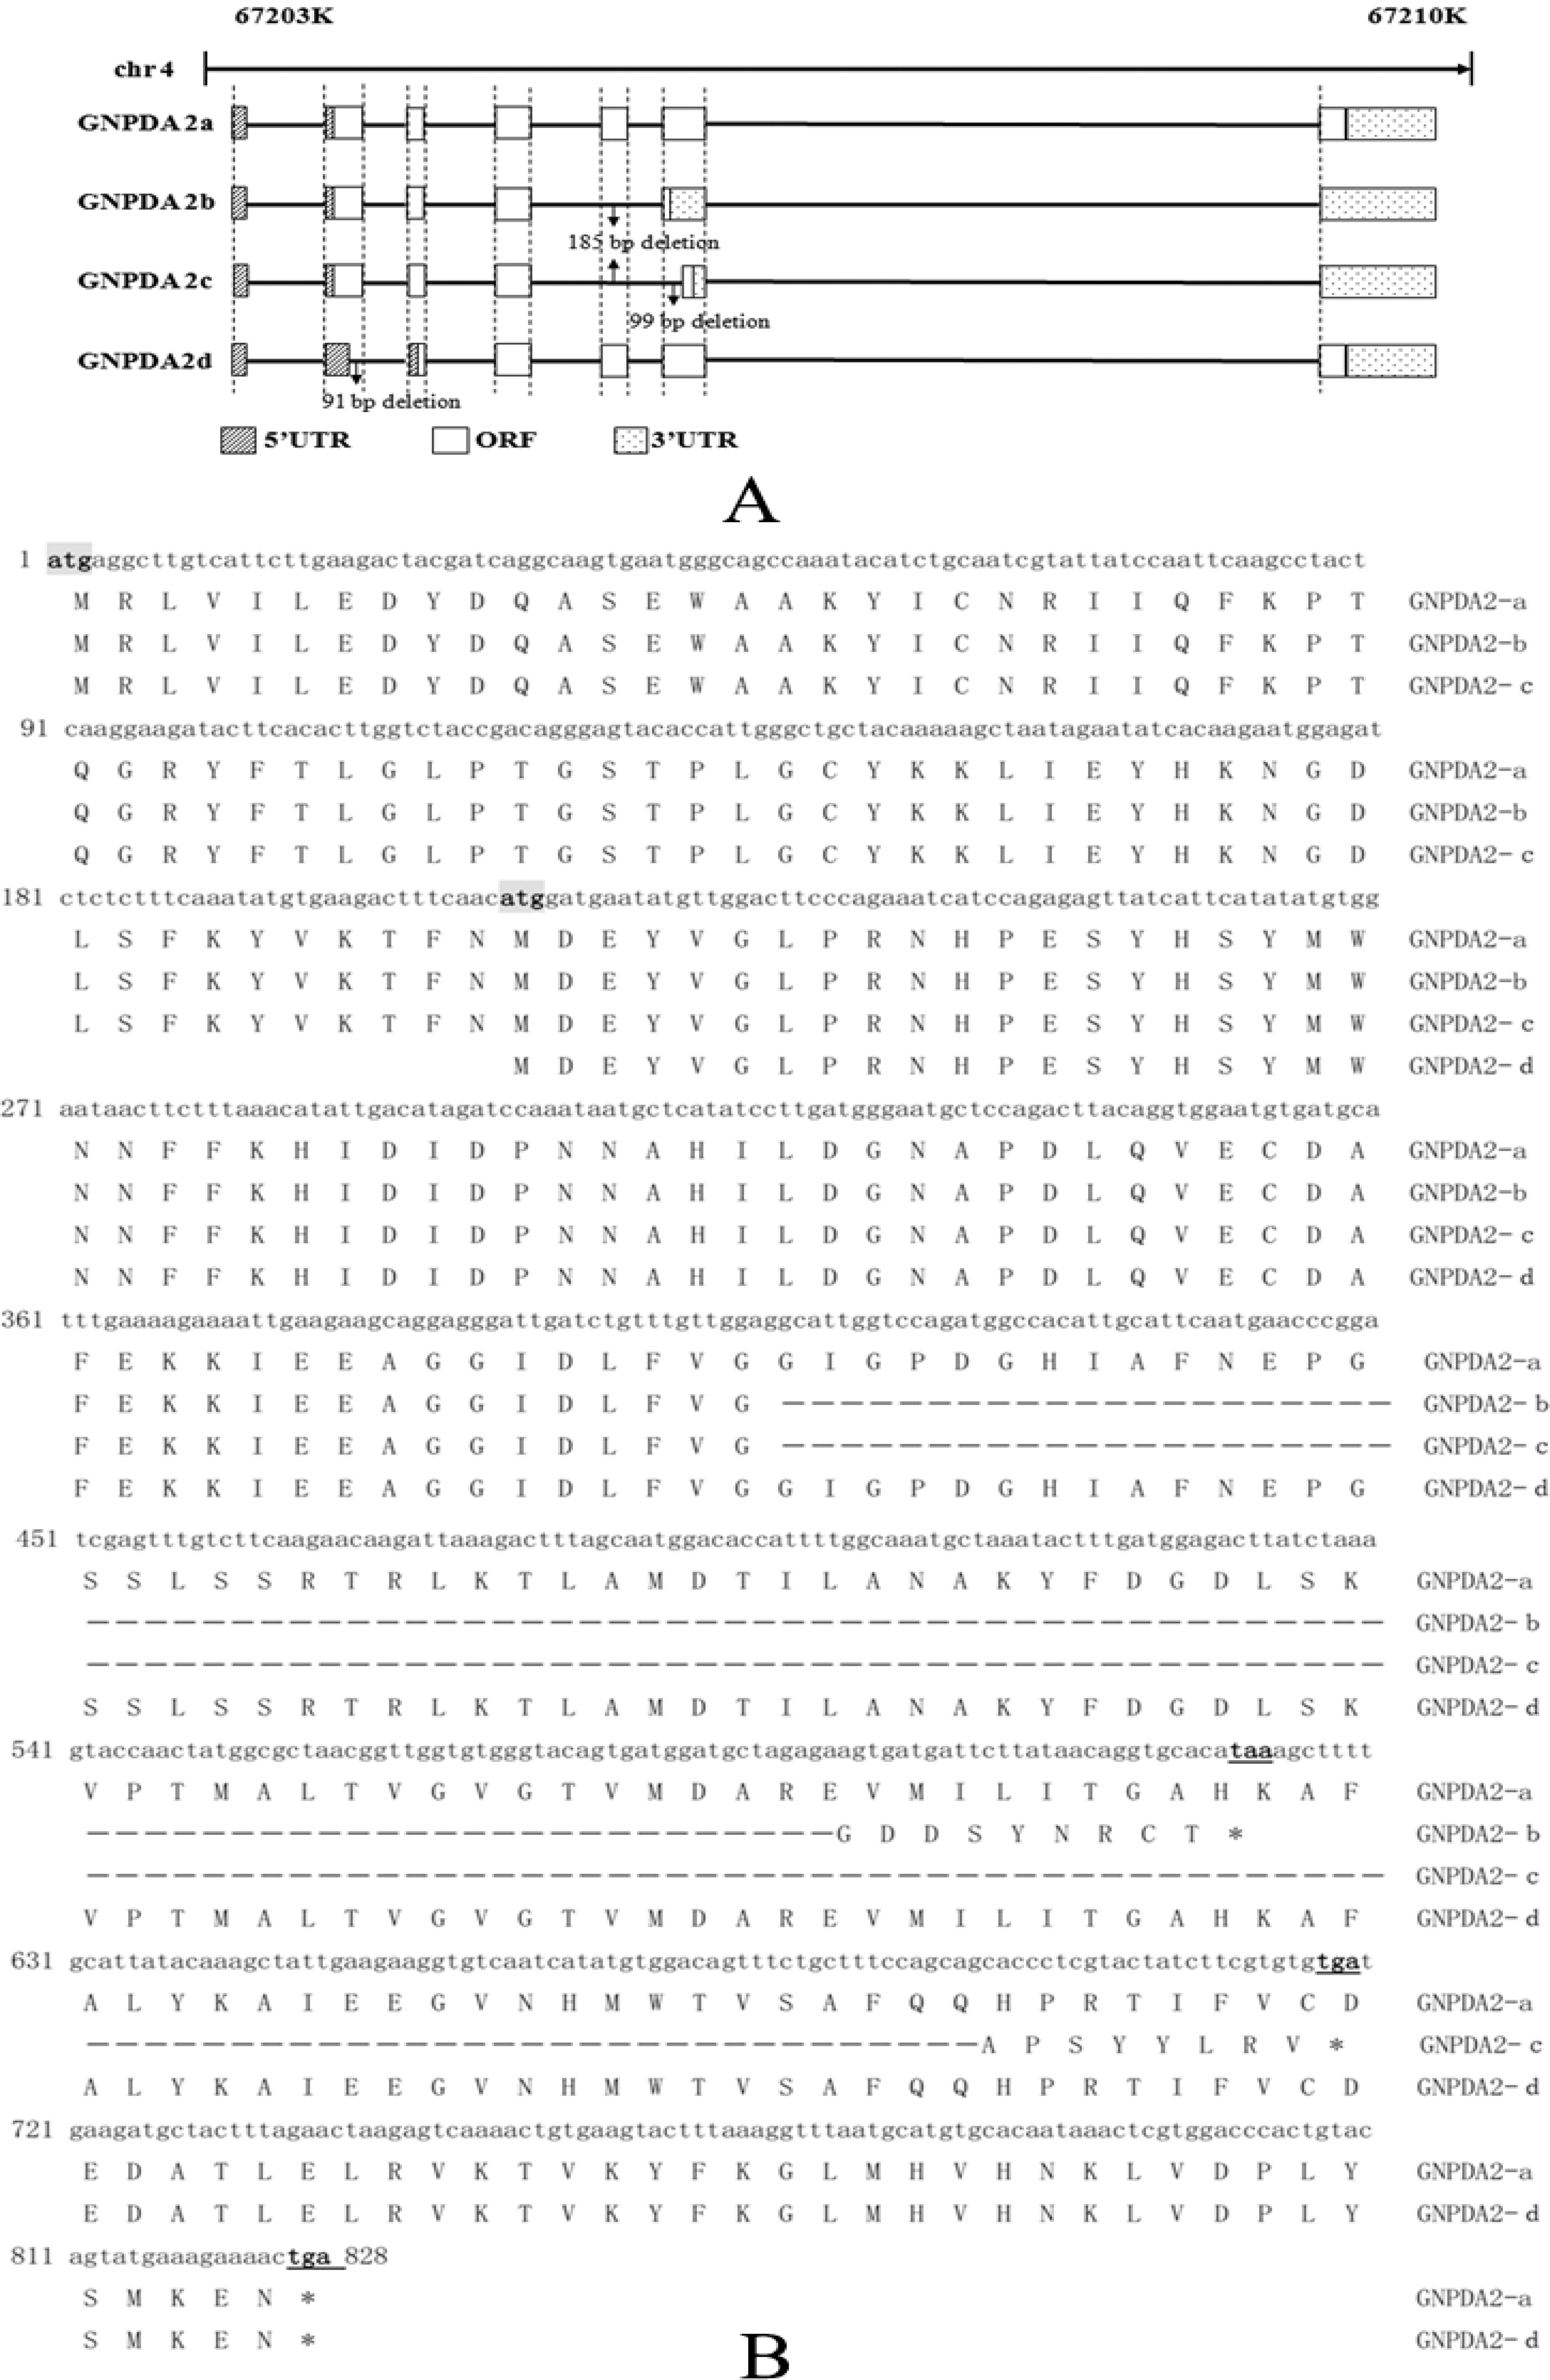
Sequence alignment and phylogenetic analysis
GNPDA2 gene is a member of GlcN6P deaminase subfamily. Analysis by using NCBI BLAST (Basic Local Alignment Search Tool) showed that the coding DNA sequences of GNPDA2 were highly conserved, and has conserved domain of GlcN6P deaminase in chicken and other 17 species. The GNPDA2 sequence homology of chicken with other birds and mammalians were all above 90%, especially the homology with duck up to 99.3% (Fig. S1A). The phylogenetic tree based on GNPDA2 homology showed that 18 species were divided into four distinct groups, and they were birds (chicken, turkey, duck, parrot, pigeon, zebra finch and sparrow), mammals (human, cattle, dog, pig, horse, goat, sheep, mouse and rat), frog and zebrafish (Fig. S1B).
SNPs identification and its association analysis with productive traits
Chicken GNPDA2 was located at chromosome 4 and spanned in 7,453 bp (NC_006091.3). In F2 resource population (XH&WRR) chicken, a total of 25 SNPs were identified in the full length chicken GNPDA2 DNA through PCR sequencing (Table 1). Among these 25 SNPs, 6 SNPs were novel ones, but the other 19 SNPs have already been reported in NCBI SNP database (https://www.ncbi.nlm.nih.gov/snp). According to the transcript cGNPDA2-a, two SNPs were found in the coding sequences, seven SNPs were located in 3'UTR sequences and the other 16 SNPs were located in intron sequences.
| NO. | Site in DNA | SNPs | Region | NCBI number |
|---|---|---|---|---|
| 1 | nt 1157 | C→T | Intron 1 | rs313319798 |
| 2 | nt 1192 | G→A | Intron 1 | rs312694820 |
| 3 | nt 1250 | A→T | Intron 1 | -- |
| 4 | nt 1315 | T→C | Intron 1 | rs313558025 |
| 5 | nt 1347 | G→A | Intron 1 | -- |
| 6 | nt 2119 | T→C | Exon 4 | rs316460349 |
| 7 | nt 2412 | G→A | Exon 4 | rs316364048 |
| 8 | nt 3404 | A→T | Intron6 | rs14486231 |
| 9 | nt 3590 | C→T | Intron 6 | rs312766474 |
| 10 | nt 4231 | -/T | Intron 6 | rs14486233 |
| 11 | nt 5436 | A→G | Intron 6 | rs317780046 |
| 12 | nt 5527 | T→C | Intron 6 | -- |
| 13 | nt 5605 | A→G | Intron 6 | rs317672439 |
| 14 | nt 5659 | A→G | Intron 6 | rs312941054 |
| 15 | nt 5841 | C→G | Intron 6 | rs312807283 |
| 16 | nt 6091 | C→G | Intron 6 | rs794508049 |
| 17 | nt 6098 | C→T | Intron 6 | -- |
| 18 | nt 6178 | G→A | Intron 6 | rs312926139 |
| 19 | nt 6667 | C→T | 3'UTR | -- |
| 20 | nt 6822 | T→A | 3'UTR | -- |
| 21 | nt 7090 | A→G | 3'UTR | rs313999192 |
| 22 | nt 7277 | A→G | 3'UTR | rs14486237 |
| 23 | nt 7306 | T→C | 3'UTR | rs315312077 |
| 24 | nt 7226 | C→G | 3'UTR | rs14486238 |
| 25 | nt 7393 | C→T | 3'UTR | rs14486239 |
The cGNPDA2 SNPs in coding sequences and 3’UTR sequences were genotyped in F2 resource population (XH&WRR) chicken through PCR sequencing, and then the results were association analysis with productive traits. We found that the two SNPs (g.6667C > T and g.7393C > T) in 3’UTR (Fig. 2A) were significantly associated with a number of productive traits in chicken (Table 2). The genotyped results of these two SNPs were also confirmed by PCR-RFLP (Fig. 2B). PCR products of g.6667C > T (1,077 bp) and g.7393C > T (648 bp) were digested by Dde I and Ssp I respectively, and then detected enzyme-digested fragments to genotyed the g.6667C > T (TT, 1,037 bp; TC, 1077/703/374 bp; CC, 703/374 bp) and g.7393C > T (TT, 648 bp; TC, 648/587/61 bp; CC, 587/61 bp). The g.6667C > T and g.7393C > T (rs14486239) were both significantly associated with body weight during early stage (1–28 days old) of growth (Fig. 2C). The g.6667C > T was also significantly associated with chest depth (CD) and abdominal fat pad weight (AFW) (Fig. 2D). The g.7393C > T was significantly associated with small intestine length (SIL), leg muscle weight (LMW), dressed weight (DW), eviscerated weight (EW) and semi-eviscerated weight (SEW) (Fig. 2D).

Figure 2: Two SNPs of cGNPDA2 gene associated with body weight and fatness traits in chicken.
(A) The sequencing profiles of the two SNPs in cGNPDA2 gene. R and Y are heterozygous, in which R = A/G and Y = C/T. (B) Agarose gel results of two SNPs genotyped by PCR-RFLP. M, DNA marker; TT, TC and CC are three different genotypes. (C) The association of the two SNPs with the body weight of chickens during early stage of growth. (D) The association of the two SNPs with the fatness traits of chickens. DW, dressed weight; EW, eviscerated weight; SEW, semi-eviscerated weight.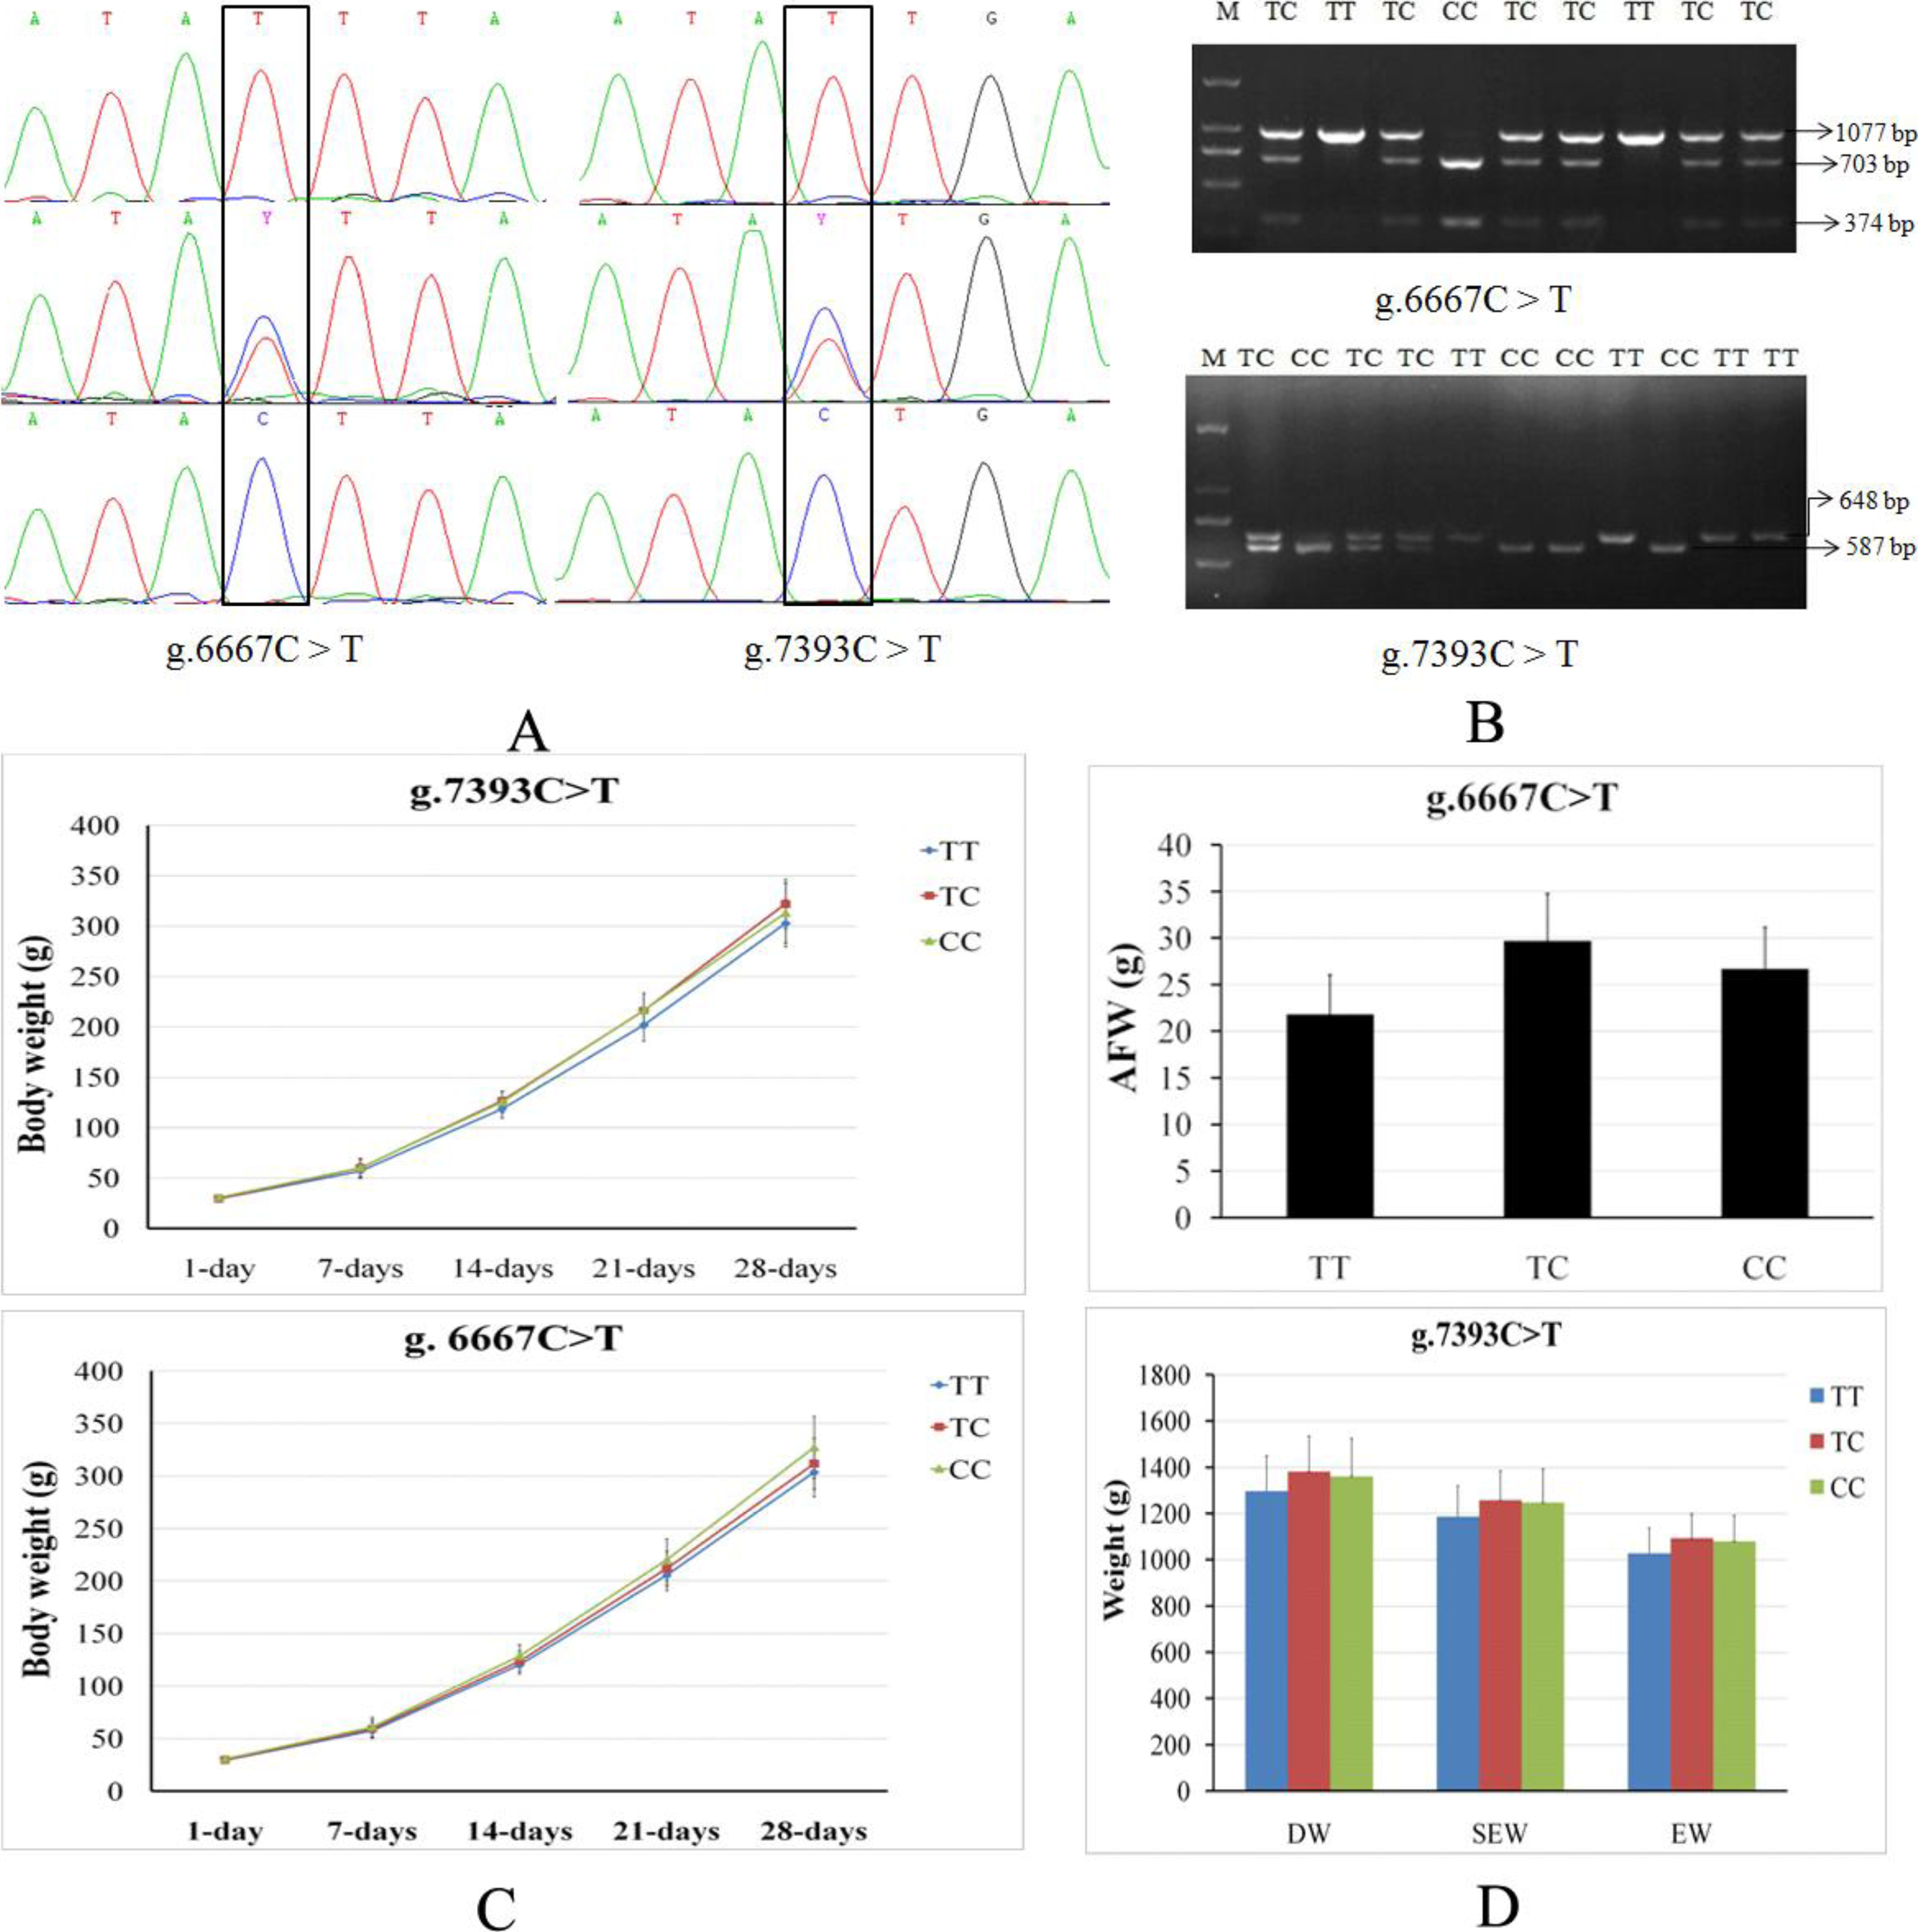
Tissue specific expression of GNPDA2 in XH chicken
Relative GNPDA2 mRNA expression in different tissues was detected by RT-qPCR and the quantified data are shown in Fig. 3. Chicken GNPDA2 gene was expressed in all 17 tested tissues, and there were no significantly different (P > 0.05) in expression level of all tissues between female and male chickens (Fig. 3). Chicken GNPDA2 gene expression level was highest in abdominal fat, duodenum and hypothalamus, and obvious mRNA expression in subcutaneous fat liver, lung, spleen and pituitary was also detected. However, the low expression level was observed in other tissue, especially in kidney and muscular stomach. In addition, we compared the mRNA level of GNPDA2 in four tissues (abdominal fat, subcutaneous fat, hypothalamus, and liver) of 23 weeks old female XH chickens with different body weight (high or low body weight). The results showed that GNPDA2 has higher expression in the hypothalamus of high body weight than that in the low body weight chickens (Fig. 4A).
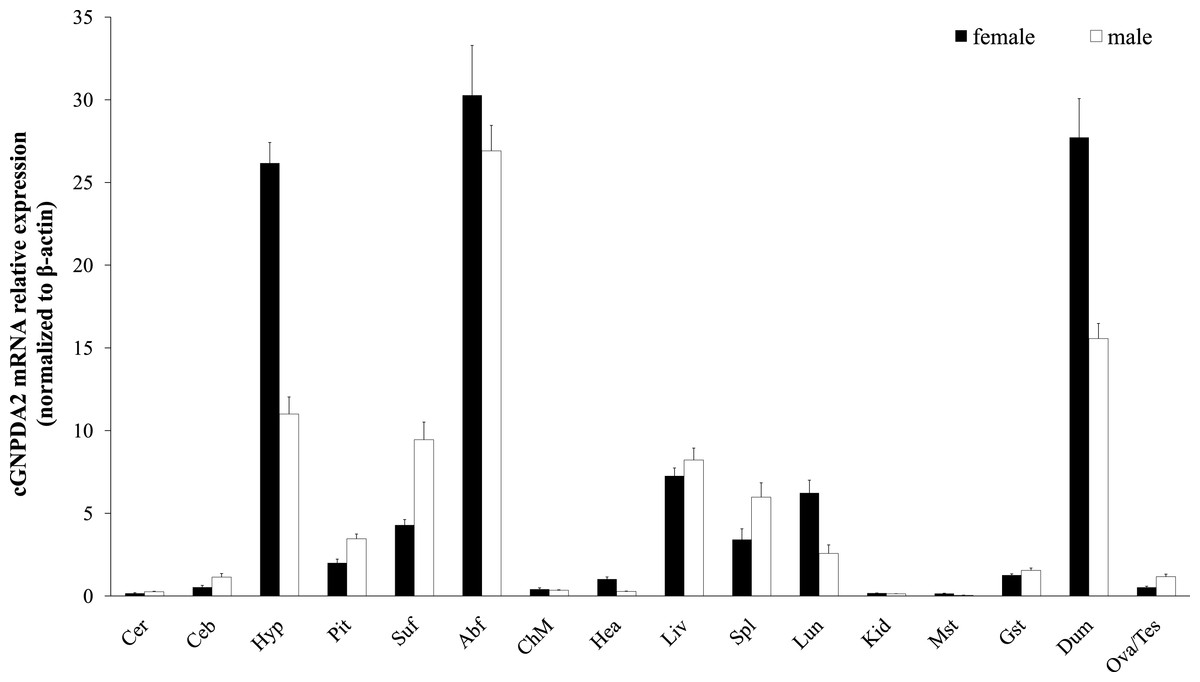
Figure 3: Expression of GNPDA2 gene in adult XH chicken tissues.
The horizontal axis and vertical axis indicate different tissues and their mRNA relative expression values (mean ± S.E.M). Cer, cerebrum; Ceb, cerebellum; Hyp, hypothalamus; Pit, pituitary; Abf, abdominal fat; Suf, subcutaneous fat; Chm, breast muscle; Hea, heart; Liv, liver; Spl, spleen; Lun, lung; Kid, kidney; Mst, muscular stomach; Gst, glandular stomach; Dub, duodenum; Tes, testis; Ova, ovary.
| Markers | Traits | P-value | Least-squares mean ± S.E.M | ||
|---|---|---|---|---|---|
| g.6667C > T | CD (mm) | 0.0117 | 95.3 ± 9.15 (TT, 117) | 96.6 ± 9.26 (TC, 191) | 93.3 ± 9.32 (CC, 108) |
| AFW (g) | 0.0006 | 21. 8 ± 4.23 (TT, 113) | 29.7 ± 5.05 (TC, 185) | 26.7 ± 4.46 (CC, 107) | |
| BW1 (g) | 0.0019 | 29.5 ± 2.40 (TT, 117) | 29.7 ± 2.81 (TC, 191) | 30.7 ± 2.74 (CC, 108) | |
| BW7 (g) | 0.0347 | 57.6 ± 7.63 (TT, 117) | 59.3 ± 8.50 (TC, 191) | 61.1 ± 9.12 (CC, 108) | |
| BW14 (g) | 0.0128 | 120.1 ± 8.68 (TT, 117) | 123.6 ± 9.61 (TC, 191) | 128.7 ± 10.53 (CC, 108) | |
| BW21 (g) | 0.0049 | 205.5 ± 14.80 (TT, 117) | 211.8 ± 16.47 (TC, 191) | 220.2 ± 19.81 (CC, 108) | |
| BW28 (g) | 0.0078 | 303.4 ± 23.35 (TT, 117) | 311.7 ± 24.41 (TC, 191) | 327.1 ± 29.58 (CC, 108) | |
| g.7393C > T | DW (g) | 0.0114 | 1296.3 ± 153.9 (TT, 115) | 1381.2 ± 153.7 (TC, 130) | 1360.9 ± 164.7 (CC, 171) |
| SEW (g) | 0.0026 | 1186.4 ± 133.8 (TT, 115) | 1257.7 ± 126.3 (TC, 130) | 1246.9 ± 144.7 (CC, 171) | |
| EW (g) | 0.0043 | 1027.6 ± 109.7 (TT, 115) | 1092.0 ± 105.5 (TC, 130) | 1079.0 ± 112.6 (CC, 171) | |
| LMW (g) | 0.0163 | 113.5 ± 12.6 (TT, 115) | 119.1 ± 12.5 (TC, 130) | 119.0 ± 14.9 (CC, 171) | |
| SIL (cm) | 0.0183 | 136.7 ± 11.4 (TT, 110) | 144.5 ± 13.4 (TC, 121) | 139.4 ± 10.8 (CC, 163) | |
| BW14 (g) | 0.0342 | 118.7 ± 9.06 (TT, 115) | 126.7 ± 10.49 (TC, 130) | 125.3 ± 9.40 (CC, 171) | |
| BW21 (g) | 0.0045 | 201.8 ± 15.99 (TT, 115) | 216.0 ± 17.61 (TC, 130) | 216.2 ± 17.29 (CC, 171) | |
| BW28 (g) | 0.0488 | 302.7 ± 23.42 (TT, 115) | 322.1 ± 24.84 (TC, 130) | 313.1 ± 27.23 (CC, 171) | |
Notes:
- AFW
-
abdominal fat pad weight; BW21, BW1, BW7, BW14, BW21 and BW28, body weight at 1,7,14, 21 and 28 days, respectively
- CD
-
chest depth
- DW
-
dressed weight
- EW
-
eviscerated weight
- LMW
-
leg muscle weight
- SEW
-
semi-eviscerated weight
- SIL
-
small intestine length
Statistical analysis was performed using GLM in SAS software (version 9.0), and data are shown as mean ± S.E.M. Letters and numbers in bracket refer to genotype and number of chickens with that genotype.

Figure 4: The level of cGNPDA2 mRNA was regulated by body weight, feeding/fasting and by consumption of the high-glucose-fat diet.
(A) Level of cGNPDA2 mRNA in XH chickens of high and low body weight. (B) Level of cGNPDA2 mRNA in male and female XH chicken fed a basal diets and high-glucose-fat diets. (C) Changes in the level of cGNPDA2 mRNA in XH chickens treated as control, fasted and Re-fed groups. Data are presented as the mean ± S.E.M (n = 5), ∗P < 0.05, ∗∗P < 0.01.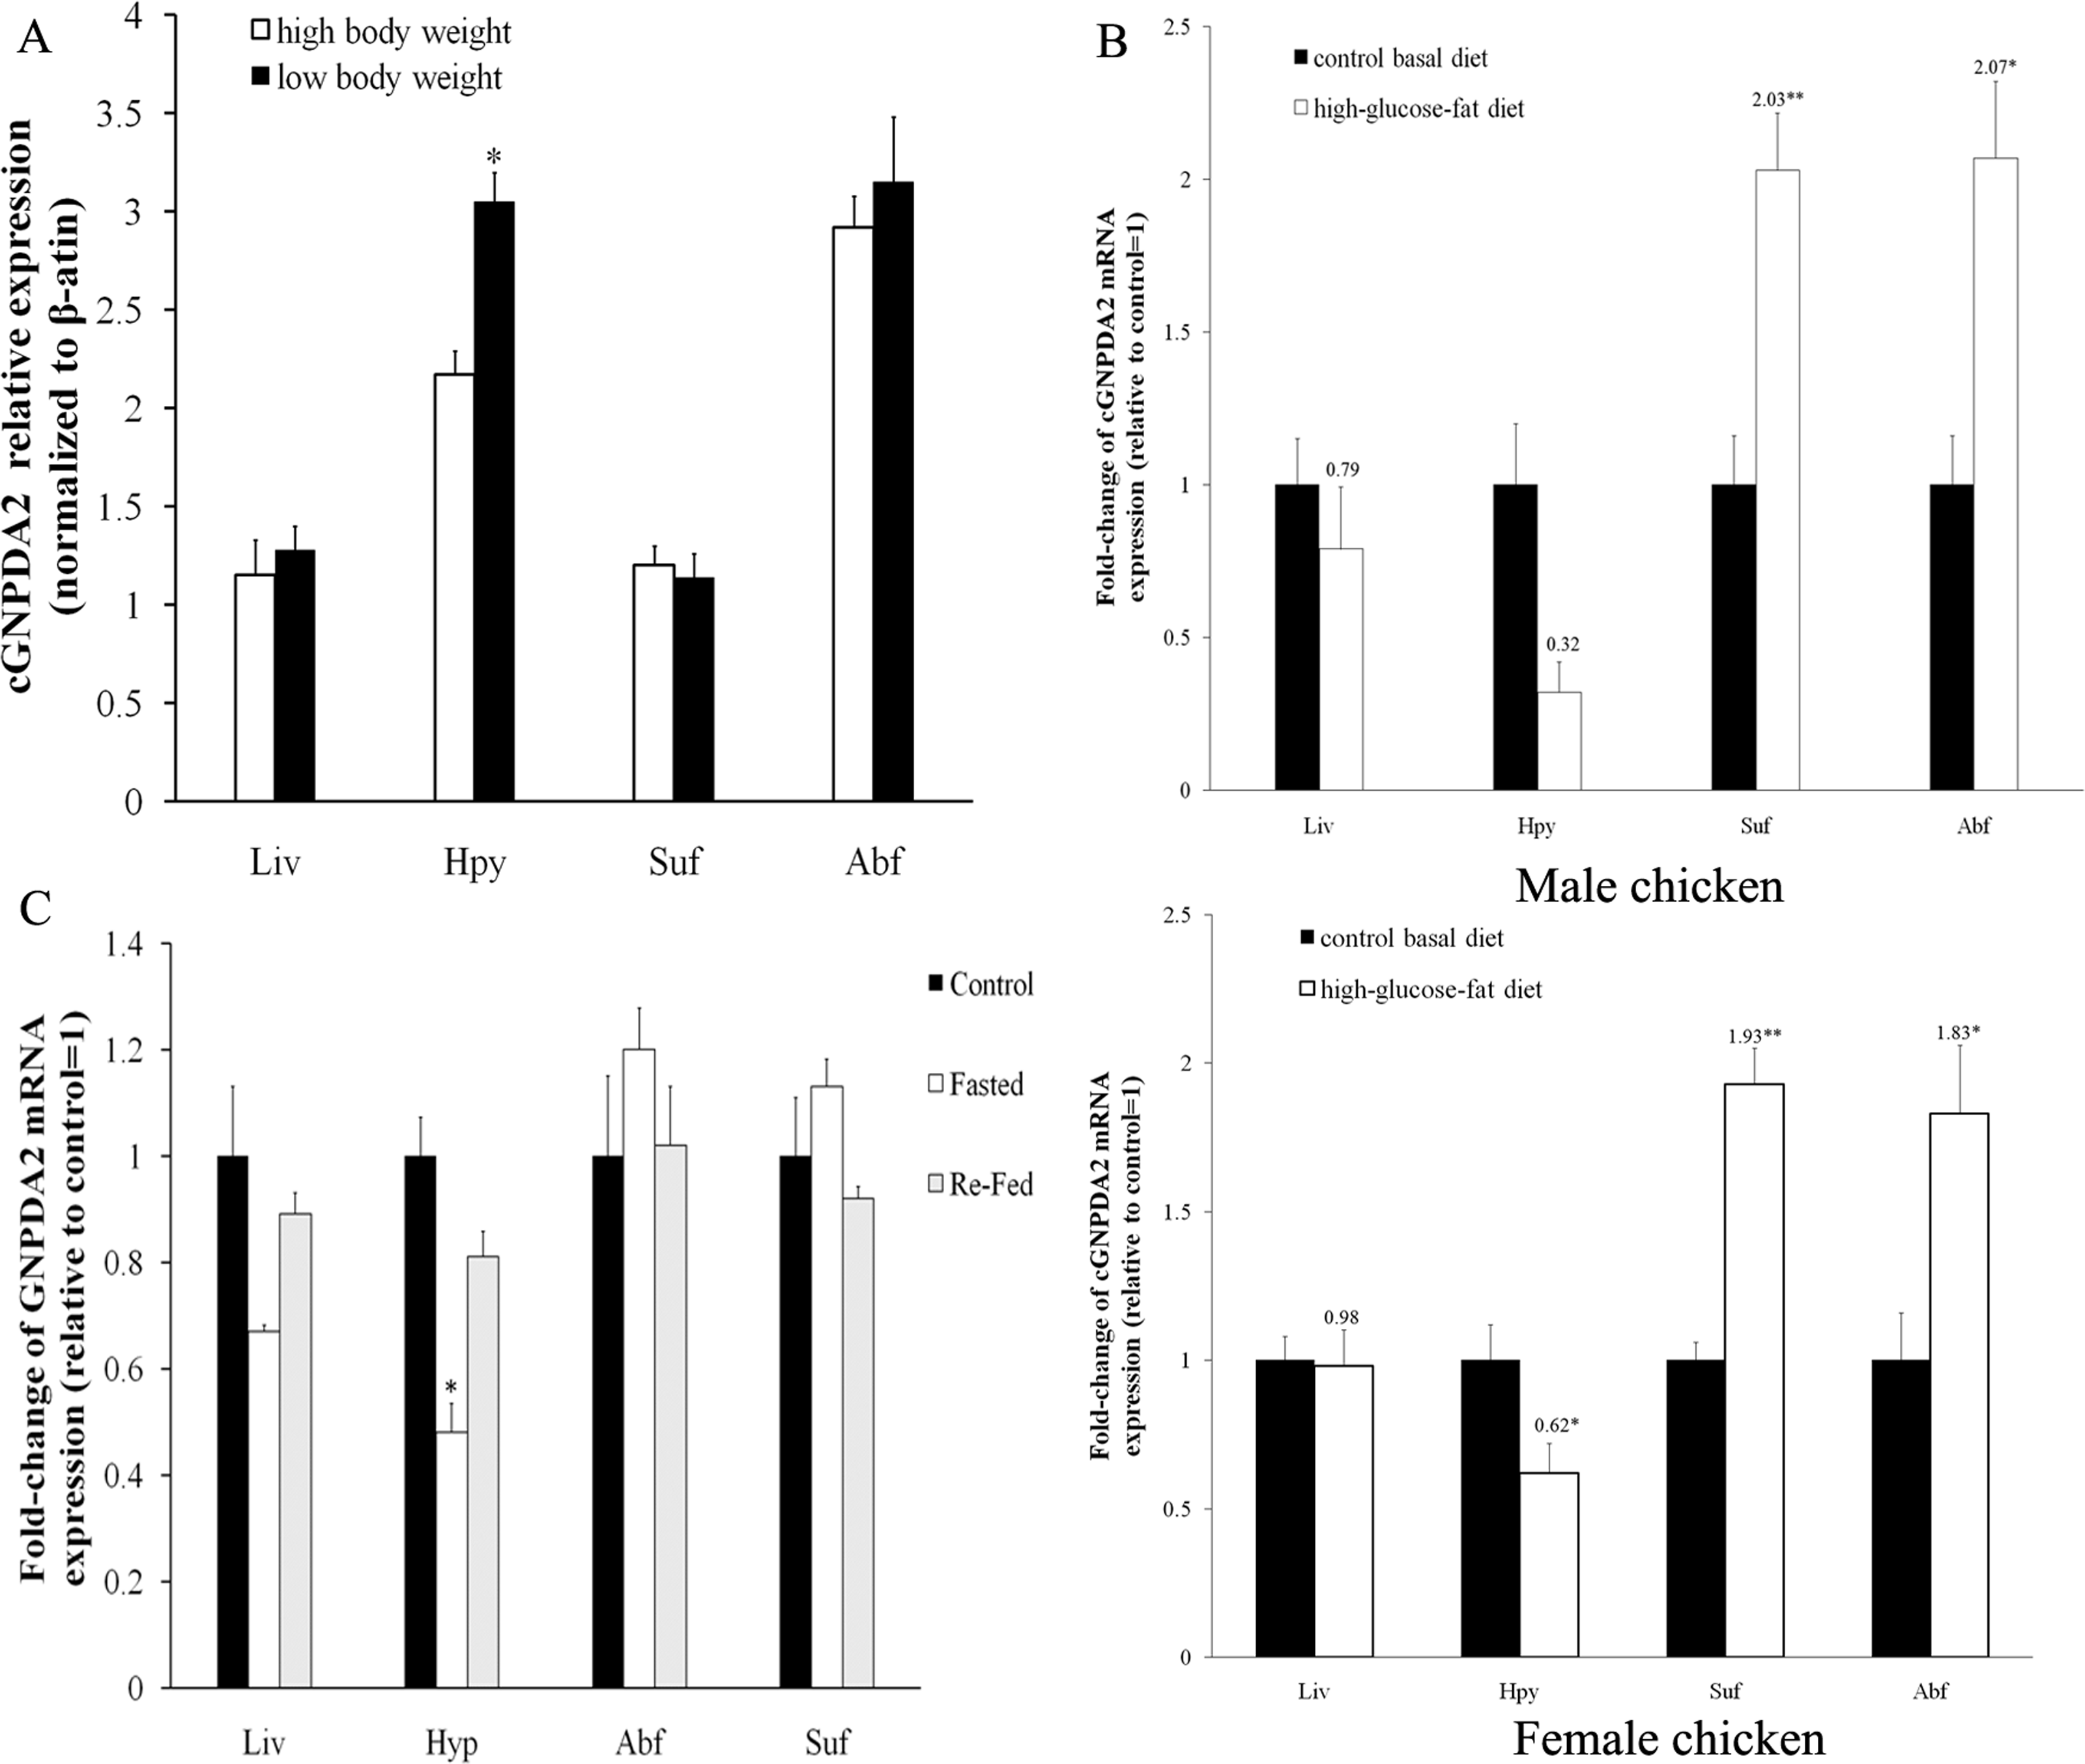
The effects of dietary status on cGNPDA2 mRNA level
After feeding chickens with high-glucose-fat diet, the mRNA level of GNPDA2 was increased about 2-fold in abdominal fat (P < 0.05) and subcutaneous fat (P < 0.01) than that in the control group (basal diet) of both female and male XH chickens. In liver and hypothalamus, the mRNA level of GNPDA2 was decreased of both female and male XH chickens, especially decreased by 38% (P < 0.05) in hypothalamus of female chicken (Fig. 4B). In fasted chickens, the mRNA level of GNPDA2 was decreased by 58.8% (P < 0.05) in hypothalamus, and returned to normal level after refeeding. However, no significant difference (P > 0.05) was found in adipose tissue and liver among the three experimental groups (control, fasted and re-fed), but the mRNA expression level in abdominal fat and subcutaneous fat tended to be slightly higher (P > 0.05) with fasted group (Fig. 4C).
The different GNPDA2 genotypes may affect the gene expression levels; this could be a confounding effect on dietary status. Thus, we performed DNA sequencing to check the genotypes of all 45 chickens used for qPCR experiment (Fig. 5A). In 25 female chickens of 23 weeks old, the g.6667C > T have 5 CC, 12 TC and 8 TT genotypes; the g.7393C > T have 10 CC, 5 CT and 10 TT genotypes. We compared the GNPDA2 expression level in these 25 chickens, the results showed that no significant difference were found (P > 0.05) among three different genotypes of both g.6667C > T and g.7393C > T (Fig. 5B and 5C).
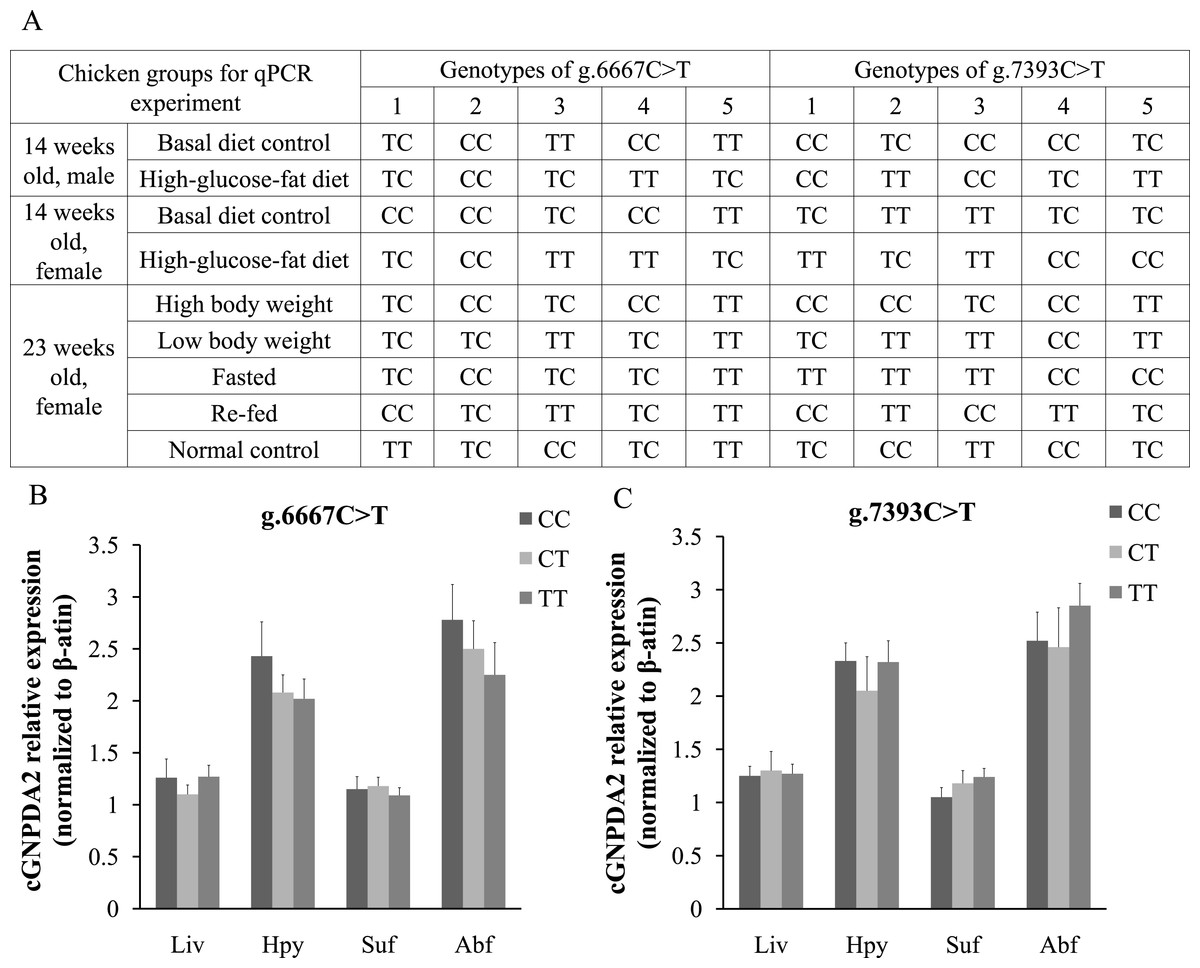
Figure 5: The different genotypes of g.6667C > T and g.7393C > T did not affected the expression of cGNPDA2.
(A) The genotypes of the chickens used for qPCR experiment. (B) The mRNA level of cGNPDA2 of three different genotypes of g.6667C > T in 25 23-weeks-old female chickens. (C) The mRNA level of cGNPDA2 of three different genotypes of g.7393C > T in 25 23-week-old female chickens.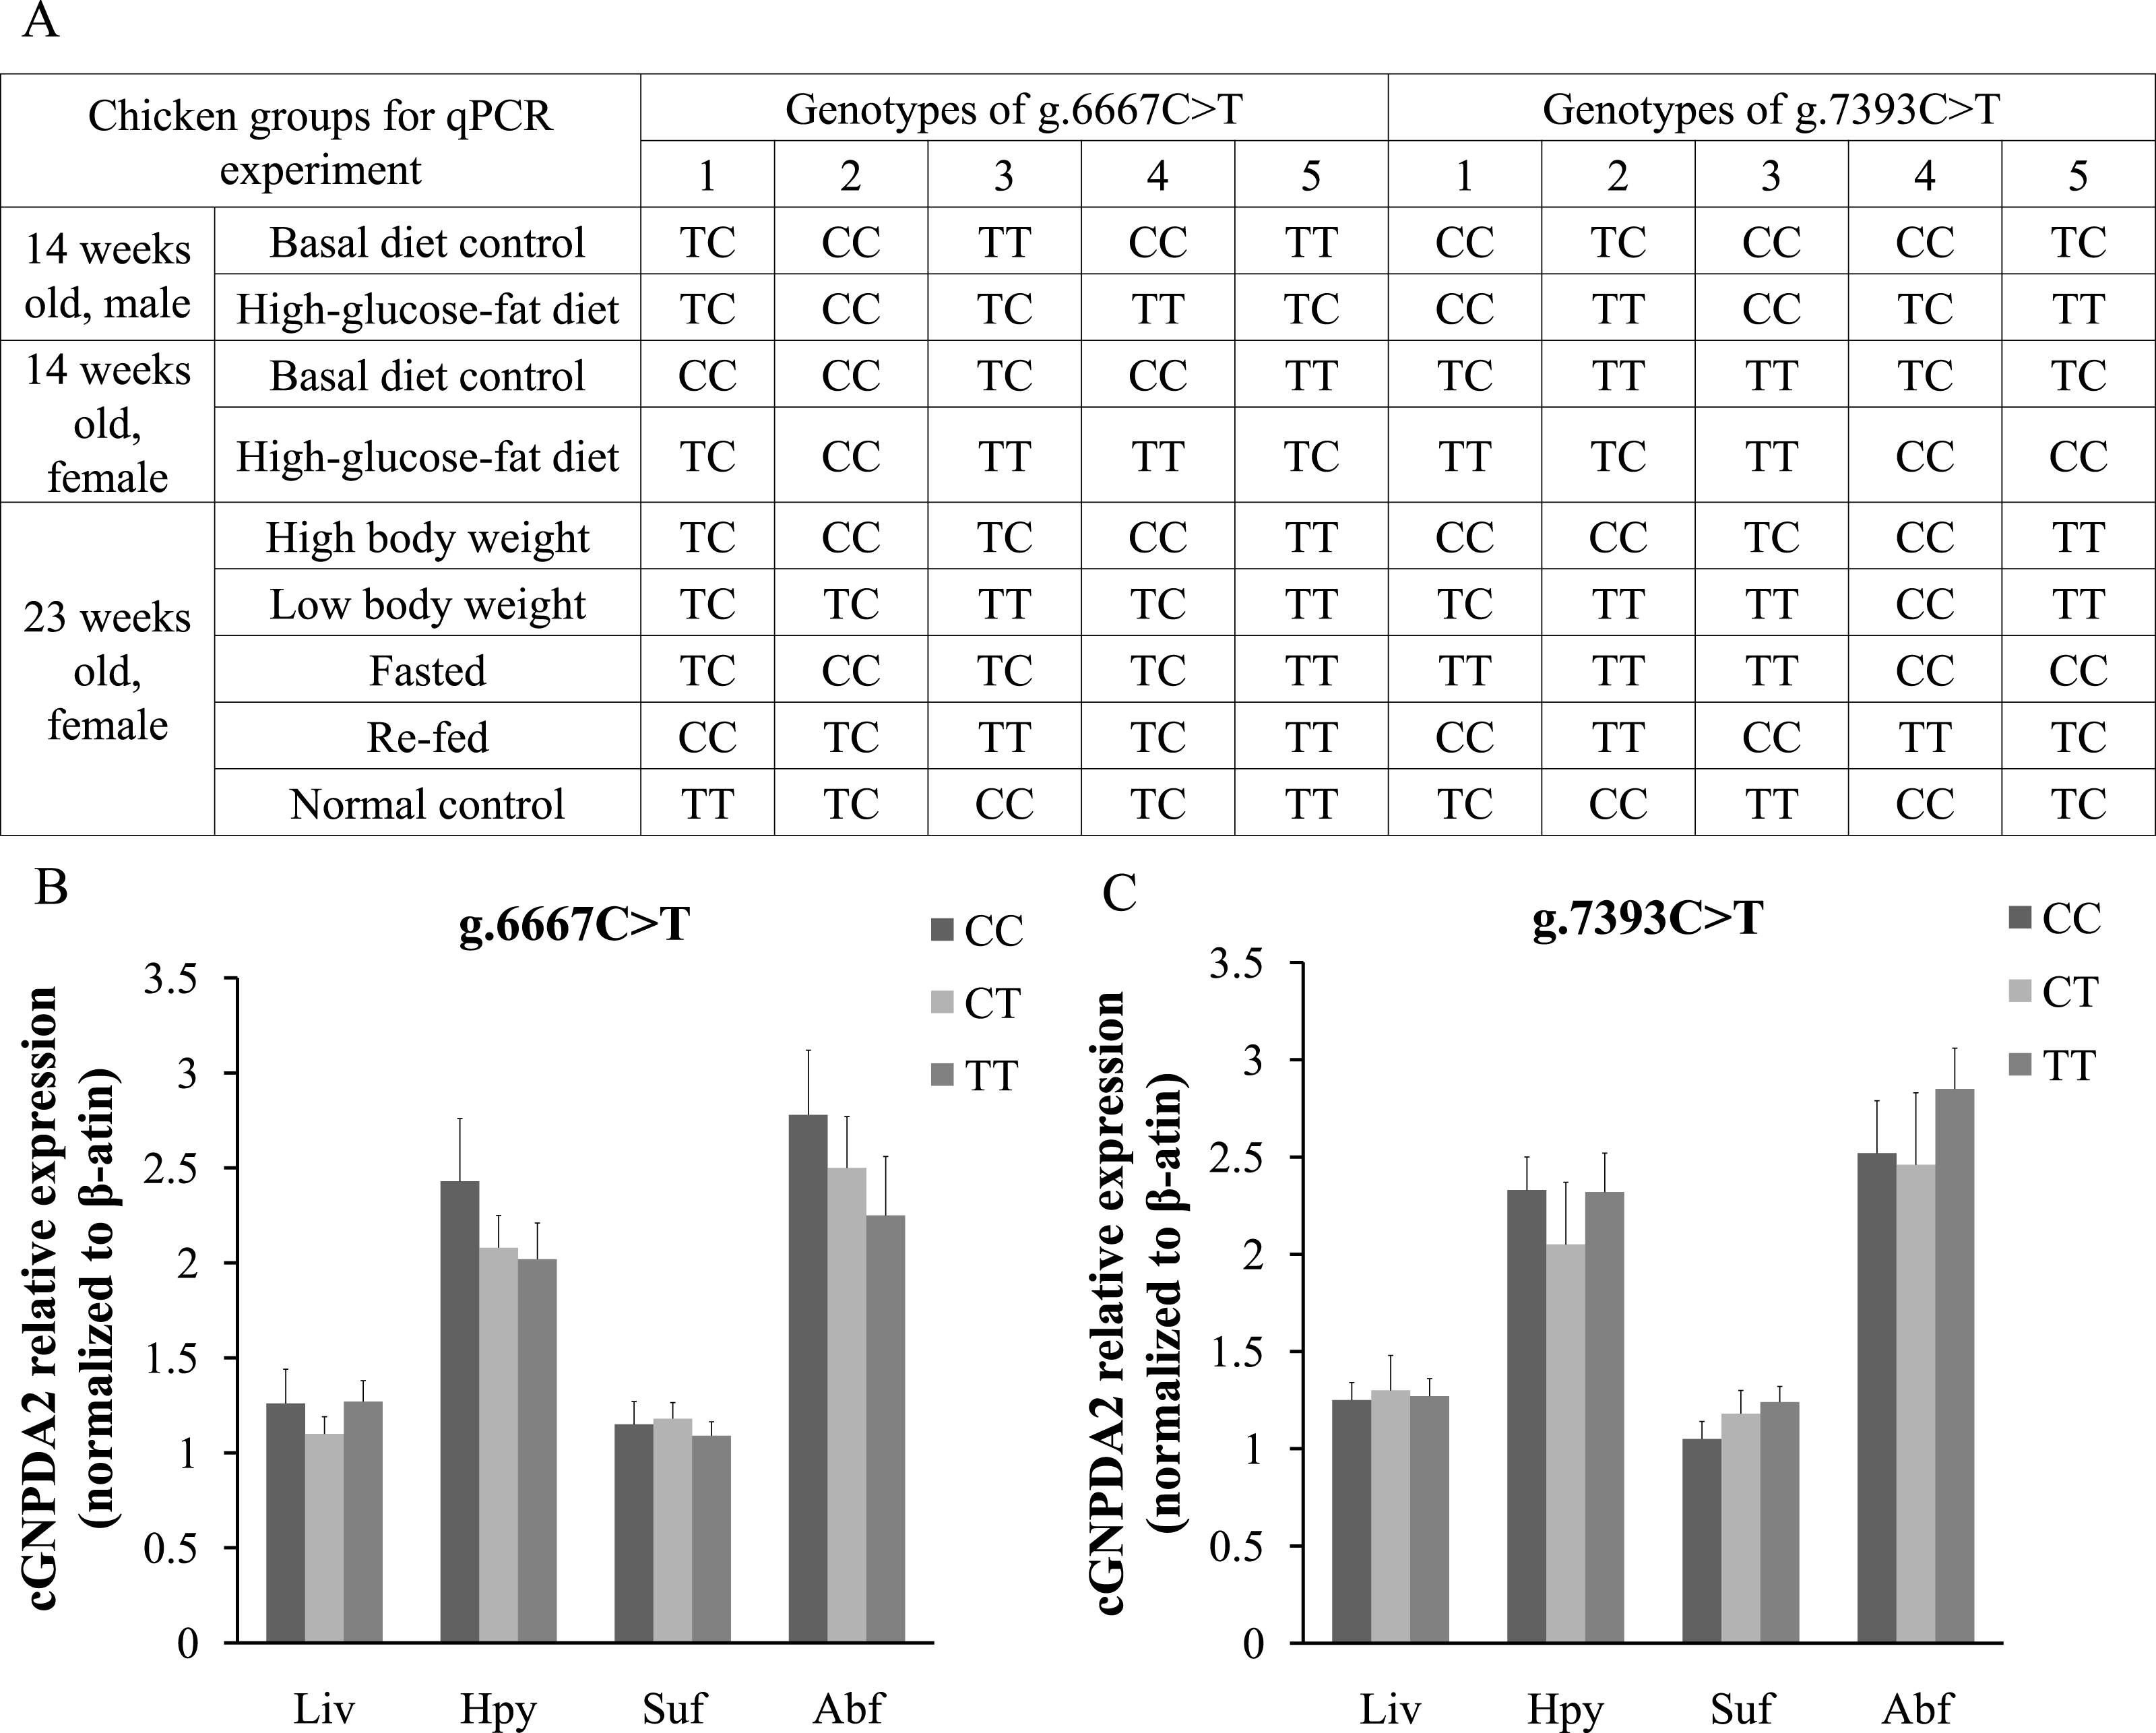
Overexpression and knockdown of cGNPDA2 in preadipocytes
In chicken preadipocytes, transfection of recombinant pcDNA3.1(+)-GNPDA2-a led to marked overexpression of cGNPDA2 (7.32-fold higher, P < 0.01) and siRNA interfering also led to cGNPDA2 decreased by 47% (P < 0.05). With overexpression of cGNPDA2, the mRNA level of ACC (acetyl-CoA carboxylase), FAS (fatty acid synthase), FTO (fat mass and obesity-associated gene) and PGC1α (peroxisome proliferative activated receptor gamma coactivator 1) were up-regulated, and the mRNA level of ATGL (adipose triglyceride lipase), HL (hepatic lipase), PPARγ (proxisome proliferator-activated receptor γ), Leptin-R (leptin receptor) and PKM (pyruvate kinase muscle) were down-regulated (Fig. 6A). When cGNPDA2 was knocked down, the expression trend of related genes was just contrary to overexpression of cGNPDA2 (Fig. 6B). Intriguingly, the mRNA level of PKM was decreased by 32% (P < 0.05) after overexpression cGNPDA2, and increased 1.76-fold (P < 0.05) after knockdown cGNPDA2. The expression of PGC1α was increased 2.25-fold (P < 0.05) after overexpression cGNPDA2. However, the changes of other related genes statistically were not significant difference after overexpression or knockdown of cGNPDA2 (P > 0.05).
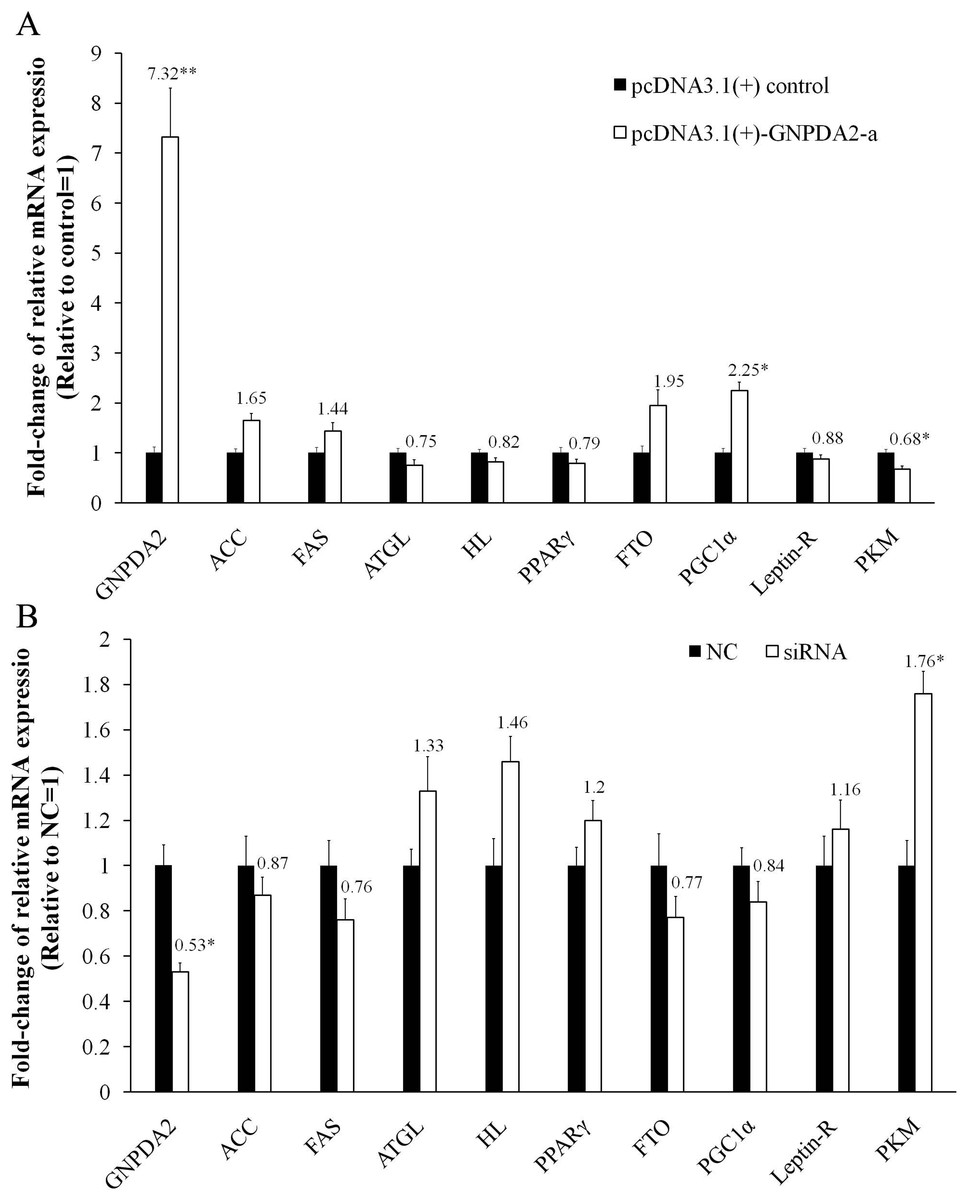
Figure 6: The changes of mRNA levels of related genes induced by cGNPDA2 overexpression (A) and siRNA interfering (B) in chicken preadipocytes.
Data are presented as the mean ± S.E.M (n = 5), ∗P < 0.05, ∗∗P < 0.01.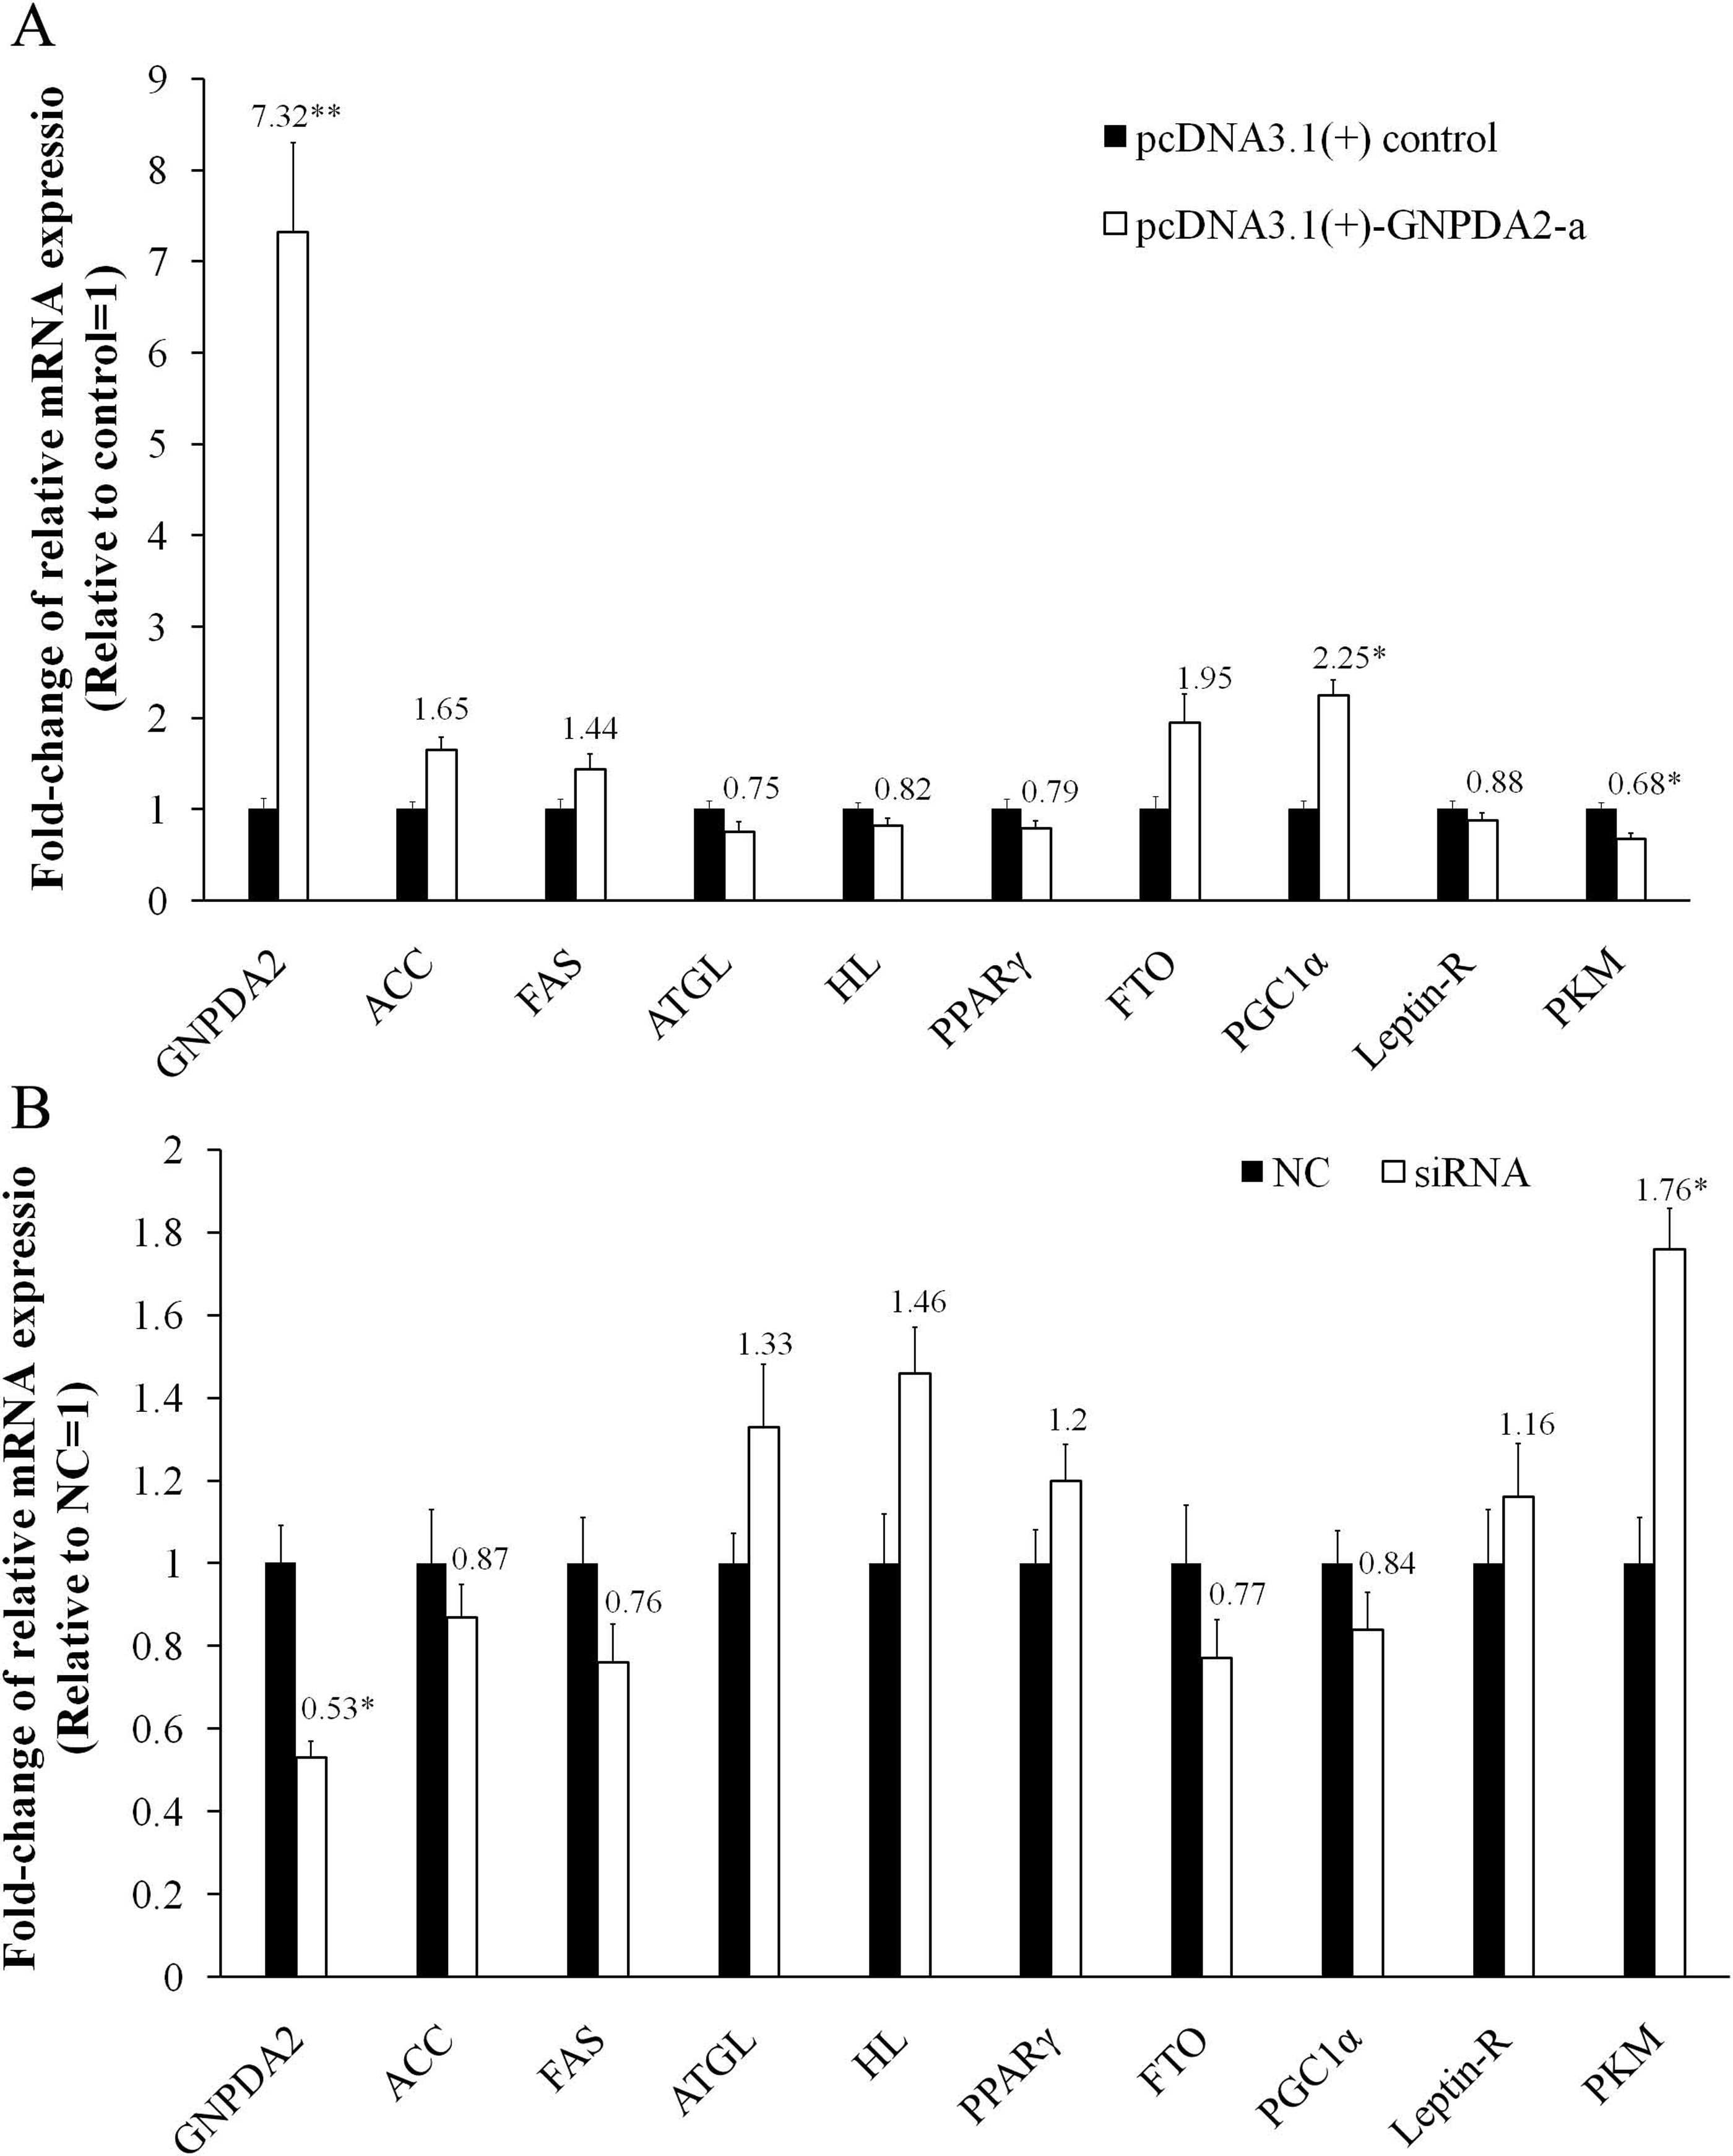
Discussion
GNPDA2 belongs to the GlcN6P subfamily, which encoded an allosteric enzyme of GlcN6P. Many GNPDA2 transcripts were previously characterized in mammals, such as human, mouse and pig (Leloir & Cardini, 1956; Arreola et al., 2003; Li et al., 2010). Four novel chicken GNPDA2 transcripts (cGNPDA2-a∼cGNPDA2-d) were identified in this study. The predominant transcript GNPDA2-a has conserved domain of GlcN6P and share 85.5% amino acid identity with the other chicken GlcN6P (GNPDA1). This result is similar to that reported in human GNPDA2, which also share 87% amino acid identity with human GNPDA1 (Arreola et al., 2003). Other chicken GNPDA2 transcripts encode different short peptide, and did not contain the domain of GlcN6P. GNPDA2 was reported to be conserved in mammalians (Arreola et al., 2003); here, we also used nucleotide BLAST analysis to detect homology between the amino acid sequence of GNPDA2 among 18 species, and the result showed that GNPDA2 was highly conserve among vertebrates, especially in birds.
The genomic structure of chicken GNPDA2 is similar with human and mouse; they both comprised seven exons and six introns. The chicken GNPDA2 gene spanned over 7 Kb in length and has many variations. Gene variations might have significant effects on animal biology function. Previous studies showed that SNPs of human GNPDA2 gene were associated with both BMI and body weight (Willer et al., 2009). Thus, we detected mutations of cGNPDA2 and performed an association analysis with chicken production traits in our F2 resource population. The results also showed that two of cGNPDA2 SNPs were associated with chicken body weight and fatness traits.
The GNPDA2 gene is expressed ubiquitously in mammalians (Arreola et al., 2003; Skarnes et al., 2011; Graff et al., 2013), and was found to be highly expressed in the hypothalamus of rats (Schmid et al., 2012). In the present study, we found the GNPDA2 gene expressed in 17 various tissues of both male and female chicken. It also predominantly expressed in hypothalamus, duodenum and adipose tissues (subcutaneous fat and abdominal fat), and the expression level were not significantly different between female and male chickens. GNPDA2 gene plays an important role in hexosamine signaling pathway, which is one of the main nutrient-sensing pathways in organisms (Marshall, 2006; Oikari et al., 2016). GNPDA2 may be regulated in response to nutrition status or by dietary components. Previously study reported that the mRNA level of GNPDA2 was down-regulated in the hypothalamus of rats fed with high fat diet (Ruth et al., 2011). In this study, we detected the change of GNPDA2 expression with high-glucose-fat diet and fasted/refed conditions in hypothalamus, adipose tissue and liver when compared with controls (basal diet). The results showed that the expression of chicken GNPDA2 gene was changed by different dietary status. Different genotypes of GNPDA2 gene also may changes the gene expression. Therefore, we detected the genotype of these chickens and compared the GNPDA2 expression level; the results showed that no significant difference were found among three different genotypes of both g.6667C > T and g.7393C > T. These results confirmed that the expression of GNPDA2 was regulated by both feeding/fasting and by consumption of the high-glucose-fat diet and suggests a role of GNPDA2 gene in fat and energy metabolism in chicken.
The regulation of fat metabolism, especially the function of GNPDA2 in chicken preadipocytes (lipogenesis) is not yet clearly understood. We have found that variations of cGNPDA2 were associated with chicken body weight and fatness traits. To further identify the functions of GNPDA2, we performed overexpression and siRNA interfering of GNPDA2 in preadipocytes, and detected the change of fat and energy metabolism related genes. The results showed that the effects of GNPDA2 on fat metabolism related gene were minor and are not significant (P > 0.05), such as fat synthesis gene (ACC and FAS), lipolysis gene (ATGL and HL), and preadipocytes differentiation gene (PPARγ). However, PGC1α, a key transcriptional coactivator of energy metabolism, was increased after overexpression of GNPDA2 (Espinoza & Patti, 2005; Schuler et al., 2006). PMK was down-regulated by GNPDA2, which plays a crucial role on glucose and energy metabolism (Yang, 2015). These results suggest that GNPDA2 might regulate energy metabolism through PGC1α and PMK, but the clear role of chicken GNPDA2 in the regulation of fat and energy metabolism pathway still needs further study.
Conclusions
In conclusion, herein we identified four novel chicken GNPDA2 transcripts. The chicken GNPDA2 gene was predominantly expressed in hypothalamus and adipose tissues. Its expression was regulated by both feeding/fasting and by consumption of the high-glucose-fat diet as compared with that of the controls. Overexpression of GNPDA2 in chicken preadipocytes promoted the expression of PGC1α but inhibited PKM. Two SNPs of cGNPDA2 gene were found to be markedly associated with body weight and fatness traits in chickens. Our data suggest that the GNPDA2 gene is related to body weight, fat and energy metabolism in chickens.
Supplemental Information
Homology analysis of GNPDA2 AA among 18 species
(A) Residue substitutions table of homology analysis results. (B) Phylogenetic tree of 18 species based on GNPDA2 homology. Numbers along branch are identities between adjacent species, and the scale line indicates the average genetic distance. Neighbor joining method was used to construct this phylogenetic tree, and the bootstrap value was set as 100.
Four Supplemental tables
Table S1. Nutrient information of high-glucose-fat diet. Table S2. Detailed information of primers and siRNAs of GNPDA2. Table S3. Detailed information of real-time PCR primers. Table S4. Amino acids sequences of GNPDA2 in 18 species.