
Identification of lncRNAs associated with lung squamous cell carcinoma prognosis in the competitive endogenous RNA network
- Published
- Accepted
- Received
- Academic Editor
- Vera Pancaldi
- Subject Areas
- Bioinformatics, Oncology, Respiratory Medicine
- Keywords
- Long noncoding RNA, Lung squamous cell carcinoma, Prognosis model, The competive endogenous RNA network, Overall survival
- Copyright
- © 2019 Qi et al.
- Licence
- This is an open access article distributed under the terms of the Creative Commons Attribution License, which permits using, remixing, and building upon the work non-commercially, as long as it is properly attributed. For attribution, the original author(s), title, publication source (PeerJ) and either DOI or URL of the article must be cited.
- Cite this article
- 2019. Identification of lncRNAs associated with lung squamous cell carcinoma prognosis in the competitive endogenous RNA network. PeerJ 7:e7727 https://doi.org/10.7717/peerj.7727
Abstract
Background
Long noncoding RNAs (lncRNAs) play a role in the formation, development, and prognosis of various cancers. Our study aimed to identify prognostic-related lncRNAs in lung squamous cell carcinoma (LUSC), which may provide new perspectives for individualized treatment of patients.
Materials and Methods
The RNA sequencing (lncRNA, microRNA (miRNA), mRNA) data and clinical information related to LUSC were obtained from The Cancer Genome Atlas (TCGA) database. Differentially expressed RNA sequences were used to construct the competitive endogenous RNA (ceRNA) network. In present study, we mainly used two prognostic verification methods, Cox analysis and survival analysis, to identify the prognostic relevance of specific lncRNAs and construct prognostic model of lncRNA.
Results
Datasets on 551 samples of lncRNA and mRNA and 523 miRNA samples were retrieved from the TCGA database. Analysis of the normal and LUSC samples identified 170 DElncRNAs, 331 DEmiRNAs, and 417 DEmRNAs differentially expressed RNAs. The ceRNA network contained 27 lncRNAs, 43 miRNAs, and 11 mRNAs. Furthermore, we identified seven specific lncRNAs (ERVH48-1, HCG9, SEC62-AS1, AC022148.1, LINC00460, C5orf17, LINC00261) as potential prognostic factors after correlation analysis, and five of the seven lncRNAs (AC022148.1, HCG9, LINC00460, C5orf17, LINC00261) constructed a prognostic model of LUSC.
Conclusion
In present study, we identified seven lncRNAs in the ceRNA network that are associated with potential prognosis in LUSC patients, and constructed a prognostic model of LUSC which can be used to assess the prognosis risk of clinical patients. Further biological experiments are needed to elucidate the specific molecular mechanisms underlying them.
Introduction
For both males and females, lung cancer is the most common malignant tumor (11.6% of general cases) and the leading cause of cancer deaths (accounting for 18.4% of cancer deaths) (Bray et al., 2018). Approximately 85% of patients with non-small cell lung cancer are diagnosed with lung squamous cell carcinoma (LUSC), which is the major subtype of non-small cell lung cancer (Siegel, Miller & Jemal, 2017). Unlike other cancers, due to the lack of clear histological features (Coudray et al., 2018), there are no specific individualized treatment strategies for conventional radiotherapy, chemotherapy or targeted therapy of LUSC, although some treatments are clinically effective (Derman et al., 2015; Masters, Johnson & Temin, 2016). This situation is due in large part to the limited knowledge of the molecular mechanisms of LUSC in existing studies (Choi et al., 2017; Cardarella & Johnson, 2013; Guo et al., 2019). Therefore, identifying potential prognostic markers is critical to improving the efficiency of LUSC treatment and ameliorating its prognosis.
Long noncoding RNAs (lncRNAs) are non-coding RNAs greater than 200 nucleotides in length. Studies have shown that lncRNAs play an important role in many biological processes such as the dose compensation effect as well as epigenetic, cell cycle and cell differentiation regulation, and has become a hot research topic in genetics (Kopp & Mendell, 2018). With the development of high-throughput sequencing and RNA analysis technology, the possible role of lncRNA in cancer is being comprehensively studied (Wu et al., 2019; Zhang et al., 2019). A growing body of research has shown that lncRNAs play a role in the formation, development and prognosis of a variety of cancers (Wang et al., 2018), including prostate cancer (Zhang et al., 2018), hepatocellular carcinoma (Yuan et al., 2017), gastric cancer (Sun et al., 2016), and lung cancer (Seiler et al., 2017); what’s more, the concept of competitive endogenous RNA (ceRNA) has revealed a new mechanism for interaction between RNAs which has broadened our understanding of lncRNA function (Salmena et al., 2011). The regulation of lncRNAs in ceRNA networks has been partially confirmed by related studies (Karreth & Pandolfi, 2013), but there has been few research on LUSC.
Therefore, our work aims to identify potential prognosis lncRNAs for LUSC. The Cancer Genome Atlas (TCGA) database provides multidimensional information for cancer research. In our study, sequence data and clinical information on lncRNA, microRNA (miRNA) and mRNA in samples from LUSC patients was retrieved from the TCGA database, and the lncRNA-miRNA-mRNA ceRNA network was constructed. In order to improve the reliability of our research, we used data from the Gene Expression Omnibus (GEO) database to confirm the results. In present study, the specific lncRNAs identified based on ceRNA network will provide a new theoretical basis for the prognosis and targeted therapy of LUSC patients.
Materials and Methods
Collection of relevant data from the TCGA database
We selected the TCGA database (https://cancergenome.nih.gov/) to gather LUSC-related RNA sequencing (RNA-Seq) data and clinical information. The RNA-seq data includes three types of RNA, lncRNA, miRNA and mRNA. And the exclusion criteria were as follows (1) two or more malignant tumors coexist in same sample, and (2) the sample was deficient in clinical information. After culling, samples with complete clinical information and gene expression matrices were included in this study.
Data preprocessing and differential analysis of genes
In order to improve the reliability of the analytical data, we filtered the raw data retrieved from TCGA database and standardized the RNA-Seq (including lncRNA, miRNA and mRNA) and clinical data by the trimmed mean of M-values method. The filter criteria are set to ensure that (1) at least 25% of the sample is removed, and (2) the expression value of the gene is greater than 2. Then, the edgeR R software package was used to identify differentially expressed lncRNAs (DElncRNA), miRNAs (DEmiRNA) and mRNAs (DEmRNA) in the RNA matrix and FDR, |logFC| and P-values were calculated. The limit of value is that FDR < 0.01, |logFC| > 1 and P-value < 0.01. The R software packages ggplot2 was used to create volcano plots and heatmaps respectively in order to visualize the results of the differential genetic analysis.
Construction of the ceRNA network
Competitive endogenous RNAs can bind to miRNAs through miRNA response elements (MREs), which affects the expression of genes regulated by miRNAs (An, Furber & Ji, 2017; Qi et al., 2015). What’s more, lncRNAs compete with each other to interact with miRNAs making them ceRNAs (Fiscon et al., 2018). Given this theoretical basis, we constructed a ceRNA network for lncRNA-miRNA-mRNA interactions using the following steps: (1) differentially expressed RNAs (DElncRNA, DEmiRNA, DEmRNA) with a FDR < 0.01, |logFC| > 1 and P-value < 0.01 were retained, and (2) the online tool, miRcode (http://www.mirdb.org/), was applied to predict the interaction and regulation relationships between the lncRNAs and miRNAs, and (3) two online sites, StarBase (http://starbase.sysu.edu.cn), TargetScanHuman (http://www.targetscan.org), were used to predict target genes for the miRNAs. Next, the results of the intersecting genes were determined using a Venn diagram. After comparison and prediction, we identified a certain number of lncRNAs, miRNAs and mRNAs and the relationship between the three of them. The ceRNA network map was finally obtained by visualizing the three types of RNAs and their interactions using Cytoscape (version 3.6.1).
Gene ontology enrichment analysis
Through the Gene ontology (GO) annotations of differentially expressed genes, GO classification entries enriched with differential genes can be found, and it is possible to find differential genes in different samples which may be related to changes in gene function (Ashburner et al., 2000). There is a link between lncRNA and its corresponding mRNA in terms of potential biological function. Therefore, we performed GO functional enrichment analysis on DEmRNAs in the ceRNA network using DAVID (an online functional annotation tool, https://david.ncifcrf.gov/) terms with a P-value < 0.05 were considered significant in biological processes. In addition, we performed GO enrichment analysis on all 417 DEmRNAs and compared GO terms between all 417 DEmRNAs and 11 mRNAs.
Verification of prognosis-related RNAs and construction of prognostic model
We utilized the survival package to generate Kaplan–Meier separate survival analysis and log-rank tests for the DElncRNAs and DEmiRNAs in the ceRNA network to correlate them with overall survival of LUSC patients, a P-value < 0.05 was considered statistically significant. Datasets (GSE8569, GSE21933, GSE33479, GSE40275) from the GEO database (https://www.ncbi.nlm.nih.gov/gds/) were used to validate the correlation of DEmRNAs in the ceRNA network with survival. In addition, we used univariate Cox analysis to assess the risk score and overall survival correlation of the DElncRNAs, which was followed by multivariate Cox analysis to establish the lncRNAs prognostic model of LUSC.
The prognostic risk score for predicting overall survival was as follows: (where “exp” is the expression level of DElncRNAs, and “β” is the regression coefficient obtained from the multivariate Cox analysis), and we plotted the results using the survminer package of R software. LUSC patients were divided into high-risk group and low-risk group with a median risk score as the threshold. The survival receiver operating characteristic (ROC) package was used to map the ROC curve to explore the sensitivity of the 3-year survival rate of DElncRNAs to LUSC patients.
Results
Identification and screening of differentially expressed RNAs
Datasets on 551 samples (502 tumor, 49 normal) of lncRNA and mRNA and 523 miRNA samples (478 tumor, 45 normal) were retrieved from the TCGA database. Analysis of the normal and LUSC samples identified 170 DElncRNAs (95 down-regulated, 75 up-regulated), 331 DEmiRNAs (91 down-regulated, 240 up-regulated), and 417 DEmRNAs (109 down-regulated, 308 up-regulated) differentially expressed RNAs. Volcano plots visually demonstrating the distribution of DElncRNAs, DEmiRNAs and DEmRNAs are shown in Fig. 1.
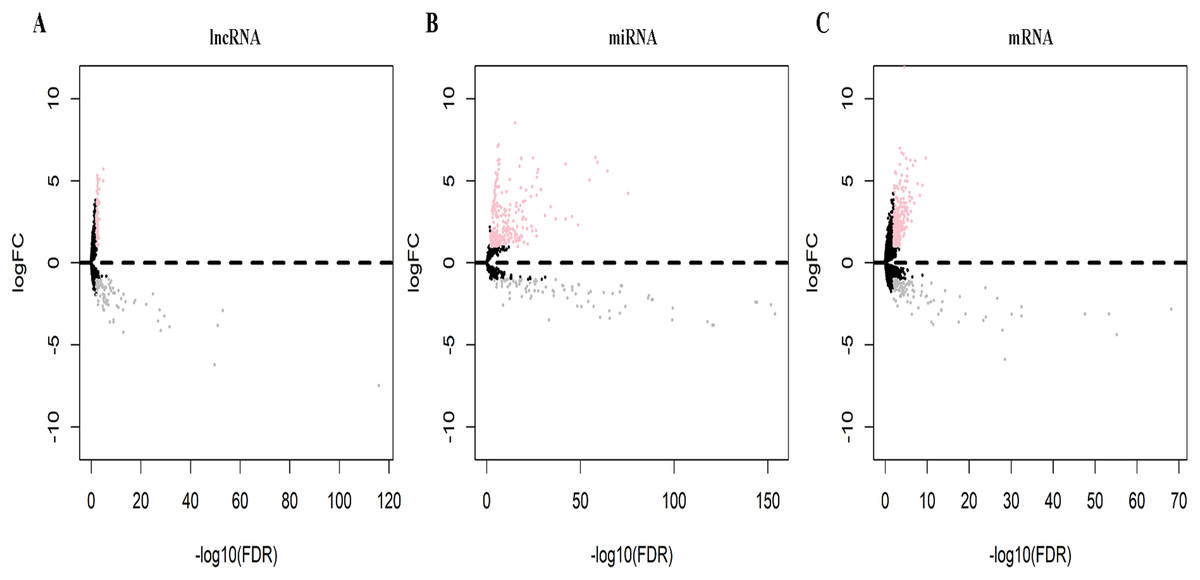
Figure 1: Volcano plots of differentially expressed RNAs (A, DElncRNAs; B, DEmiRNAs; C, DEmRNAs) in lung squamous cell carcinoma (LUSC).
Pink dot represents the up-regulated differential expression of the RNA, gray dot represents the down-regulated differential expression of the RNA, black spot represents the indifferentially expressed RNA.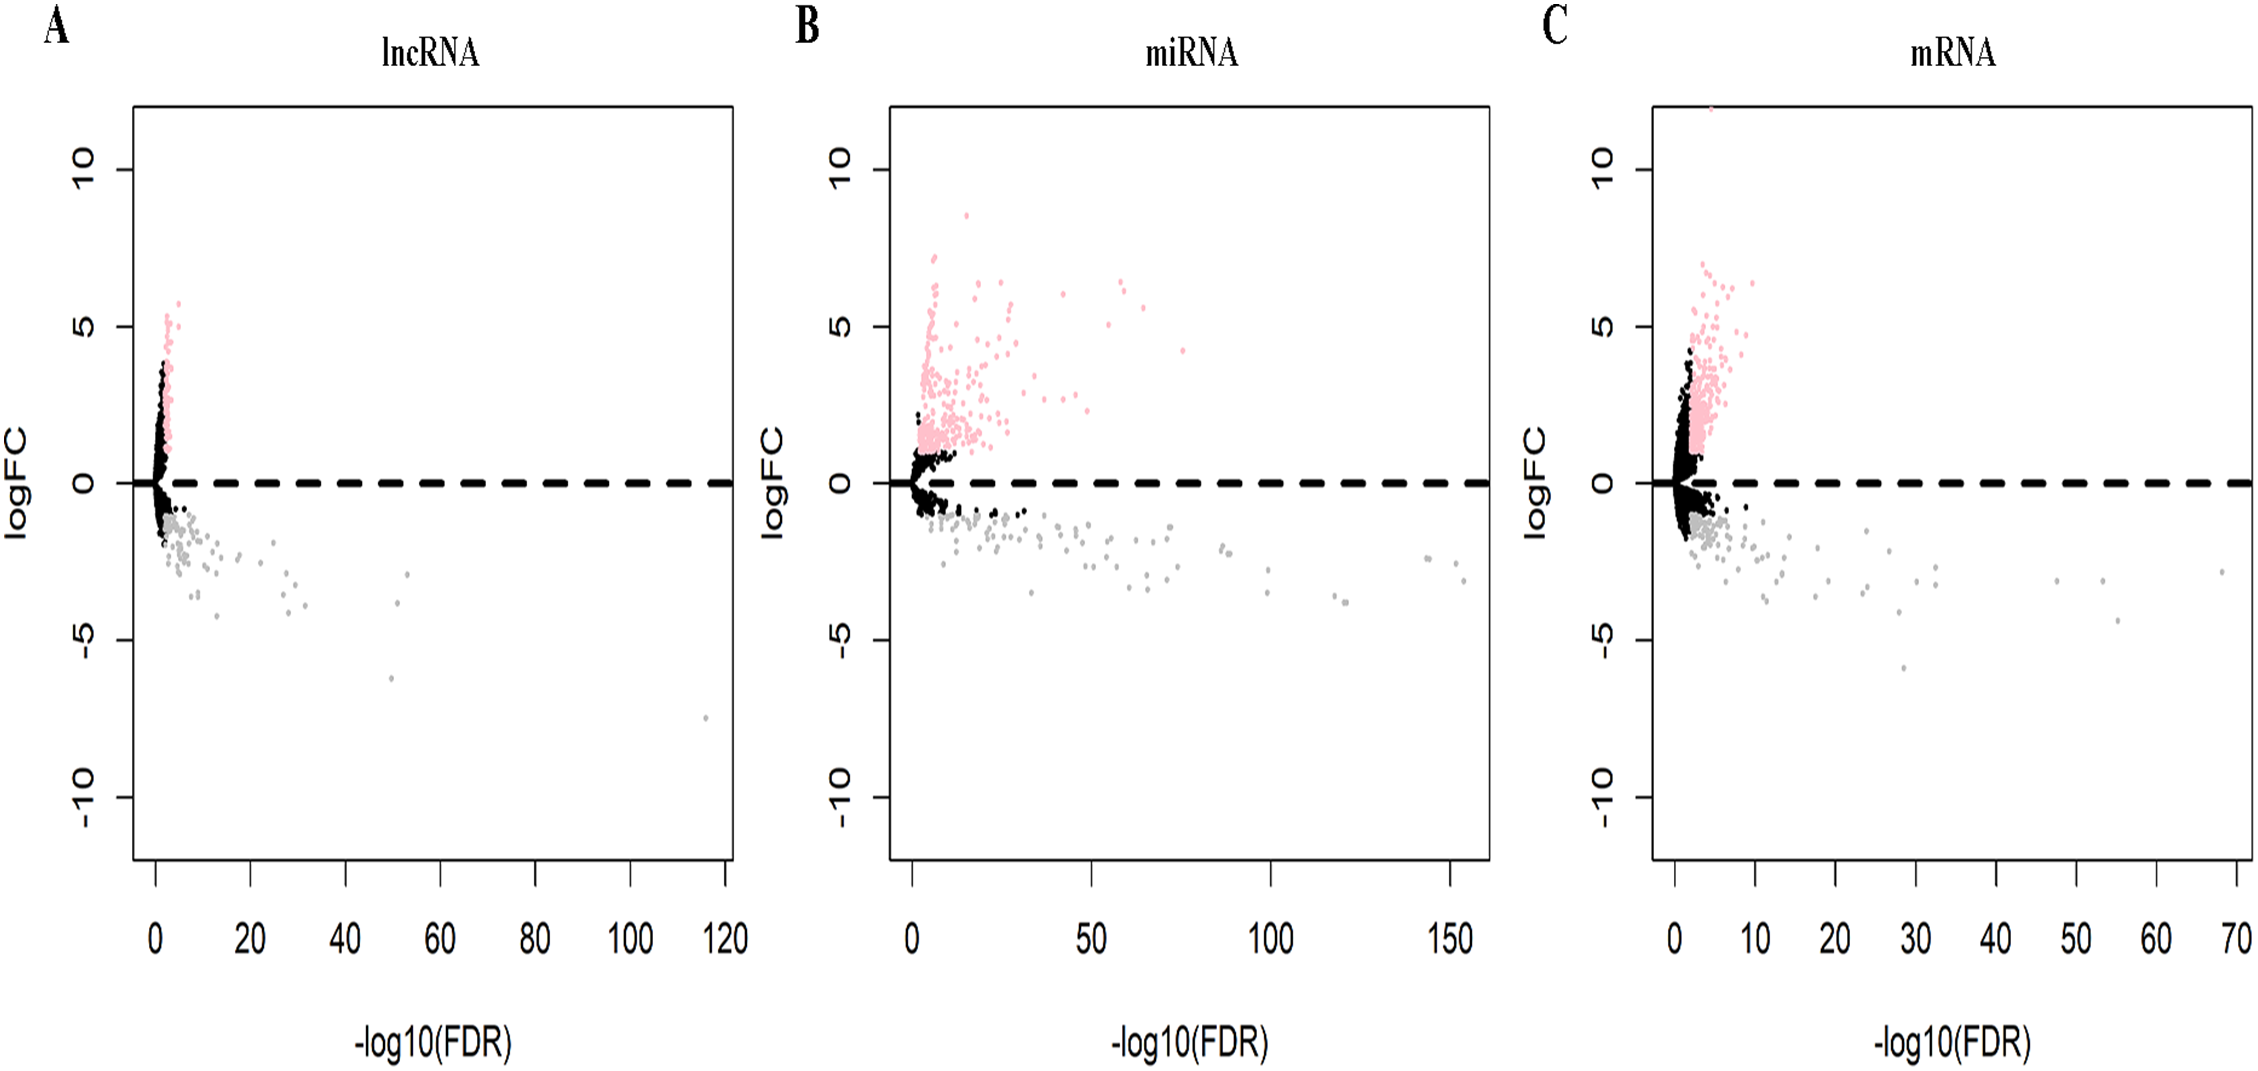
Construction of the ceRNA network
Elements from the differentially expressed RNAs were adopted to construct the ceRNA network of lncRNA-miRNA-mRNA. Since MREs are the mediators of lncRNA-miRNA interaction, we utilized the miRcode online website to identify relationships between the 170 DElncRNAs and 331 DEmiRNAs. The interactions between the DEmiRNAs and 417 DEmRNAs were then assessed using StarBase and TargetScanHuman, and the target genes of the miRNAs were predicted. After processing the collected data, we identified the connections between DElncRNAs, DEmiRNAs and DEmRNAs in the ceRNA network. The lncRNA-miRNA-mRNA ceRNA network consisted of 27 lncRNAs (13 down-regulated, 14 up-regulated, Table 1), 43 miRNAs (14 down-regulated, 29 up-regulated, Table 2) and 11 mRNAs (two down-regulated, nine up-regulated, Table 3) which was visualized with the Cytoscape software package, as that shown in Fig. 2.
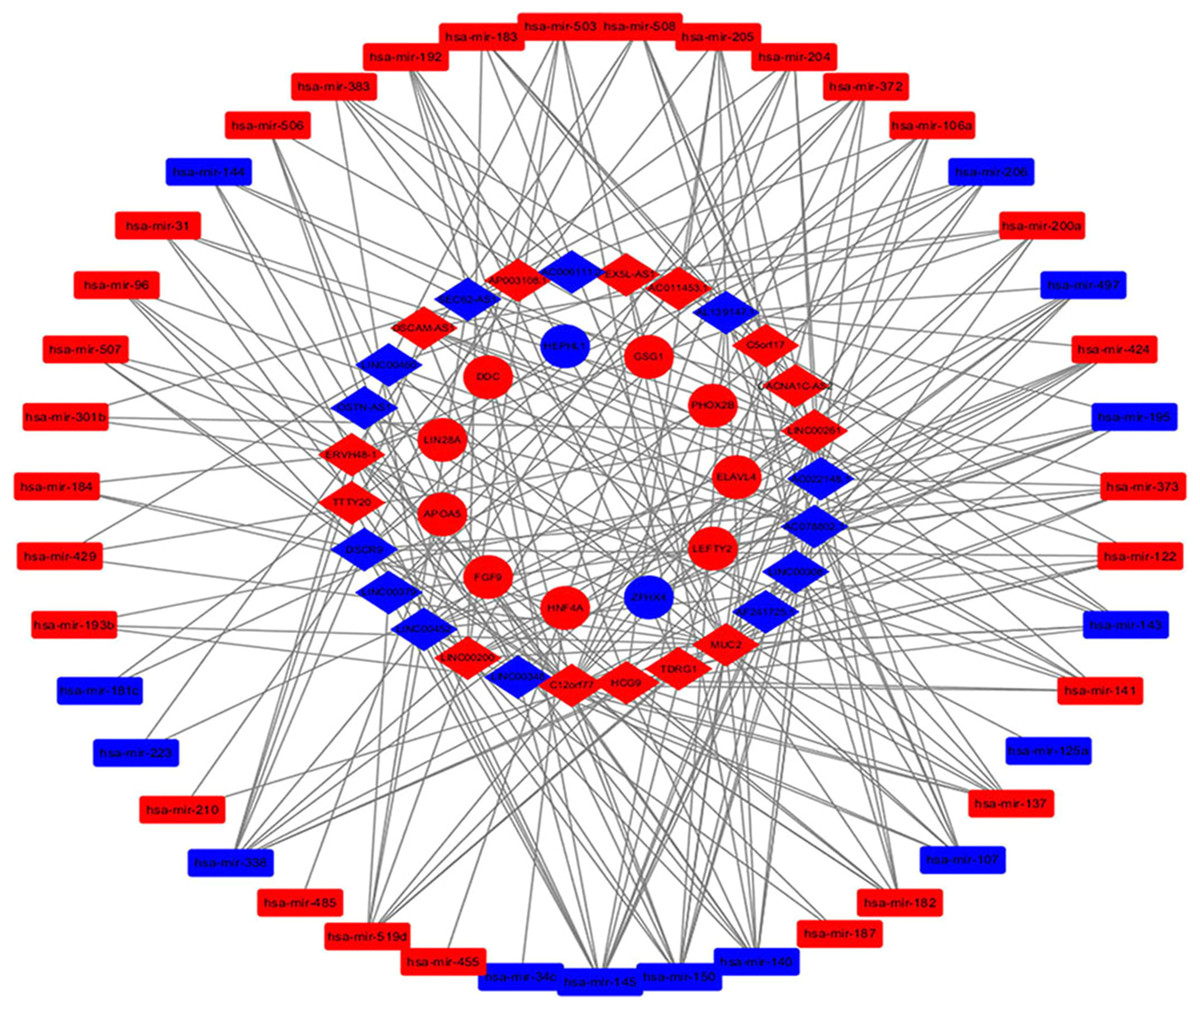
Figure 2: The lncRNA-miRNA-mRNA competitive endogenous (ceRNA) network.
Diamonds represent lncRNAs, rectangles represent miRNAs, and circles represent mRNAs; Red, up-regulation; blue, down regulation.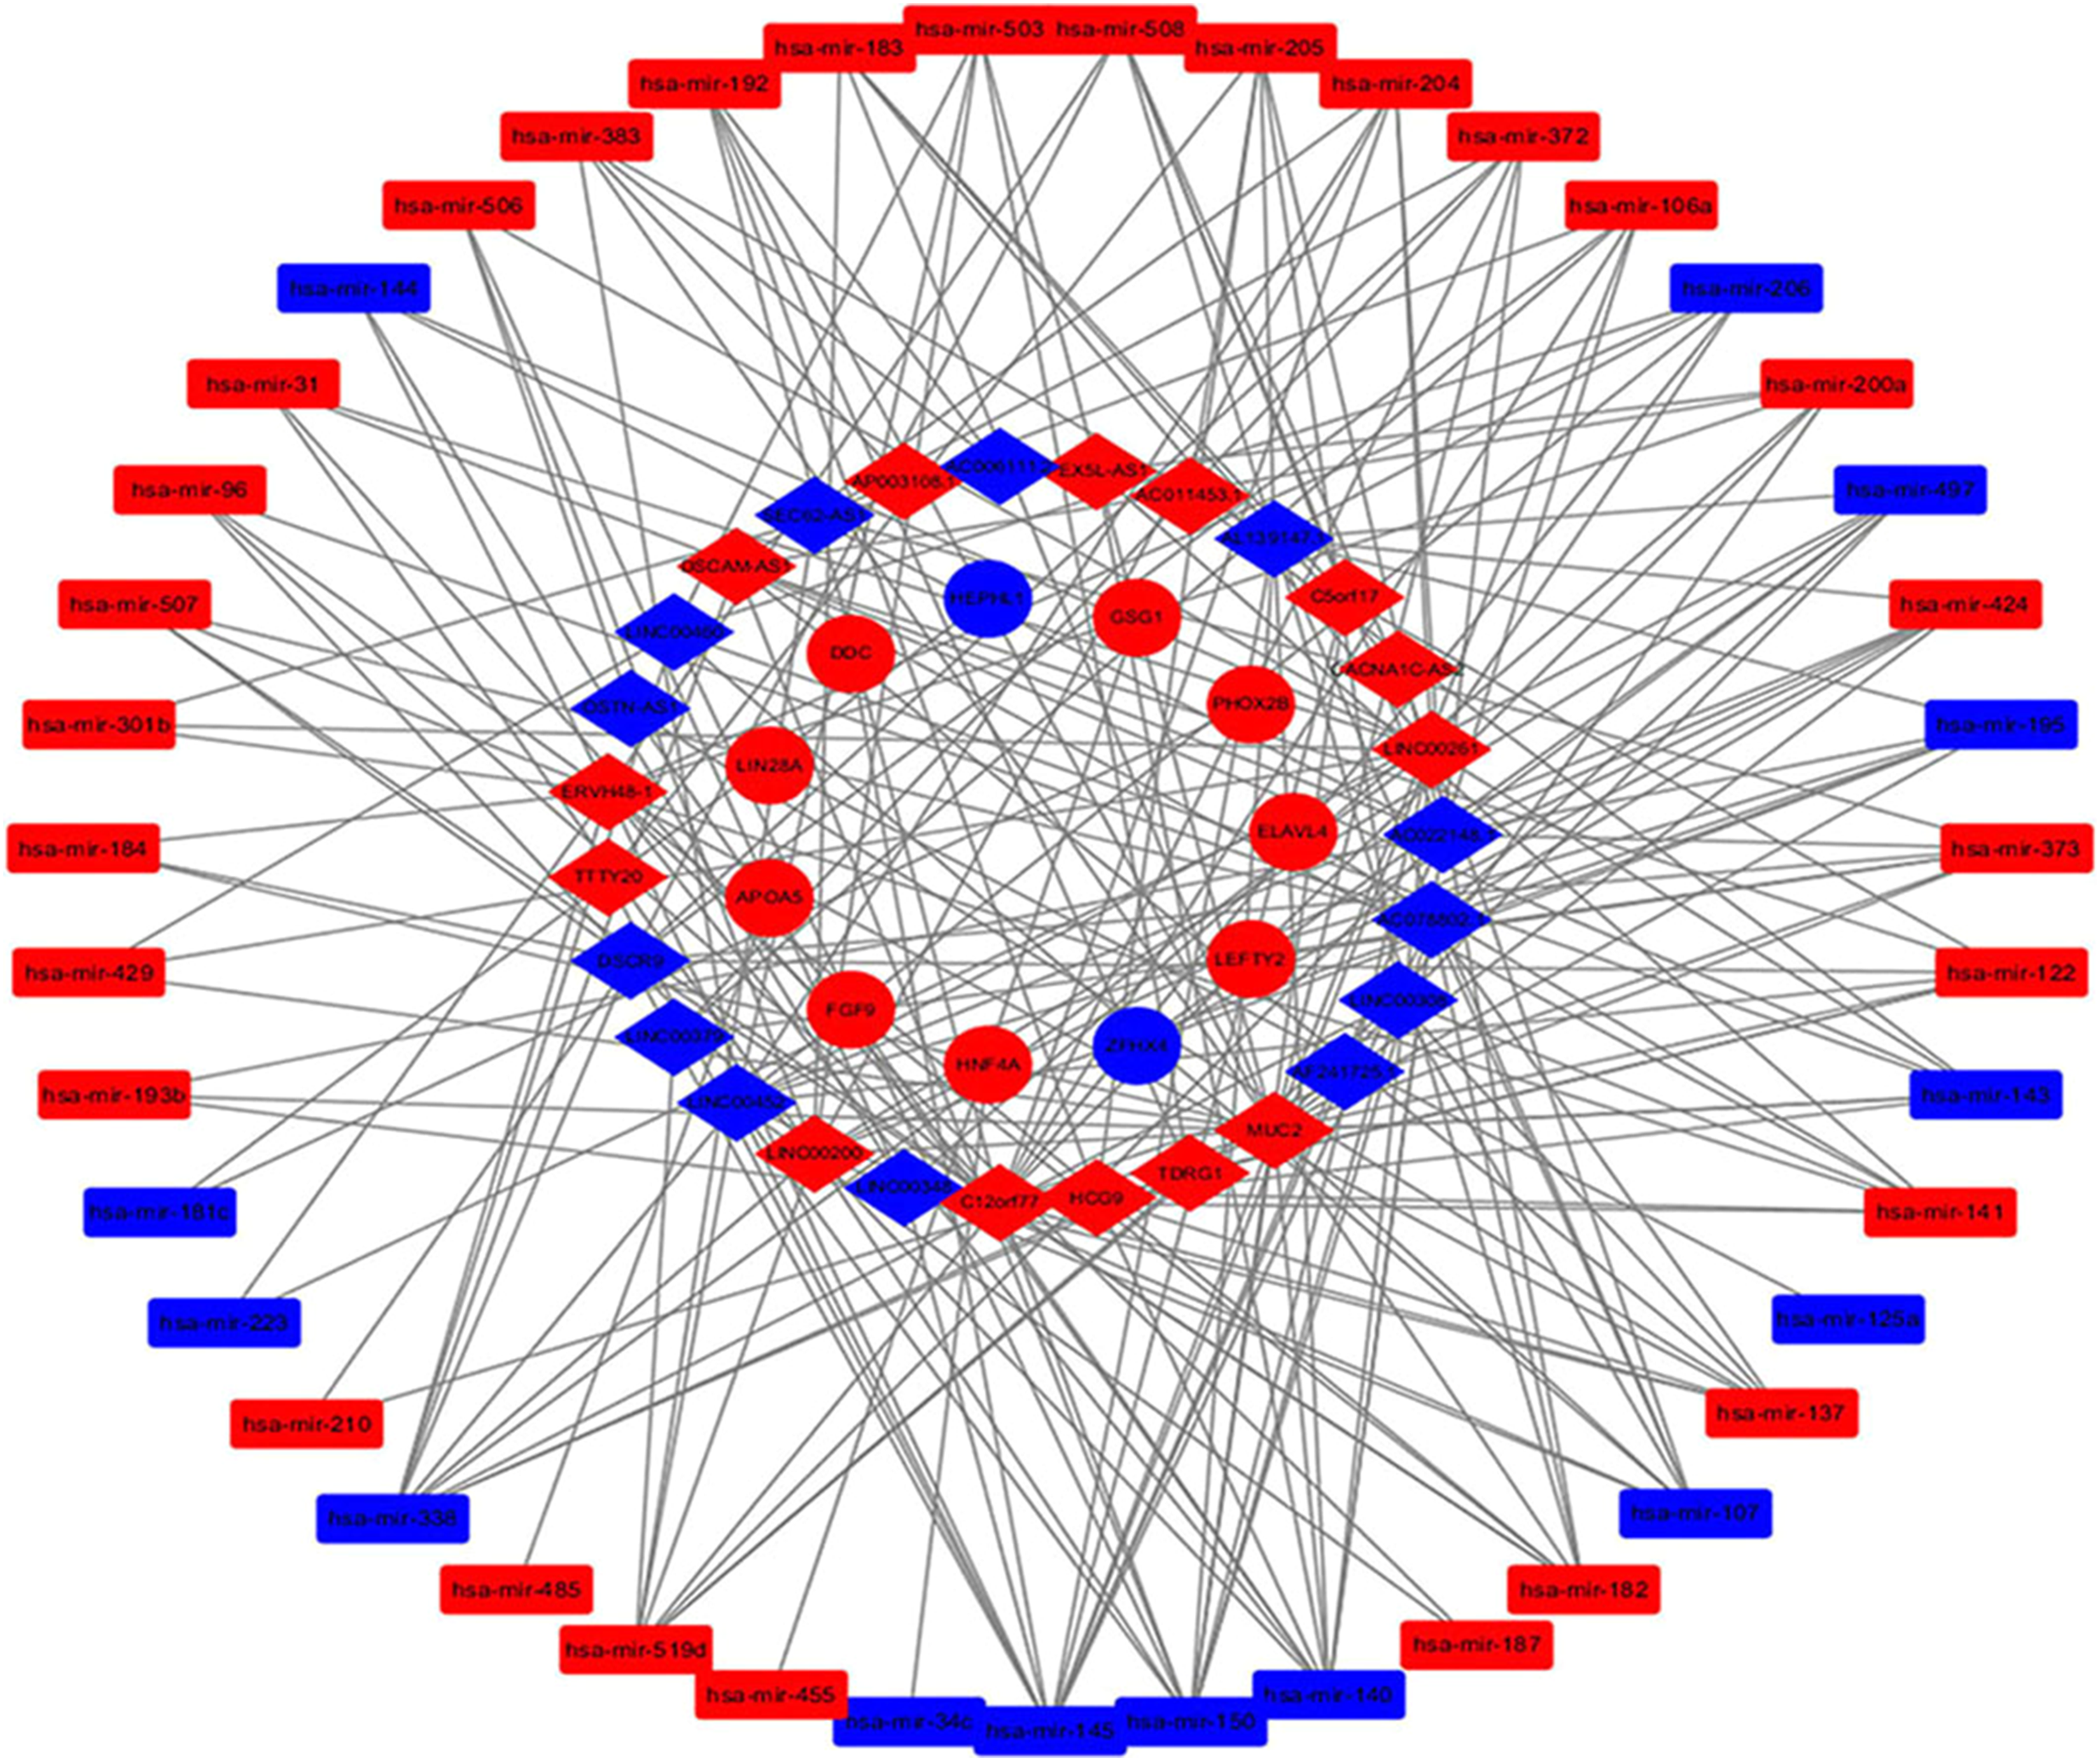
| lncRNA | logFC | P-value | FDR |
|---|---|---|---|
| AC022148.1 | −1.22769209 | 1.53E-05 | 0.001458804 |
| AC078802.1 | −1.188321037 | 6.05E-11 | 1.8E-08 |
| LINC00308 | −1.691498698 | 0.000108666 | 0.00608259 |
| AF241725.1 | −3.618368756 | 1.09E-10 | 3.06E-08 |
| MUC2 | 2.717963118 | 3.06E-05 | 0.002499606 |
| TDRG1 | 2.517216708 | 0.00020126 | 0.009470266 |
| HCG9 | 1.109283012 | 9.7E-06 | 0.001046319 |
| C12orf77 | 2.589970135 | 3.01E-05 | 0.002499606 |
| LINC00348 | −2.134854747 | 8.76E-08 | 1.43E-05 |
| LINC00200 | 4.214062982 | 2.27E-05 | 0.002016136 |
| LINC00452 | −3.818163377 | 3.46E-55 | 1.03E-51 |
| LINC00379 | −4.237133444 | 2.36E-16 | 1.32E-13 |
| DSCR9 | −1.904132736 | 1.57E-28 | 1.4E-25 |
| TTTY20 | 5.32296051 | 4.67E-05 | 0.003388398 |
| ERVH48-1 | 2.050090632 | 7.75E-05 | 0.004922008 |
| OSTN-AS1 | −2.176258452 | 2.11E-15 | 1.05E-12 |
| LINC00460 | −1.236654671 | 9.96E-05 | 0.005680506 |
| DSCAM-AS1 | 3.729458571 | 3.66E-05 | 0.002847536 |
| SEC62-AS1 | −1.10916205 | 2.89E-11 | 9.58E-09 |
| AP003108.1 | 2.335384343 | 0.000111817 | 0.006181707 |
| AC006111.2 | −1.003635081 | 3.81E-10 | 9.75E-08 |
| PEX5L-AS1 | 4.973540045 | 3.3E-05 | 0.002637378 |
| AC011453.1 | 2.269153018 | 0.000189415 | 0.009160309 |
| AL139147.1 | −1.560450349 | 5.56E-11 | 1.72E-08 |
| C5orf17 | 2.6306622 | 3.53E-05 | 0.002772444 |
| CACNA1C-AS2 | 1.036243554 | 4.26E-05 | 0.003153043 |
| LINC00261 | 1.826424051 | 0.000184699 | 0.008990016 |
| miRNA | logFC | P-value | FDR |
|---|---|---|---|
| hsa-mir-106a | 1.204542323 | 1.79324E-08 | 5.07705E-08 |
| hsa-mir-372 | 7.211115986 | 1.77878E-07 | 4.6798E-07 |
| hsa-mir-373 | 5.491263047 | 5.57042E-06 | 1.16791E-05 |
| hsa-mir-140 | −2.145012335 | 1.53063E-88 | 7.90041E-87 |
| hsa-mir-144 | −3.596239815 | 1.48485E-120 | 1.42334E-118 |
| hsa-mir-145 | −1.523223033 | 1.10263E-47 | 1.84966E-46 |
| hsa-mir-195 | −1.989967259 | 4.44425E-89 | 2.48508E-87 |
| hsa-mir-424 | 1.314733704 | 3.32903E-17 | 1.70517E-16 |
| hsa-mir-497 | −1.773975357 | 2.21392E-73 | 8.25299E-72 |
| hsa-mir-519d | 2.74891462 | 0.000453143 | 0.000732672 |
| hsa-mir-193b | 1.678689637 | 1.14722E-16 | 5.66018E-16 |
| hsa-mir-204 | 1.240774752 | 0.002222996 | 0.003242675 |
| hsa-mir-205 | 5.590239194 | 1.11276E-66 | 3.24635E-65 |
| hsa-mir-508 | 1.153563579 | 0.004202669 | 0.005862767 |
| hsa-mir-31 | 5.2212886 | 1.51878E-28 | 1.49868E-27 |
| hsa-mir-96 | 2.685751917 | 1.04143E-38 | 1.3702E-37 |
| hsa-mir-507 | 1.778592543 | 0.001555683 | 0.002340501 |
| hsa-mir-137 | 2.7927536 | 3.21271E-07 | 8.29126E-07 |
| hsa-mir-150 | −1.11711056 | 4.26164E-11 | 1.52918E-10 |
| hsa-mir-182 | 1.939944519 | 6.04088E-26 | 5.13093E-25 |
| hsa-mir-107 | −1.021389186 | 1.01701E-38 | 1.36483E-37 |
| hsa-mir-141 | 1.613009544 | 2.58646E-28 | 2.47931E-27 |
| hsa-mir-200a | 1.397198311 | 3.14653E-19 | 1.84878E-18 |
| hsa-mir-338 | −2.653720029 | 1.7246E-76 | 7.71471E-75 |
| hsa-mir-503 | 2.067221998 | 3.92717E-23 | 2.89575E-22 |
| hsa-mir-143 | −1.855474343 | 1.58774E-56 | 3.43669E-55 |
| hsa-mir-183 | 2.684152732 | 5.5481E-44 | 8.09299E-43 |
| hsa-mir-184 | 1.541248557 | 0.006683239 | 0.009096255 |
| hsa-mir-192 | 1.189417464 | 1.08144E-06 | 2.5551E-06 |
| hsa-mir-429 | 1.282775787 | 3.14783E-13 | 1.29582E-12 |
| hsa-mir-210 | 4.222814074 | 6.21437E-78 | 2.97846E-76 |
| hsa-mir-122 | 5.475024505 | 6.36543E-06 | 1.32235E-05 |
| hsa-mir-383 | 3.23391922 | 1.6056E-05 | 3.18745E-05 |
| hsa-mir-206 | −2.567004308 | 5.95329E-10 | 1.92051E-09 |
| hsa-mir-506 | 1.554323985 | 0.002916241 | 0.004136993 |
| hsa-mir-187 | 1.212237918 | 9.54276E-05 | 0.000169846 |
| hsa-mir-301b | 3.430526866 | 6.74228E-36 | 8.22558E-35 |
| hsa-mir-223 | −1.420618542 | 1.61845E-17 | 8.61887E-17 |
| mRNA | logFC | P-value | FDR |
|---|---|---|---|
| FGF9 | 1.61326903 | 2.26333E-06 | 0.000252016 |
| LIN28A | 2.797827119 | 6.13483E-06 | 0.00055381 |
| DDC | 2.334079077 | 7.64372E-06 | 0.000667239 |
| HEPHL1 | −1.322084771 | 2.1341E-05 | 0.001451956 |
| ELAVL4 | 1.474052098 | 2.27E-05 | 0.001516243 |
| APOA5 | 2.500418268 | 3.44584E-05 | 0.002104578 |
| ZFHX4 | −1.001356548 | 3.89705E-05 | 0.002318933 |
| PHOX2B | 4.694250508 | 0.000148939 | 0.006179984 |
| HNF4A | 1.652513288 | 0.00015419 | 0.006303464 |
| GSG1 | 1.653322746 | 0.000215112 | 0.008074781 |
| LEFTY2 | 1.32763658 | 0.000245332 | 0.008904518 |
Description of GO enrichment analysis
To clearly comprehend the biological functions of the DElncRNAs in LUSC patients, we analyzed the mRNAs of the ceRNA network and identified the GO terms regulated by the lncRNAs. GO functional enrichment analysis covers three biological aspects, molecular function (MF), biological process (BP) and cellular component (CC). Based on a P-value < 0.05, the 11 mRNAs identified in our study played a major role in BP and MF, and four terms (triglyceride homeostasis, positive regulation of neuron differentiation, SMAD protein signal transduction, mRNA binding) were considered valuable. Similarly, the GO terms for all 417 DEmRNAs are also concentrated in BP and MF which cover the four GO terms of 11 mRNAs in the ceRNA network. Therefore, the differential RNA and ceRNA networks we identified in this study are of biological significance.
Verification of prognosis-related RNAs and construction of prognostic model
Three lncRNAs (ERVH48-1, HCG9, and SEC62-AS1) and 5 miRNAs (hsa-mir-223, hsa-mir-301b, hsa-mir-338, hsa-mir-383, and hsa-mir-424) were identified as being significantly associated with the overall survival of LUSC patients by Kaplan–Meier survival analysis and log-rank test (P < 0.05). Among them, when the three lncRNAs (ERVH48-1, HCG9, and SEC62-AS1) and two miRNAs (hsa-mir-223, hsa-mir-338) were highly expressed, the prognosis of LUSC patients were poor also, the 1-year overall survival rate of patients with high expression of these three miRNAs (hsa-mir-301b, hsa-mir-383, hsa-mir-424) is higher than that of patients with low expression (Figs. 3 and 4). In addition, after filtration and calibration in the two tumor databases TCGA and GEO, four mRNAs (DDC, FGF9, GSG1, LEFTY2) were also identified as being associated with overall survival. When GSG1 was down-regulated and DDC, FGF9, and LEFTY2 were up-regulated, patients had a long survival period (red, high-expression; black, low-expression) (Fig. 5). Furthermore, univariate Cox analysis identified six lncRNAs as meaningful (Table 4), while only five lncRNAs (AC022148.1, HCG9, LINC00460, C5orf17, LINC00261) were still associated with prognosis in multivariate Cox analysis. And risk score analysis identified that the high-risk group had a worse prognosis than the low-risk group (Fig. 6). Combining the results of Kaplan–Meier analysis with Cox analysis, we obtained seven prognostic-related lncRNAs (ERVH48-1, HCG9, SEC62-AS1, AC022148.1, LINC00460, C5orf17, LINC00261). It is worth noting that HCG9 is meaningful in both Kaplan–Meier analysis and Cox analysis. The ROC curve was consistent with the results of the multivariate analysis with the area under the curve of 3-year survival of 0.63, which indicated its utility as a prognostic model for predicting the survival status of LUSC (Fig. 7).
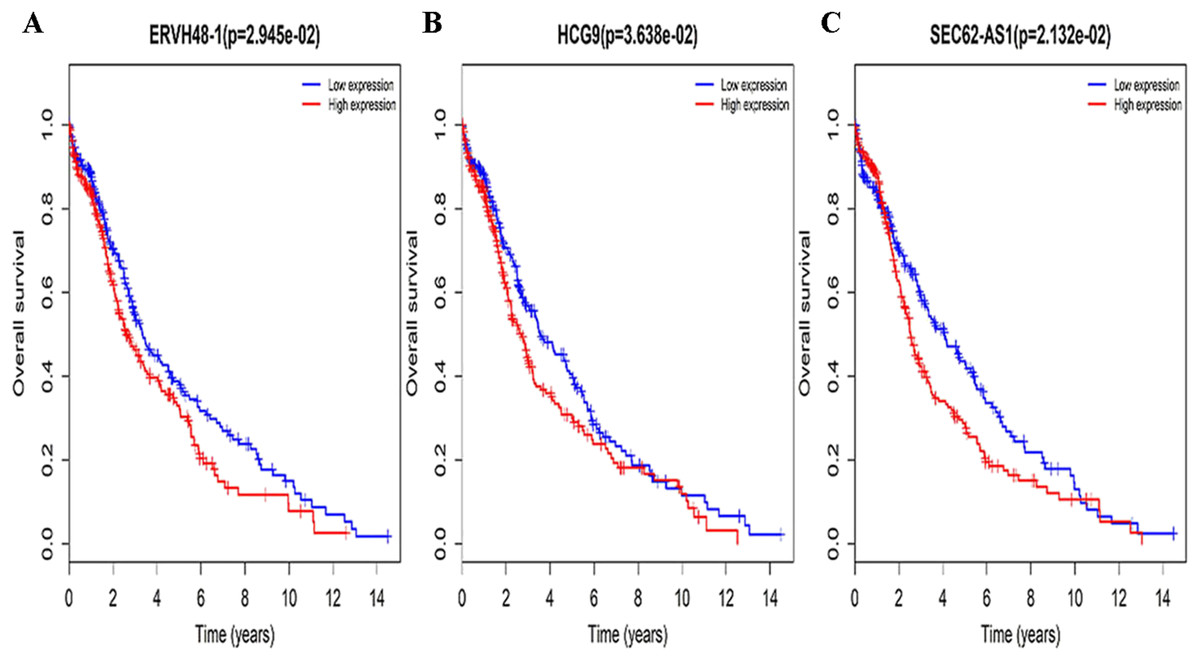
Figure 3: Survival curves for DElncRNAs that are associated with the overall survival (OS) of LUSC patients.
(A) ERVH48-1, (B) HCG9, (C) SEC62-AS1.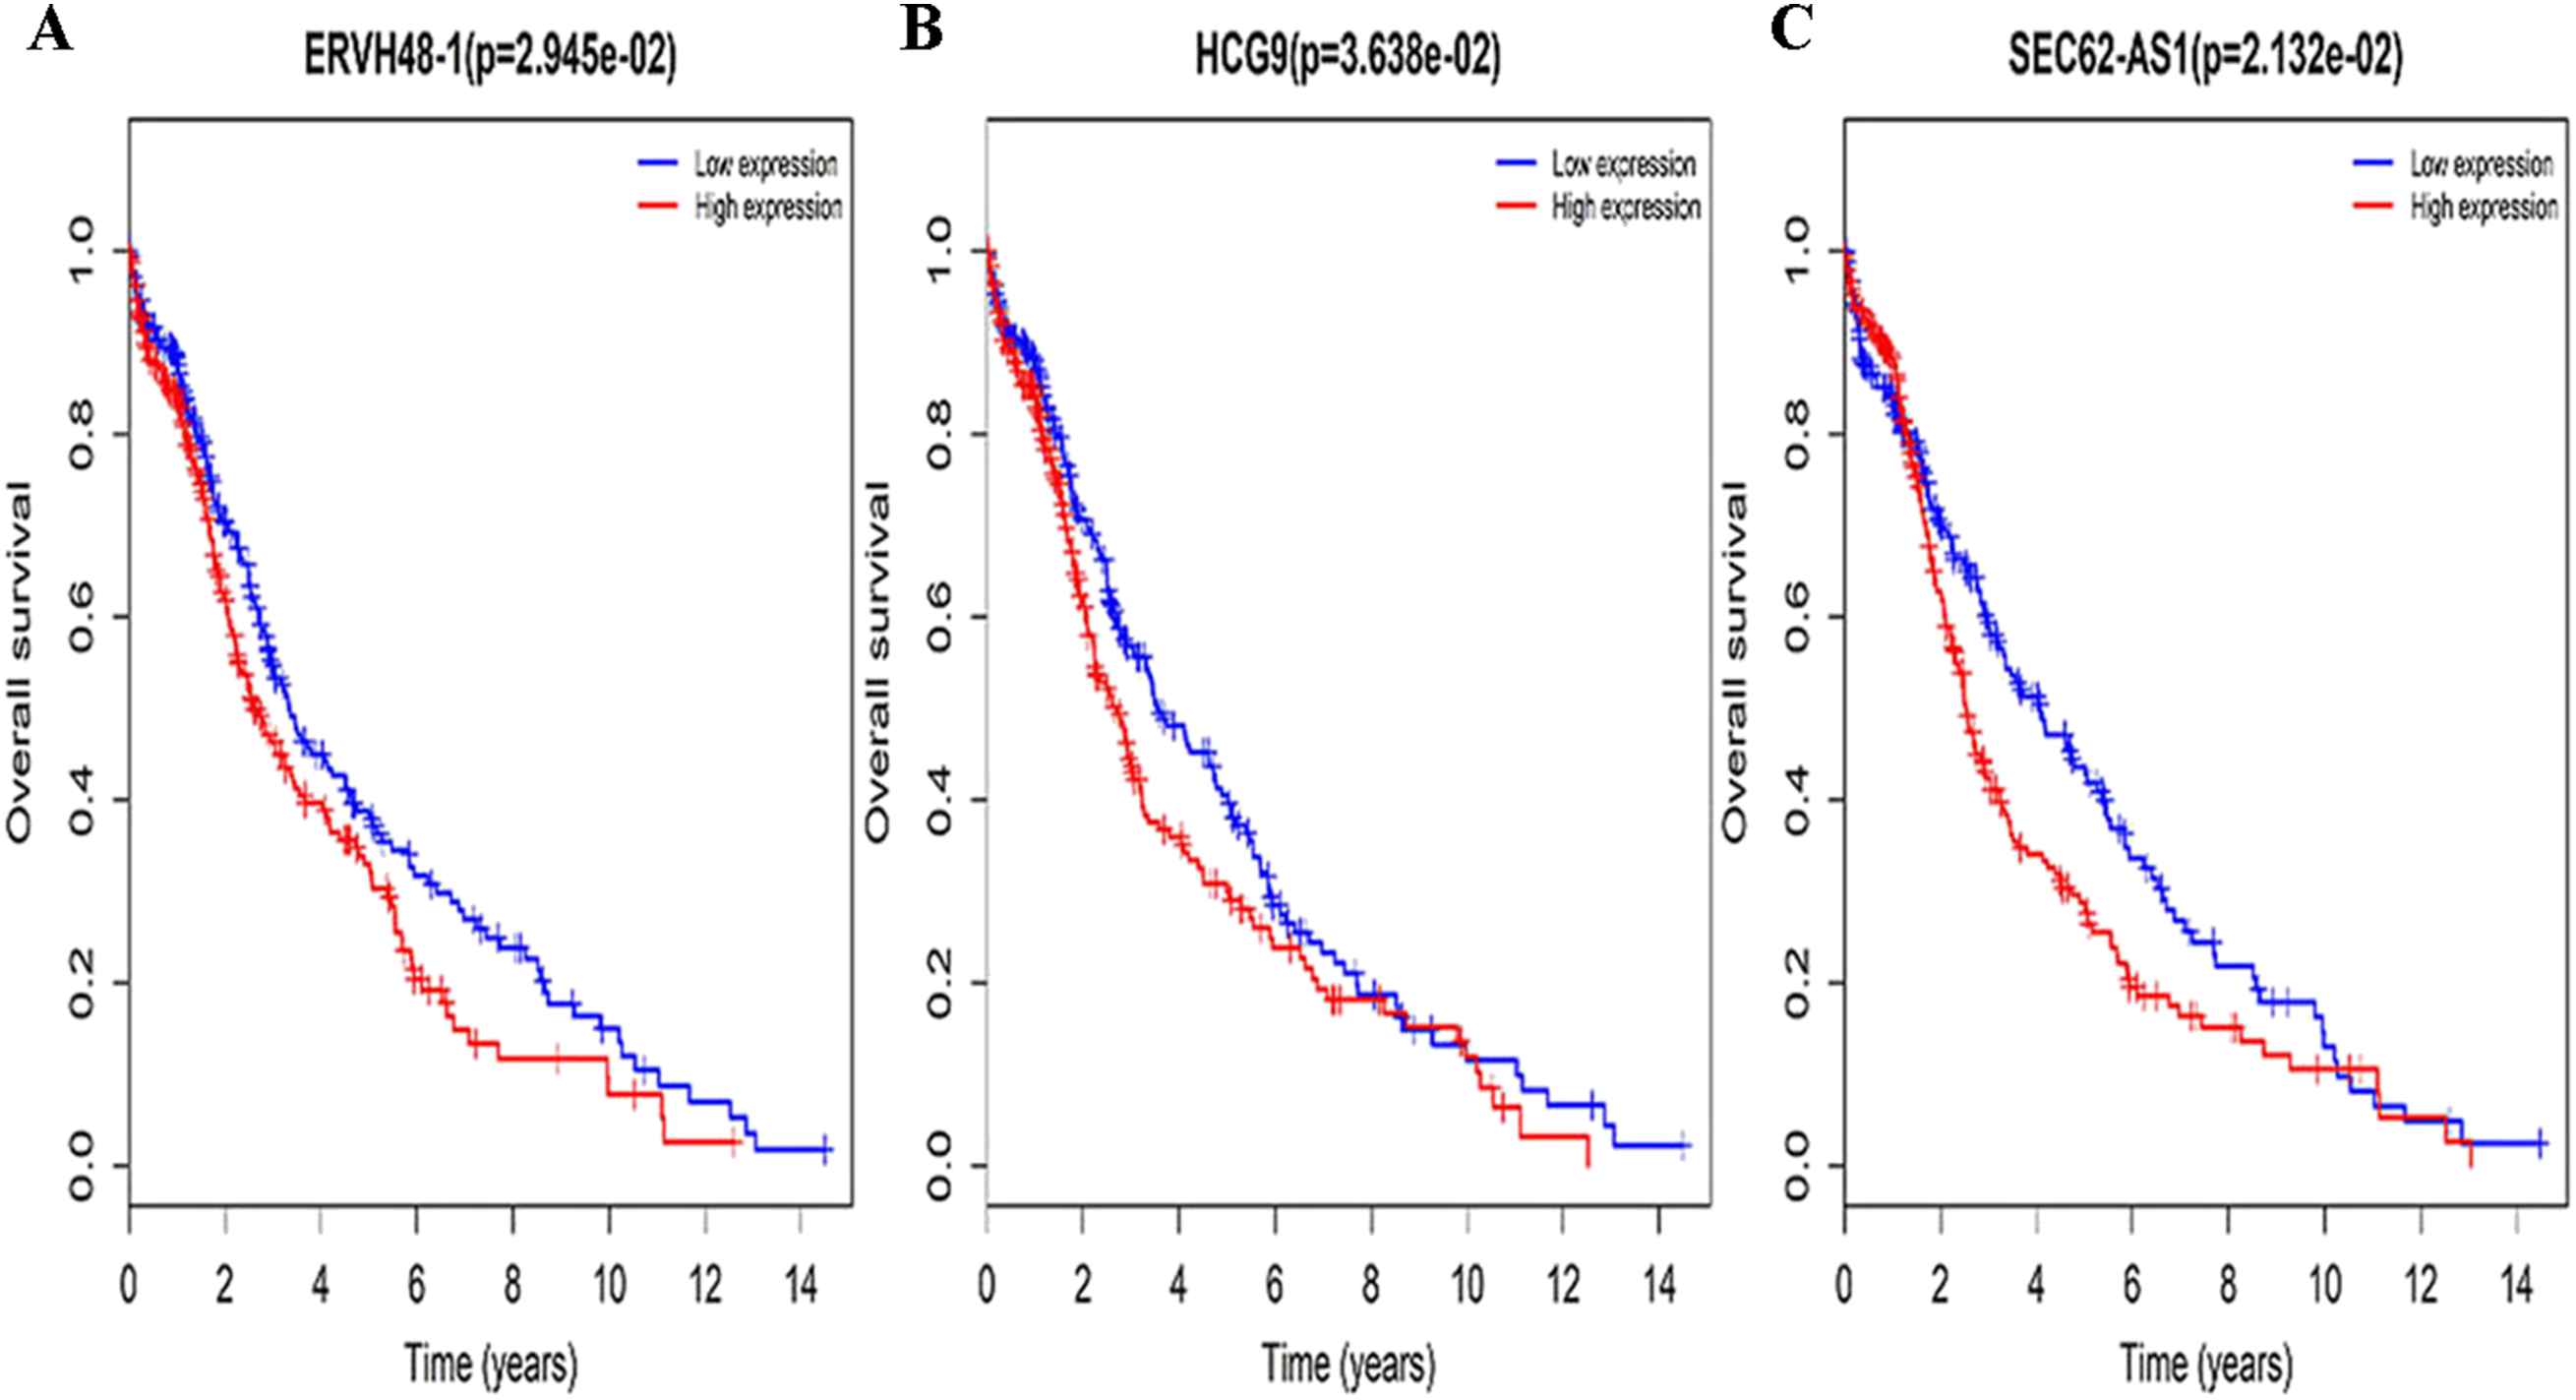
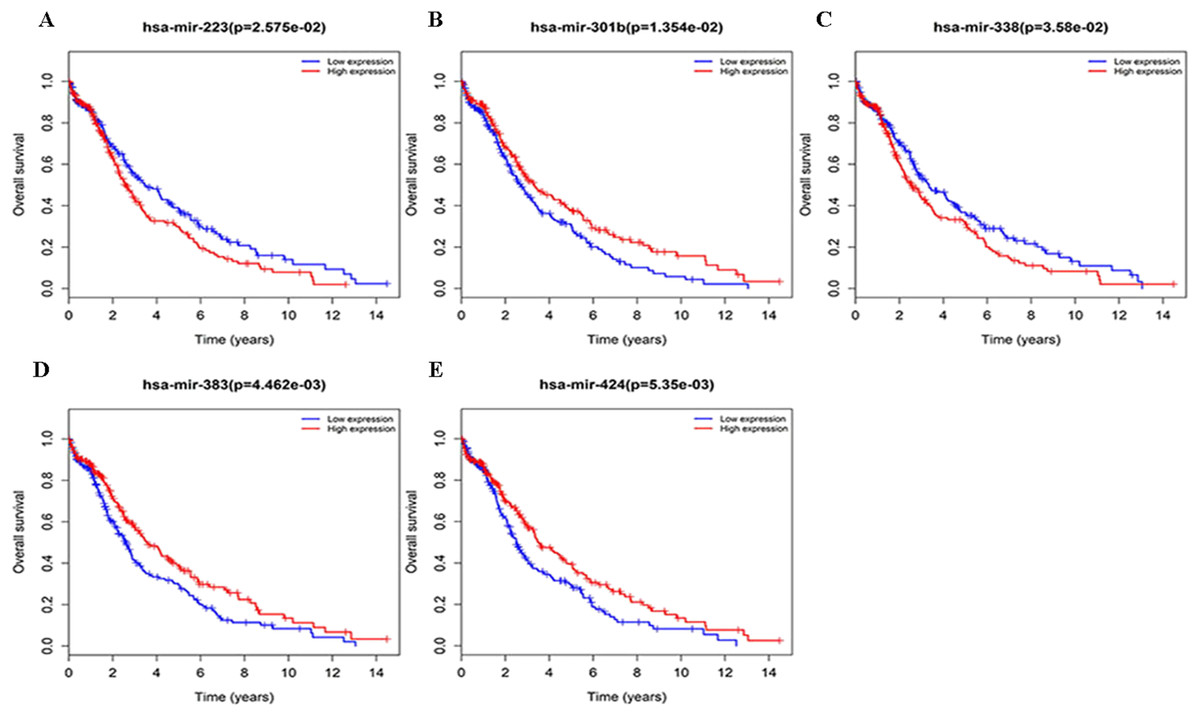
Figure 4: Survival curves for DEmiRNAs that are associated with the overall survival (OS) of LUSC patients.
(A) hsa-mir-223, (B) hsa-mir-301b, (C) hsa-mir-338, (D) hsa-mir-383, (E) hsa-mir-424.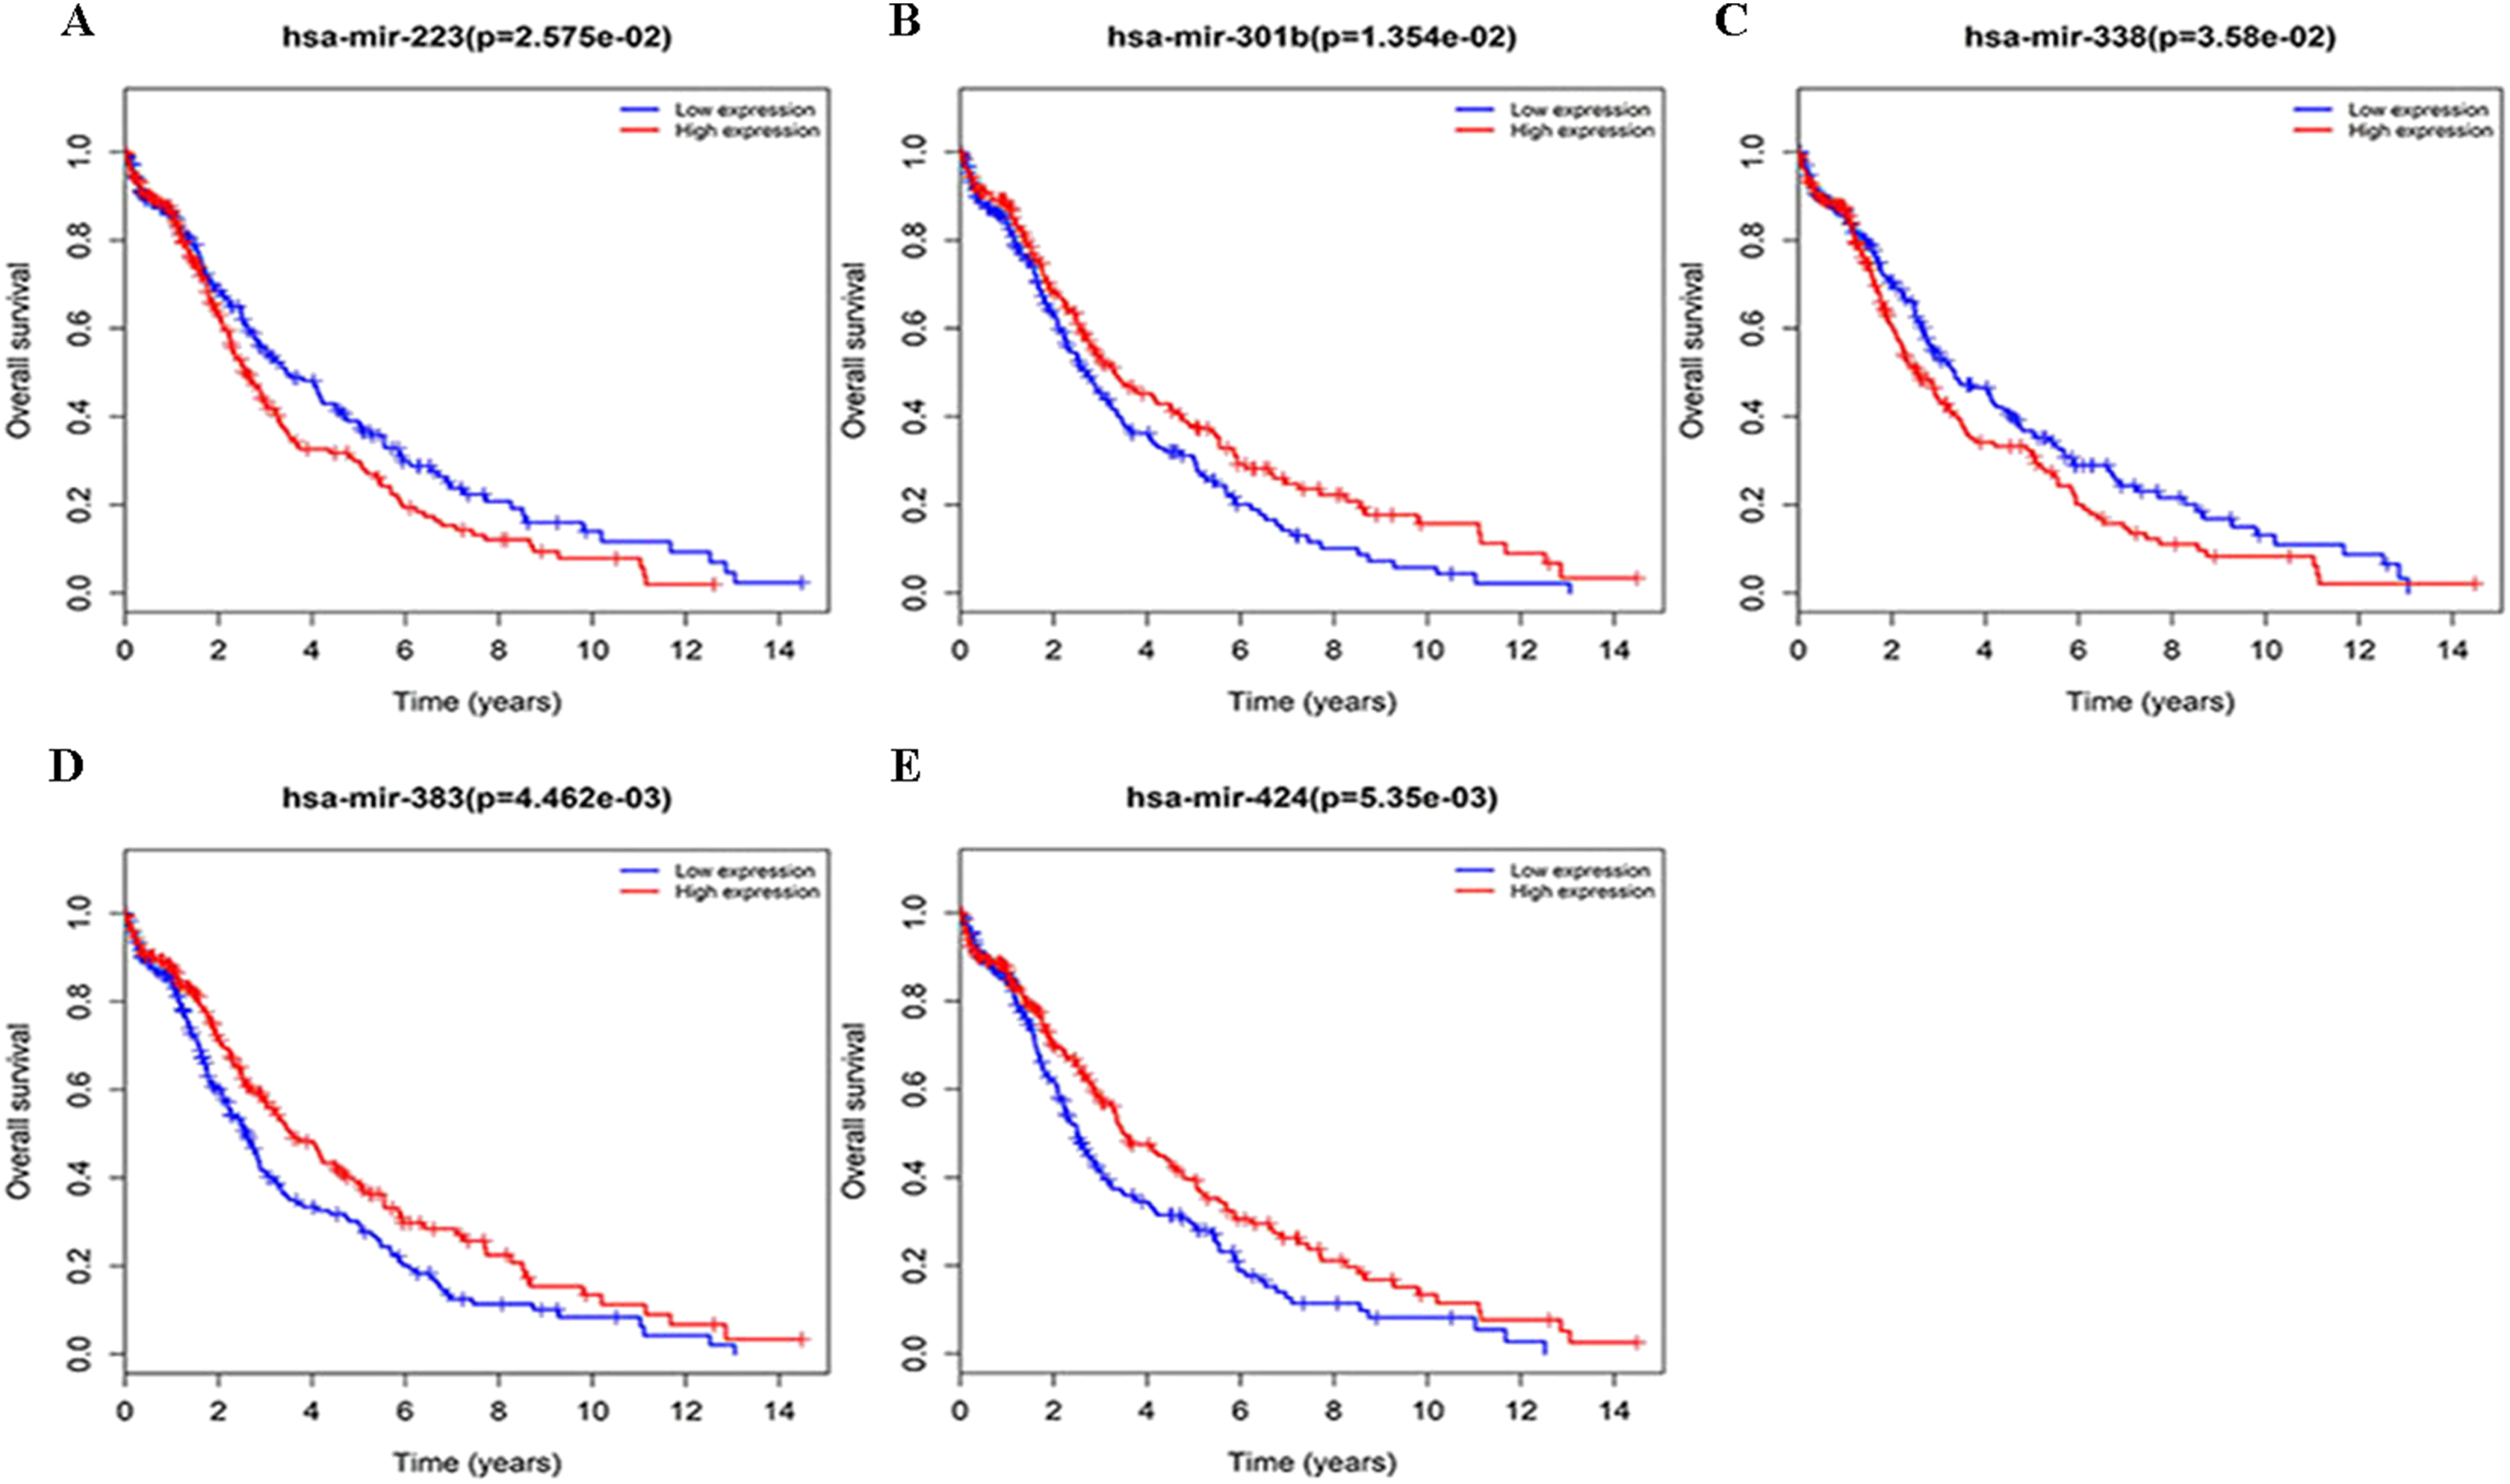
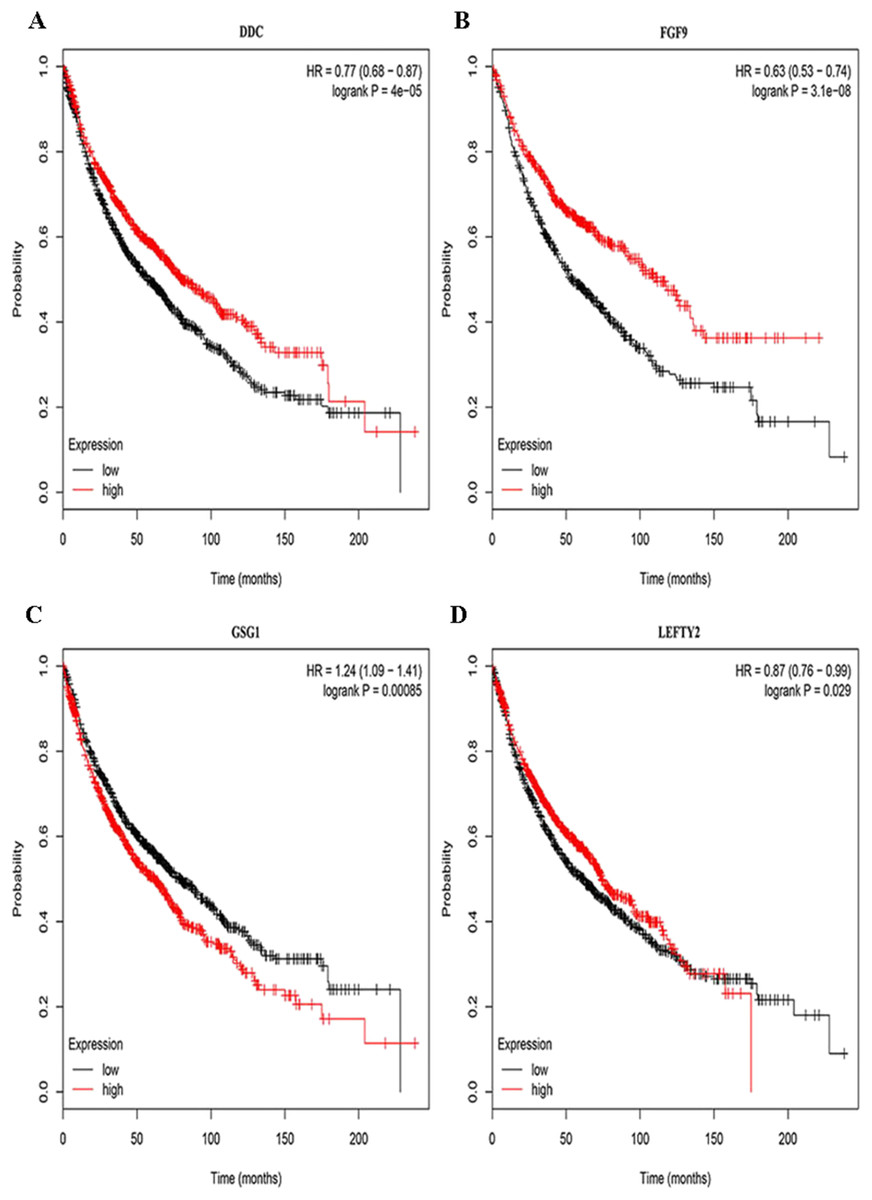
Figure 5: Survival curves for DEmRNAs that are associated with the overall survival (OS) of LUSC patients.
(A) DDC, (B) FGF9, (C) GSG1, (D) LEFTY2.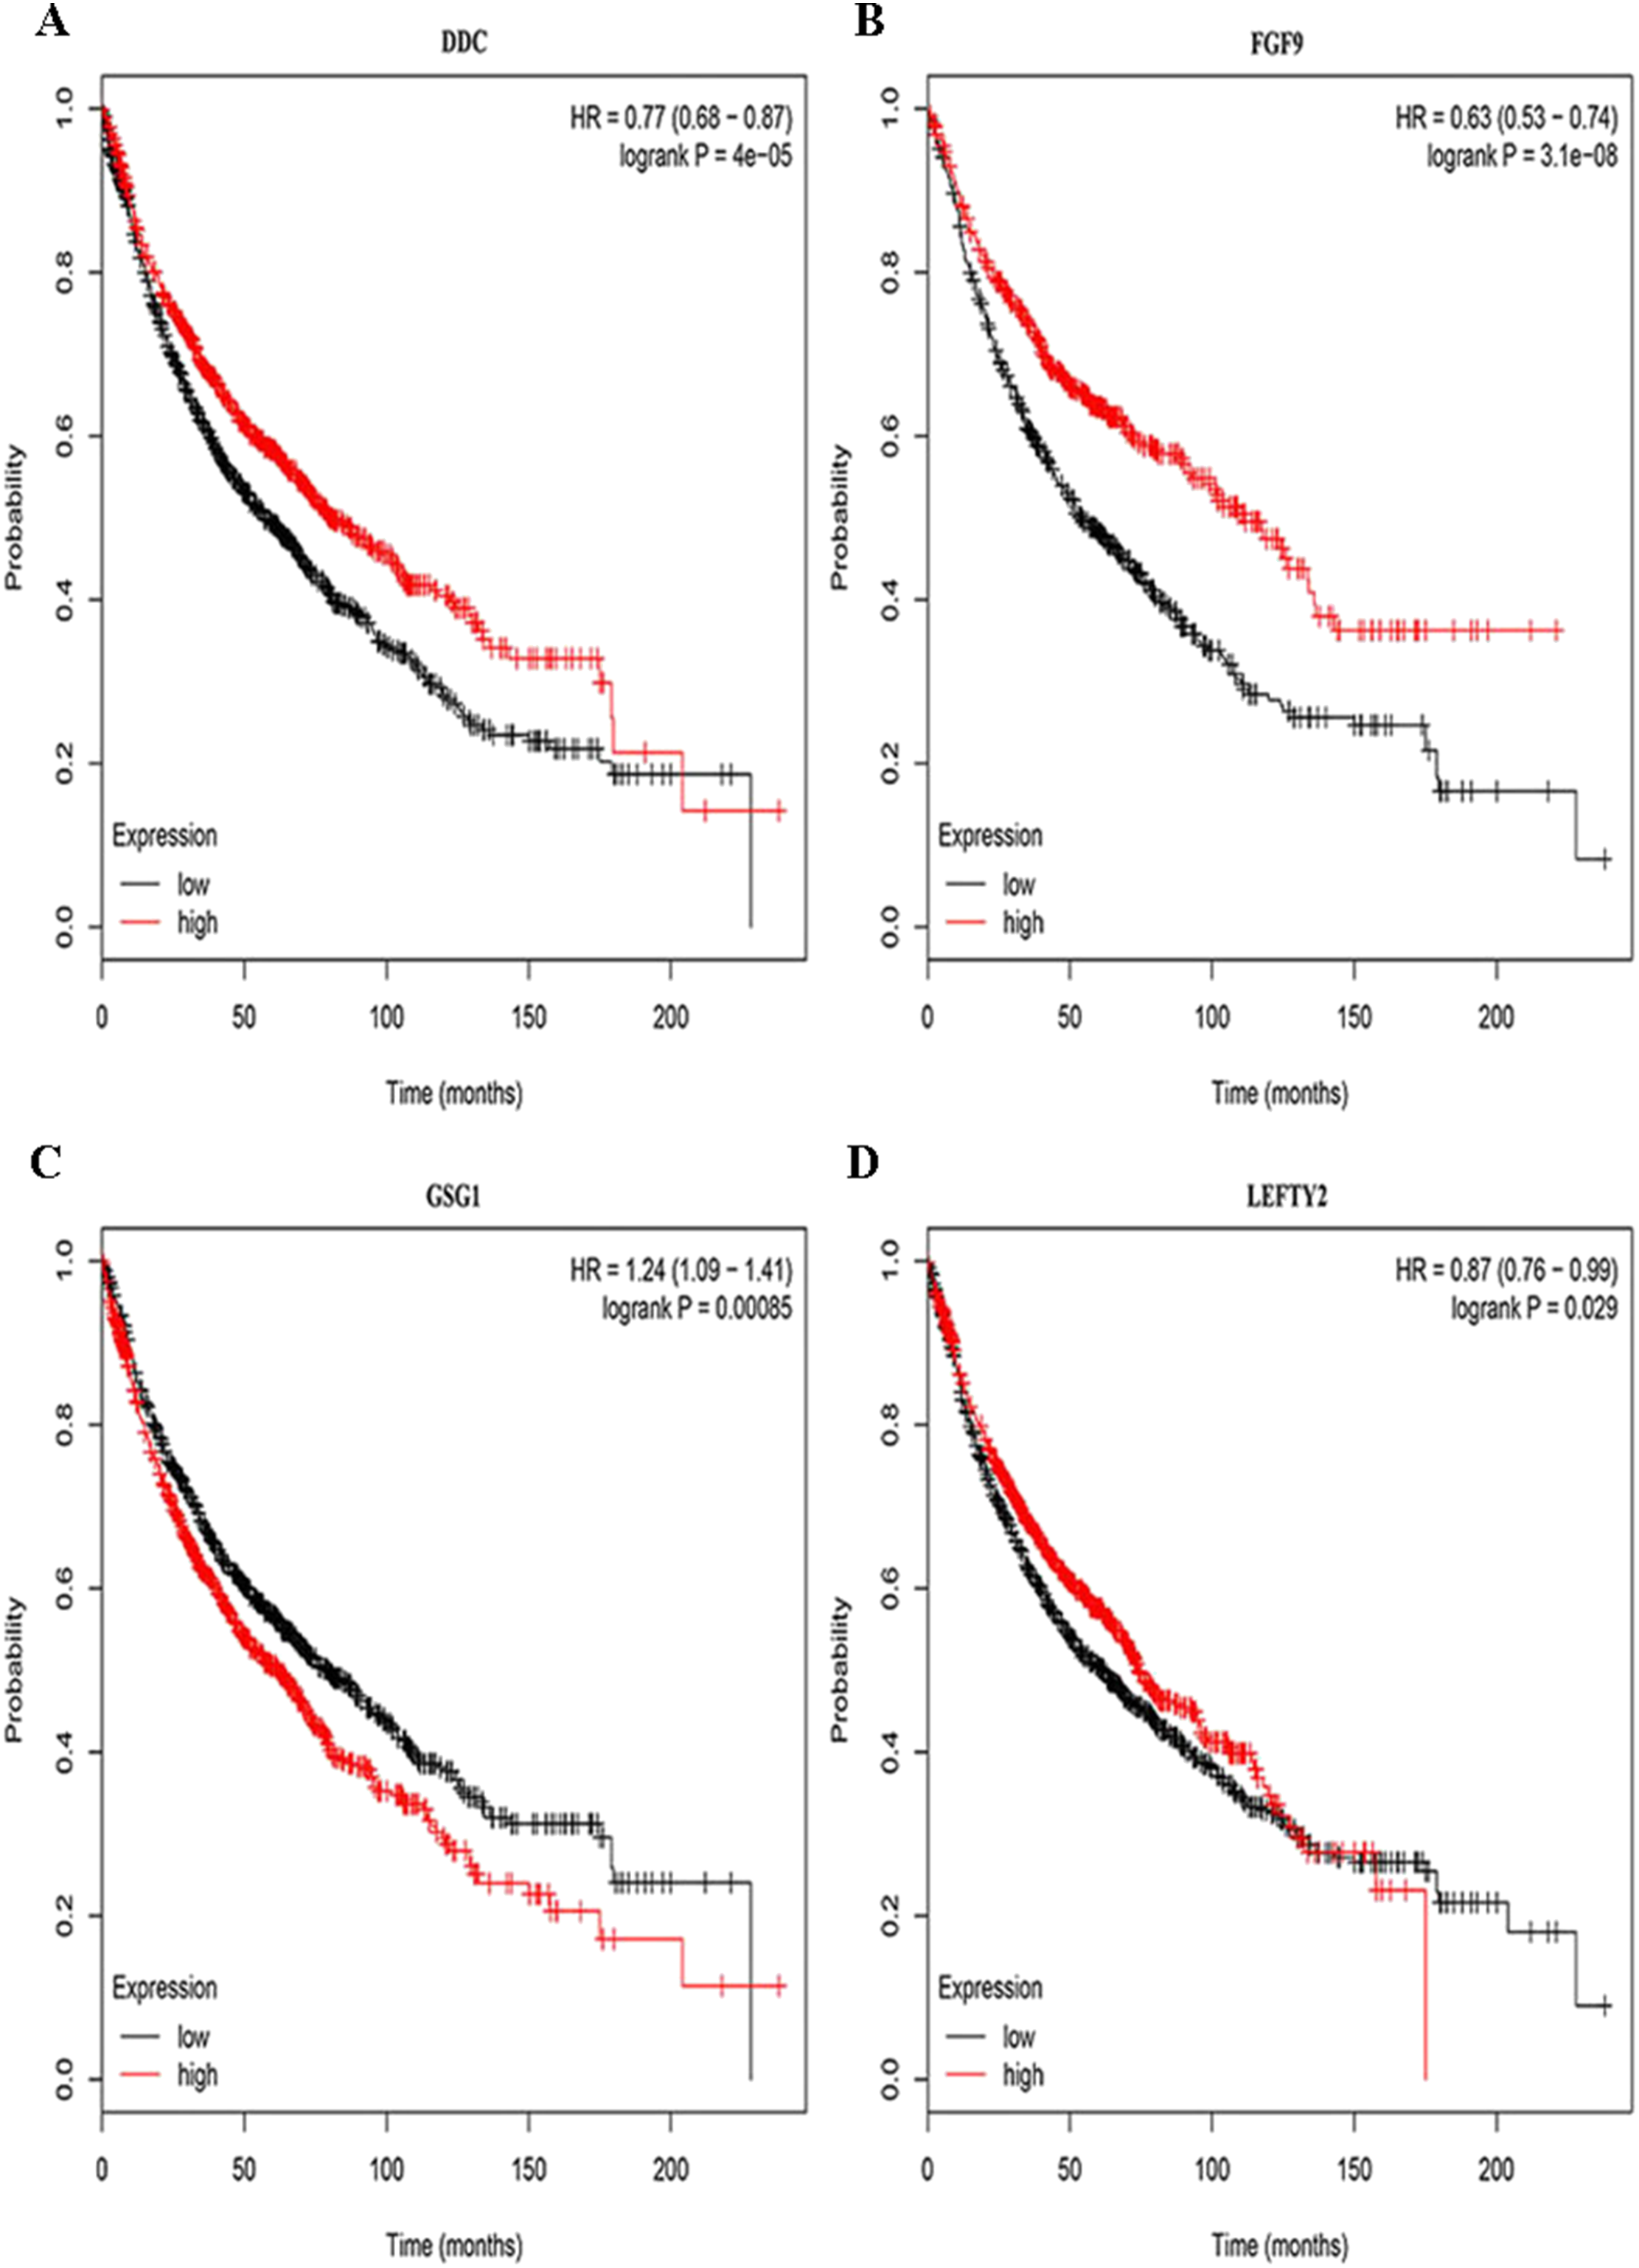
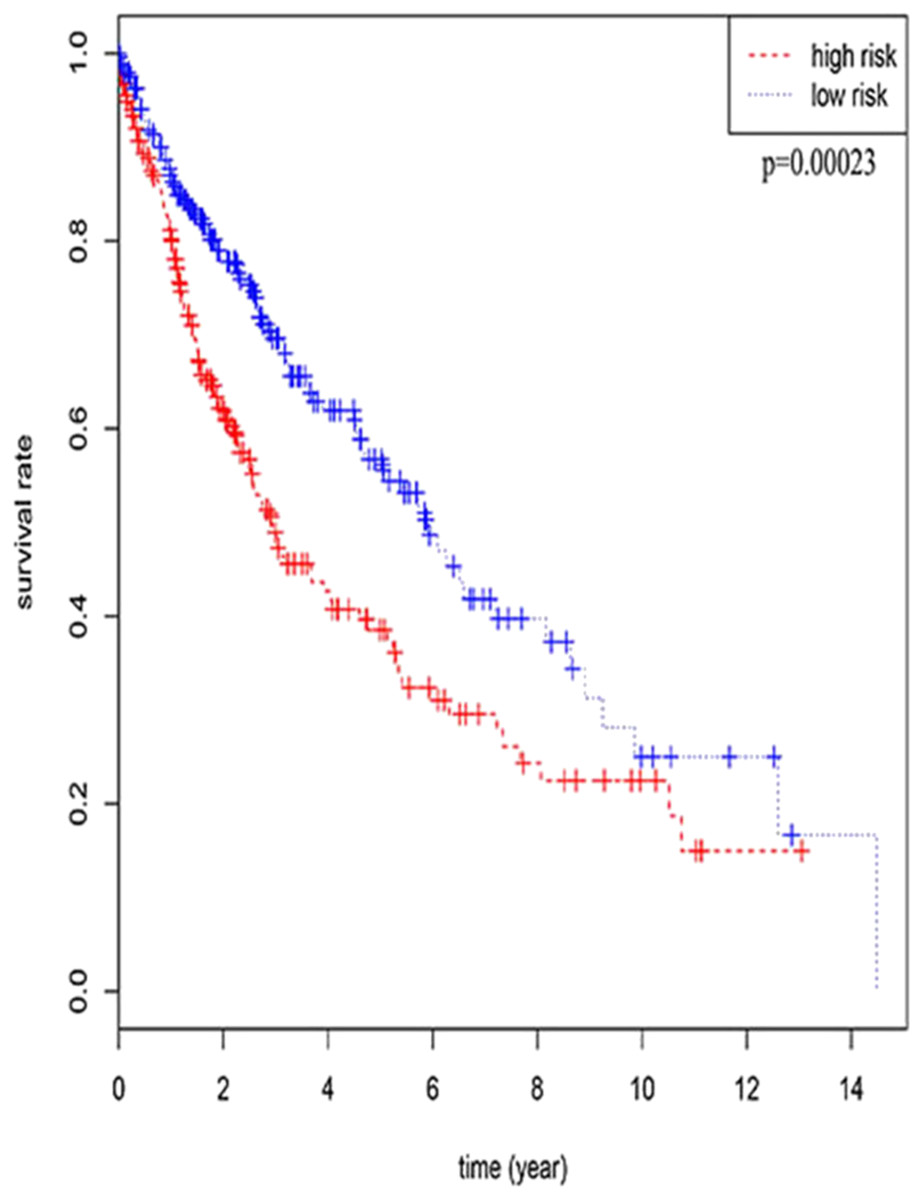
Figure 6: The result of multivariate Cox analysis.
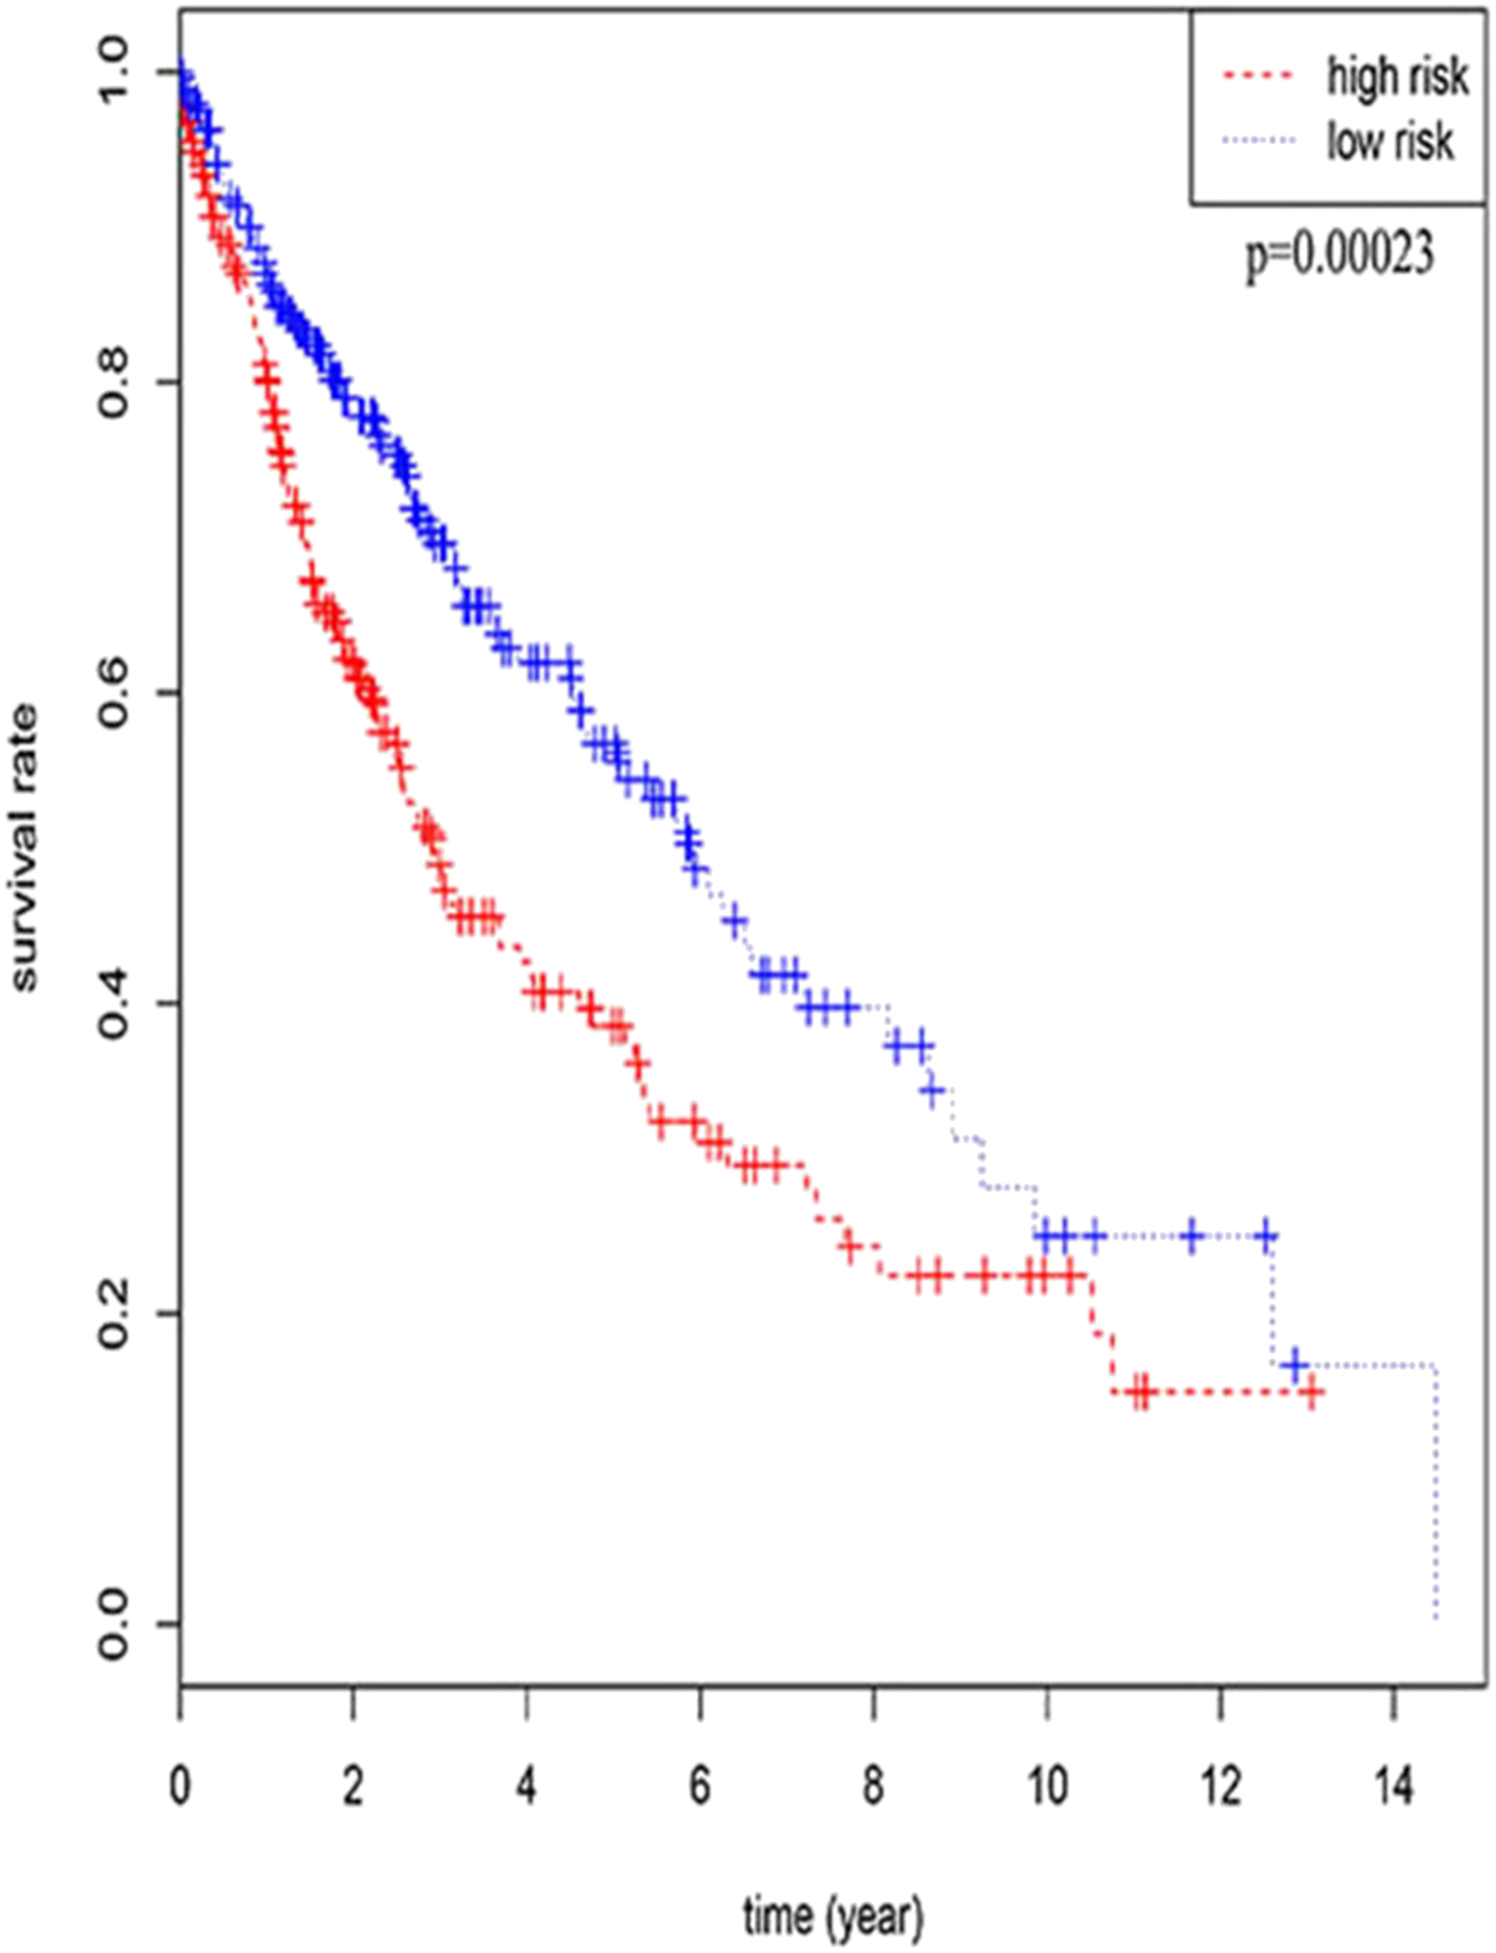
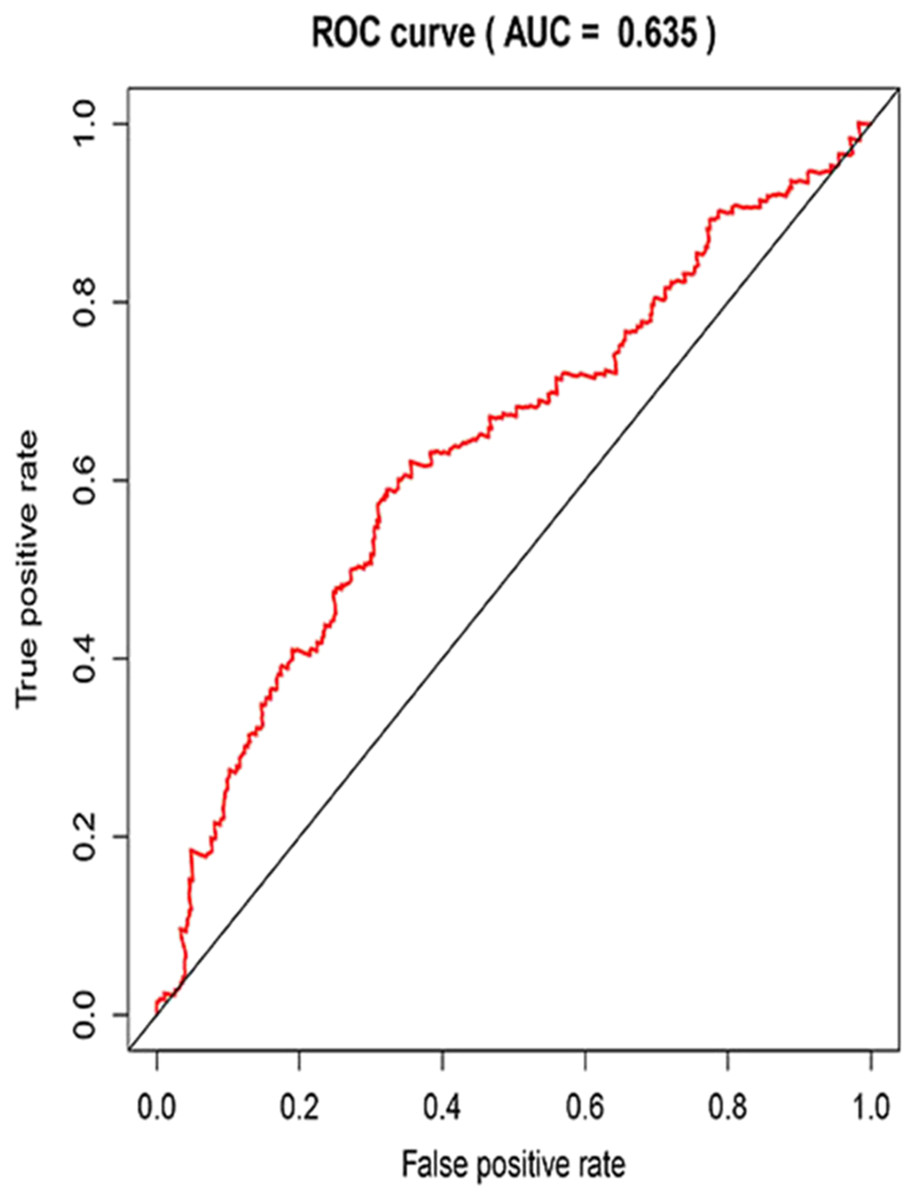
Figure 7: The receiver operating characteristic (ROC) curve of the 3-year survival rate.
| Gene | HR | P-value | Regulate |
|---|---|---|---|
| LINC00261 | 1.075703271 | 0.008013221 | up |
| HCG9 | 1.152099121 | 0.028617889 | up |
| C5orf17 | 1.05908045 | 0.029548444 | up |
| LINC00460 | 1.060955462 | 0.038113165 | down |
| AC022148.1 | 1.089323602 | 0.047549964 | down |
| AC078802.1 | 0.893773288 | 0.048069161 | down |
Discussion
Lung squamous cell carcinoma is a common form of lung cancer. Because of the lack of research on genomic alterations and other causes, there are still no molecularly targeted drugs that can specifically treat LUSC, and the number of deaths per year due to LUSC remains a concern (Cancer Genome Atlas Research Network, 2012; Drilon et al., 2012). With the growing maturity of bioinformatics and high-throughput sequencing technology, the mysterious veil surrounding lncRNA has also begun to be removed (Berger et al., 2018; Qian et al., 2018). Studies have shown that lncRNAs were abnormally expressed in a variety of tumors, which can affect the occurrence, growth, metastasis and prognosis of tumors (Lin & Yang, 2018). In this study, we established a ceRNA network based on the expression matrices of lncRNA, miRNA, and mRNA. Furthermore, we explored the relationship between them and the overall survival of LUSC patients. Finally, we identified seven prognostic-related lncRNAs in LUSC based on the theoretical basis of the ceRNA network and on data from the TCGA database.
The ceRNA network constructs a novel regulatory model of lncRNA-miRNA-mRNA, which enriches the traditional miRNA-mRNA regulatory model. And the function of lncRNA will be better explained in ceRNA network. Among GO terms of mRNAs regulated by the lncRNAs, the function SMAD protein signal transduction deserves attention, which plays a major role in tumor progression and drug resistance (Eritja et al., 2017; Zhuang et al., 2017), and each biological process in a tumor is basically associated with the pathway of mRNA binding (Choe et al., 2018; Rapino et al., 2018). In the ceRNA network constructed in present study, five lncRNAs (AC022148.1, HCG9, LINC00460, C5orf17, LINC00261) were identified in the construction of LUSC prognostic model. HCG9, which was thought to be associated with susceptibility and heredity of nasopharyngeal carcinoma in other related studies (Urayama et al., 2012; Zhao et al., 2012). And in a related genomic study of Hodgkin’s lymphoma, HCG9 was recognized to be associated with genetic variation (Tang et al., 2012). LINC00460 is important for the development or prognosis of a variety of cancers. In non-small cell lung cancer, LINC00460 acts as a cancer factor to promote the spread and metastasis of cancer cells (Li et al., 2018). In a number of studies, it was identified as a prognostic marker of some cancers that can guide clinical practice, such as head and neck squamous cell carcinoma (Cao et al., 2017), epithelial ovarian cancer (Liu et al., 2018). After reviewing the relevant literature, we found that LNIC00261 plays a non-negligible role in the development and prognosis of cancer similarly. In the study of the regulation of lncRNA, LINC00261 is able to prevent the progression of gastric cancer by promoting the degradation of Slug (Yu et al., 2017). One study has shown that LINC00261 was differentially expressed in gastric cancer, which may provide a new target for the treatment of gastric cancer (Cao et al., 2013). AC022148.1 and C5orf17 are two newly discovered lncRNAs associated with LUSC prognosis in this study and no scholars have studied their role and mechanism in cancers. Therefore, we suggest that new research can be carried out around them.
In addition to constructing a lncRNA prognostic model, we also identified prognostic significance of lncRNAs by performing Kaplan–Meier survival curves and log-rank tests. As a result, three lncRNAs (ERVH48-1, HCG9, and SEC62-AS1) were identified as prognostic indicators associated with the overall survival of LUSC patients. ERVH48-1 is an endogenous retroviral provirus with placental-specific expression, which plays a role in tumor formation (Malfavon-Borja & Feschotte, 2015). SEC62-AS1 is an antisense RNA for SEC62, which can be used to treat diseases caused by genetic mutation or overexpression (Wemmert et al., 2016). Therefore, we have reason to believe that SEC62-AS1 may be a protective gene for tumors. Among them, HCG9 is meaningful in both survival analysis and Cox analysis, which strongly enhances the reliability of it as a prognostic indicator.
We also performed survival validation on miRNAs and mRNAs in the network to ensure the survival correlation of the entire ceRNA network. There were five miRNAs (hsa-mir-223, hsa-mir-301b, hsa-mir-338, hsa-mir-383, and hsa-mir-424) identified to be associated with the overall survival of LUSC patients. In related studies, the 5′ hat structure of hsa-mir-223 is associated with tumor metastasis in HPV-negative vulvar cancer (De Melo Maia et al., 2016). The expression profile of hsa-mir-301b is altered in lung adenocarcinoma, pancreatic cancer and papillary thyroid cancer (Ab Mutalib et al., 2016; Geng et al., 2016; Ye et al., 2014). Hsa-mir-338 can indirectly regulate certain signal transduction pathways or directly target potential genes to regulate tumor cells’ proliferation and invasion (Guo et al., 2018). Down-regulation or up-regulation of hsa-mir-383 expression is thought to affect cell cycle and synthesis of apoptotic proteins which is considered to be a tumor marker for a variety of tumors (some studies have regarded it as a prognostic marker for lung cancer) (Shang et al., 2016). Hsa-mir-424 was also inextricably linked to tumors, such as its 5′ hat structure which can inhibit the progression of gastric cancer (Zhang et al., 2017), reduce chemotherapy resistance in breast cancer (Rodriguez-Barrueco et al., 2017), and act as a radiation sensitizer for cervical cancer among other functions (Wang et al., 2016). In addition, four mRNAs (DDC, FGF9, GSG1, and LEFTY2) were considered to be significant for the overall survival of LUSC patients as verified by information from the GEO database. DDC, is a dopa deacidase, the expression of which is related to the biochemistry of many human cancers (Hoballa et al., 2018). Based on a number of previous studies, the expression of FGF9 showed carcinogenicity in human tumors (Hegab et al., 2018). There are very few reports on GSG1 in terms of tumors, and most studies believe that it is involved in reproduction. And LEFTY2 was involved as a target gene in the development of some malignant tumors (Gao et al., 2018). From the above description, we believe that the three type of prognosis-related RNAs obtained in ceRNA network has a good tumor correlation.
In present study, we verified the accuracy of the information obtained from the TCGA database using data from the GEO database. Also, excluding undiscovered RNAs, there is a good tumor correlation in the identified survival-related RNAs in present study; what’s more, a variety of analytical methods and software, such as Kaplan–Meier survival analysis, log-rank test, univariate Cox and multivariate Cox analysis and different R packages were utilized to improve the reliability of the data analysis. Our work has injected new energy into ceRNA network research related to lncRNAs in LUSC. It needs to be mentioned that we focus on finding the prognostic markers of LUSC in the cumbersome data of the tumor database. Therefore, our research remains at the theoretical level. Since our findings have not yet been applied in clinical work, more researches are needed in the future to validate our findings.
Conclusion
As a conclusion, we separately used the two methods, survival verification and construction of prognostic model, identified the seven specific lncRNAs (ERVH48-1, HCG9, SEC62-AS1, AC022148.1, LINC00460, C5orf17, LINC00261) as potential prognostic factors for LUSC patients based on the ceRNA network theory. Five of the seven lncRNAs (AC022148.1, HCG9, LINC00460, C5orf17, LINC00261) constructed a prognostic model of LUSC, which may be used to assess the prognosis risk of clinical patients. Further biological experiments are needed to elucidate their specific molecular mechanisms.