Hypoglycemia resulting from insulin therapy for treatment of diabetes increases the risk of adverse cardiovascular events. Determining biomarkers that provide accurate estimation of hypoglycemia risk may allow for more accurate patient management and care. The purpose of this study was to determine the cutoff value of serum albumin (s-alb) that increases the risk of hypoglycemia in patients treated with insulin degludec.
Methods
This study used a crossover design and randomized 30 patients admitted for glycemic control to compare differences between insulin glargine 300 U/ml (Gla300) and degludec treatments.
Results
The cutoff value of s-alb associated with 24-h hypoglycemia and nocturnal hypoglycemia in patients treated with degludec was 3.8 g/dl. In patients with s-alb levels < 3.8 g/dl, mean percentages of time with hypoglycemia, clinically important hypoglycemia, and nocturnal hypoglycemia were significantly lower in those treated with Gla300 compared with patients treated with degludec.
Conclusion
This study identified a cutoff value for s-alb levels that indicates risk of hypoglycemia in patients treated with degludec. Monitoring s-alb levels in patients treated with degludec will help to mitigate the risk of hypoglycemia.
Trial Registration
University Hospital Medical Information Network (UMIN 000031044).
In diabetes treatment, hypoglycemia increases the risk of adverse cardiovascular events [1], and special attention is required with insulin treatment. Insulin glargine 300 U/ml (Gla300) and insulin degludec (Deg) are widely used as ultra-long-acting insulins to reduce risk of hypoglycemia and have been associated with less hypoglycemia compared with insulin glargine 100 U/ml (Gla100) [2, 3]. In the BRIGHT trial, Gla300 was significantly less hypoglycemic compared with Deg during the titration period [4]. In our study comparing these two insulins, similar results were observed, and one hypothesized cause of this finding was the relationship between Deg and serum albumin (s-alb) [5]. When Deg transits from under the skin into the blood, it combines with albumin to reach the target tissue, separates from albumin, and then binds to the insulin receptor to exert hypoglycemic action [6, 7]. Gla300 does not bind to albumin [8, 9]. Insulin detemir (Det) also binds to albumin, and the correlation between hypoalbuminemia and hypoglycemia is known. Compared with Gla100, patients treated with Det showed significantly elevated hypoglycemia with s-alb levels < 3.0 g/dl [10]. However, for Gla300 and Deg treatment, the minimal s-alb level necessary to cause hypoglycemia is unknown. The purpose of this study was to determine the cutoff values of s-alb that increase and reduce the risk of hypoglycemia in patients treated with Deg for the first time. In addition, for patients treated with Gla300 or Deg, we investigated the difference in their percentage of time with hypoglycemia when s-alb levels were above or below the cutoff value. We hypothesized that when the s-alb is below the cutoff value, patients treated with Deg have a significantly increased percentage of time with hypoglycemia compared with patients treated with Gla300.
Methods
The study protocol has been published previously [5]. Briefly, 30 patients with type 2 diabetes were randomized to receive treatment with Gla300 followed by Deg (Gla300/Deg) or Deg followed by Gla300 (Deg/Gla300) in a single-center, open label, between parallel groups study over the course of a two-period trial. We evaluated hypoglycemia, nocturnal hypoglycemia, and clinically important hypoglycemia using continuous glucose monitoring (CGM). We found that patients treated with Gla300 had a significantly lower risk of hypoglycemia than patients treated with Deg. There was a negative correlation between hypoglycemia and s-alb level in patients treated with Deg.
Anzeige
In light of this finding, we determined the cutoff value of s-alb that increases the risk of 24-h hypoglycemia and nocturnal hypoglycemia in patients treated with Deg using receiver-operating characteristic (ROC) analysis. For both treatment groups, the following items were investigated at both above and below the s-alb cutoff value: mean percentage of time with target glucose range (Target) (70–180 mg/dl), mean percentage of time with hyperglycemia (Hyper) (≥ 180 mg/dl), 24-h standard deviation (SD), M value (target glucose level 100 mg/dl) and glucose level coefficient of variation (CV), 00.00–06.00 h CV, mean amplitude of glycemic excursion (MAGE), mean of daily difference (MODD), 24-h mean glucose level, mean percentage of time with hypoglycemia (Hypo 70) (< 70 mg/dl), mean percentage of time with clinically important hypoglycemia (Hypo 54) (< 54 mg/dl), and mean percentage of time with nocturnal hypoglycemia (Noct-Hypo) (< 70 mg/dl). To confirm that Noct-Hypo does not depend on the difference between pre-prandial glucose level at breakfast in both groups, we performed subgroup analyses on patients with a pre-prandial glucose level of approximately 100 mg/dl (90–110 mg/dl of mean glucose level for 3 days). Target, Hyper, Hypo 70, Hypo 54, and Noct-Hypo were investigated.
Data are presented as mean ± standard deviation, unless otherwise noted. Differences between the two treatments were compared using Student’s t test. p < 0.05 was considered statistically significant. All data were analyzed using EZR 1.37 software.
This study was approved by the ethics committee of Minami Osaka Hospital (no. 2016-6), is registered in the University Hospital Medical Information Network (UMIN 000031044), and was executed in accordance with the Helsinki Declaration. All patients provided informed consent before entering this study.
Results
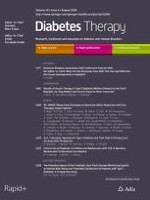
Table S1 shows the clinical characteristics of patients. The cutoff value of the s-alb level that increased the risk of hypoglycemia was determined from ROC analysis. For both 24-h hypoglycemia and nocturnal hypoglycemia, the predictive ability was highest when the cutoff value was 3.8 g/dl. For 24-h hypoglycemia and nocturnal hypoglycemia, sensitivity was 88.9% and 75.0%, specificity was 71.4% and 72.2%, and the area under curve for hypoglycemia was 0.84 (95% CI 0.70–0.98) and 0.82 (95% CI 0.66–0.97), respectively (Fig. 1a, b).
Fig. 1
Receiver-operating characteristic (ROC) curve for 24-h hypoglycemia (a) and nocturnal hypoglycemia (b) in serum albumin levels. In each of a, b, at the cutoff value of 3.8 g/dl, the prediction ability is highest, the sensitivity is 88.9/75.0%, the specificity is 71.4/72.2%, and the area under the curve (AUC) is 0.84/0.82 (95% CI 0.70–0.98/0.66–0.97)
×
Anzeige
For s-alb cutoff values ≥ 3.8 g/dl or < 3.8 g/dl, the indices described in the methods section were investigated (Table 1). For s-alb levels ≥ 3.8 g/dl (n = 15), there were no significant differences in any index between the two insulin treatment groups. For s-alb levels < 3.8 g/dl (n = 15), 24-h CV, 00.00–06.00 h CV, 24-h mean glucose level, Hypo 70, Hypo 54, and Noct-Hypo were significantly lower in the Gla300 treatment group than in the Deg treatment group (p < 0.05). The 24-h glycemic variation based on CGM is shown for patients with a pre-prandial glucose level of approximately 100 mg/dl at breakfast (n = 8) (Fig. 2). Nocturnal glycemic variation at 00.00–06.00 h tended to be lower in patients treated with Deg. The patients’ CGM parameters of glycemic variation are shown in Table 2. Hypo 70 and Noct-Hypo were significantly lower in patients treated with Gla300 than in patients treated with Deg (p < 0.05). Most hypoglycemia observed in patients treated with Deg was attributed to nocturnal hypoglycemia.
Table 1
Continuous glucose monitoring parameters of glucose variability in patients with insulin glargine 300 U/ml or degludec (cutoff value of serum albumin level at 3.8 g/dl)
Gla300
Deg
p value
Serum albumin levels ≥ 3.8 g/dl, subject no. = 15
Mean percentage of time with target glucose range (70–180 mg/dl) (%)
77.4 ± 21.3
79.5 ± 20.8
0.785
Mean percentage of time with hyperglycemia (≥ 180 mg/dl) (%)
21.9 ± 21.7
19.3 ± 21.4
0.742
24-h SD (mg/dl)
35.0 ± 10.6
36.3 ± 8.4
0.701
24-h M value (target glucose level 100 mg/dl)
10.7 ± 10.2
9.9 ± 10.7
0.819
24-h CV (%)
24.0 ± 5.7
26.0 ± 6.4
0.373
00:006.00 h CV (%)
13.9 ± 7.1
13.2 ± 4.4
0.744
MAGE (mg/dl)
88.7 ± 23.2
91.7 ± 19.8
0.707
MODD (mg/dl)
21.4 ± 8.4
25.9 ± 8.6
0.153
24-h mean glucose level (mg/dl)
145.8 ± 30.8
142.1 ± 27.8
0.731
Mean percentage of time with hypoglycemia (< 70 mg/dl) (%)
0.7 ± 1.3
1.2 ± 2.0
0.433
Mean percentage of time with clinically important hypoglycemia (< 54 mg/dl) (%)
0.06 ± 0.24
0.21 ± 0.56
0.361
Mean percentage of time with nocturnal hypoglycemia (< 70 mg/dl) (%)
0.6 ± 1.1
0.9 ± 1.6
0.561
Serum albumin levels < 3.8 g/dl, subject no. = 15
Mean percentage of time with target glucose range (70–180 mg/dl) (%)
78.2 ± 17.5
73.8 ± 15.9
0.486
Mean percentage of time with hyperglycemia (≥ 180 mg/dl) (%)
20.0 ± 16.6
15.1 ± 15.6
0.417
24-h SD (mg/dl)
37.5 ± 13.0
39.9 ± 13.6
0.624
24-h M value (target glucose level 100 mg/dl)
9.6 ± 7.9
10.1 ± 7.5
0.856
24-h CV (%)
25.9 ± 7.0
31.9 ± 7.0
0.028*
00:006.00 h CV (%)
13.8 ± 6.0
23.9 ± 10.4
0.003*
MAGE (mg/dl)
94.2 ± 31.3
88.5 ± 26.5
0.594
MODD (mg/dl)
23.5 ± 9.1
28.8 ± 10.6
0.155
24-h mean glucose level (mg/dl)
143.0 ± 20.7
124.0 ± 25.3
0.033*
Mean percentage of time with hypoglycemia (< 70 mg/dl) (%)
1.9 ± 3.9
11.1 ± 9.8
0.002*
Mean percentage of time with clinically important hypoglycemia (< 54 mg/dl) (%)
0.02 ± 0.09
3.64 ± 4.0
0.002*
Mean percentage of time with nocturnal hypoglycemia (< 70 mg/dl) (%)
1.5 ± 3.2
7.4 ± 6.7
0.004*
SD standard deviation of the glucose levels, CV coefficient of variation
MAGE mean amplitude of glycemic excursion, MODD mean of daily difference. Values are expressed as mean ± SD. *Data were compared using Student’s t test. p < 0.05 was considered significant
Fig. 2
The 24-h glucose variations based on continuous glucose monitoring of patients with a pre-prandial glucose level of approximately 100 mg/dl at breakfast (n = 8). Solid and dotted lines show the glucose variations in patients receiving insulin glargine 300 U/ml (Gla300) and degludec (Deg), respectively
Table 2
Continuous glucose monitoring parameters of glucose variability in patients with insulin glargine 300 U/ml or degludec (patients with pre-prandial glucose level of approximately 100 mg/dl)
Gla300
Deg
p value
Pre-prandial glucose level at breakfast (mg/dl)
100.5 ± 11.1
100.8 ± 15.1
0.931
Mean percentage of time with target glucose range (70–180 mg/dl) (%)
90.3 ± 6.2
82.8 ± 15.4
0.251
Mean percentage of time with hyperglycemia (≥ 180 mg/dl) (%)
8.4 ± 6.2
10.5 ± 11.7
0.680
Mean percentage of time with hypoglycemia (< 70 mg/dl) (%)
1.3 ± 1.7
6.7 ± 4.8
0.013*
Mean percentage of time with severe hypoglycemia (< 54 mg/dl) (%)
0.0 ± 0.0
2.6 ± 3.2
0.053
Mean percentage of time with nocturnal hypoglycemia (< 70 mg/dl) (%)
1.2 ± 1.6
5.4 ± 4.4
0.031*
Values are expressed as mean ± SD. *Data were compared using Student’s t test. p < 0.05 was considered significant
×
Discussion
In this study, we determined the s-alb cutoff value that increased the risk of hypoglycemia in patients treated with Deg. When examining glycemic risk below the cutoff value, hypoglycemia was significantly higher in patients treated with Deg, while glycemic risk was not affected by s-alb levels in patients treated with Gla300. Like Deg, Det also binds with albumin, and patients with hypoalbuminemia are reported to have an increased risk of hypoglycemia [11]. Comparison of Det and Gla100 treatment showed that the risk of hypoglycemia significantly increased when s-alb levels were < 3.0 g/dl [11]. The association constant Ka = B/[F × HSAimm] (where B/F is the ratio of bound insulin to free insulin and HSAimm is immobilized human s-alb levels) was determined for Det and Deg [12]. Since Ka is a constant, when s-alb is lowered, bound insulin decreases, and free insulin increases. Since free insulin binds to the insulin receptor and elicits a hypoglycemic effect, the lower the s-alb is, the higher the risk of hypoglycemia. Approximately 98% of Det is bound to s-alb in the blood [13], while > 99% of Deg is bound to s-alb [14]. Conversely, Det is about 2% free insulin and Deg has < 1% free insulin. For this reason, the rate of change of free insulin due to the change in s-alb levels is larger for Deg than for Det. Compared with Det, it is expected that the risk of hypoglycemia will increase with higher s-alb levels for Deg.
As a result of investigating 24-h glycemic variation of CGM in patients with a pre-prandial glucose levels of approximately 100 mg/dl at breakfast, patients treated with Deg had significantly more nocturnal hypoglycemia than patients treated with Gla300. This can be explained by the Somogyi effect and the dawn phenomenon during the treatment with Deg [15]. The s-alb level of this group (n = 8) was 3.6 ± 0.4 g/dl, which was lower than the s-alb cutoff value of 3.8 g/dl at which the risk of hypoglycemia increased.
One limitation of this study was that it was a single-center, short-term comparison with a relatively small sample size of 30 patients. To accurately evaluate hypoglycemia risk and the development of cardiovascular events, a long-term multicenter, double-blind, large-scale randomized trial is necessary.
Conclusion
It is necessary to consider the risk of nocturnal hypoglycemia based on s-alb levels when using Deg; however, since Gla300 is not affected by s-alb levels, it may be safely used for elderly people and patients with renal or liver dysfunction.
Acknowledgements
We thank all the participants and ensure that their anonymity is maintained.
Funding
No funding or sponsorship was received for this study or publication of this article. All article processing charges were funded by the authors.
Editorial Assistance
We thank Editage (Tokyo, Japan; http://www.editage.jp) for helping to edit the English. Funding for editorial assistance was provided by the authors.
Anzeige
Authorship
All named authors meet the International Committee of Medical Journal Editors (ICMJE) criteria for authorship for this article, take responsibility for the integrity of the work as a whole, and have given their approval for this version to be published.
Disclosures
Yuji Kawaguchi has received honoraria for lectures and speaker’s fee from Sanofi K.K. Jun Sawa, Chie Hamai and Yasuro Kumeda have nothing to disclose.
Compliance with Ethics Guidelines
This study was approved by the ethics committee of Minami Osaka Hospital (no. 2016-6), is registered in the University Hospital Medical Information Network (UMIN 000031044) and was executed in accordance with the Helsinki Declaration. All patients provided informed consent before entering this study.
Data Availability
The data sets generated during and/or analyzed during the current study are available from the corresponding author on reasonable request.
Anzeige
Open Access
This article is distributed under the terms of the Creative Commons Attribution-NonCommercial 4.0 International License (http://creativecommons.org/licenses/by-nc/4.0/), which permits any noncommercial use, distribution, and reproduction in any medium, provided you give appropriate credit to the original author(s) and the source, provide a link to the Creative Commons license, and indicate if changes were made.
Auch für Trägerinnen von BRCA-Varianten gilt: Erkranken sie fünf bis zehn Jahre nach der letzten Schwangerschaft an Brustkrebs, ist das Sterberisiko besonders hoch.
Eine hypertherme intravesikale Chemotherapie mit Mitomycin kann für Patienten mit hochriskantem nicht muskelinvasivem Blasenkrebs eine Alternative zur radikalen Zystektomie darstellen. Kölner Urologen berichten über ihre Erfahrungen.
Extreme Arbeitsverdichtung und kaum Supervision: Dr. Andrea Martini, Sprecherin des Bündnisses Junge Ärztinnen und Ärzte (BJÄ) über den Frust des ärztlichen Nachwuchses und die Vorteile des Rucksack-Modells.
Immer mehr jüngere Menschen leiden unter Vorhofflimmern. Betroffene unter 65 Jahren haben viele Risikofaktoren und ein signifikant erhöhtes Sterberisiko verglichen mit Gleichaltrigen ohne die Erkrankung.
Update Innere Medizin
Bestellen Sie unseren Fach-Newsletter und bleiben Sie gut informiert.