This study provided physicians with continuing medical education (CME) related to type 2 diabetes and evaluated the effect on patient health outcomes.
Methods
Physicians participated in multi-platform CME (live and online programs) and completed a 25 item questionnaire for patient baseline (3-months pre-CME activity) and follow-up visits (≥6-months post-CME activity). Changes in physician knowledge and patient health outcomes were evaluated.
Results
34 physicians completed both phases of the CME curricula and submitted data for 264 patients. Significant improvements were observed in physician knowledge after the live (p < 0.05) and online programs (p < 0.0005). Mean patient glycated hemoglobin (HbA1c) absolute reduction of 1.15% (p < 0.0001) was reported.
Conclusions
CME is an effective tool to close established practice gaps and potentially help improve patient health outcomes.
Type 2 diabetes mellitus (T2DM) is a highly prevalent and serious chronic, debilitating disease. Extensive evidence exists for the benefit of maintaining tight glycemic control to reduce the risk for complications. Despite this evidence, many patients do not maintain tight glycemic control with one reason being clinical inertia [1]. Clinical inertia is the failure to intensify therapy despite suboptimal glycemic control. Implementation of educational programs that emphasize the importance of glycemic control and increase awareness of tools to achieve this control among primary care physicians may be an important factor in devising successful treatment regimens that result in improved outcomes [1]. The ultimate goal of continuing medical education (CME) is to transfer learned knowledge, competence, and performance related skills into the practice setting [2]. Improvements in patient health outcomes may indicate whether or not physician participation in CME activities was effective in modifying clinical practice patterns. Research evaluating CME effectiveness has indicated that multiple educational platforms and case-based studies are more successful than the traditional didactic sessions alone at improving patient health outcomes [3, 4]. Several key factors for improving T2DM management include realistic goal-setting related to glycated hemoglobin (Hb1Ac) levels, improved knowledge and understanding of pharmacotherapeutic treatment options, early detection of problems, and prompt clinical intervention [1]. One aim of this study was to provide physicians with education specific to insulin to implement changes in their delivery of care to patients with T2DM. To address this, a combined live didactic session and online case-based interactive diabetes CME curricula were developed. The effectiveness of the CME program on physician knowledge, competence, and performance outcomes was assessed [2]. In addition, the impact of the curricula on changes in physician behavior in the clinical practice was assessed by measuring patient health outcomes before and after the CME activities.
Methods
Continuing Medical Education Curricula and Time Line
Multiple platform CME curricula were jointly developed by six US endocrinology experts actively engaged in diabetes clinical research and education, who served as program faculty. The target learning audience for these curricula was primary care physicians. The multi-platform curricula included a live didactic session as well as interactive online case-based sessions. The first live didactic session consisted of a 90-min slide presentation entitled: “Overcoming Challenges in Treatment Intensification for Type 2 Diabetes.” Physician learners attended 1 of 7 identical live CME activities occurring at different sites across the US from February to December 2012 and/or an online 12 month enduring webcast featuring the same presentation as the live sessions. Physician learners participated in a second online interactive case-based activity (choice of two individual patient cases), which was available 4 weeks after the live session, between March 2012 and January 2013. The online case-based activity session was algorithmically tailored to each learner based on the education gaps identified from the activity questions following the live CME event. Activity questions were based around the objectives of the educational activity and designed to measure the extent to which the established educational gaps for each individual clinician were met at the completion of the live activity. Clinicians were offered participation in one or both of the online case studies based on scores they achieved following the live CME event.
Anzeige
The CME curricula were designed with the following learning objectives:
1.
Apply current data from clinical trials for HbA1C goal-setting and individualization of treatment.
2.
Recognize the importance of timely initiation of drug therapy including early insulin initiation in reducing the complications of T2DM.
3.
Identify and implement strategies for overcoming barriers to insulin initiation and patient medication adherence.
4.
Describe interdisciplinary team and collaborative care approaches that can improve patient health outcomes.
Patient Chart Review
Following each live event, all attendees were sent an email invitation to participate in the patient chart questionnaire portion of the study, to retrospectively assess the impact of the CME on learner performance and patient health outcomes (Level 5 and Level 6 of Moore’s Framework). Patient chart review data collection occurred between July 2012 and December 2013. Physician participation consisted of completing a 25 item questionnaire for up to 15 patients, selected at the physician’s discretion, who met the inclusion criteria. Patient inclusion criteria included the following: ≥18 years of age, body mass index ≤40, T2DM diagnosis ≤10 years, no initiation of insulin therapy prior to the baseline visit, and a baseline HbA1c level ≥8.0%.
Physicians completed patient chart audit questionnaires based on clinical visits at two separate points in time (baseline and follow-up). Physicians completed questionnaires for baseline visits occurring within 3 months prior to the attended live CME event. If a patient had more than one office visit during the 3-month baseline period, the most recent visit was used for the completion of the questionnaire. Physicians also completed a follow-up questionnaire for visits occurring within 6 months after the live CME event. If more than one visit occurred during the 6-month follow-up period, then the last visit during the 6-month period was used for the chart review, since the HbA1c measurement there represents the final HbA1c in the follow-up period. Institutional Review Board approval was not required, since patient identifiable information was not collected, and the observational data were used solely for quality improvement purposes.
Assessment of Physician Learner Performance and Patient Health Outcomes
Improvement in physician learner performance and patient health outcomes were evaluated based on Moore’s framework outcome levels 1–6 [2], which were evaluated through the following means:
Pre- and post-activity surveys to measure baseline and immediate changes in declarative (level 3A) and procedural knowledge (level 3B)
30 to 60-day follow-up survey to measure impact on clinical decision making and changes in practice (levels 5)
Patient chart review to measure impact on clinical decision making and the resultant patient health outcomes (levels 5 and 6)
Anzeige
Statistical Analysis
Data on physician learner performance, along with patient chart review data from the baseline and follow-up visit questionnaires, were entered into an Excel-based study report form. Patient health outcome study endpoints included mean reduction in HbA1c, percent of patients with an HbA1c reduction of ≥0.5%, percent of patients initiating insulin therapy, percent of patients reaching HbA1c goal ≤7.0%, and the percentage of patients, whose therapy was intensified (overcoming clinical inertia). Descriptive univariate statistics, including mean and standard deviation (SD), were provided for continuous variables; count and percentage were provided for categorical variables. Paired student t test was used to evaluate the change in the mean patient HbA1c values from baseline measurements to the follow-up measurements after the CME program. Statistical data analyses were conducted using SAS 9.2 (SAS institute, Cary, North Carolina, USA).
Results
Summary of Physician Participation in CME Activities and Patient Chart Review
A total of 4112 primary care physicians attended 1 of 7 identical CME live programs on T2DM between February and December 2012 (Table 1). Of these, 445 replied with interest in the study, and 34 of 445 physicians completed both phases (live program and online case-based study) of the CME curricula. These physicians submitted 264 patient chart review forms (Table 1). Table 1 lists a breakdown of the number of patient charts submitted per physician as well as the number of participating physicians from each live CME site.
Table 1
Summary of physician participation in the CME live didactic program and patient chart review completion
Live CME program
Live CME attendance
N = 4112
Number of physicians who completed patient charts
Number of patient charts completed per physician
N = 264
Signup
N = 445
Completion
N = 34
Feb. 9, 2012
658
80
5
1, 1, 9, 12, 4 = 27
Mar. 10, 2012
523
99
7
9, 5, 6, 11, 3, 4, 5 = 43
April 11, 2012
918
69
7
4, 13, 3, 10, 7, 15, 17 = 69
June 23, 2012
548
75
8
1, 2, 10, 1, 5, 10, 13, 15 = 57
Sept. 19, 2012
510
54
3
15, 2, 5 = 22
Nov. 15, 2012
492
35
4
5, 7, 1, 33 = 46
Dec. 8, 2012
463
33
0
0
CME continuing medical education
Physician Learner Knowledge, Competence and Performance Scores
A summary of physician learner pre- and post-CME mean test scores for outcomes related to knowledge, competence, and performance (Moore’s framework levels 3, 4, and 5, respectively) is presented in Table 2. For the didactic live session, significant improvements in performance related outcomes were observed for all live sites (p < 0.05) with significance reaching p < 0.0005 for the online version of the same presentation (Table 2). Competence outcome scores were significantly higher post-CME for all sites except New York and Boston (Table 2). Knowledge outcome scores significantly improved post-CME for all sites except New York (Table 2). For the interactive case-based studies, knowledge significantly improved (p < 0.0005) for most categories (Table 2).
Table 2
Comparison of pre- and post-test mean scores for Moore’s level 3 (declarative and procedural knowledge), 4 (competence), and 5 (performance) outcomes
Live didactic program
Online case-based interactive activity
All CME
Fort L.
Houston
Anaheim
New York
Rosemont
Boston
Online
Clara
Bobby
Total
Moore’s Level
N
20
46
141
17
110
115
1270
841
620
3180
3 Knowledge
Pre-test
13.0 (27.0)
11.0 (22.1)
16.0 (26.9)
6.19 (17.9)
13.3 (24.7)
21.2 (31.1)
33.1 (34.7)
79.2 (22.0)
62.3 (25.1)
43.0 (37.6)
Post-test
45.7 (42.4)
22.5 (32.7)
25.8 (32.9)
13.3 (29.6)
25.60 (34.0)
41.2 (37.5)
48.1 (38.6)
86.4 (20.8)
71.6 (25.6)
54.8 (39.2)
Change
250.0*
105.0*
61.5*
115.4
92.3*
94.1**
45.3**
9.2**
15.0**
27.3**
4 Competence
Pre-test
69.6 (47.1)
56.04 (49.9)
39.6 (50.0)
19.1 (39.5)
46.8 (30.0)
57.6 (49.6)
70.4 (45.6)
69.9 (33.3)
49.9 (36.0)
59.9 (44.6)
Post-test
91.3 (29.8)
68.1 (46.9)
68.0 (46.7)
22.9 (42.2)
49.2 (30.1)
63.1 (48.4)
75.3 (43.2)
80.4 (30.0)
62.3 (33.8)
69.4 (42.1)
Change
31.3*
21.6*
71.9*
20.0
5.1*
9.7
6.7*
15.0
24.8**
15.9**
5 Performance
Pre-test
3.6 (1.0)
3.5 (1.2)
2.8 (1.2)
3.2 (1.3)
3.2 (1.3)
2.9 (1.1)
3.3 (1.2)
3.7 (1.2)
3.5 (1.1)
3.4 (1.2)
Post-test
4.5 (0.8)
4.4 (0.9)
4.0 (1.0)
4.8 (0.4)
4.5 (0.8)
4.2 (0.9)
4.0 (1.0)
4.2 (1.0)
3.9 (1.0)
4.09 (1.0)
Change
23.61*
25.60*
41.31*
47.3**
40.1*
44.5**
22.6**
13.9**
11.5**
19.8**
All scores presented as the mean % (SD) *p < 0.05, **p < 0.0005
CME continuing medical education, SD standard deviation
Patient Health Baseline Characteristics and Outcomes
Table 3 summarizes mean baseline characteristics captured in the patient chart reviews. Patient chart reviews were completed for 264 patients, of which 51.89% (n = 137) were male. The mean age of patients was 53.98 years (SD = 13.06). The mean duration of T2DM disease was 4.62 years. The mean HbA1c level at baseline was 9.37% (SD = 1.62%), and only 3.41% of patients (n = 9) had a baseline HbA1c level ≤7.0%.
Table 3
Baseline patient characteristics
Clinical characteristic
Value
N
%
Gender
Female
127
48.11
Male
137
51.89
Baseline characteristic
HbA1c ≤ 7%
9
3.41
Diabetes Duration (years)
Mean
4.62
SD
3.21
Age (years)
Mean
53.98
SD
13.06
BMI (kg/m2)
Mean
32.2
SD
4.97
Weight (lb)
Mean
203.4
SD
43.49
Height (in)
Mean
66.2
SD
4.34
HbA1c (%)
Mean
9.37
SD
1.62
Number of antihyperglycemic drugs
Mean
1.7
SD
Total patient count
264
BMI body mass index, HbA1c glycated hemoglobin, SD standard deviation
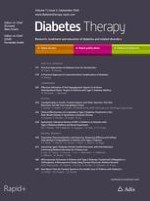
Improvements in patient health outcomes were observed in the follow-up period when comparing patient data captured in the follow-up chart reviews to the baseline patient data. The mean reduction in Hb1Ac levels and additional use of anti-diabetic medications were the primary endpoints measured for assessing patient health outcomes. Figure 1 illustrates a comparison of the mean Hb1Ac levels observed at the follow-up (8.22%; SD = 1.60%) and baseline (9.37%; SD = 1.62%) visits. A mean patient HbA1c absolute reduction of 1.15% (p < 0.0001) was observed in the follow-up period (Fig. 1). Table 4 lists additional endpoint results for patient health outcomes. 44.3% (n = 117) of patients initiated insulin therapy between the baseline and follow-up period. 64.4% percent (n = 170) of patients had a reduction in HbA1c levels of at least 0.5% (Table 4). 20.3% of patients (n = 50) had a mean HbA1c level ≤7.0% in the follow-up period compared to 3.41% of patients prior to the CME activities (baseline) (p < 0.0001). In addition, therapy was intensified for 75% of patients (n = 197) in the follow-up period.
Fig. 1
Change in mean HbA1c levels between baseline and follow-up periods. HbA1c glycated hemoglobin
Table 4
Summary of patient health outcome results: intra-individual baseline vs. follow-up comparison
Endpoint result
N
% Patients
HbA1c reduction ≥0.5%
170
64.4
Insulin therapy initiation
117
44.3
HbA1c ≤ 7.0%
50
20.3
Therapy escalation
197
75
Total patient count
264
HbA1c glycated hemoglobin
×
Discussion
Data from this study suggest that there is a potentially positive relationship between physician participation in a multiple platform CME curriculum and improvements in the outcomes of patients with T2DM. Significant improvements (p < 0.0005) in specific CME activity questions included resolving misconceptions related to multidisciplinary team care approaches, knowledge of how to individualize HbA1c targets, understanding the need to initiate and intensify insulin therapy, and increasing knowledge of appropriate therapeutic options. While physicians indicated adequate pre-activity knowledge in the role of post-prandial hyperglycemia in HbA1c control, performance outcomes regarding appropriate initiation of prandial insulin were improved by 56% (p < 0.0005) post-activity. In addition to positive improvements in physician performance outcomes, positive improvements in patient health outcomes, as measured by this study, were also observed. These patient health outcomes were designed to measure level 6 of Moore’s framework [2] for assessing CME program effectiveness, which evaluates the degree to which the health status of patients improves due to changes in the practice behavior of physicians [2]. This study used the reduction of mean HbA1C levels and additional use of anti-diabetic medication as the main endpoints for the evaluation of health outcomes; however, the management of diabetes may be multi-facet and may include other elements, such as patient satisfaction, etc., which were not evaluated in this study. Improved patient health outcomes included a significant reduction in mean HbA1c levels and an intensification of therapy for a majority of patients (75%) and insulin therapy initiation for nearly half of the patient population (44.3%) between the baseline and follow-up periods. Reduction of elevated mean HbA1c levels (target goal around 7%) is important in potentially reducing morbidity and mortality for T2DM patients. The intensification of therapy and initiation of insulin therapy observed for a large number of patients would potentially be very beneficial to patient health outcomes, including mean HbA1c levels. Appropriate treatment regimens and maintaining tight glycemic control are important for preventing complications associated with T2DM [1].
Several risks of bias are present in the study design which may contribute to alternate explanations for the improvements in patient health outcomes. Primarily, it is unknown how physicians selected the patients to include in this study, and it is possible that patients who had the greatest improvements were selectively chosen. However, the patient chart forms consisted of 25 questions with the main endpoint of Hb1Ac level embedded within these questions. In addition, physicians were blinded to the specific outcomes to be assessed. Therefore, deliberate selection of patients demonstrating improvements in Hb1Ac levels is not likely to have been a systematic method of patient selection. The response rate was low with only a small subset of physicians participating in the multiple CME curricula and completing patient chart reviews, and this could have skewed the results. This low rate of participation limits conclusions drawn on the impact of the CME on physician performance and improvements in patient health outcomes. In addition, physicians that were more willing to participate in this quality improvement study may be more willing to change their practice versus those that did not participate. Finally, although considerable improvements in knowledge occurred collectively, a direct connection between CME results for individual physician improvements and patient health outcomes was not made. Some of these study design limitations were due to resource limitations that educators face in conducting CME. However, despite these concerns, the data support that CME can potentially have a significant impact on clinician practice outcomes. To confirm these results, future studies should budget for randomized controlled studies of multiple media, case-based CMEs with a clear definition of intervention with control groups, and measurements of effectiveness at multiple points post-intervention.
Conclusion
Preliminary results from this qualitative study demonstrated potential for a positive relationship between multi-dimensional diabetes CME curricula and improvements in measured patient health outcomes. Improvements in patient health outcomes included a significant reduction in HbA1c levels, reduced barriers to the use of insulin, and reduced clinical inertia in patients with T2DM. These data suggest that CME which addresses physician knowledge gaps can potentially impact patient health outcomes. Future studies are needed to establish a direct link between individual physician improvements and patient health outcomes post-CME activities.
Anzeige
Acknowledgments
The CME activity in the study was supported by an independent educational grant from Sanofi. No separate financial funding from Sanofi was provided for the development of this manuscript. All named authors meet the International Committee of Medical Journal Editors (ICMJE) criteria for authorship for this manuscript, take responsibility for the integrity of the work as a whole, and have given final approval to the version to be published.
Disclosures
Marc L. Mosier, MD is an employee of Pri-Med, LLC, a medical education company that develops continuing education programs for health care professionals. Dr. Inzucchi has served as a scientific consultant or advisor to Sanofi, Merck, Janssen, Boehringer Ingelheim, Astra Zeneca, and Novo Nordisk. Dr. Trence owns stock in Medtronic and Sanofi. Brian Lee, PharmD is the principle and Medical Director of Horizon CME, Inc., a medical education company that develops continuing education programs for health care professionals. Cara Williams, PharmD and Elizabeth Wilkerson are employees of Horizon CME, Inc., a medical education company that develops continuing education programs for health care professionals. Steven Haimowitz, MD is the Chief Executive Officer of RealCME, an educational technology and analytics company. Terry Dex, PharmD is the Senior Scientific Director, Diabetes Medical Unit, Sanofi US and owns stock of Sanofi. Jay Lin is a consultant to Horizon CME.
Compliance with Ethics Guidelines
Institutional Review Board approval was not required, since patient identifiable information was not collected, and the observational data was used solely for quality improvement purposes.
Open Access
This article is distributed under the terms of the Creative Commons Attribution-NonCommercial 4.0 International License (http://creativecommons.org/licenses/by-nc/4.0/), which permits any noncommercial use, distribution, and reproduction in any medium, provided you give appropriate credit to the original author(s) and the source, provide a link to the Creative Commons license, and indicate if changes were made.
Anzeige
Open AccessThis article is distributed under the terms of the Creative Commons Attribution 4.0 International License (https://creativecommons.org/licenses/by/4.0), which permits use, duplication, adaptation, distribution, and reproduction in any medium or format, as long as you give appropriate credit to the original author(s) and the source, provide a link to the Creative Commons license, and indicate if changes were made.
Ob bei einer Notfalloperation nach Schenkelhalsfraktur eine Hemiarthroplastik oder eine totale Endoprothese (TEP) eingebaut wird, sollte nicht allein vom Alter der Patientinnen und Patienten abhängen. Auch über 90-Jährige können von der TEP profitieren.
Wenn unter einer medikamentösen Hochdrucktherapie der diastolische Blutdruck in den Keller geht, steigt das Risiko für schwere kardiovaskuläre Ereignisse: Darauf deutet eine Sekundäranalyse der SPRINT-Studie hin.
Insektenstiche sind bei Erwachsenen die häufigsten Auslöser einer Anaphylaxie. Einen wirksamen Schutz vor schweren anaphylaktischen Reaktionen bietet die allergenspezifische Immuntherapie. Jedoch kommt sie noch viel zu selten zum Einsatz.
Beginnen ältere Männer im Pflegeheim eine Antihypertensiva-Therapie, dann ist die Frakturrate in den folgenden 30 Tagen mehr als verdoppelt. Besonders häufig stürzen Demenzkranke und Männer, die erstmals Blutdrucksenker nehmen. Dafür spricht eine Analyse unter US-Veteranen.
Update Innere Medizin
Bestellen Sie unseren Fach-Newsletter und bleiben Sie gut informiert.