The burden of disease and injury in the United States 1996
verfasst von:
Catherine M Michaud, Matthew T McKenna, Stephen Begg, Niels Tomijima, Meghna Majmudar, Maria T Bulzacchelli, Shahul Ebrahim, Majid Ezzati, Joshua A Salomon, Jessica Gaber Kreiser, Mollie Hogan, Christopher JL Murray
Burden of disease studies have been implemented in many countries using the Disability-Adjusted Life Year (DALY) to assess major health problems. Important objectives of the study were to quantify intra-country differentials in health outcomes and to place the United States situation in the international context.
Methods
We applied methods developed for the Global Burden of Disease (GBD) to data specific to the United States to compute Disability-Adjusted Life Years. Estimates are provided by age and gender for the general population of the United States and for each of the four official race groups: White; Black; American Indian or Alaskan Native; and Asian or Pacific Islander. Several adjustments of GBD methods were made: the inclusion of race; a revised list of causes; and a revised algorithm to allocate cardiovascular disease garbage codes to ischaemic heart disease. We compared the results of this analysis to international estimates published by the World Health Organization for developed and developing regions of the world.
Results
In the mid-1990s the leading sources of premature death and disability in the United States, as measured by DALYs, were: cardiovascular conditions, breast and lung cancers, depression, osteoarthritis, diabetes mellitus, and alcohol use and abuse. In addition, motor vehicle-related injuries and the HIV epidemic exacted a substantial toll on the health status of the US population, particularly among racial minorities. The major sources of death and disability in these latter populations were more similar to patterns of burden in developing rather than developed countries.
Conclusion
Estimating DALYs specifically for the United States provides a comprehensive assessment of health problems for this country compared to what is available using mortality data alone.
The online version of this article (doi:10.1186/1478-7954-4-11) contains supplementary material, which is available to authorized users.
Competing interests
The author(s) declare that they have no competing interests.
Authors' contributions
CJL conceived of the study, participated in its design, and helped to draft the manuscript. CMM, MTM participated in the study's design and coordination, data analysis and helped to draft the manuscript. SB, NT, MM, MTB, EME, JS, JGK, MH contributed to data analysis. ME helped to draft the manuscript. All authors read and approved the final manuscript.
Background
This paper presents the results of a study conducted cooperatively by scientists from the Centers for Disease Control and Prevention (CDC) and the Harvard School of Public Health. The study essentially applied the methods used in the Global Burden of Disease analysis to data specific to the United States in order to calculate Disability-Adjusted Life Year (DALY) values for major health conditions and risk factors [1].
The genesis of the US Burden of Disease and Injury study (USBODI) was the release of the 1993 World Development Report: Investing in Health published by the World Bank. This landmark report in international health policy introduced a new summary measure of population health – the Disability-Adjusted Life Year (DALY) [2]. In contrast to the traditional reliance on death counts and rates to assess the burden of health events, the DALY attempted to combine the impact of non-fatal health outcomes with mortality. Though originally developed for comparative analyses of disease burden in different regions of the world, this perspective seemed particularly appropriate to inform policy in a country such as the United States. In industrialized country settings, where death rates are low relative to developing countries, the majority of deaths occur after the age of 75 years. Yet too many deaths still occur at younger ages and many could be prevented. Therefore, information for health policy deliberations needs to emphasize the burden of premature mortality as well as disability. As stated in a recent Institute of Medicine report on summary health measures, "Mortality measures, although important, provide decision makers incomplete and insensitive information about overall population health." [3].
Anzeige
From the outset, this study had three major goals. The first goal was to incorporate non-fatal conditions into assessments of health status in the United States. So far most discussions about the relative importance of various health conditions centered on the number of deaths attributed to specific diseases, injuries or risk factors [4]. The focus on deaths has important implications for policy and great influence on resource allocation. As the average life expectancy continues to rise in economically developed countries, more and more deaths are attributed to chronic conditions that are recalcitrant to treatment and may have limited preventability [5]. Prioritization of research and health care expenditures based on such data tends to result in a focus on rescue-oriented, life-saving, and technologically advanced approaches rather than adequate consideration of interventions that promote healthy life-styles and improve overall physical and emotional function [6]. The DALY offers a rational methodology for weighing the relative importance of fatal and non-fatal health events. Hence, a much broader range of health conditions that are rarely identified as causes of death, such as mental health disorders and musculoskeletal diseases, can be introduced into data-based deliberations on health policy.
The second major goal was to develop a comprehensive set of internally consistent and scientifically credible epidemiological estimates for the major health conditions in the United States. This is greatly facilitated by a plethora of population-based surveys, registries and administrative data systems that attempt to capture information on a wide range of health events [7]. The major challenge is to impose a consistent and conceptually rigorous analytic approach so that the estimates are internally consistent. Reviews of cost-effectiveness ratios that depend on epidemiologic data and statistical modeling have demonstrated that it is very difficult to compare results from one study to the next because of major variations in methods, underlying assumptions, data sources and conceptual frameworks [8]. A major source of these inconsistencies is that most such models are developed on a case by case, disease by disease basis, with little attention to conceptual consistency and integration of data from multiple sources [9]. Estimates developed with an adherence to conceptual consistency for the United States can serve not only as a useful source of epidemiologic information, but can also stimulate further analyses and refinements by other investigators.
The third and final goal of the US Burden of Disease and Injury study was to provide a set of internationally comparable health statistics that place the United States public health situation in a global context. World population growth and technological developments over the last few decades in telecommunications, industrial pollution and transportation have effectively made the earth a much smaller planet [10]. This dynamic has major implications for the importation and exportation of health related vectors that include infectious diseases, manufactured products (e.g. energy rich foods, tobacco), and health system organization and practices [11‐13]. Given the emergence of this global public health "village," and the growing importance of the DALY as a metric for assessing population health, it seems critical to provide an analysis of the public health situation in the United States that uses methods being adopted by international organizations and health ministries throughout the world.
The Global Burden of Disease (GBD) study developed health statistics for 8 large regions of the world. It includes the United States, which possesses substantial intra- national racial, ethnic and cultural variability. Generating a set of estimates specific to the United States not only provides an opportunity to frame the major health problems in this country in a global context, but also facilitates explication of intra- national disparities. For example, a previously published monograph that resulted from this project identified differences between race, sex and county-specific life expectancies that rivaled differences seen between the nations with the highest (Japan) and lowest (Sierra Leone) life expectancy values in the world [14].
Anzeige
The overall purpose of this study is to expand the understanding of the major determinants of ill and good health in the United States. The ultimate goal of such understanding should be policies and programs that decrease the overall impact and disparities in disease, disability and premature death.
Methods
The study was patterned after the GBD and applied methods used in the GBD analysis to compute years of life lost due to premature mortality (YLL), years of life lost due to disability (YLD), and disability-adjusted life years (DALYs). The conceptual and computational details of how these parameters were estimated for individual conditions have been presented in the GBD. A summary overview of GBD methods is provided [see Additional file 1].
The detailed mortality data file for 1996 provided deaths by age, sex and race to compute YLL [15]. The National Health Interview Survey (NHIS), National Health and Nutrition Examination Survey (NHANES), National Longitudinal Alcohol Epidemiologic Survey (NLAES), the National Hospital Discharge Database, disease registers, and epidemiological studies provided the epidemiological parameters needed to compute YLD for 72 conditions that account for at least 90 per cent of the DALY total in the United States. If data on race and gender specific subgroups were too sparse to derive reasonable epidemiological parameters for particular conditions, YLD were estimated for these subgroups using YLD to YLL ratios for the overall population. For the remaining 26 conditions, YLD were calculated using YLD to YLL ratios from Established Market Economies (EME) countries in the GBD, applied to US specific estimates of YLL. A detailed presentation of analytic methods, data sources, and data sets used to develop estimates for major causes of diseases and injuries is provided [see Additional file 2].
Below we describe adjustments that were made to GBD methods in the context of the United States. These were 1) the inclusion of race; 2) a revised list of causes; and 3) a revised algorithm to allocate cardiovascular disease garbage codes to ischaemic heart disease (IHD).
Selection of population groups
Estimates of the burden of disease and injury were done by gender and seven age groups (0–4; 5–14; 15–24; 25–44; 45–64; 65–74 and 75+) for the total US population, as well as for each of the four official race groups specified by the Office of Management and Budget (OMB): White; Black; American Indian or Alaskan Native; and Asian or Pacific Islander. Whites were the largest population group (82.8 per cent, or 219.7 million). Blacks represented 12.6 per cent of the population (33.5 million); American Indians – 0.9 per cent (2.3 million), and Asians – 3.7 per cent (9.7 million). Estimates by ethnicity were not included in this report because reliable estimates were only available for a subset of the Hispanic population.
The inclusion of race in the analysis posed particular challenges for minority populations because of race misclassification. Two independent data sets were combined to calculate death rates: the number of deaths in the numerator comes from the detailed mortality file, and population numbers in the denominator are from the census. There was no discrepancy in reporting of race in both data sets for Whites and Blacks, but race misclassification was found to be problematic for Asians and American Indians. Self-reporting of race in the census tended to be higher, particularly for American Indians, than was the attribution of race (by a third party) on death certificates – which will yield an underestimate of death rates [16]. However, we did not correct for race misclassification in American Indians and Asians because evaluations showed that discrepancies in race reporting varied from year to year and thus provided supportive evidence that there may be no systematic bias. Therefore race differentials expressed as rates may have been slightly overestimated. Death and DALY rates were age-standardized to the general population.
There were also important gaps in the available epidemiological data for Asians and American Indians. In order to fill information gaps, we assumed that ratios of YLL to YLD by cause, gender and age were similar to that of the total population. Such assumptions introduce a certain level of uncertainty in the estimates, and call for caution in the interpretation of rankings for causes that have small differences in the number of DALYs. For simplicity, American Indians or Alaskan Natives are referred to as "American Indians," and Asians or Pacific Islanders as "Asians" in the text, tables and figures below.
USBODI cause list
Even though essentially all deaths in the United States are registered and medically certified, a detailed assessment of mortality data was conducted as part of the USBODI. This was done to further explore and refine the utility of the adjustment procedures for misclassification that were used in the GBD, and to provide a contrast to the overall results using the DALY.
Anzeige
The International Statistical Classification of Disease and Related Health Problems, Version 9, (ICD-9) [17] code listed as the underlying cause for each death recorded in the United States in 1996 was attributed to corresponding disease categories listed in the GBD. The GBD classification scheme was developed as a tool to better inform the health policy debate (Table 1). The list of causes selected for the USBODI was amended based on the distribution of causes of deaths in the United States. All ICD-9 reported codes accounting for more than 0.1 per cent of total deaths were examined. This process identified modifications that were needed from the GBD cause list. Several causes of little relevance to the United States were dropped, i.e. malaria and other tropical diseases. Other causes were added, i.e. Sudden Infant Death Syndrome (SIDS), and septicemia. For those codes accounting for more than 0.1 per cent of deaths that were not included in the GBD list the choice was made in consultation with CDC based on two major criteria. If the code represented a true cause of death with significance for health policy, it was added to the cause list. If the code more likely represented a "garbage category," then after consultation with experts in that disease and a review of published autopsy studies on this subject, a redistribution algorithm was proposed and applied. For example, careful consideration was given to the nearly 10.9 per cent of cancer deaths assigned to "unknown primary." There were another 4% of cancers that did not have a code that corresponded to the GBD classification system. The race and sex specific age distribution of cancers attributed to an ill-defined primary source were compared to all other cancer deaths. These distributions were generally similar. Therefore, cancers attributed to an ill-defined primary source were redistributed proportionally to all defined primary sources based on age, race and sex specific distributions. The detailed list of causes selected for the USBODI is provided [see Additional file 3].
Table 1
Global burden of disease classification system – main categories
Communicable, maternal, perinatal and nutritional conditions (Group I)
A. Infectious and parasitic diseases
B. Respiratory infections
C. Maternal conditions
D. Conditions arising during the perinatal period
E. Nutritional deficiencies
Noncommunicable diseases (Group II)
A. Malignant neoplasms
B. Other neoplasms
C. Diabetes mellitus
D. Endocrine disorders
E. Neuro-psychiatric conditions
F. Sense organ diseases
G. Cardiovascular diseases
H. Respiratory diseases
I. Digestive diseases
J. Genito-urinary diseases
K. Skin diseases
L. Musculo-skeletal diseases
M. Congenital anomalies
N. Oral conditions
Injuries (Group III)
A. Unintentional injuries
B. Intentional injuries
Source: Global Burden of Disease and Injury 1990
Redistribution algorithm for cardiovascular garbage codes
The most problematic aspect of cause of death coding pertains to coding of ischaemic heart disease (IHD) (ICD-9 codes 410–414), which is one of the leading causes of premature mortality. The wide cross-national variations that exist in IHD reported mortality rates were explored in the context of the GBD and were convincingly attributed to variations across countries in coding practices. Physicians may use several ICD-9 codes that are actually due to IHD when they assign the cause of death. These include heart failure (428), ventricular dysrhythmias (427.1, 427.4, 427.5), general atherosclerosis (440.9), and ill-defined descriptions and complications of heart disease (429.0, 429.1, 429.2 and 429.9). IHD deaths may be assigned to these ill-defined cardiovascular codes, or "garbage codes" because of insufficient clinical information at the time of death, local medical diagnostic practices or simply by error. The statistical approach developed to correct for likely undercoding resulting from different coding practices in the GBD included a two-step procedure comprising an ordinary least squares (OLS) regression equation predicting the proportion of cardiovascular death for each age group assigned to ill-defined codes as a function of the proportion of deaths assigned to IHD, and the correction of proportions for each country within set constraints, based on the assumption that the cluster of countries where ill-defined coding was low defined the standard coding practices.
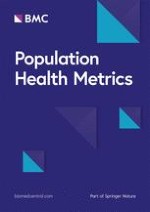
An exploration of cardiovascular death coding in the United States showed important differences in coding practices between states. Indeed, the proportion of all cardiovascular deaths (minus stroke) coded to cardiovascular "garbage" codes ranged from 14% in New Mexico to 37% in Alabama and New Jersey (Table 2). Figure 1 illustrates the enormous variation across US states in coding practices with respect to these ill-defined cardiovascular codes. For each state, the fraction of cardiovascular deaths (excluding stroke) that are assigned to ICD-9 codes 410–414 is shown on the y-axis. On the x-axis the fraction of cardiovascular deaths (excluding stroke) that are assigned to the ill-defined cardiovascular codes is measured. The strong negative relation between IHD mortality and that from ill-defined cardiovascular codes supports the suggestion that the quality of IHD death certification varies substantially across states, as it does across countries in the world.
Table 2
Proportion of all cardiovascular deaths (except stroke) coded to cardiovascular "garbage codes" by state – United States 1996
State name
% CV garbage
State name
% CV garbage
State name
% CV garbage
Alabama
37
Kentucky
25
North Dakota
19
Alaska
22
Louisiana
23
Ohio
25
Arizona
22
Maine
24
Oklahoma
18
Arkansas
21
Maryland
24
Oregon
23
California
18
Massachusetts
22
Pennsylvania
15
Colorado
26
Michigan
19
Rhode Island
20
Connecticut
29
Minnesota
35
South Carolina
21
Delaware
29
Mississippi
17
South Dakota
19
DC
28
Missouri
29
Tennessee
21
Florida
16
Montana
31
Texas
24
Georgia
30
Nebraska
34
Utah
24
Hawaii
28
Nevada
20
Vermont
26
Idaho
17
New Hampshire
17
Virginia
24
Illinois
19
New Jersey
37
Washington
26
Indiana
18
New Mexico
14
West Virginia
17
Iowa
20
New York
19
Wisconsin
21
Kansas
24
North Carolina
21
Wyoming
19
Figure 1
Proportion of cardiovascular disease deaths (excluding stroke) assigned to selected codes for ill-defined causes and directly assigned to ischemic heart disease in the United States.
×
This preliminary analysis confirmed the need to correct for under-registration of IHD in the US. To estimate the fraction of IHD deaths assigned to ill-defined cardiovasular codes, the regression equation applied in the GBD was revised. Age and sex specific lung cancer death rates were added to the model. Lung cancer mortality rates measure the cumulative effects of tobacco exposure as a risk factor for IHD [18].
Anzeige
The regression model for the US included age and sex specific lung cancer death rates, and ill-defined cardiovascular disease (CVD) rates for Blacks and Whites. These regression equations predicted the proportion of ill-defined CVD deaths by age and sex for Whites and Blacks. We applied results of regression equations for Whites to American Indians and Asians, which were not included in the regressions due their small population size.
The finding that the extent of miscoding increased in older age groups is consistent with GBD regression results: R-square increases with increasing age, which provides further evidence that ill-defined codes are indeed being used for IHD which is more common in older ages. Differences in coding practices observed by race as well as gender are not fully explained (Table 3). A recent study concluded that "the greater presence of medical knowledge at the time of death, reflected by place of death and cardiologist per capita, reduces the use of ill-defined cardiovascular clusters. Racial and gender effects on coronary heart disease (CHD) assignment may reflect disparities in access to care and quality of care." [19]
Table 3
R-squared values applied to the redistribution of cardiovascular garbage codes
WHITES
Male
Lung Cancer
CVGarbageCodes
R-squared
Coefficient
Pvalue
Coefficient
Pvalue
15
-0.499
0.273
0.557
.000
26.17%
30
2.396
.000
-0.193
0.424
52.10%
45
1.495
.000
-0.741
.000
77.77%
65
1.235
.000
-0.833
.000
69.02%
75
2.73
.000
-1.122
.000
47.64%
Female
15
0.348
0.0324
0.097
0.395
3.53%
30
0.727
.000
0.539
0.008
37.82%
45
0.869
.000
-0.315
0.283
31.41%
65
-0.459
0.206
0.752
0.018
11.47%
75
2.011
0.123
-0.679
0.021
12.25%
BLACKS
Male
Lung Cancer
CV GarbageCodes
R-squared
Coefficient
Pvalue
Coefficient
Pvalue
15
0.592
0.314
-0.0393
0.792
4.13%
30
1.575
0.013
0.0735
0.785
23.40%
45
1.211
.000
-0.403
0.025
47.27%
65
0.435
0.082
-0.551
.000
40.73%
75
0.183
0.769
-0.7207
0.005
26.34%
Female
15
-0.829
0.042
0.256
0.047
16.06%
30
-0.846
0.0127
0.532
0.03
12.85%
45
0.02
0.942
-0.11
0.634
8.30%
65
0.695
0.42
-1.369
0.059
13.60%
75
1.015
0.524
-0.772
0.013
16.67%
International comparisons
Ten countries with comparable levels of development and a population greater than 10 million: Australia, Canada, France, Germany, Greece, Italy, Japan, Netherlands, Spain and the United Kingdom, were selected for international comparisons. YLL by cause were obtained directly from the World Health Organization (WHO). YLD and DALY estimates were only available at the regional level, with the exception of Australia, where a national burden of disease study applying the GBD methodology had been conducted [21].
International comparisons may address two sets of issues – the difference in the magnitude of YLL (expressed as YLL rates), or differences in the distribution of major causes of YLL. We examined differences in rankings of major causes of YLL and YLL rates between the United States and other comparable countries.
Anzeige
Rankings for the twenty leading causes of mortality burden in the United States were compared to rankings for these conditions in the ten selected countries. We made one change in the list of conditions adopted for the United States to ensure comparability among countries, which was to combine mortality burden due to lymphomas and multiple myelomas. These two conditions are different forms of reticuloendothelial malignancies. Estimates were not available for these conditions separately in several of the selected countries. This change slightly altered rankings in the United States for several conditions, as the two conditions combined had a higher mortality burden than lymphomas alone. Lymphomas and multiple myelomas ranked 14th for males and 13th for females, and the mortality burden for lymphomas ranked 19th and 17th respectively. We plotted the rankings for each of the twenty leading causes of mortality burden in the United States (horizontal bars) against the range of rankings observed for each of these conditions in the selected countries (vertical bars), for each sex. The lowest and highest rankings observed in the countries other than the US define the bounds of vertical bars for each condition. Rankings, from one to twenty, are inversely related to the magnitude of mortality burden. Thus, IHD, which caused the largest number of YLL in the United States, ranked 1st. We also compared YLL rankings for the twenty leading causes of YLL for each race and sex against the ranges observed in the ten selected countries.
Results
Detailed tabulations of deaths, YLL, YLD and DALYs for the 73 causes included in the USBODI by age, gender and race are provided [see Additional file 4]. Epidemiological parameters (incidence, prevalence, age at onset, duration, remission rates) and disability weights for each condition are provided [see Additional file 5].
Below we report key findings for the burden of disease and injury (DALYs); the mortality burden due to premature deaths (YLL); and the disability burden due to non-fatal health outcomes (YLD).
Burden of disease and injury
Leading causes of DALYs
The burden of disease and injury resulting from premature deaths and disability was an estimated 33 million DALYs in 1996. Premature mortality contributed 55 per cent of the total (18 million YLL), and disability – 45 per cent (15 million YLD). Noncommunicable diseases (Group II) caused 80 per cent of total DALYs, the balance being almost equally divided between communicable diseases, maternal, perinatal and nutritional causes (Group I) and injuries (Group III). Cardiovascular diseases, neuropsychiatric conditions, cancers and injuries caused approximately two thirds of the total DALYs (Figure 2). Ischaemic heart disease (IHD) was the leading and single largest cause of deaths and DALYs causing almost 10 per cent of DALYs. The three other causes ranking in the top five-cerebrovascular diseases, motor vehicle accidents, unipolar major depression – contributed almost equally to the total burden, with shares ranging between 4.1 and 4.6 per cent (Table 6).
Figure 2
Burden of Disease (DALYs) by sex and major disease groups, US, 1996.
Table 6
Twenty leading causes of DALYs and deaths, US 1996
DALY
% of total
Deaths
% of total
Total DALYs
33,090,212
Total Deaths
2,314,689
Ischemic heart disease
3,134,732
9.5
Ischemic heart disease
536,314
23.17
Cerebrovascular Disease
1,510,287
4.6
Lung trachea or bronchial cancer
168,206
7.27
Motor vehicle accidents
1,393,278
4.2
Cerebrovascular Disease
161,678
6.98
Unipolar major depression
1,370,285
4.1
COPD
99,982
4.32
Lung trachea or bronchial cancer
1,362,712
4.1
Lower respiratory infections
84,319
3.64
COPD
1,253,491
3.8
Diabetes mellitus
62,452
2.70
Alcohol use
1,141,193
3.4
Cancer colon or rectum
61,189
2.64
HIV
956,418
2.9
Breast cancer
46,649
2.02
Diabetes mellitus
946,291
2.9
Motor vehicle accidents
43,735
1.89
Osteoarthritis
942,682
2.8
Dementia and other degenerative and hereditary CNS disorders
43,190
1.87
Dementia and other degenerative and hereditary CNS disorders
889,242
2.7
Hypertension and hypertensive heart disease
39,589
1.71
Congenital Abnomalities
761,951
2.3
Prostate cancer
36,667
1.58
Homicide and Violence
714,621
2.2
Self-inflicted
31,725
1.37
Self-inflicted
674,443
2.0
HIV
31,188
1.35
Asthma
665,103
2.0
Cancer pancreas
29,494
1.27
Drug use
543,841
1.6
Inflammatory Cardiac
29,066
1.26
Breast cancer
514,786
1.6
Lymphomas
26,443
1.14
Conditions arising during the perinatal period
493,958
1.5
Cirrhosis of the liver
25,488
1.10
Cancer colon or rectum
483,931
1.5
Nephritis or nephrosis
24,569
1.06
Cirrhosis of the liver
411,539
1.2
Homicide and Violence
22,351
0.01
×
Sex and age patterns
The total disease burden for males (17.9 million DALYs) exceeded that for females (15 million DALYs). The excess disease burden for males was mostly due to the much larger number of premature deaths in young adult males. IHD resulted in twice the number of DALYs for males as it did for females, and was equal to the combined disease burden due to the three major causes of injuries that took a high toll in young adult males – motor vehicle accidents, homicide and violence, and self-inflicted injuries. Unipolar major depression caused almost the same disease burden for females that did motor vehicle accidents for males (Table 7).
Table 7
Twenty leading causes of DALYs, by sex, US 1996
Males
Cause list
DALY
% total
Total DALY
17,860,393
1
Ischaemic heart disease
1,958,184
11.0%
2
Motor vehicle accidents
933,798
5.2%
3
Lung trachea or bronchial cancer
812,804
4.6%
4
HIV
763,816
4.3%
5
Alcohol use
731,890
4.1%
6
Cerebrovascular Disease
673,928
3.8%
7
COPD
641,701
3.6%
8
Homicide and Violence
567,717
3.2%
9
Self-inflicted
541,399
3.0%
10
Unipolar major depression
469,929
2.6%
11
Diabetes mellitus
442,051
2.5%
12
Osteoarthritis
434,856
2.4%
13
Drug use
411,780
2.3%
14
Congenital Abnomalities
410,388
2.3%
15
Dementia and other degenerative and hereditary CNS disorders
382,392
2.1%
16
Asthma
303,088
1.7%
17
Cirrhosis of the liver
280,632
1.6%
18
Conditions arising during the perinatal period
273,577
1.5%
19
Cancer colon or rectum
249,462
1.4%
20
Prostate cancer
238,889
1.3%
sub-total
11,522,281
64.5%
Females
Cause list
DALY
% total
Total DALY
15,229,819
1
Ischaemic heart disease
1,176,548
7.7%
2
Unipolar major depression
900,356
5.9%
3
Cerebrovascular Disease
836,359
5.5%
4
COPD
611,790
4.0%
5
Lung trachea or bronchial cancer
549,908
3.6%
6
Breast cancer
514,786
3.4%
7
Osteoarthritis
507,826
3.3%
8
Dementia and other degenerative and hereditary CNS disorders
506,849
3.3%
9
Diabetes mellitus
504,240
3.3%
10
Motor vehicle accidents
459,480
3.0%
11
Alcohol use
409,303
2.7%
12
Asthma
362,015
2.4%
13
Congenital Abnomalities
351,563
2.3%
14
Cancer colon or rectum
234,469
1.5%
15
Conditions arising during the perinatal period
220,382
1.4%
16
Lower respiratory infections
195,448
1.3%
17
PTSD
193,533
1.3%
18
HIV
192,602
1.3%
19
Panic disorder
182,218
1.2%
20
Bipolar disorder
165,236
1.1%
Half of the total disease burden in the United States occurred in adults between the ages of 25 and 64 years, the other half being almost evenly split between younger and older age groups: 23 per cent under the age of 25 years, and 27 per cent for ages 65 years and above. In sharp contrast, the number of deaths gradually increased with age. More than half of all deaths occurred in adults aged 75 years and older (Table 8).
Table 8
Ten leading causes of DALYs by age, US 1996
Rank
All ages
DALYs
% of total
0–4
DALYs
% of total
Total
33,090,212
Total
2,123,767
1
Ischaemic heart disease
3,134,732
9.5
Congenital abnomalities
679,542
32.0
2
Cerebrovascular disease
1,510,287
4.6
Perinatal conditions
492,486
23.2
3
Motor vehicle accidents
1,393,278
4.2
Sudden infant death syndrome
102,255
4.8
4
Unipolar major depression
1,370,285
4.1
Asthma
77,323
3.6
5
Lung, trachea or bronchial cancer
1,362,712
4.1
Diarrhoeal diseases
60,438
2.8
6
COPD
1,253,491
3.8
Motor vehicle accidents
48,630
2.3
7
Alcohol use
1,141,193
3.4
Falls
41,289
1.9
8
HIV
956,418
2.9
Homicide and violence
35,055
1.7
9
Diabetes mellitus
946,291
2.9
Lower respiratory infections
30,640
1.4
10
Osteoarthritis
942,682
2.8
Fires
22,090
1.0
Rank
5–14
DALYs
% of total
15–24
DALYs
% of total
Total
1,136,989
Total
3,884,235
1
Asthma
236,494
20.8
Motor vehicle accidents
499,505
12.9
2
Motor vehicle accidents
128,357
11.3
Alcohol use
433,515
11.2
3
Unipolar major depression
61,622
5.4
Drug use
291,844
7.5
4
Epilepsy
42,461
3.7
Homicide and violence
282,746
7.3
5
Schizophrenia
41,254
3.6
Schizophrenia
237,967
6.1
6
Falls
39,886
3.5
Bipolar disorder
221,134
5.7
7
Homicide and violence
28,242
2.5
Unipolar major depression
197,309
5.1
8
Fires
19,514
1.7
Panic disorder
158,379
4.1
9
Congenital abnomalities
17,860
1.6
Asthma
157,997
4.1
10
Drowning
16,472
1.4
Self-inflicted
157,281
4.0
Rank
25–44
DALYs
% of total
45–64
DALYs
% of total
Total
8,364,608
Total
8,478,954
1
Unipolar major depression
823,548
9.8
Ischaemic heart disease
1,154,002
13.6
2
HIV
751,598
9.0
Lung, trachea or bronchial cancer
630,224
7.4
3
Alcohol use
549,949
6.6
COPD
504,418
5.9
4
Motor vehicle accidents
523,203
6.3
Cerebrovascular Disease
492,918
5.8
5
Self-inflicted
352,241
4.2
Diabetes mellitus
395,612
4.7
6
Homicide and violence
308,550
3.7
Osteoarthritis
361,774
4.3
7
Ischaemic heart disease
274,704
3.3
Breast cancer
250,963
3.0
8
Diabetes mellitus
238,472
2.9
Unipolar major depression
237,590
2.8
9
COPD
234,552
2.8
Cirrhosis of the liver
208,861
2.5
10
Drug use
222,535
2.7
Cancer colon or rectum
190,453
2.2
Rank
65–74
DALYs
% of total
75+
DALYs
% of total
Total
4,710,335
Total
4,391,323
1
Ischaemic heart disease
820,583
17.4
Ischaemic heart disease
876,239
20.0
2
Lung, trachea or bronchial cancer
448,452
9.5
Dementias
469,035
10.7
3
Cerebrovascular disease
373,629
7.9
Cerebrovascular disease
420,278
48.0
4
COPD
282,397
6.0
Lung, trachea or bronchial cancer
200,620
4.6
5
Osteoarthritis
266,685
5.7
COPD
186,379
4.2
6
Dementias
224,484
4.8
Osteoarthritis
161,077
3.7
7
Diabetes mellitus
168,605
3.6
Lower respiratory infections
146,631
3.3
8
Cancer colon or rectum
138,630
2.9
Cancer colon or rectum
106,111
2.4
9
Prostate cancer
97,033
2.1
Diabetes mellitus
106,061
2.4
10
Breast cancer
94,919
2.0
Prostate cancer
81,456
1.9
The share of total DALYs was very similar for both sexes up to the age of 14 years, but increased in adult males between 15 and 64 years. In older adults, the share of total DALYs for females exceeded that for males (Table 9). Differentials in DALY rates between males and females were greatest between 25 and 44 years, when motor vehicle accidents, alcohol use and abuse, HIV/AIDS and major unipolar depression took the highest toll.
Table 9
Distribution of burden of disease (DALYs) by age group and sex, US, 1996
Total
Males
Females
Age Group
DALYs
% of total
DALYs
% of total
DALYs
% of total
0–4 years
2,123,767
6.4%
1,164,600
6.5%
959,167
6.3%
5–14 years
1,136,989
3.4%
623,416
3.5%
513,573
3.4%
15–24 years
3,884,235
11.7%
2,279,895
12.8%
1,604,340
10.5%
25–44 years
8,364,608
25.3%
4,800,710
26.9%
3,563,898
23.4%
45–64 years
8,478,954
25.6%
4,754,166
26.6%
3,724,788
24.5%
65–74 years
4,710,335
14.2%
2,455,407
13.7%
2,254,928
14.8%
75 years and over
4,391,323
13.3%
1,782,198
10.0%
2,609,125
17.1%
Total
33,090,212
17,860,393
15,229,819
Patterns by race
Blacks and American Indians suffered disproportionate shares of total burden relative to their population size: DALY rates per thousand were 165.7 for Blacks; 128.7 for American Indians; 120.6 for Whites, and 75.3 for Asians. The proportional distribution of Groups I, II, and III varied between races, pointing to important differences in prevailing patterns of burden of disease. Group I and III combined caused one fifth of total DALYs for Whites and Asians, and one third of total DALYs for Blacks and American Indians. The excess was due to Group I (17 per cent of total DALYs) for Blacks and Group III for American Indians (19 per cent of total DALYs) (Figure 3).
Figure 3
Groups I, II, and III as a percentage of total burden of disease (DALY) by race, US, 1996.
×
IHD was among the three leading causes of DALYs for all races. The two other causes were cerebrovascular diseases and lung cancer for Whites; HIV/AIDS and homicide and violence for Blacks; alcohol use and motor vehicle accidents for American Indians; and unipolar major depression and cerebrovascular diseases for Asians (Table 10).
Table 10
Ten leading causes of DALYs by race, US 1996
Whites
DALYs
% total
American Indians
DALYs
% total
Rank
Total
26,510,011
Rank
Total
294,474
1
Ischaemic heart disease
2,710,918
10.2%
1
Alcohol use
46,419
15.8%
2
Cerebrovascular Disease
1,201,246
4.5%
2
Motor vehicle accidents
23,112
7.8%
3
Lung trachea or bronchial cancer
1,170,492
4.4%
3
Ischaemic heart disease
14,598
5.0%
4
Motor vehicle accidents
1,148,293
4.3%
4
Unipolar major depression
11,815
4.0%
5
Unipolar major depression
1,127,045
4.3%
5
Cirrhosis of the liver
9,293
3.2%
6
COPD
1,111,489
4.2%
6
Diabetes mellitus
9,070
3.1%
7
Alcohol use
857,509
3.2%
7
Self-inflicted
8,336
2.8%
8
Osteoarthritis
820,284
3.1%
8
Cerebrovascular Disease
8,241
2.8%
9
Dementia and other degenerative and hereditary CNS disorders
791,780
3.0%
9
Homicide and Violence
7,754
2.6%
10
Diabetes mellitus
727,575
2.7%
10
Congenital Abnormalities
7,489
2.5%
Sub-total
11,666,630
44.0%
sub-total
146,128
49.6%
Blacks
DALYs
% total
Asians
DALYs
% total
Rank
Total
5,552,448
Rank
Total
733,279
1
HIV/AIDS
429,383
7.7%
1
Unipolar major depression
54,264
7.4%
2
Ischaemic heart disease
370,170
6.7%
2
Ischaemic heart disease
39,046
5.3%
3
Homicide and Violence
336,215
6.1%
3
Cerebrovascular Disease
33,883
4.6%
4
Cerebrovascular Disease
266,918
4.8%
4
COPD
29,040
4.0%
5
Alcohol use
230,780
4.2%
5
Osteoarthritis
29,027
4.0%
6
Motor vehicle accidents
193,159
3.5%
6
Motor vehicle accidents
28,714
3.9%
7
Diabetes mellitus
189,656
3.4%
7
Congenital Abnormalities
28,238
3.9%
8
Unipolar major depression
177,162
3.2%
8
Asthma
26,137
3.6%
9
Conditions arising during the perinatal period
174,558
3.1%
9
Diabetes mellitus
19,989
2.7%
10
Lung trachea or bronchial cancer
172,425
3.1%
10
Dementia and other degenerative and hereditary CNS disorders
17,831
2.4%
sub-total
2,540,426
45.8%
sub-total
306,170
41.8%
Sex differentials in total burden by race increased with higher DALY rates. Male to female DALY ratios were 1.23 for Blacks, 1.21 for American Indians, 1.10 for Whites, 1.05 for Asians, and 1.17 overall. Although patterns of disease burden differed between races, leading causes were common to both sexes. Premature deaths contributed the largest share of total burden for males in all races, with the exception of Asian males. Non-fatal health outcomes contributed the largest share for females in all races, with the exception of Black females (Figure 4).
Figure 4
Distribution of YLL and YLD by sex and race, US, 1996.
×
DALY rates by age, sex, and race for HIV/AIDS, IHD and cerebrovascular diseases; hypertension and hypertensive heart disease, inflammatory cardiac diseases; and major causes of injuries capture changes in DALY rates over the lifespan as well as differences by race and sex in these important causes of disease burden (Figures 5, 6, 7, 8). DALY rates peaked in young adults for HIV/AIDS and injuries, and increased with age for cardiovascular diseases. DALY rates for Black males and females exceeded rates for the other race groups for HIV/AIDS, hypertension, cerebrovascular diseases, inflammatory cardiac diseases, motor vehicle accidents, homicide and violence, and self-inflicted injuries. Differentials between Blacks and the other races were always greater for males than for females, and were greatest in young adult males for HIV/AIDS, homicide and violence, hypertension and inflammatory cardiac diseases. Asian males and females had the lowest DALY rates for all major causes of burden. Differentials between races were least pronounced for IHD for both sexes.
Figure 5
HIV/AIDS: distribution of DALY rates/100,000 by age, race and sex, US 1996.
Figure 6
IHD and cerebrovascular diseases: distribution of DALY rates/100,000 by age, race and sex, US 1996.
Figure 7
Hypertension and inflammatory cardiac diseases: distribution of DALY rates/100,000 by age, race and sex, US 1996.
Figure 8
Major causes of injuries: distribution of DALY rates/100,000 by age, race and sex, US 1996.
×
×
×
×
Mortality burden
Leading causes of YLL
In 1996, 2.3 million people died in the United States, causing the loss of 18.1 million YLL (55 per cent of total DALYs). Age patterns of deaths and YLL differ: the number of deaths increased with age, the resulting number of YLL was greater for children and young adults than it was for older ages (Figure 9). The number of deaths and resulting number of YLL from any cause are not equivalent (Figure 10).
Figure 9
Distribution of deaths and YLL by age, US 1996.
Figure 10
Ten leading causes of mortality burden and death, as per cent of total, both sexes, US 1996.
×
×
IHD was the unequivocal lead cause of death and YLL, causing almost one of every four deaths and 16 per cent of total YLL. The mortality burden due to IHD was more than double the mortality burden due to lung cancer, and almost three times that due to motor vehicle accidents (Table 11). The share of YLL exceeded that of YLD for cardiovascular diseases, cancers, injuries, respiratory infections, and conditions arising during the perinatal period.
Table 11
Leading causes of death and YLL, both sexes, all races combined
Deaths
%total
2,314,689
1
Ischaemic heart disease
536,314
23.2%
2
Lung trachea or bronchial cancer
168,206
7.3%
3
Cerebrovascular Disease
161,678
7.0%
4
COPD
99,982
4.3%
5
Lower respiratory infections
84,319
3.6%
6
Diabetes mellitus
62,452
2.7%
7
Cancer colon or rectum
61,189
2.6%
8
Breast cancer
46,649
2.0%
9
Motor vehicle accidents
43,735
1.9%
10
Dementia and other degenerative and hereditary CNS disorders
43,190
1.9%
11
Hypertension and hypertensive heart disease
39,589
1.7%
12
Prostate cancer
36,667
1.6%
13
Self-inflicted
31,725
1.4%
14
HIV
31,188
1.3%
15
Cancer pancreas
29,494
1.3%
16
Inflammatory Cardiac
29,066
1.3%
17
Lymphomas
26,443
1.1%
18
Cirrhosis of the liver
25,488
1.1%
19
Nephritis or nephrosis
24,569
1.1%
20
Homicide and Violence
22,351
1.0%
Sub-total
1,604,297
69.3%
YLL
% total
Total YLL
18,066,099
1
Ischaemic heart disease
2,858,744
15.8%
2
Lung trachea or bronchial cancer
1,301,182
7.2%
3
Motor vehicle accidents
1,027,005
5.7%
4
Cerebrovascular Disease
784,443
4.3%
5
HIV
718,975
4.0%
6
Self-inflicted
660,917
3.7%
7
Homicide and Violence
615,332
3.4%
8
COPD
526,219
2.9%
9
Conditions arising during the perinatal period
464,131
2.6%
10
Diabetes mellitus
450,913
2.5%
11
Breast cancer
450,327
2.5%
12
Cancer colon or rectum
409,534
2.3%
13
Lower respiratory infections
388,441
2.2%
14
Cirrhosis of the liver
321,588
1.8%
15
Congenital Abnomalities
318,948
1.8%
16
Inflammatory Cardiac
258,328
1.4%
17
Hypertension and hypertensive heart disease
241,073
1.3%
18
Lymphomas
233,048
1.3%
19
Poisoning
221,906
1.2%
20
Cancer pancreas
205,972
1.1%
Sub-total
12,457,024
69.0%
Sex and age patterns
The number of deaths and the age at death is driving differentials in mortality burden observed by age, sex and race. The mortality burden for males (10.5 million YLL) was 40 per cent greater than that for females (7.5 million YLL) (Table 12). The excess male mortality burden was largely due to the higher mortality burden resulting from IHD, injuries (motor vehicle accidents, homicide and violence, self-inflicted injuries), and HIV/AIDS. These causes combined resulted in 40 per cent of total YLL (4.1 million YLL) for males, but only in 24 per cent of total YLL for females (1.8 million YLL), and accounted for 80 per cent of the total sex differential. The female mortality burden exceeded that of males only for cerebrovascular diseases. Also noteworthy was the toll due to breast cancer (450 thousand YLL), which was almost equal to that of lung cancer (523 thousand YLL). YLL rates were higher for all leading causes for males than they were for females, with the exception of cerebrovascular diseases (Figure 11). The pattern of mortality burden shifted from a predominance of injuries between ages 5 and 44 years, to a gradual increase in chronic diseases (cancers and cardiovascular diseases) among older adults (Tables 13, 14, 15, 16, 17, 18).
Table 12
Leading causes of YLL, by sex, all races combined
Cause list
YLL
% total
All males
10,529,540
1
Ischaemic heart disease
1,806,420
17.2%
2
Lung trachea or bronchial cancer
777,726
7.4%
3
Motor vehicle accidents
701,111
6.7%
4
HIV
575,297
5.5%
5
Self-inflicted
533,874
5.1%
6
Homicide and Violence
486,129
4.6%
7
Cerebrovascular Disease
356,563
3.4%
8
COPD
268,774
2.6%
9
Conditions arising during the perinatal period
259,581
2.5%
10
Diabetes mellitus
220,494
2.1%
11
Cirrhosis of the liver
219,876
2.1%
12
Cancer colon or rectum
212,958
2.0%
13
Lower respiratory infections
202,668
1.9%
14
Congenital Abnomalities
172,399
1.6%
15
Poisoning
168,131
1.6%
16
Inflammatory Cardiac
167,316
1.6%
17
Prostate cancer
160,019
1.5%
18
Lymphomas
134,145
1.3%
19
Hypertension and hypertensive heart disease
127,968
1.2%
20
Leukemias
114,710
1.1%
Sub-total
7,666,158
72.8%
Cause list
YLL
% total
All females
7,536,559
1
Ischaemic heart disease
1,052,325
14.0%
2
Lung trachea or bronchial cancer
523,456
6.9%
3
Breast cancer
450,327
6.0%
4
Cerebrovascular Disease
427,881
5.7%
5
Motor vehicle accidents
325,894
4.3%
6
COPD
257,445
3.4%
7
Diabetes mellitus
230,419
3.1%
8
Conditions arising during the perinatal period
204,550
2.7%
9
Cancer colon or rectum
196,575
2.6%
10
Lower respiratory infections
185,774
2.5%
11
Congenital Abnomalities
146,548
1.9%
12
HIV
143,678
1.9%
13
Homicide and Violence
129,202
1.7%
14
Self-inflicted
127,043
1.7%
15
Ovarian cancer
122,350
1.6%
16
Hypertension and hypertensive heart disease
113,105
1.5%
17
Cirrhosis of the liver
101,712
1.3%
18
Cancer pancreas
99,766
1.3%
19
Lymphomas
98,902
1.3%
20
Inflammatory Cardiac
91,012
1.2%
Sub-total
5,027,963
66.7%
Figure 11
Leading causes of mortality burden (YLL) by sex, US, 1996.
×
Table 13
Five leading causes of mortality burden (YLL) by sex and age, US, 1996
Males
Rank
All ages
YLL
% of total
0–4
YLL
% of total
Total
10,529,540
Total
652,949
1
Ischaemic heart disease
1,806,420
17.16%
Perinatal conditions
258,750
39.63%
2
Lung/Trachea/Bronchial cancer
777,726
7.39%
Congenital abnormalities
127,080
19.46%
3
Motor vehicle accidents
701,111
6.66%
Sudden infant death syndrome
61,101
9.36%
4
HIV/AIDS
575,297
5.46%
Motor vehicle accidents
17,505
2.68%
5
Suicide
1,028,947
9.77%
Lower respiratory infections
17,259
2.64%
Rank
5–14
YLL
% of total
15–24
YLL
% of total
Total
185,702
Total
845,157
1
Motor vehicle accidents
42,534
22.90%
Motor vehicle accidents
263,631
31.19%
2
Homicide and violence
15,729
8.47%
Homicide and violence
210,534
24.91%
3
Drowning
12,290
6.62%
Suicide
131,075
15.51%
4
Congenital abnormalities
10,634
5.73%
Drowning
20,807
2.46%
5
Suicide
8,483
4.57%
Poisoning
18,087
2.14%
Rank
25–44
YLL
% of total
45–64
YLL
% of total
Total
2,548,913
Total
3,150,157
1
HIV/AIDS
444,123
17.42%
Ischaemic heart disease
763,334
24.23%
2
Motor vehicle accidents
279,389
10.96%
Lung/Trachea/Bronchial cancer
372,984
11.84%
3
Suicide
277,467
10.89%
Cerebrovascular disease
115,851
3.68%
4
Homicide and violence
207,217
8.13%
Cirrhosis of the liver
113,739
3.61%
5
Ischaemic heart disease
171,437
6.73%
HIV/AIDS
111,874
3.55%
Rank
65–74
YLL
% of total
75+
YLL
% of total
Total
1,786,501
Total
1,360,161
1
Ischaemic heart disease
484,267
27.11%
Ischaemic heart disease
382,495
28.12%
2
Lung/Trachea/Bronchial cancer
253,281
14.18%
Lung/Trachea/Bronchial cancer
104,020
7.65%
3
Chronic obstructive pulmonary disease
103,012
5.77%
Cerebrovascular disease
99,208
7.29%
4
Cerebrovascular disease
84,904
4.75%
Chronic obstructive pulmonary disease
85,031
6.25%
5
Colon/Rectum cancer
62,395
3.49%
Prostate cancer
64,236
4.72%
Table 14
Five leading causes of mortality burden (YLL) by sex and age, US, 1996
Females
Rank
All ages
YLL
% of total
0–4
YLL
% of total
Total
7,536,559
Total
512,861
1
Ischaemic heart disease
1,052,325
13.96%
Perinatal conditions
203,909
39.76%
2
Lung/Trachea/Bronchial cancer
523,456
6.95%
Congenital abnormalities
109,458
21.34%
3
Breast cancer
450,327
5.98%
Sudden infant death syndrome
41,154
8.02%
4
Cerebrovascular disease
427,881
5.68%
Motor vehicle accidents
14,795
2.88%
5
Motor vehicle accidents
325,894
4.32%
Homicide and violence
13,612
2.65%
Rank
5–14
YLL
% of total
15–24
YLL
% of total
Total
123,888
Total
285,089
1
Motor vehicle accidents
28,952
23.37%
Motor vehicle accidents
117,878
41.35%
2
Homicide and violence
8,134
6.57%
Homicide and violence
32,799
11.50%
3
Congenital abnormalities
7,226
5.83%
Suicide
22,517
7.90%
4
Leukemias
6,120
4.94%
Leukemias
6,726
2.36%
5
Brain cancer
5,611
4.53%
HIV/AIDS
5,830
2.05%
Rank
25–44
YLL
% of total
45–64
YLL
% of total
Total
1,192,947
Total
2,053,395
1
Motor vehicle accidents
117,878
9.88%
Ischaemic heart disease
524,172
25.53%
2
HIV/AIDS
109,310
9.16%
Lung/Trachea/Bronchial cancer
234,241
11.41%
3
Breast cancer
95,818
8.03%
Breast cancer
220,350
10.73%
4
Suicide
67,035
5.62%
Cerebrovascular disease
99,565
4.85%
5
Homicide and violence
60,074
5.04%
Diabetes mellitus
81,366
3.96%
Rank
65–74
YLL
% of total
75+
YLL
% of total
Total
1,503,549
Total
1,864,830
1
Ischaemic heart disease
277,053
18.43%
Ischaemic heart disease
459,396
24.63%
2
Lung/Trachea/Bronchial cancer
172,116
11.45%
Cerebrovascular disease
186,468
10.00%
3
Chronic obstructive pulmonary disease
97,759
6.50%
Chronic obstructive pulmonary disease
88,838
4.76%
4
Cerebrovascular disease
90,698
6.03%
Lung/Trachea/Bronchial cancer
84,492
4.53%
5
Breast cancer
82,227
5.47%
Lower respiratory infections
83,467
4.48%
Table 15
Leading causes of YLL by sex and race – Whites
Cause list
YLL
% total
Total White males
8,293,920
1
Ischaemic heart disease
1,584,087
19.1%
2
Lung trachea or bronchial cancer
656,850
7.9%
3
Road Traffic Accidents
573,953
6.9%
4
Self-inflicted
469,430
5.7%
5
HIV
334,425
4.0%
6
Cerebrovascular Disease
276,544
3.3%
7
COPD
244,401
2.9%
8
Homicide and Violence
221,000
2.7%
9
Cirrhosis of the liver
183,600
2.2%
10
Cancer colon or rectum
180,184
2.2%
11
Diabetes mellitus
173,405
2.1%
12
Conditions arising during the perinatal period
158,462
1.9%
13
Lower respiratory infections
158,231
1.9%
14
Congenital Abnomalities
135,970
1.6%
15
Poisoning
134,929
1.6%
16
Prostate cancer
128,058
1.5%
17
Inflammatory Cardiac
121,438
1.5%
18
Lymphomas
116,804
1.4%
19
Leukemias
99,137
1.2%
20
Cancer pancreas
89,780
1.1%
Sub-total
6,040,688
72.8%
Cause list
YLL
% total
Total White females
6,018,361
1
Ischaemic heart disease
895,819
14.9%
2
Lung trachea or bronchial cancer
460,651
7.7%
3
Breast cancer
370,855
6.2%
4
Cerebrovascular Disease
342,620
5.7%
5
Road Traffic Accidents
268,996
4.5%
6
COPD
240,803
4.0%
7
Diabetes mellitus
169,449
2.8%
8
Cancer colon or rectum
163,068
2.7%
9
Lower respiratory infections
153,465
2.5%
10
Conditions arising during the perinatal period
124,599
2.1%
11
Congenital Abnomalities
112,925
1.9%
12
Self-inflicted
112,621
1.9%
13
Ovarian cancer
108,262
1.8%
14
Lymphomas
87,677
1.5%
15
Cancer pancreas
83,238
1.4%
16
Cirrhosis of the liver
81,843
1.4%
17
Dementia and other degenerative and hereditary CNS disorders
76,867
1.3%
18
Leukemias
74,069
1.2%
19
Homicide and Violence
72,469
1.2%
20
Hypertension and hypertensive heart disease
72,258
1.2%
Sub-total
4,072,553
67.7%
Table 16
Leading causes of YLL by sex and race – Blacks
Cause list
YLL
% total
Total Black males
1,978,704
1
Homicide and Violence
250,257
12.6%
2
HIV
234,400
11.8%
3
Ischaemic heart disease
189,031
9.6%
4
Lung trachea or bronchial cancer
109,191
5.5%
5
Motor vehicle accidents
99,734
5.0%
6
Conditions arising during the perinatal period
92,854
4.7%
7
Cerebrovascular Disease
69,225
3.5%
8
Self-inflicted
47,940
2.4%
9
Hypertension and hypertensive heart disease
44,841
2.3%
10
Inflammatory Cardiac
41,409
2.1%
11
Diabetes mellitus
40,795
2.1%
12
Lower respiratory infections
38,675
2.0%
13
Congenital Abnomalities
30,182
1.5%
14
Cirrhosis of the liver
30,182
1.5%
15
Poisoning
30,101
1.5%
16
Prostate cancer
30,075
1.5%
17
Cancer colon or rectum
28,380
1.4%
18
COPD
21,382
1.1%
19
Sudden Infant Death Syndrome
19,017
1.0%
20
Nephritis or nephrosis
17,092
0.9%
Sub-total
1,464,762
74.0%
Cause list
YLL
% total
Total Black females
1,342,205
1
Ischaemic heart disease
141,305
10.5%
2
HIV
89,973
6.7%
3
Cerebrovascular Disease
74,323
5.5%
4
Conditions arising during the perinatal period
73,969
5.5%
5
Breast cancer
70,421
5.2%
6
Lung trachea or bronchial cancer
55,561
4.1%
7
Diabetes mellitus
54,669
4.1%
8
Homicide and Violence
52,280
3.9%
9
Motor vehicle accidents
42,499
3.2%
10
Hypertension and hypertensive heart disease
39,005
2.9%
11
Cancer colon or rectum
28,896
2.2%
12
Congenital Abnomalities
28,218
2.1%
13
Lower respiratory infections
28,108
2.1%
14
Inflammatory Cardiac
25,707
1.9%
15
Nephritis or nephrosis
15,811
1.2%
16
Cirrhosis of the liver
15,701
1.2%
17
COPD
14,858
1.1%
18
Cancer pancreas
14,132
1.1%
19
Sudden Infant Death Syndrome
13,841
1.0%
20
Cancer cervix
13,786
1.0%
Sub-total
893,064
66.5%
Table 17
Leading causes of YLL by sex and race – American Indians
Cause list
YLL
% total
Total American Indian males
83,713
1
Motor vehicle accidents
13,665
16.3%
2
Ischaemic heart disease
8,804
10.5%
3
Self-inflicted
6,472
7.7%
4
Homicide and Violence
5,287
6.3%
5
Cirrhosis of the liver
3,982
4.8%
6
Alcohol use
2,849
3.4%
7
Lung trachea or bronchial cancer
2,792
3.3%
8
Diabetes mellitus
2,610
3.1%
9
Lower respiratory infections
2,168
2.6%
10
Conditions arising during the perinatal period
2,078
2.5%
11
Poisoning
2,009
2.4%
12
HIV
1,952
2.3%
13
Cerebrovascular Disease
1,919
2.3%
14
Congenital Abnomalities
1,658
2.0%
15
Drowning
1,489
1.8%
16
Sudden Infant Death Syndrome
1,239
1.5%
17
Inflammatory Cardiac
1,193
1.4%
18
Cancer colon or rectum
816
1.0%
19
Falls
755
0.9%
20
COPD
719
0.9%
Sub-total
64,456
77.0%
Cause list
YLL
% total
Total Amerian Indian females
54,732
1
Motor vehicle accidents
6,429
11.7%
2
Ischaemic heart disease
4,247
7.8%
3
Cirrhosis of the liver
3,311
6.0%
4
Diabetes mellitus
2,970
5.4%
5
Cerebrovascular Disease
2,057
3.8%
6
Breast cancer
1,901
3.5%
7
Lung trachea or bronchial cancer
1,788
3.3%
8
Self-inflicted
1,786
3.3%
9
Homicide and Violence
1,534
2.8%
10
Conditions arising during the perinatal period
1,531
2.8%
11
Lower respiratory infections
1,523
2.8%
12
Congenital Abnomalities
1,182
2.2%
13
Alcohol use
1,156
2.1%
14
Sudden Infant Death Syndrome
907
1.7%
15
Cancer colon or rectum
851
1.6%
16
Poisoning
809
1.5%
17
COPD
731
1.3%
18
Ovarian cancer
678
1.2%
19
Inflammatory Cardiac
651
1.2%
20
Drowning
633
1.2%
Sub-total
36,675
67.0%
Table 18
Leading causes of YLL by sex and race – Asians
Cause list
YLL
% total
Total Asian males
173,201
1
Ischaemic heart disease
24,497
14.1%
2
Motor vehicle accidents
13,759
7.9%
3
Self-inflicted
10,032
5.8%
4
Homicide and Violence
9,584
5.5%
5
Lung trachea or bronchial cancer
8,892
5.1%
6
Cerebrovascular Disease
8,875
5.1%
7
Cancer liver
6,330
3.7%
8
Conditions arising during the perinatal period
6,188
3.6%
9
Congenital Abnomalities
4,590
2.7%
10
HIV
4,520
2.6%
11
Diabetes mellitus
3,684
2.1%
12
Lower respiratory infections
3,593
2.1%
13
Cancer colon or rectum
3,578
2.1%
14
Inflammatory Cardiac
3,276
1.9%
15
Drowning
3,256
1.9%
16
Cancer stomach
2,935
1.7%
17
Leukemias
2,601
1.5%
18
Hypertension and hypertensive heart disease
2,365
1.4%
19
COPD
2,272
1.3%
20
Cirrhosis of the liver
2,113
1.2%
Sub-total
126,941
73.3%
Cause list
YLL
% total
Total Asian females
121,261
1
Ischaemic heart disease
10,953
9.0%
2
Cerebrovascular Disease
8,881
7.3%
3
Road Traffic Accidents
7,970
6.6%
4
Breast cancer
7,150
5.9%
5
Lung trachea or bronchial cancer
5,455
4.5%
6
Conditions arising during the perinatal period
4,451
3.7%
7
Congenital Abnomalities
4,223
3.5%
8
Self-inflicted
4,112
3.4%
9
Cancer colon or rectum
3,761
3.1%
10
Diabetes mellitus
3,331
2.7%
11
Homicide and Violence
2,920
2.4%
12
Cancer stomach
2,873
2.4%
13
Ovarian cancer
2,776
2.3%
14
Lower respiratory infections
2,677
2.2%
15
Cancer liver
2,210
1.8%
16
Leukemias
2,126
1.8%
17
Cancer cervix
1,892
1.6%
18
Cancer pancreas
1,888
1.6%
19
Inflammatory Cardiac
1,602
1.3%
20
Lymphomas
1,479
1.2%
Sub-total
82,729
68.2%
Patterns by race
The share of YLL due to communicable diseases (which include HIV/AIDS), maternal causes, perinatal and nutritional conditions was twofold larger for Blacks (20 per cent) than it was for any of the other races. Injuries predominated among American Indians, causing one third of the total mortality burden, and one fifth or less in the other races.
The mortality burden was highest for Blacks and lowest for Asians, for both sexes and all ages. A few causes contributed about one third of total YLL in each race. These were IHD, lung cancer and motor vehicle accidents for Whites; IHD, HIV/AIDS and homicide and violence for Blacks; motor vehicle accidents, IHD and self-inflicted injuries for American Indians; and IHD, motor vehicle accidents, cerebrovascular diseases, and lung cancer for Asians (Tables 15, 16, 17, 18; Figures 12, 13).
Figure 12
Ten leading causes of mortality burden (YLL) and death, as a per cent of total, by race, US, 1996.
Figure 13
Ten leading causes of mortality burden (YLL) and death, as a per cent of total, by race, US, 1996.
×
×
Comparative rankings of mortality burden in the United States and selected industrialized countries
Relative YLL rankings observed in the United States and in ten selected industrialized countries (Australia, Canada, France, Germany, Greece, Italy, Japan, Netherlands, Spain and the United Kingdom) were similar for IHD, lung cancer and motor vehicle accidents for males, and IHD, breast cancer and cerebrovascular diseases for females, which ranked among the top five leading causes of YLL in all countries. In contrast, the range of rankings observed was widest for HIV/AIDS and inflammatory cardiac diseases (cardiomyopathy and endocarditis) for both sexes, appearing to cause a very high mortality burden in some countries, and a much lower mortality burden in others (Figures 14 and 15). The wide range observed for these two conditions may point to real differences in causes of death and their important risk factors, but may also indicate differences in cause of death reporting practices, particularly for inflammatory cardiac disease, which ultimately leads to congestive heart failure, and may not have been diagnosed as the underlying cause.
Figure 14
Comparative rankings for the twenty leading causes of YLL for males, US compared with selected non-US OECD countries. Note: Vertical red bars indicate the range between minimum and maximum rankings observed in the selected OECD countries (excluding the US). Blue horizontal lines indicate rankings for the US. The ten selected non-US OECD countries are: Australia, Canada, France, Germany, Greece, Italy, Japan, Netherlands, Spain and the United Kingdom.
Figure 15
Comparative rankings for the twenty leading causes of YLL for females, US compared with selected non-US OECD countries. Note: Vertical red bars indicate the range between minimum and maximum rankings observed in the selected OECD countries (excluding the US). Blue horizontal lines indicate rankings for the US. The ten selected OECD countries are: Australia, Canada, France, Germany, Greece, Italy, Japan, Netherlands, Spain and the United Kingdom.
×
×
US YLL rankings by race compared to selected industrialized countries
The higher share of YLL due to homicide and violence in the general population in the United States was observed in all races and both sexes (Figures 16 and 17). YLL rankings for all races and both sexes fell outside those observed in other countries for inflammatory cardiac diseases, pointing to a higher burden in the United States. Rankings for cerebrovascular diseases, on the other hand, pointed to a lower share of burden for males in all races. YLL rates exceeded rates for other countries for HIV/AIDS, homicide and violence, and inflammatory cardiac disease in both sexes, confirming findings based on the comparison of YLL rankings (Tables 19 and 20).
Figure 16
YLL rankings by race in the US compared with selected non-US OECD countries, males. Note: Vertical red bars indicate the range between minimum and maximum rankings observed in the selected OECD countries (excluding the US). Blue horizontal lines indicate rankings for the US. The ten selected OECD countries are: Australia, Canada, France, Germany, Greece, Italy, Japan, Netherlands, Spain and the United Kingdom
Figure 17
YLL rankings by race in the US compared with non-US OECD countries, females. Note: Vertical red bars indicate the range between minimum and maximum rankings observed in the selected OECD countries (excluding the US). Blue horizontal lines indicate rankings for the US. The ten selected OECD countries are: Australia, Canada, France, Germany, Greece, Italy, Japan, Netherlands, Spain and the United Kingdom
×
×
Table 19
Twenty leading causes of YLL in the United States: comparison of YLL rates per 100,000 between the United States and selected countries – Male
Twenty leading causes of YLL in the United States
United States
Australia
Canada
France
Germany
Greece
Italy
Japan
Netherlands
Spain
United Kingdom
IHD
1,392
269
950
578
1,249
1,337
974
504
942
826
2,154
Trachea, bronchus, lung cancer
599
105
469
666
611
756
683
387
595
638
714
MVA
547
106
292
515
325
690
438
242
233
550
350
HIV/AIDS
443
9
62
60
26
11
67
1
31
176
18
Self-inflicted
411
140
414
459
367
101
184
582
221
218
410
homicide and violence
375
15
57
21
19
37
38
14
38
35
55
Cerebroavascular disease
275
72
205
307
377
723
421
546
319
356
566
COPD
207
51
145
142
182
88
168
57
234
247
371
Perinatal conditions
200
43
115
120
87
115
90
39
116
78
215
Diabetes
170
33
146
97
125
54
144
76
120
93
99
Cirrhosis of the liver
169
25
104
281
372
85
228
161
85
195
258
Colon and rectum
164
68
187
213
267
160
225
231
220
235
338
Lower respiratory infections
156
19
66
134
99
49
80
281
152
97
524
Congenital anomalies
133
33
95
101
78
104
78
66
113
86
125
poisonings
130
51
87
12
28
104
11
12
30
71
111
Inflammatory heart disease
129
21
52
68
116
3
67
45
65
87
84
Prostate
123
41
118
145
142
119
110
50
151
121
241
Lymphoma and multiple myeloma
103
36
125
114
108
92
130
77
128
106
176
Hypertesive heart disease
99
7
21
51
77
48
117
15
24
38
54
Leukemia
88
25
82
91
87
105
100
70
78
86
115
Table 20
Twenty leading causes of YLL in the United States: comparison of YLL rates per 100,000 between the United States and selected countries – Female
Twenty leading causes of YLL in the United States
United States
Australia
Canada
France
Germany
Greece
Italy
Japan
Netherlands
Spain
United Kingdom
IHD
777
462
475
228
753
570
491
562
466
383
868
Trachea, bronchus, lung cancer
386
186
354
140
201
125
154
328
288
86
357
Breast cancer
332
285
326
389
404
313
363
396
457
288
492
Cerebroavascular disease
316
253
213
253
405
826
426
943
378
362
510
MVA
241
125
124
157
105
178
117
167
71
151
73
COPD
190
108
114
67
90
41
66
39
152
57
227
Diabetes
170
80
109
76
123
55
151
102
115
108
66
Perinatal conditions
151
108
87
89
64
75
70
70
94
63
115
Colon and rectum
145
164
145
155
217
153
171
381
189
174
201
Lower respiratory infections
137
50
56
91
79
34
61
418
147
71
412
Congenital anomalies
108
89
73
71
64
76
59
136
100
73
84
HIV/AIDS
106
2
13
16
6
2
17
0
8
43
4
homicide and violence
95
32
21
12
16
11
11
25
19
13
20
sel-inflicted
94
120
119
155
106
27
55
473
107
63
90
Ovarian cancer
90
69
79
90
114
82
88
148
99
74
144
Hypertesive heart disease
83
27
21
50
94
50
137
34
27
53
32
Cirrhosis of the liver
75
32
45
113
156
28
115
99
44
71
113
Cancer pancreas
74
56
67
66
94
73
85
187
78
62
84
Lymphoma and multiple myeloma
73
88
97
80
83
71
103
126
90
84
110
Inflammatory heart disease
67
31
29
24
44
3
30
53
42
45
32
The largest differentials between races for males pertained to COPD, cirrhosis of the liver, poisoning, hypertension and hypertensive heart disease. Rankings indicate a higher mortality burden due to COPD and cirrhosis of the liver in American Indians; hypertension and hypertensive heart disease in Blacks; and a lower mortality burden for poisoning in Asians. The largest rank differentials between races were observed in females for HIV/AIDS, self-inflicted injuries, COPD, hypertension and hypertensive heart disease, and cirrhosis of the liver. Rankings for Black females pointed to a higher mortality burden for HIV/AIDS, hypertension and hypertensive heart disease, and a lower mortality burden for self-inflicted injuries and ovarian cancer compared to White, American Indian and Asian females.
Morbidity burden
Leading causes of YLD
Non-fatal health outcomes resulted in 15 million YLD, which was only slightly less than the mortality burden (17 million YLL). For neuropsychiatric conditions, musculoskeletal conditions, chronic respiratory diseases, YLD contributed more than YLL. Neuropsychiatric conditions were the predominant cause of disability, causing 44 per cent of total YLD, regardless of sex and race (Figure 18). They comprise a wide array of conditions, sub-divided into mental disorders and diseases of the nervous system (DSM IV). Mental disorders include mood disorders (unipolar major depression, bipolar disorders), schizophrenia, anxiety disorders (PTSD, obsessive compulsive disorders, and panic disorders) affecting mostly young adults, and substance related disorders (alcohol and drug use) that increase in older adults. Nervous system disorders include Alzheimer's disease and other degenerative and hereditary CNS disorders, Parkinson's disease, epilepsy, and multiple sclerosis (Figure 19).
Figure 18
Distribution of YLD for non-communicable cause groupings.
Figure 19
Age patterns of mental disorders and diseases of the nervous system.
×
×
Unipolar major depression, alcohol use, osteoarthritis, dementia and other degenerative disorders of the CNS and cerebrovascular diseases were the five leading causes of YLD (Table 21). Unipolar major depression and alcohol use combined (2.4 million YLD) caused 16 per cent of total YLD, which represented almost the same burden as IHD (2.9 million YLL).
Table 21
Twenty leading causes of YLD, both sexes and all races combined
Rank
YLD
% of total
Total
15,024,113
1
Unipolar major depression
1,370,070
9.1%
2
Alcohol use
1,037,529
6.9%
3
Osteoarthritis
940,612
6.3%
4
Dementia and other degenerative and hereditary CNS disorders
755,925
5.0%
5
COPD
727,272
4.8%
6
Cerebrovascular Disease
725,844
4.8%
7
Asthma
593,233
3.9%
8
Drug use
504,718
3.4%
9
Diabetes mellitus
495,377
3.3%
10
Congenital Abnomalities
443,004
2.9%
11
Motor vehicle accidents
366,273
2.4%
12
Bipolar disorder
363,298
2.4%
13
Schizophrenia
315,720
2.1%
14
Ischaemic heart disease
275,988
1.8%
15
PTSD
260,337
1.7%
16
Panic disorder
259,904
1.7%
17
HIV
237,443
1.6%
18
Falls
221,036
1.5%
19
Rheumatoid arthritis
189,421
1.3%
20
Obsessive-compulsive disorders
169,067
1.1%
Sub-total
10,252,070
68.2%
Sex and age patterns
Sex differentials were much smaller for YLD than for YLL. The morbidity burden was slightly larger for females (7.7 million YLD) than for males (7.3 million YLD). The five leading causes of YLD were alcohol use, unipolar major depression, osteoarthritis, drug use, and chronic obstructive pulmonary disease (COPD) for males, and unipolar major depression, osteoarthritis, dementia and other degenerative and hereditary CNS disorders, and alcohol use for females (Table 22).
Table 22
Twenty leading causes of YLD by sex, US 1996
MALES
Rank
YLD
% total YLD
Total
7,330,853
1
Alcohol use
651,223
8.9%
2
Unipolar major depression
469,861
6.4%
3
Osteoarthritis
434,200
5.9%
4
Drug use
384,319
5.2%
5
COPD
372,927
5.1%
6
Dementia and other degenerative and hereditary CNS disorders
332,046
4.5%
7
Cerebrovascular Disease
317,366
4.3%
8
Asthma
272,898
3.7%
9
Congenital Abnomalities
237,988
3.2%
10
Motor vehicle accidents
232,687
3.2%
11
Diabetes mellitus
221,557
3.0%
12
Bipolar disorder
198,308
2.7%
13
HIV
188,519
2.6%
14
Schizophrenia
166,988
2.3%
15
Ischaemic heart disease
151,764
2.1%
16
Falls
132,485
1.8%
17
Obsessive-compulsive disorders
88,623
1.2%
18
Homicide and Violence
81,588
1.1%
19
Prostate cancer
78,870
1.1%
20
Panic disorder
77,701
1.1%
sub-total
5,091,918
69.5%
FEMALES
Rank
YLD
% total YLD
Total
7,693,260
1
Unipolar major depression
900,209
11.7%
2
Osteoarthritis
506,412
6.6%
3
Dementia and other degenerative and hereditary CNS disorders
423,878
5.5%
4
Cerebrovascular Disease
408,478
5.3%
5
Alcohol use
386,306
5.0%
6
COPD
354,345
4.6%
7
Asthma
320,336
4.2%
8
Diabetes mellitus
273,821
3.6%
9
Congenital Abnomalities
205,015
2.7%
10
PTSD
193,533
2.5%
11
Panic disorder
182,203
2.4%
12
Bipolar disorder
164,990
2.1%
13
Schizophrenia
148,732
1.9%
14
Motor vehicle accidents
133,586
1.7%
15
Rheumatoid arthritis
131,758
1.7%
16
STD's excluding HIV
125,418
1.6%
17
Ischaemic heart disease
124,224
1.6%
18
Drug use
120,399
1.6%
19
Maternal Conditions
105,155
1.4%
20
Falls
88,551
1.2%
sub-total
5,297,349
68.9%
The largest sex differentials pertained to the leading cause of YLD: alcohol use for males and unipolar major depression for females. The burden due to unipolar depression was almost double for females (900 thousand YLD) than it was for males (470 thousand YLD), whereas the burden due to alcohol was double for males (651 thousand YLD) than it was for females (386 thousand YLD). Together, alcohol use and unipolar depression caused 15 per cent of total YLD for males, and 17 per cent for females.
The share of total YLD due to neuropsychiatric conditions for males exceeded that for females. Morbidity due to substance abuse (alcohol and drug) in males was not entirely offset by the preponderance of mood and anxiety disorders in females. The slightly higher share of dementia and other degenerative and hereditary CNS disorders in females resulted from their higher life expectancy.
Major causes contributing to the morbidity burden changed with age. Mental disorders and injuries affected mostly young adults, whereas nervous system disorders, musculoskeletal conditions, cardiovascular diseases, and diabetes increased with age and were predominant among older adults. Chronic respiratory conditions affected all age groups. Congenital anomalies represented half of the non-fatal burden below age 5.
Patterns by race
Alcohol use was the leading cause of YLD for males in all races, with the exception of Asian males for whom unipolar depression was the leading cause. Unipolar major depression was the leading cause for females of all races, with the exception of American Indian females for whom alcohol use was the leading cause (Tables 23, 24, 25, 26).
Table 23
Leading causes of YLD – Whites
WHITE MALES
Rank
Cause list
YLD
% total YLD
Total YLD
5,963,710
1
Alcohol use
488,341
8.2%
2
Unipolar major depression
390,121
6.5%
3
Osteoarthritis
378,589
6.3%
4
Drug use
324,878
5.4%
5
COPD
319,049
5.3%
6
Dementia and other degenerative and hereditary CNS disorders
293,857
4.9%
7
Cerebrovascular Disease
258,909
4.3%
8
Asthma
216,831
3.6%
9
Motor vehicle accidents
195,590
3.3%
10
Congenital Abnomalities
189,083
3.2%
11
Diabetes mellitus
174,663
2.9%
12
Bipolar disorder
161,700
2.7%
13
Schizophrenia
134,190
2.3%
14
Ischaemic heart disease
130,502
2.2%
15
Falls
113,345
1.9%
16
HIV
111,533
1.9%
17
Obsessive-compulsive disorders
71,313
1.2%
18
Prostate cancer
68,023
1.1%
19
Panic disorder
63,735
1.1%
20
PTSD
55,968
0.9%
sub-total
4,140,220
69.4%
WHITE FEMALES
Rank
Cause list
YLD
% total YLD
Total YLD
6,234,020
1
Unipolar major depression
736,746
11.8%
2
Osteoarthritis
439,876
7.1%
3
Dementia and other degenerative and hereditary CNS disorders
375,458
6.0%
4
Cerebrovascular Disease
323,173
5.2%
5
COPD
307,237
4.9%
6
Alcohol use
291,334
4.7%
7
Asthma
253,904
4.1%
8
Diabetes mellitus
210,058
3.4%
9
Congenital Abnomalities
162,162
2.6%
10
PTSD
159,120
2.6%
11
Panic disorder
145,888
2.3%
12
Bipolar disorder
131,835
2.1%
13
Schizophrenia
118,134
1.9%
14
Rheumatoid arthritis
110,674
1.8%
15
Motor vehicle accidents
109,754
1.8%
16
STD's excluding HIV
101,298
1.6%
17
Ischaemic heart disease
100,510
1.6%
18
Drug use
98,319
1.6%
19
Maternal Conditions
82,750
1.3%
20
Falls
76,404
1.2%
Sub-total
4,334,635
69.5%
Table 24
Leading causes of YLD – Blacks
BLACK MALES
Rank
Simple cause list
YLD
% total YLD
Total YLD
1,086,407
1
Alcohol use
135,346
12.5%
2
HIV
73,292
6.7%
3
Unipolar major depression
57,653
5.3%
4
Cerebrovascular Disease
49,191
4.5%
5
Drug use
44,504
4.1%
6
Asthma
42,295
3.9%
7
Diabetes mellitus
39,783
3.7%
8
COPD
38,739
3.6%
9
Osteoarthritis
38,641
3.6%
10
Congenital Abnomalities
36,030
3.3%
11
Road Traffic Accidents
31,173
2.9%
12
Dementia and other degenerative and hereditary CNS disorders
28,292
2.6%
13
Homicide and Violence
26,846
2.5%
14
Bipolar disorder
26,799
2.5%
15
Schizophrenia
24,323
2.2%
16
Ischaemic heart disease
18,148
1.7%
17
Falls
15,894
1.5%
18
Diarrhoeal diseases
15,602
1.4%
19
Inflammatory Cardiac
13,178
1.2%
20
Obsessive-compulsive disorders
12,818
1.2%
sub-total
768,546
70.7%
BLACK FEMALES
Rank
Simple cause list
YLD
% total YLD
Total YLD
1,145,131
1
Unipolar major depression
119,471
10.4%
2
Alcohol use
74,248
6.5%
3
Cerebrovascular Disease
74,179
6.5%
4
Diabetes mellitus
54,409
4.8%
5
Asthma
50,869
4.4%
6
Osteoarthritis
48,521
4.2%
7
Dementia and other degenerative and hereditary CNS disorders
37,519
3.3%
8
HIV
31,719
2.8%
9
Congenital Abnomalities
31,654
2.8%
10
COPD
31,132
2.7%
11
PTSD
27,508
2.4%
12
Panic disorder
26,916
2.4%
13
Bipolar disorder
24,649
2.2%
14
Schizophrenia
22,823
2.0%
15
Ischaemic heart disease
21,685
1.9%
16
Road Traffic Accidents
19,754
1.7%
17
STD's excluding HIV
17,688
1.5%
18
Drug use
17,686
1.5%
19
Maternal Conditions
16,770
1.5%
20
Rheumatoid arthritis
15,521
1.4%
sub-total
764,722
66.8%
Table 25
Leading causes of YLD – American Indians
AMERICAN INDIAN MALES
Rank
Simple cause list
YLD
% total YLD
Total YLD
77,508
1
Alcohol use
22,997
29.7%
2
Unipolar major depression
4,160
5.4%
3
Drug use
3,042
3.9%
4
Osteoarthritis
2,940
3.8%
5
Asthma
2,745
3.5%
6
COPD
2,708
3.5%
7
Congenital Abnomalities
2,467
3.2%
8
Cerebrovascular Disease
2,014
2.6%
9
Bipolar disorder
1,948
2.5%
10
Road Traffic Accidents
1,902
2.5%
11
Schizophrenia
1,796
2.3%
12
Dementia and other degenerative and hereditary CNS disorders
1,775
2.3%
13
Diabetes mellitus
1,595
2.1%
14
HIV
1,190
1.5%
15
Cirrhosis of the liver
1,082
1.4%
16
Fires
1,027
1.3%
17
Obsessive-compulsive disorders
940
1.2%
18
Falls
921
1.2%
19
Ischaemic heart disease
881
1.1%
20
Panic disorder
743
1.0%
sub-total
58,874
76.0%
AMERICAN INDIAN FEMALES
Rank
Simple cause list
YLD
% total YLD
Total YLD
78,522
1
Alcohol use
19,417
24.7%
2
Unipolar major depression
7,655
9.7%
3
Asthma
3,233
4.1%
4
Osteoarthritis
3,020
3.8%
5
COPD
2,692
3.4%
6
Cerebrovascular Disease
2,251
2.9%
7
Congenital Abnomalities
2,182
2.8%
8
Dementia and other degenerative and hereditary CNS disorders
2,006
2.6%
9
Diabetes mellitus
1,895
2.4%
10
Panic disorder
1,851
2.4%
11
Bipolar disorder
1,717
2.2%
12
Schizophrenia
1,625
2.1%
13
PTSD
1,251
1.6%
14
Maternal Conditions
1,178
1.5%
15
STD's excluding HIV
1,157
1.5%
16
Road Traffic Accidents
1,115
1.4%
17
Rheumatoid arthritis
958
1.2%
18
Drug use
925
1.2%
19
Cirrhosis of the liver
918
1.2%
20
Obsessive-compulsive disorders
865
1.1%
Sub-total
57,910
73.8%
Table 26
Leading causes of YLD – Asians
ASIAN MALES
Rank
Simple cause list
YLD
% total YLD
Total YLD
203,229
1
Unipolar major depression
17,926
8.8%
2
Osteoarthritis
14,029
6.9%
3
COPD
12,431
6.1%
4
Drug use
11,895
5.9%
5
Asthma
11,027
5.4%
6
Congenital Abnomalities
10,408
5.1%
7
Dementia and other degenerative and hereditary CNS disorders
8,122
4.0%
8
Bipolar disorder
7,862
3.9%
9
Cerebrovascular Disease
7,251
3.6%
10
Schizophrenia
6,679
3.3%
11
Diabetes mellitus
5,516
2.7%
12
Alcohol use
4,539
2.2%
13
Road Traffic Accidents
4,022
2.0%
14
Obsessive-compulsive disorders
3,552
1.7%
15
Panic disorder
2,994
1.5%
16
HIV
2,505
1.2%
17
Epilepsy
2,470
1.2%
18
Falls
2,325
1.1%
19
Ischaemic heart disease
2,234
1.1%
20
Diarrhoeal diseases
2,057
1.0%
Sub-total
139,843
68.8%
ASIAN FEMALES
Rank
Simple cause list
YLD
% total YLD
Total YLD
235,588
1
Unipolar major depression
36,337
15.4%
2
Osteoarthritis
14,995
6.4%
3
COPD
13,285
5.6%
4
Asthma
12,329
5.2%
5
Congenital Abnomalities
9,018
3.8%
6
Dementia and other degenerative and hereditary CNS disorders
8,896
3.8%
7
Cerebrovascular Disease
8,876
3.8%
8
Panic disorder
7,548
3.2%
9
Diabetes mellitus
7,458
3.2%
10
Bipolar disorder
6,788
2.9%
11
Schizophrenia
6,150
2.6%
12
PTSD
5,654
2.4%
13
STD's excluding HIV
5,275
2.2%
14
Rheumatoid arthritis
4,605
2.0%
15
Maternal Conditions
4,456
1.9%
16
Drug use
3,469
1.5%
17
Obsessive-compulsive disorders
3,347
1.4%
18
Road Traffic Accidents
2,963
1.3%
19
Epilepsy
2,222
0.9%
20
Diarrhoeal diseases
1,745
0.7%
Sub-total
165,417
70.2%
Differentials in patterns of neuropsychiatric disorders by race were dominated by the large excess morbidity burden caused by substance abuse among American Indians, which accounted for half of total YLD, compared to approximately one third in the other race groups.
The distribution of YLD rates for selected disease groupings by age further illustrate major differences that existed between races. These were particularly prominent for neuropsychiatric conditions in young adults between the ages 15 and 44 years (Figure 20).
Figure 20
Patterns of YLD by age and race, US 1996.
×
Discussion
Quantifying the burden of disease is not a morally neutral exercise. All summary measures of health include several value choices. A strength of the GBD was to make value choices incorporated in the calculation of DALYs transparent. These include a standard duration of life at each age, an age weighting function, and discounting for time preference. GBD values for these parameters were not changed to ensure the international comparability of the USBODI.
The validation of GBD disability weights in different national contexts is particularly important to enhance the confidence of decision-makers in key findings of national disease burden estimates. The instrument used to derive the disability weights is called the Person Trade-Off (PTO). In the GBD the full PTO was executed for a set of 22 indicator conditions.
In order to assess whether groups of people from the United States might value these indicator conditions substantially differently than the benchmark values developed for the GBD, 35 volunteers that included staff from CDC, state health departments, other US federal agencies such as the National Institutes of Mental Health, as well as members of non-profit groups such as the American Heart Association and the Arthritis Foundation, were recruited to execute a PTO (PTO1 and PTO2) exercise as part of the US study. These participants were placed in 4 small groups of 8–12 members according to the GBD PTO (PTO1 and PTO2) protocol. Consistent with results from other such groups coordinated in a variety of international settings by the Burden of Disease Unit at Harvard, there was evidence of substantial inter-individual variation between the participants for conditions associated with milder disability (Table 4). For example, the median value for vitiligo of the face was 0.00, and the average disability weight was 0.04. The standard deviation for the disability weight associated with this condition was larger than the actual point estimate. The coefficients of variation (C.V. = standard deviation/point estimate) were much smaller for conditions associated with more severe disability such as quadriplegia and severe dementia. However, despite variation between individuals within these groups, the correlation between groups for the disability weight values was very strong. Nineteen conditions were included in every exercise. For each group the median disability weight value for each of these conditions was calculated. The correlations between pairs of groups for the 19 disability weight values were very high (Table 5, Range of Pearson's correlation coefficients = 0.82–0.99).
Table 4
Disability weights from person trade-off exercise conducted in Atlanta compared to composite scores from other exercises conducted at various international sites
Indicator Condition
Atlanta PTO (N = 35)
Composite scores (N = 192)
Median
Mean
S.D.*
C.V.+
Median
Mean
S.D.*
C.V.+
Vitiligo on Face
0
0.04
0.11
2.75
0
0.04
0.1
2.5
Watery Diarrhea
0.02
0.06
0.08
1.33
0.05
0.1
0.16
1.60
Fracture of Radius
0.06
0.1
0.11
1.10
0.09
0.13
0.16
1.23
Infertility
0.03
0.11
0.16
1.45
0.09
0.16
0.19
1.19
Erectile Dysfunction
0.09
0.19
0.22
1.16
0.17
0.22
0.23
1.05
Severe Sore Throat
0.13
0.19
0.18
0.95
0.13
0.23
0.26
1.13
Rheumatoid Arthritis
0.17
0.26
0.24
0.92
0.29
0.32
0.22
0.69
Below Knee Amputation
0.29
0.32
0.20
0.63
0.29
0.34
0.22
0.65
Deafness
0.44
0.43
0.28
0.65
0.36
0.4
0.24
0.60
Recto-vaginal Fistula
0.29
0.38
0.33
0.87
0.41
0.44
0.28
0.64
Angina
0.38
0.39
0.23
0.59
0.43
0.46
0.26
0.57
Mental Retardation
0.64
0.55
0.28
0.51
0.5
0.5
0.25
0.50
Blindness
0.5
0.53
0.25
0.47
0.63
0.58
0.21
0.36
Paraplegia
0.67
0.6
0.25
0.42
0.71
0.68
0.2
0.29
Major Depression
0.89
0.79
0.23
0.29
0.81
0.75
0.2
0.27
Severe Migraine
0.96
0.89
0.18
0.20
0.88
0.8
0.2
0.25
Dementia
0.9
0.85
0.16
0.19
0.9
0.86
0.13
0.15
Active Psychosis
0.95
0.9
0.12
0.13
0.91
0.87
0.14
0.16
Quadriplegia
0.93
0.9
0.09
0.10
0.91
0.87
0.14
0.16
* S.D. = standard deviation.
+ C.V. = Coefficient of Variation (standard deviation/mean)
Table 5
Pearson's correlation coefficients for median disability weights for each exercise based on 19 conditions common to all person trade-off exercises
Group
International I
International I
Netherlands
0.96
Netherlands
Maghreb-8
0.94
0.95
Maghreb
Japan
0.90
0.82
0.85
Japan
GBD
0.97
0.95
0.97
0.88
GBD
International II
0.99
0.97
0.94
0.89
0.97
International II
CDC
0.97
0.98
0.92
0.84
0.95
0.98
CDC
Brazil
0.90
0.91
0.87
0.83
0.87
0.90
0.90
Brazil
Mexico
0.95
0.93
0.92
0.90
0.93
0.96
0.96
0.95
Mexico
Composite
0.99
0.98
0.96
0.89
0.98
0.99
0.99
0.94
0.97
Based on the above results it seemed reasonable to use the set of disability weights from the GBD study for the US evaluation. In a few instances more detailed data on health conditions were available in the US on the distribution of severity for certain health conditions such as depression [see Additional file 2]. Disability weights for severity-specific stages were developed for many of these conditions as part of a burden of disease and injury study implemented in the Netherlands [20]. Therefore, the Dutch weights were used when stage specific information on severity was available.
In the mid-1990s chronic diseases such as cardiovascular diseases, cancers, depression, osteoarthritis, diabetes mellitus, and alcohol use and abuse were the leading causes of death and disability in the United States. In addition, injuries from motor-vehicle accidents and the HIV epidemic exacted a substantial toll on the US population. These findings are consistent with other assessments of disease burden in developed and developing countries. However, the use of DALYs to enumerate the impact of health conditions is notably different from a simple listing of causes of death. This metric captures the importance of mental conditions, such as depression and degenerative musculoskeletal disease that cause major health problems but result in few deaths, as well as the importance of premature deaths among young adults (Tables 27, and 28).
Table 27
Top twenty leading causes of Disability Adjusted Life Years (DALY), Years Lost to Disability (YLD), Years of Life Lost (YLL) and Deaths for Males – US 1996*
Cause
DALY (%)
YLD (%)
YLL (%)
Death (%)
1
Ischaemic heart disease
1,958 (11.0)
152 (2.1)
1,806(17.2)
287 (24.7)
2
Road traffic accidents
934 (5.2)
233 (3.2)
701 (6.7)
29 (2.5)
3
Lung trachea or bronchial cancer
813 (4.6)
35 (0.5)
778 (7.4)
102 (8.8)
4
HIV/AIDS
764 (4.3)
189 (2.6)
575 (5.5)
25 (2.2)
5
Alcohol use
732 (4.1)
651 (8.9)
81 (0.8)
5 (0.4)
6
Cerebrovascular Disease
674 (3.8)
317 (4.3)
357 (3.4)
63 (5.4)
7
COPD
642 (3.6)
373 (5.1)
269 (2.6)
52 (4.5)
8
Homicide and Violence
568 (3.2)
82 (1.1)
486 (4.6)
17 (1.5)
9
Self-inflicted injuries
541 (3.0)
8 (0.1)
534 (5.1)
26 (2.2)
10
Unipolar major depression
470 (2.6)
470 (6.4)
0 (0.0)
0 (0)
11
Diabetes mellitus
442 (2.5)
222 (3.0)
220 (2.1)
28 (2.4)
12
Osteoarthritis
435 (2.4)
434 (5.9)
1 (0.0)
0 (0)
13
Drug use
412 (2.3)
384 (5.2)
27 (0.3)
1 (0.1)
14
Congenital Abnormalities
410 (2.3)
238 (3.2)
172 (1.6)
6 (0.5)
15
Dementia and other degenerative and hereditary CNS disorders
382 (2.1)
332 (4.5)
50 (0.5)
14 (1.2)
16
Asthma
303 (1.7)
273 (3.7)
30 (0.3)
2 (0.2)
17
Cirrhosis of the liver
281 (1.6)
61 (0.8)
220 (2.1)
17 (1.4)
18
Conditions arising during the perinatal period
274 (1.5)
14 (0.2)
260 (2.5)
8 (0.7)
19
Cancer colon or rectum
249 (1.4)
37 (0.5)
213 (2.0)
30 (2.6)
20
Prostate cancer
239 (1.3)
79 (1.1)
160 (1.5)
37 (3.2)
-
Total number for each measure in the top 20 causes
11,523 (64.5)
4,584 (62.5)
6,940 (65.9)
749 (64.5)
-
Total number for each measure
17,861(100)
7,331(100)
10,530 (100)
1,164 (100)
*All counts for DALYs, Deaths, YLDs, and YLLs are in 1000's.
Table 28
Top twenty leading causes of Disability Adjusted Life Years (DALY), Years Lost to Disability (YLD), Years of Life Lost (YLL) and Deaths for Females – US 1996*
Cause
DALY (%)
YLD (%)
YLL (%)
Death (%)
1
Ischaemic heart disease
1,177 (7.7)
124 (1.6)
1,052(14.0)
249 (21.7)
2
Unipolar major depression
900 (5.9)
900 (11.7)
0 (0.0)
0 (0.0)
3
Cerebrovascular disease
836 (5.5)
408 (5.3)
428 (5.7)
99 (8.6)
4
COPD
612 (4.0)
354 (4.6)
257 (3.4)
48 (4.1)
5
Lung trachea or bronchial cancer
550 (3.6)
26 (0.3)
523 (6.9)
66 (5.7)
6
Breast cancer
515 (3.4)
64 (0.8)
450 (6.0)
47 (4.1)
7
Osteoarthritis
508 (3.3)
506 (6.6)
1 (0.0)
1(0.0)
8
Dementia and other degenerative and hereditary CNS disorders
507 (3.3)
424 (5.5)
83 (1.1)
29 (2.5)
9
Diabetes mellitus
504 (3.3)
274 (3.6)
230 (3.1)
34 (3.0)
10
Road traffic accidents
459 (3.0)
134 (1.7)
326 (4.3)
15 (1.3)
11
Alcohol use
409 (2.7)
386 (5.0)
23 (0.3)
1 (0.1)
12
Asthma
362 (2.4)
320 (4.2)
42 (0.6)
4 (0.3)
13
Congenital abnormalities
352 (2.3)
205 (2.7)
147 (1.9)
6 (0.5)
14
Cancer colon or rectum
234 (1.5)
38 (0.5)
197 (2.6)
31 (2.7)
15
Conditions arising during the perinatal period
220 (1.4)
16 (0.2)
205 (2.7)
6 (0.5)
16
Lower respiratory infections
195 (1.3)
10 (0.1)
186 (2.5)
46 (4.0)
17
PTSD
194 (1.3)
194 (2.5)
0 (0.0)
0 (0.0)
18
HIV/AIDS
193 (1.3)
49 (0.6)
144 (1.9)
6 (0.5)
19
Panic disorder
182 (1.2)
182 (2.4)
0 (0.0)
0 (0.0)
20
Bipolar disorder
165 (1.1)
165 (2.1)
0 (0.0)
0 (0.0)
Total number for each measure in the top 20 causes
9,074 (59.6)
4,779 (62.1)
4,294 (57.0)
688 (59.7)
Total number for each measure
15,230 (100)
7,693 (100)
7,537 (100)
1,151 (100)
*All counts for DALYs, Deaths, YLDs, and YLLs are in 1000's
The juxtaposition of the twenty leading causes of death, YLL, YLD and DALYs illustrates the extent to which an assessment of the relative importance of various causes based simply on total number of deaths differs from the assessment of leading causes of YLL, YLD and DALYs. For example, the total number of years lived with a disability resulting from unipolar major depression (1.3 million YLD) was equal to the number of years lost due to premature death from lung cancer (1.3 million YLL); and the burden resulting from osteoarthritis and motor vehicle accidents were similar (940.6 million YLD and 1 billion YLL respectively).
Osteoarthritis of the hip and knee (OA) and rheumatoid arthritis (RA) were the two leading musculoskeletal disorders. OA is an important public health problem that affects mostly older adults causing great pain and disability, and is one of the most rapidly growing causes of disability. The estimated 40 million prevalent cases in 1996 is projected to increase to 60 million cases by 2020 [22].
Substantial differences were found in the relative impact of individual conditions by gender and race. HIV/AIDS, alcohol dependence, as well as violent and unintentional injuries accounted for most of the worse health outcomes observed among Black and American Indian populations compared to White and Asian populations. Blacks fared much worse than the other race groups with regard to pregnancy outcomes. Blacks were the only group for which perinatal conditions ranked among the top ten causes of DALYs. Relatively high perinatal mortality rates persist in this population due to the combined effect of premature delivery and poor perinatal care.
Conditions associated with social issues in younger ages were much more common among Blacks and American Indians. For instance, YLL rates for HIV/AIDS were fivefold larger for Blacks than they were for any of the other races. YLL rates for homicide and violence were seven times higher for American Indians and twice as high for Blacks than they were for Whites and Asians.
One important objective of the study was to place the United States public health situation in a global context. Non-communicable diseases are the leading causes of deaths in all industrialized countries, where child and adult mortality are low. In developing regions, where child and adult mortality are still high, Group I represents a much larger share of the total. The dominance of HIV/AIDS observed in Blacks in the United States was akin to that in developing regions of the world. It was the third leading cause among black women in the US and the fifth leading cause among females in developing regions. HIV/AIDS accounted for a much smaller proportion of DALYs in other races in the US and did not figure among the top ten causes of DALYs in developed countries. Alcohol use for males in most racial subgroups in the United States exacted a high burden. This condition also ranked among the top five in other developed regions. Only Asian males and people living in developing countries did not have a large number of DALYs attributed to alcohol use.
US rankings clearly fell outside of the range observed elsewhere for a few causes: homicide and violence, HIV/AIDS, and perinatal conditions stand out regardless of race and gender. The United States has not been as successful in reducing the mortality burden due to violent injuries and perinatal conditions as were other industrialized countries with comparable levels of development.
In spite of the extensive population-based data available in the United States, there were limitations particularly in estimating disease burden by race due to smaller populations – Asians and American Indians. The major methodological limitations pertained to the different methods used to assign race and ethnicity in the census compared to death certificates; and to the limited population-based information that was available for many conditions for Asians and American Indians. For these last two groups, ratios of YLL to YLD for the overall US population were generally used to estimate the burden due to non-fatal health conditions. Such assumptions introduce a certain level of uncertainty in the estimates and call for caution in the interpretation of small absolute differences in the number of DALYs between different causes. This study provides a benchmark against which to assess future trends in health differentials in the United States and underscores the importance of further research to improve methods, provide stronger empirical evidence and better understanding of major risk factors for poor health outcomes.
Conclusion
This study provides a comprehensive picture of conditions that contribute most to poor health outcomes, and yields new evidence to the discussion of racial health inequalities in the United States. The existence of health inequalities is widely acknowledged and lies at the core of public health policy: reducing health inequalities is the major focus of Healthy People 2010 [23]. Previous studies have documented differentials in mortality by cause and have examined socio-economic determinants – income and education – of population health outcomes and health outcomes mediated through the health system: the utilization of health services, access, and quality of care [24‐26].
The main policy message emerging from this study is that cost-effective public health interventions are available to reduce the burden of the three conditions that contributed most to racial inequalities. It adds new evidence that greater investments of public health interventions have a much greater potential to reduce large health inequalities in the United States than do technology driven curative interventions. The fact that other countries, which have lower expenditures per capita have achieved better health outcomes than the United States indicates that the major goal of reducing health disparities by 2010 can be achieved.
Acknowledgements
We wish to acknowledge:
James S. Marks for initiating the study and for his support throughout the study; Lee Anneston, George Cauthen and Ted Thompson who developed estimates for selected causes; William Eaton, Charles Helmick, Ronald Kessler, Alan Lopez, Colin Mathers, Wayne Rosamond, Richard Seelik and Bedirhan Ustun who contributed invaluable technical guidance and critically reviewed estimates; Yuliya Popova and J.A. Kurichety who contributed to the preparation of the final document; Emmanuela Gakidou and Stanislava Nikolova who edited the final document.
Disclaimer: "The views and opinions in this report represent those of the authors and not the Centers for Disease Control and Prevention."
This study was funded by an Association of Schools of Public Health; ASPH/Centers for Disease Control and Prevention (CDC)/Agency for Toxic Substances and Disease Registry (ATSDR) Cooperative Agreement. The funding source had no role in study design; in the collection, analysis, and interpretation of data; in the writing of the manuscript; and in the decision to submit the manuscript for publication.
Open Access
This article is published under license to BioMed Central Ltd. This is an Open Access article is distributed under the terms of the Creative Commons Attribution License (
https://creativecommons.org/licenses/by/2.0
), which permits unrestricted use, distribution, and reproduction in any medium, provided the original work is properly cited.
Competing interests
The author(s) declare that they have no competing interests.
Authors' contributions
CJL conceived of the study, participated in its design, and helped to draft the manuscript. CMM, MTM participated in the study's design and coordination, data analysis and helped to draft the manuscript. SB, NT, MM, MTB, EME, JS, JGK, MH contributed to data analysis. ME helped to draft the manuscript. All authors read and approved the final manuscript.
The burden of disease and injury in the United States 1996
verfasst von
Catherine M Michaud Matthew T McKenna Stephen Begg Niels Tomijima Meghna Majmudar Maria T Bulzacchelli Shahul Ebrahim Majid Ezzati Joshua A Salomon Jessica Gaber Kreiser Mollie Hogan Christopher JL Murray