Thyroid function alters during neoadjuvant chemotherapy in breast cancer patients: results from the NEOZOTAC trial (BOOG 2010-01)
verfasst von:
S. de Groot, L. G. M. Janssen, A. Charehbili, E. M. Dijkgraaf, V. T. H. B. M. Smit, L. W. Kessels, A. van Bochove, H. W. M. van Laarhoven, E. Meershoek-Klein Kranenbarg, A. E. van Leeuwen-Stok, C. J. H. van de Velde, H. Putter, J. W. R. Nortier, J. J. M. van der Hoeven, H. Pijl, J. R. Kroep
This side study investigated the effect of chemotherapy on thyroid function and the extent to which it can predict pathological complete response (pCR) in patients with early breast cancer taking part in NEOZOTAC phase III trial, randomizing between neoadjuvant chemotherapy with or without additional zoledronic acid. Moreover, we examined the impact of thyroid function on toxicity. Serum samples of 38 patients were available for analyses. Free thyroxin (fT4) and thyroid stimulating hormone (TSH) levels were compared between baseline and before the 6th cycle and between subjects with and without pCR. The relation between toxicity and the variation in fT4 and TSH levels during chemotherapy was tested. Samples at baseline and before the 6th cycle were available for 31 and 21 patients, respectively. The mean baseline fT4 level was 16.0 pmol/L and TSH level 1.11 mU/L, and these did not differ between both arms at each time point. During six cycles of chemotherapy, fT4 levels decreased (p = 0.0001), and TSH levels increased significantly (p = 0.019). Interestingly, the decrease of fT4 was significantly greater in patients without nausea, vomiting, or neuropathy, than in patients with those side effects (p = 0.037, p = 0.043, and p = 0.050, respectively). Baseline TSH levels tended to be higher in patients with pCR (p = 0.035 univariate analysis and p = 0.074 multivariate analysis). Chemotherapy blunts thyroid function, which was associated with less side effects. These data urge further evaluation of the effects of thyroid function on toxicity and outcome of breast cancer therapy.
Introduction
Several epidemiological studies show a positive association between plasma thyroid hormones (TH)—triiodothyronine (T3) and the prohormone thyroxine (T4)—levels and breast cancer risk [1‐3], which supports the notion that TH promote tumor growth [4]. Indeed, in patients with hypothyroidism, breast cancer tends to be diagnosed at an older age and in a less advanced stage, suggesting that hypothyroidism protects against breast cancer and is associated with more indolent disease [5]. Hypothyroidism may protect against breast cancer, because TH directly stimulate tumor growth via T3 receptors (TR) [5], or because hypothyroidism is associated with reduced serum concentrations of insulin-like growth factor 1 [4, 6, 7]. Moreover, TH have estrogen-like effects [8, 9], whereby T3 may have the ability to mimic or enhance the effects of estradiol on breast cancer proliferation by binding to the estrogen receptor [9, 10]. In rodent tumor models, TH stimulate tumor growth, metastasis, and angiogenesis via integrin αvβ3, possibly mediated by phosphatidylinositol-3-kinase and MAPK [11, 12]. Clinical studies show that treatment-induced hypothyroidism, either by concomitant propylthiouracil or by cancer treatment itself, is associated with a favorable outcome in several cancer types [6, 13]. In a case control study, euthyroid patients with breast cancer had significantly higher TH levels than their healthy controls [14]. Thus, although only a few cases of overt hypothyroidism (probably induced by locoregional radiotherapy) after breast cancer therapy were reported [15‐17], even a slight decrease of THs in breast cancer patients treated with chemotherapy [18] could be of clinical relevance.
The influence of TH on effectiveness of chemotherapy remains unclear to date [19]. We aimed to elucidate the effect of chemotherapy on thyroid function and the predictive value of thyroid function on pathological complete response (pCR) in early breast cancer patients receiving neoadjuvant chemotherapy.
Anzeige
Patients and methods
Patients
Women eligible for the NEOZOTAC study had a histologically confirmed HER2-negative stage II or III breast cancer, and further in- and exclusion criteria have been described previous [20]. A subgroup participated in a side study measuring plasma fT4 and TSH concentrations before cycle 1, 2, and 6 of chemotherapy. Eleven of the participating centers of the NEOZOTAC participated in the side study; patients gave informed consent for extra blood sampling.
Study design
The NEOZOTAC study was an open label randomized phase III study, running in 26 hospitals in the Netherlands, which compared the efficacy of neoadjuvant chemotherapy with or without zoledronic acid. Eleven of the 26 hospitals participated in the side study. The study was conducted in accordance with the Declaration of Helsinki and approved by the Ethics Committees of the participating hospitals in agreement with the Dutch law for medical research involving humans.
Drugs
Women received TAC (75 mg/m2 of docetaxel i.v. in 1 h, 50 mg/m2 of doxorubicin i.v. in 15 min and 500 mg/m2 of cyclophosphamide i.v. in 1 h) on the first day of each of six 21-day cycles with or without 4 mg zoledronic acid i.v. in 15 min within 24 h after infusion of chemotherapy. Patients received premedication with dexamethasone (8 mg, b.i.d. the day before, the day of and the day after chemotherapy administration) in order to prevent fluid retention and hypersensitivity reactions. Granulocyte-colony stimulating factor (pegfilgrastim 6 mg) support was given the day after chemotherapy administration.
Blood sampling and analysis
Non-fasting blood samples were obtained directly before chemotherapy administration (baseline), before the second and before the sixth chemotherapy cycle (end of therapy) to measure fT4 and TSH levels. Samples were collected in EDTA tubes and directly kept on ice after drawing. After centrifuging, the supernatant was stored at −80 °C, and at the end of the study sent to the Leiden University Medical Center (LUMC) for analysis.
Anzeige
TSH and fT4 were determined by Modular Analytics E170 (Roche Diagnostics, Almere, The Netherlands) with chemiluminescence methods by the clinical laboratory of the LUMC. The following reference ranges were used; TSH 0.3–4.8 mU/L and fT4 is 12–22 pmol/L.
Response and toxicity evaluation
Central review of operation specimens was performed according to Dutch guidelines. Tumor regression was scored according to the Miller and Payne classification [21]. Pathological complete response (pCR) was defined as the absence of residual invasive cancer within the breast and lymph nodes.
All adverse events, grade II or more (according to NCI-CTCv4.0) reported spontaneously by the patient or observed by the treating physician or investigator, were recorded on an adverse event case report form. The relationship to the study drug(s) was recorded.
Statistical analysis
We performed an intention-to-treat analysis. All parameters were tested for normality using the Kolmogorov–Smirnov test, with Bonferroni adjustment when evaluated in subgroups. The normally distributed parameters were summarized as ‘mean ± standard error (SE)’ and compared using t-tests for paired groups. All t-tests and regression models were 2-sided with a significance level of 0.05. Univariate and multivariate odds ratios (OR), 95 % confidence intervals (95 % CI), and P values were calculated by applying logistic regression analysis. All data were analyzed using Statistical Package for Social Sciences (SPSS) software™ 20.0 (IBM Corp., Armonk, NY, USA).
Results
Patient characteristics
Serum samples of 38 of the 105 patients who participated in the side study measuring fT4 and TSH concentrations at different time-points during chemotherapy treatment were of sufficient quality and quantity for analysis of fT4 and TSH. None of the patients had a thyroid disorder or were on thyroid replacement therapy at baseline, and further clinical characteristics of the 38 women are given in Table 1. Patient characteristics are comparable with the characteristics of the whole cohort of the NEOZOTAC trial [20].
Table 1
Patient characteristics
Patients (N = 38) NEOZOTAC
Median Age (range), Years
49 (34–65)
WHO-status
0
34 (89.5 %)
1
2 (5.8 %)
Unknown
2 (5.8 %)
T-classification
cT2
22 (57.9 %)
cT3 or cT4
16 (42.1 %)
N-classification
cN0
19 (50.0 %)
cN+
19 (50.0 %)
Tumor type
Ductal
27 (71.1 %)
Lobular
7 (18.4 %)
Other
3 (7.9 %)
Unknown
1 (2.6 %)
Hormone receptor status
ER+ and/or PR+
33 (86.8 %)
ER− and PR−
5 (13.2 %)
Allocated treatment
TAC
20 (52.6 %)
TAC+ZA
18 (47.4 %)
pCR
Yes
6 (15.8 %)
No
31 (81.6 %)
Unknown
1 (2.6 %)
ER estrogen receptor, PR progesterone receptor, ZA zoledronic acid, pCR pathologic complete response
Thyroid function in breast cancer patients during chemotherapy
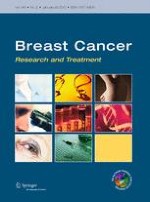
Serum samples at baseline, before the 2nd chemotherapy cycle and at end of treatment were available for 31, 30, and 21 patients, respectively. Baseline fT4 and TSH levels were compared with values before the 2nd and 6th chemotherapy cycle. FT4 levels decreased, and TSH levels increased significantly during chemotherapy treatment. None of the patients had TH values under or above the reference value. Mean values of fT4 and TSH before cycle 1, 2, and 6 are shown in Fig. 1. The given P values are based on the tested values of the first and the last cycles. There were no significant differences between subjects solely treated with TAC chemotherapy and subjects treated with zoledronic acid as an adjunct to TAC with respect to the mean fT4 and TSH levels at each time point. Chemotherapy adjustments were made in four patients; one patient stopped after 4 cycles TAC, one patients after 5 cycles, and two patients received only less cycles of docetaxel (1 and 3 cycles less, respectively), because of toxicity. No dose reductions were done. No significant differences were seen in the decline of fT4 (P = 0.354) and increase of TSH (P = 0.770) between patients with chemotherapy adjustments compared with patients who received all six cycles of TAC.
Fig. 1
Serum fT4 and TSH levels baseline and during chemotherapy
×
Association between alterations of thyroid function and side effects during chemotherapy
The relation between toxicity, per side effect of CTC grade II or more, and baseline values, as well as the variation in fT4 and TSH levels during chemotherapy was tested. There was no significant association between baseline fT4 and TSH and manifest side effects. However, a small decline of fT4 in the course of treatment, as reflected by a high ratio of fT4 levels at cycle 6 over fT4 levels at baseline, was associated with neuropathy, nausea, and vomiting grade II or more (Table 2). The ratio of TSH levels between pre and post-chemotherapy was not associated with side effects.
Table 2
Ratio of fT4 levels at cycle 6 over fT4 levels at baseline in relation to experienced side effects
Side effect (grade II or more)
N
Ratio fT4 (%)
ORa (95 % CI)
P value
Ratio TSH (%)
ORa (95 % CI)
P value
Neuropathy
Yes 18
89
2.56 (1.00–6.56)
0.050
200
1.02 (0.97–1.07)
0.517
No 12
81
163
Vomiting
Yes 7
95
3.36 (1.04–10.87)
0.043
163
0.99 (0.93–1.05)
0.664
No 23
84
191
Nausea
Yes 20
90
2.99 (1.07–8.37)
0.037
150
0.96 (0.91–1.01)
0.094
No 10
80
255
Alopecia
Yes 13
91
2.45 (0.98–6.13)
0.056
171
0.99 (0.94–1.04)
0.663
No 17
83
196
Fatigue
Yes 27
86
1.17 (0.38–3.61)
0.780
185
1.00 (0.93–1.08)
0.996
No 3
84
185
Mucositis
Yes 10
87
1.11 (0.56–2.22)
0.759
222
1.02 (0.98–1.07)
0.352
No 20
86
166
Diarrhea
Yes 7
93
2.38(0.91–6.22)
0.078
107
0.92 (0.82–1.04)
0.188
No 23
84
209
Neutropenia
Yes 2
86
0.88 (0.23–3.38)
0.939
320
1.05 (0.97–1.13)
0.640
No 28
85
175
Anemia
Yes 3
92
1.58 (0.57–4.41)
0.382
99
0.91 (0.74–1.12)
0.381
No 27
86
195
Thrombocytopenia
Yes 1
85
0.88 (0.14–5.74)
0.895
548
1.21 (0.63–2.31)
0.569
No 29
86
173
Overall grade III/IV
Yes 6
85
0.86 (0.37–2.00)
0.730
178
1.00 (0.94–1.06)
0.903
No 24
87
187
Bold values indicate that p<0.05, OR odds ratio, CI confidence interval
aOR is given per 10 percent increase in ratio fT4 or TSH
The predictive value of thyroid function on efficacy of chemotherapy
FT4 and TSH levels were compared between subjects with and without pCR. PCR was achieved in 16 % of the patients (6/37 and 1 unknown), and the pCR rate varied in the different subtypes, which is comparable with the whole cohort of the NEOZOTAC trial [20]. In hormone receptor-positive breast cancer, the pCR rate was 12.5 % (4/32), compared to 40 % (2/5) in the triple-negative patients.
Anzeige
FT4 and TSH levels were not related to pCR (Table 3). High TSH levels were associated with pCR in univariate analysis, but this was not significant in multivariate analysis. Although axillary lymph node status, tumor size, and hormone receptor status were not significantly associated with pCR, these clinicopathological factors were included in the multivariate model, as they were associated with pCR in earlier research [22, 23]. The total dose of chemotherapy was also included in the multivariate model.
Table 3
Univariate and multivariate logistic regression models of pCR and TSH and fT4
Univariate analysis
Multivariate analysis
OR
95 % CI
P value
OR
95 % CI
P value
Clinical axillary lymph node: Pos versus Neg
0.94
0.16–5.39
0.942
Clinical tumor size: >5cm versus <5cm
0.61
0.10–3.82
0.595
ER+/PR+ receptor: Pos versus Neg
0.21
0.27–1.70
0.154
Total dose of CT
1.01
0.88–1.16
0.915
fT4
0.78
0.43–1.42
0.417
0.66
0.33–1.29
0.223
TSH
3.24
1.09–9.70
0.035
19.7
0.77–504
0.072
Bold value indicates that p<0.05, pCR pathological complete response, ER estrogen receptor, PR progesterone receptor, OR odds ratio, CI confidence interval in multivariate model adjusted for axillary lymph node status, tumor size and hormone receptor status
Discussion
This study shows that thyroid function declines during treatment in stage II/III HER2-negative breast cancer patients treated with neoadjuvant TAC chemotherapy. Interestingly, fT4 levels decreased less in patients with side effects of therapy compared to patients without side effects.
The decline of fT4 concentrations and increase of TSH concentrations during TAC observed in our study may reflect damage to the thyroid gland inflicted by the chemotherapy. In keeping with this inference, breast cancer survivors have a high cumulative incidence of overt primary hypothyroidism during long-term follow-up [24], and therefore, it would be interesting to measure fT4 and TSH concentrations during follow-up to evaluate whether or not the concentrations normalize after neoadjuvant chemotherapy. Alternatively, the increase of TSH we observed could also be explained in the context of recovery of “non thyroidal illness” (NTI), an adaptive response to (chemotherapy-induced) cellular damage. In critically ill patients, the hypothalamus-pituitary-thyroid axis down-regulates as an adaptation to adverse physical conditions [25]. Analogously, in another study of breast cancer patients treated with TEC or FEC, NTI-like plasma markers were observed one to 3 days after chemotherapy administration [19], suggesting that NTI may be a primary adaptive response to chemotherapy-induced cellular damage. In apparent contrast to our data, NTI is marked by a decline of TSH and secondary hypothyroidism, unlike the increase of TSH observed in our study. However, during recovery of critical illness and NTI, TSH levels tend to be increased [25]. Thus, the elevation of TSH we observed 3 weeks after chemotherapy administration, may in fact reflect the recovery of immediate adaptations of thyroid function (NTI) in response to treatment-induced cellular damage.
Whatever the cause of the chemotherapy-associated decline of fT4 we observed, a large reduction of fT4 concentrations in the course of 6 cycles TAC was associated with less (cumulative) side effects in terms of neuropathy, vomiting, and nausea of CTC grade II or higher. It is conceivable that lower levels of fT4 during chemotherapy, as an adaptive response, protect the body against tissue damage by down-regulating cellular metabolism. Interestingly, and potentially in analogy, low fT4 levels appear to protect people against the perils of old age, as low fT4 was associated with the longest lifespan in a population-based study of the elderly [26].
Anzeige
Influence of thyroid function on efficacy of cancer therapies has been described [27]. For example, in renal cancer patients treated with sunitinib, one-third of the patients experienced hypothyroidism as a side effect [27, 28], which had a positive impact on treatment outcome [29, 30]. Also, in a phase I/II study, propylthiouracil-induced chemical hypothyroidism was associated with a significantly longer median survival in glioma patients treated with high-dose tamoxifen [6]. Moreover, in patients with head and neck cancer, hypothyroidism due to radiotherapy tended to be associated with improved survival retrospectively [13]. However, we could not show that a low fT4 or a high TSH has a positive impact on chemotherapy efficacy.
It seems important to emphasize that the sample size of our study is small. Therefore, the results clearly need validation in a larger cohort which is planned in an ongoing trial in patients with early breast cancer (NCT02126449).
In conclusion, thyroid function declines during chemotherapy, and a large reduction of circulating fT4 is associated with less side effects of treatment. The results of our explorative study urge further evaluation of the impact of TH on cancer therapy.
Acknowledgments
We are greatly indebted to the patients for participating in this (side) study, and we thank the LUMC Datacenter, department of Surgery, for trial coordination and data collection. This work was supported by grants from the Dutch Cancer Society (2010-4682), Amgen, Novartis and Sanofi Aventis.
Anzeige
Conflict of interest
The authors declare that they have no conflict of interest.
Open AccessThis article is distributed under the terms of the Creative Commons Attribution Noncommercial License which permits any noncommercial use, distribution, and reproduction in any medium, provided the original author(s) and the source are credited.
Mit e.Med Gynäkologie erhalten Sie Zugang zu CME-Fortbildungen der beiden Fachgebiete, den Premium-Inhalten der Fachzeitschriften, inklusive einer gedruckten gynäkologischen oder urologischen Zeitschrift Ihrer Wahl.
Thyroid function alters during neoadjuvant chemotherapy in breast cancer patients: results from the NEOZOTAC trial (BOOG 2010-01)
verfasst von
S. de Groot L. G. M. Janssen A. Charehbili E. M. Dijkgraaf V. T. H. B. M. Smit L. W. Kessels A. van Bochove H. W. M. van Laarhoven E. Meershoek-Klein Kranenbarg A. E. van Leeuwen-Stok C. J. H. van de Velde H. Putter J. W. R. Nortier J. J. M. van der Hoeven H. Pijl J. R. Kroep
Nun gibt es auch Resultate zum Gesamtüberleben: Eine adjuvante Pembrolizumab-Therapie konnte in einer Phase-3-Studie das Leben von Menschen mit Nierenzellkarzinom deutlich verlängern. Die Sterberate war im Vergleich zu Placebo um 38% geringer.
Das Risiko für Rezidiv oder Tod von Patienten und Patientinnen mit reseziertem ALK-positivem NSCLC ist unter einer adjuvanten Therapie mit dem Tyrosinkinase-Inhibitor Alectinib signifikant geringer als unter platinbasierter Chemotherapie.
Patienten, die zur Behandlung ihres Prostatakarzinoms eine Androgendeprivationstherapie erhalten, entwickeln nicht selten eine Anämie. Wer ältere Patienten internistisch mitbetreut, sollte auf diese Nebenwirkung achten.
Müssen sich Schwangere einer Krebstherapie unterziehen, rufen Immuncheckpointinhibitoren offenbar nicht mehr unerwünschte Wirkungen hervor als andere Mittel gegen Krebs.
Update Onkologie
Bestellen Sie unseren Fach-Newsletterund bleiben Sie gut informiert.