Effective, evidence-based management of type 2 diabetes (T2D) requires the integration of the best available evidence with clinical experience and patient preferences.
Methods
Studies published from 2000 to 2012 evaluating glucagon-like peptide-1 receptor agonists (GLP-1RAs) or dipeptidyl peptidase-4 inhibitors (DPP-4 inhibitors) were identified using PubMed. The author contextualized the study findings with his clinical experience.
Results
Incretin-based therapy targets multiple dysfunctional organs in T2D. Injectable GLP-1RAs provide substantial glycemic control and weight reduction; while oral DPP-4 inhibitors provide moderate glycemic control and weight neutrality. Both classes are effective, well tolerated, and associated with a low incidence of hypoglycemia when used alone or in combination with other antidiabetes agents. GLP-1RAs are associated with transient nausea and, like DPP-4 inhibitors, rare pancreatitis.
Conclusion
Data indicate and clinical experience confirms that incretins are well tolerated in appropriate patients and provide sustained glycemic control and weight loss or weight neutrality throughout T2D progression.
The online version of this article (doi:10.1007/s12325-014-0100-5) contains supplementary material, which is available to authorized users.
Introduction
Incretins [glucagon-like peptide 1 (GLP-1) and glucose-dependent insulinotropic polypeptide (GIP)] are hormones that stimulate insulin secretion, inhibit glucagon secretion, delay gastric emptying, and decrease appetite [1]. They also play an important physiological role in regulating both first- and second-phase insulin responses, which are impaired in patients with type 2 diabetes (T2D) [2]. Recent evidence suggests an approximate 60% reduction in the magnitude of incretin effects in individuals with T2D [2].
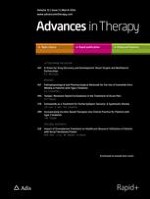
Two classes of incretin-based therapies are currently available: injectable GLP-1 receptor agonists (GLP-1RAs) and oral dipeptidyl peptidase-4 inhibitors (DPP-4 inhibitors) [3‐11]. The efficacy, tolerability, and clinical use of these agents are described in Tables 1, 2, 3, 4, 5, 6, 7, 8, 9 [5‐33]. Currently available GLP-1RAs include liraglutide, exenatide twice daily (exenatide BID), and exenatide once weekly [exenatide extended release (EQW)]. Liraglutide and exenatide BID are administered by pen devices; EQW is administered as a suspension with a 23-gage needle and syringe and requires reconstitution. GLP-1RAs enhance glucose-dependent insulin secretion by mimicking the glucoregulatory effects of endogenous GLP-1 and by providing pharmacological (high) levels of GLP-1 activity, and also suppress glucagon release (Fig. 1) [1, 34, 35]. In contrast, DPP-4 inhibitors prevent enzymatic inactivation of endogenous GLP-1, resulting in prolonged availability of physiological levels of native GLP-1 and GIP and modest receptor activation [1]. Sitagliptin, saxagliptin, and linagliptin are the DPP-4 inhibitors currently available in the United States. A fourth DPP-4 inhibitor, alogliptin, has recently been approved. All are administered orally once daily, with or without food.
Table 1
Currently approved incretin-based therapies [5‐11]
Indications
Contraindications
Warnings and precautions*
Most common adverse reactions†
Dosing
Dose adjustment in renal impairment‡
GLP-1RAs
Exenatide
Use as monotherapy, in combination with OADs and insulin
Serious hypersensitivity to exenatide or product components
Pancreatitis, hypoglycemia (with insulin and sulfonylurea), use with severe renal impairment and ESRD, severe GI disease, hypersensitivity to exenatide
Starting dose 5 mcg twice daily; titrate to 10 mcg twice daily after 1 month; exenatide is administered twice daily, 1 h before morning and evening meals
None; exenatide should not be used in severe renal impairment or ESRD
Exenatide Extended Release (EQW)
Use as monotherapy and in combination with OADs
Personal or family history of medullary thyroid carcinoma or multiple endocrine neoplasia syndrome type 2 or serious hypersensitivity to exenatide or product components
Thyroid C-cell tumors, pancreatitis, hypoglycemia (with insulin and sulfonylurea), use in severe renal impairment and ESRD, severe GI disease, hypersensitivity to exenatide
Nausea, diarrhea, headache, vomiting, constipation, injection site pruritus, injection site nodule, and dyspepsia
2 mg once weekly without regard to meals
None; should not be used in severe renal impairment or ESRD
Liraglutide
Use as monotherapy, in combination with OADs and insulin
Personal or family history of medullary thyroid carcinoma or multiple endocrine neoplasia syndrome type 2 or serious hypersensitivity to liraglutide or product components
Thyroid C-cell tumors, pancreatitis, serious hypoglycemia (with insulin and sulfonylurea), use in renal impairment, hypersensitivity to liraglutide
Headache, nausea, diarrhea, and anti-liraglutide antibody formation
Starting dose 0.6 mg/day for 1 week; 1.2 mg/day thereafter; if acceptable glycemic control is not reached, dose can be increased to 1.8 mg/day; Liraglutide is administered once daily independently of meals
None
DPP-4 inhibitors
Sitagliptin
Use as monotherapy, in combination with OADs and insulin
Serious hypersensitivity to sitagliptin
Acute pancreatitis, acute renal failure, hypoglycemia (with insulin and a sulfonylurea), allergy/hypersensitivity
Upper respiratory tract infection (URI), nasopharyngitis, and headache; hypoglycemia when used with insulin/sulfonylurea
100 mg once daily, with or without food
50 mg once daily in moderate renal impairment; 25 mg once daily in severe renal impairment and ESRD
Saxagliptin
Use as monotherapy, in combination with OADs and insulin
Serious hypersensitivity to saxagliptin
Acute pancreatitis, hypoglycemia (with insulin and a sulfonylurea), hypersensitivity to saxagliptin
URI, urinary tract infection (UTI), and headache; hypoglycemia when used with insulin/sulfonylurea; peripheral edema when used with a TZD
N/A
2.5 mg once daily in moderate or severe renal impairment or ESRD
Linagliptin
Use as monotherapy, in combination with OADs and insulin
Serious hypersensitivity to linagliptin
Hypoglycemia (with sulfonylurea/insulin)
Nasopharyngitis; hypoglycemia when used with sulfonylurea
N/A
None
Alogliptin
Use as monotherapy, in combination with OADs and insulin
Serious hypersensitivity to alogliptin
Acute pancreatitis, hypersensitivity, hepatic effects, hypoglycemia (with insulin and a sulfonylurea)
Nasopharyngitis, headache, URI
N/A
12.5 mg once daily in moderate renal impairment; 6.25 mg once daily in severe impairment and ESRD
*All antidiabetes agents carry a warning regarding the lack of clinical studies providing conclusive evidence of macrovascular risk reduction with their use
†Reported in ≥4% (alogliptin) or ≥5% (exenatide, EQW, liraglutide, sitagliptin, saxagliptin, linagliptin) and more frequently than in patients treated with placebo
‡Moderate renal impairment: CrCl ≥30 mL/min and <50 mL/min (sitagliptin) or <60 mL/min (alogliptin); severe renal impairment: CrCl <30 mL/min
Table 2
Glycemic effects of GLP-1RAs vs DPP-4 inhibitors in randomized clinical trials conducted in patients with T2D
Drug comparison/study design and duration
Patient population
Background medication (s)
∆ A1C (%)
∆ FPG (mmol/L unless otherwise noted)
∆ 2-h PPG (mmol/L) (mg/dL)
Hypoglycemic episodes (%) (event/person/year)
Treatment
GLP-1RA
DPP-4 inhibitor
GLP-1RA
DPP-4 inhibitor
GLP-1RA
DPP-4 inhibitor
GLP-1RA
DPP-4 inhibitor
Liraglutide (1.2 or 1.8 mg/day) vs sitagliptin 26-week open-label study [12]
Patients with inadequate glycemic control on metformin
Metformin
−1.24*
−1.50*
−0.9
−1.87*
−2.14*
−0.83
NR
5% (0.370)
5% (0.106)
At 26 weeks; *P < 0.0001 for comparison of each dose of liraglutide to sitagliptin
26-week extension study of liraglutide (1.2 or 1.8 mg/day) vs. sitagliptin [13]
Patients with inadequate glycemic control on metformin
Metformin
−1.29*
−1.51*
−0.88
−1.71*
−2.04*
−0.59
NR
8.1% (0.143)
8.3% (0.154)
6.4% (0.170)
At 52 weeks; *P < 0.0001 for comparison of each dose of liraglutide to sitagliptin
Second 26-week extension in which patients on sitagliptin were switched to liraglutide [14]
Patients with inadequate glycemic control on metformin
Metformin
−0.9*
−1.3*
−0.2
−0.5 after switch to liraglutide†
−1.3*
−1.7*
−0.8
−1.4 after switch to liraglutide†
NR
(0.156)‡
(0.130)‡
(0.031)§
(0.060)§
*Change from baseline (week 0)
†Change after switch to liraglutide at week 52
‡Rates of minor hypoglycemia from week 0 to week 72; 1 patient on liraglutide 1.2 mg/day experienced 2 major episodes
§Rates of minor hypoglycemia after switch to liraglutide; no episodes of major hypoglycemia were reported
Exenatide vs sitagliptin vs background medication alone; 4-week open-label study [15]
−1.8*†
−1.5*
NR
NR
NR
*P < 0.0001 for comparison with baseline; †P = 0.0154 for comparison with metformin + insulin glargine (−1.23%)
Exenatide vs sitagliptin plus exenatide; 20-week, double-blind, parallel-group study [16]
Patients with inadequate glycemic control on metformin + sitagliptin
Metformin
−0.38*
−0.68
0.06*
−0.55
−1.55*
−2.10
0.8%
1.6%
*P < 0.05 for comparison of exenatide BID with exenatide BID + sitagliptin
Glycemic effects of GLP-1RAs plus insulin in randomized clinical trials conducted in patients with T2D
Drug comparison/study design and duration
Patient population
Background medication(s)
∆ A1C (%)
∆ FPG (mmol/L unless otherwise noted)
∆ 2-h PPG (mmol/L) (mg/dL)
Hypoglycemic episodes (%) (event/person/year)
Treatment
GLP-1RA
GLP-1RA + Insulin
GLP-1RA
GLP-1RA + Insulin
GLP-1RA
GLP-1RA + Insulin
GLP-1RA
GLP-1RA + Insulin
Liraglutide vs liraglutide + insulin
Liraglutide; 12-week lead, in which liraglutide was added to metformin[28]
Insulin-naive patients on metformin or metformin/sulfonylurea combination
Metformin
−1.3 (O)
−0.7 (RC)
−0.6 (RT)
–
−2.0 (O)
−1.5 (RC)
−1.0 (RT)
–
NR
–
6.2% (O)
(0.38)
0% (RC)
(0)
4.3% (RT)
(0.21)
–
At 12 weeks, controlled patients were included in an observational group (O) and continued in the extension. Inadequately controlled patients were randomized to continued therapy (randomized control, RC) or to additional treatment with insulin detemir (randomized treatment, RT)
26-week, open-label extension in which patients controlled by liraglutide/metformin combination continued same treatment; inadequately controlled patients were randomized to continue same treatment or to receive insulin in addition to combination [28]
−1.1 (O)
−0.8 (RC)
−1.1* (RT)
−2.1 (O)
−2.3 (RC)
−3.1† (RT)
NR
NR
4.2% (O)
(0.13)
1.3% (RC)
(0.03)
9.2%‡ (RT)
(0.29)
*P < 0.0001; †P = 0.03; ‡P = 0.004 for RC vs RT comparisons at end of 26-week extension
*P < 0.0001 for treatment with linagliptin + background meds compared with placebo + background meds
Sitagliptin vs increasing dose of insulin; 24-week, parallel group [31]
Patients uncontrolled on insulin alone
Insulin
–
−0.63*
–
NS
–
−74.5 mg/dL†
–
7.0§ EPY
*P = 0.01 for comparison with increasing dose of insulin (−0.22); †P < 0.001 for comparison with increasing dose of insulin (−21.7); NS not significantly different between treatments (values not reported); §P < 0.05 vs increasing dose of insulin (14.3 EPY)
Sitagliptin vs placebo;
24-week, double-blind, placebo-controlled, parallel group [32]
Patients uncontrolled on insulin alone or in combination with metformin
Insulin, alone or in combination with metformin
–
−0.6*
–
−18.5†
–
−30.9 mg/dL
–
16%§
*P < 0.001 for comparison with placebo (0); †P ≤ 0.001 for comparison with placebo (−3.5 for FSG and +5.2 for PPG); §P < 0.003 compared with placebo
Saxagliptin vs placebo;
24-week, double-blind, placebo-controlled, parallel group [33]
Patients uncontrolled on insulin alone or in combination with metformin
Insulin, alone or in combination with metformin
–
−0.73*
–
−0.22
–
−1.3†
–
Minor: 5.3%
Major: 1.0%
At week 24, *P < 0.0001 compared with placebo; †P = 0.0016 compared with placebo
At 26 weeks; *P = 0.0002 for comparison of exenatide BID to sitagliptin; †P = 0.0055 for difference in SBP (−4 mmHg)
26-week, open-label extension in which patients previously on sitagliptin or pioglitazone switched to exenatide [20]
0.7*
−1.1* after switch to EQW
NR
NR
−0.9
−2.7* after switch to EQW
At 52 weeks, *P < 0.05 comparison with blinded period (weeks 0–26)
EQW vs sitagliptin vs metformin vs pioglitazone; 26-week noninferiority [21]
−2.0*
−0.8
Ratio (baseline to endpoint): +1.8†
Ratio (baseline to endpoint): +1.3
NR
NR
*P < 0.001 for comparison of EQW to sitagliptin or pioglitazone; NS for comparison with metformin; †P < 0.001 for comparison of EQW to sitagliptin, pioglitazone, or metformin
∆ change, A1C hemoglobin A1c, BW body weight, DPP-4 inhibitor dipeptidyl peptidase-4 inhibitor, EBID exenatide twice daily, EPY events/person/year, EQW exenatide extended release, FPG fasting plasma glucose, GLP-1RA glucagon-like peptide-1 receptor agonist, HOMA-B homeostatic model assessment-B, NR not reported, NS not significant, LQD liraglutide once daily, PPG postprandial glucose, SBP systolic blood pressure, TZD thiazolidinediones
Table 7
Extraglycemic effects of longer-acting vs shorter-acting GLP-1RAs in randomized clinical trials conducted in patients with T2D
14-week, open-label extension in which patients on exenatide BID switched to liraglutide (LEAD-6) [23]
–
−0.9* after switch to liraglutide
−0.4†
–
14.5‡ after switch to liraglutide
NR
–
−3.8* after switch to liraglutide
−2.2
At 40 weeks; *P < 0.0001 compared with exenatide at 26 weeks; †P = 0.0089 compared with liraglutide at 26 weeks; ‡P = 0.001 compared with exenatide at 26 weeks; §P = 0.0128 compared with exenatide at 26 weeks
Liraglutide vs. EQW; 26-week, open-label, parallel group (DURATION-6) [24]
∆ change, A1C hemoglobin A1c, BW body weight, DPP-4 inhibitor dipeptidyl peptidase-4 inhibitor, EBID exenatide twice daily, EPY events/person/year, EQW exenatide extended release, FPG fasting plasma glucose, GLP-1RA glucagon-like peptide-1 receptor agonist, HOMA-B homeostatic model assessment-B, NR not reported, NS not significant, LQD liraglutide once daily, PPG postprandial glucose, SBP systolic blood pressure, TZD thiazolidinediones
Table 8
Extraglycemic effects of GLP-1RAs plus insulin in randomized clinical trials conducted in patients with T2D
Drug comparison/study design and duration
∆ BW (kg)
∆ β-cell Function (HOMA-B) (%)
∆ SBP (mmHg)
Treatment
GLP-1RA
GLP-1RA + Insulin
GLP-1RA
GLP-1RA + Insulin
GLP-1RA
GLP-1RA + Insulin
Liraglutide vs liraglutide + insulin;
12-week lead-in which liraglutide was added to metformin [28]
−4.4 (O)
−3.5 (RC)
−3.5 (RT)
–
NR
–
NR
–
At 12 weeks, controlled patients were included in an observational group (O) and continued in the extension. Inadequately controlled patients were randomized to continued therapy (randomized control, RC) or to additional treatment with insulin detemir (randomized treatment, RT)
26-week, open-label extension in which patients controlled by liraglutide/metformin combination continued same treatment; patients not adequately controlled by liraglutide/metformin combination were randomized to continue same treatment or to receive insulin in addition to combination [28]
−4.8 (O)
−4.7 (RC)
−4.0* (RT)
NR
NR
−3.3 (O)
−3.1 (RC)
−1.7 (RT)
*P = 0.03; ‡P = 0.004 for RC vs RT comparisons at end of 26-week extension
Exenatide BID vs placebo; 30-week, double-masked, placebo-controlled trial in patients on background therapy with insulin glargine alone or in combination with metformin and/or pioglitazone [29]
–
−1.78*
–
NR
–
−2.7†
*P < 0.001 for comparison with placebo (+0.96); P = 0.01 for comparison with placebo (+1.7)
∆ change, A1C hemoglobin A1c, BW body weight, DPP-4 inhibitor dipeptidyl peptidase-4 inhibitor, EBID exenatide twice daily, EPY events/person/year, EQW exenatide extended release, FPG fasting plasma glucose, GLP-1RA glucagon-like peptide-1 receptor agonist, HOMA-B homeostatic model assessment-B, NR not reported, NS not significant, LQD liraglutide once daily, PPG postprandial glucose, SBP systolic blood pressure, TZD thiazolidinediones
Table 9
Extraglycemic effects of DPP-4 inhibitors plus insulin in randomized clinical trials conducted in patients with T2D
Drug comparison/study design and duration
∆ BW (kg)
∆ β-cell function (HOMA-B) (%)
∆ SBP (mmHg)
Treatment
DPP-4 inhibitor
DPP-4 inhibitor + Insulin
DPP-4 inhibitor
DPP-4 inhibitor + Insulin
DPP-4 inhibitor
DPP-4 inhibitor + Insulin
Linagliptin vs placebo; 1-year, randomized, double-blind, placebo-controlled study in patients with T2D and severe renal impairment [30]
*P < 0.05 vs stable dose of insulin alone (+1.1 kg)
Sitagliptin vs placebo;
24-week, double-blind, placebo-controlled, parallel group [32]
–
+0.1 NS
–
NR
–
NR
NS—not significantly different from placebo (+0.1)
Saxagliptin vs placebo
24-week, double-blind, placebo-controlled, parallel group [33]
–
−0.39
–
−1086.8* (304.25)
NR
NR
*Adjusted mean change from baseline (SE) in postprandial glucagon AUC (pg min/mL)
∆ change, A1C hemoglobin A1c, BW body weight, DPP-4 inhibitor dipeptidyl peptidase-4 inhibitor, EBID exenatide twice daily, EPY events/person/year, EQW exenatide extended release, FPG fasting plasma glucose, GLP-1RA glucagon-like peptide-1 receptor agonist, HOMA-B homeostatic model assessment-B, NR not reported, NS not significant, LQD liraglutide once daily, PPG postprandial glucose, SBP systolic blood pressure, TZD thiazolidinediones
Fig. 1
Mechanism of Action of GLP-1RAs and DPP-4 inhibitors. DPP-4 inhibitors dipeptidyl peptidase-4 inhibitors, GIP glucose-dependent insulinotropic polypeptide, GLP-1 glucagon-like peptide-1. Reprinted with permission from McDougall et al [35]. Drugs for diabetes: part 5. DPP-4 inhibitors
×
Anzeige
Incretin-based therapies target most of the dysfunctional organ systems in T2D, potentially improve β-cell function [18, 22, 36], have minimal hypoglycemia risk, and are either weight neutral [31] or induce weight loss [15, 29, 37‐43]. However, differences in the mechanisms of action and pharmacodynamics/pharmacokinetics, between and within these classes, can result in important differences in fasting plasma glucose (FPG), postprandial glucose (PPG), body weight, β-cell function, blood pressure (BP), and safety and tolerability [44], as found in randomized head-to-head clinical trials (Tables 2, 3, 4, 5, 6, 7, 8, 9 [12‐33]). Numerous reviews have examined the efficacy and tolerability of GLP-1RAs and DPP-4 inhibitors based on the results from randomized controlled trials (RCTs) [34, 45‐47], but few have focused on comparisons among incretin agents. Moreover, in clinical practice, the appropriate choice of incretin therapy for a given patient is not always clear.
Effective evidence-based decision making requires the integration of clinical experience with the best available clinical evidence, provided by data from either RCTs or systematic research and patient preference [48, 49]. While clinical trials are conducted in highly selective patient populations with limited strategies, treatment of T2D in clinical practice should reflect an individualized, patient-centered approach that considers the preferences, needs, and values of individual patients [3], as indicated by recent treatment guidelines [3, 4]. This review examines the clinical evidence surrounding the use of GLP-1RAs and DPP-4 inhibitors in the context of more than 25 years in a general endocrinology practice. Approximately 50–60% of patients treated in this setting have T2D. It is the objective of this analysis to help clinicians both individualize and optimize incretin therapy in appropriate candidates throughout the progression of T2D.
Methods
A PubMed literature search was conducted for randomized, head-to-head, comparative studies published between 2000 and 2012 including GLP-1RAs and DPP-4 inhibitors. In addition, randomized, controlled studies for monotherapy and combination therapy published between 2000 and 2012 and internal references on incretins and incretin-based therapies were considered. Specific search terms included glucagon-like peptide-1, GLP-1RAs, exenatide, liraglutide, dipeptidyl peptidase 4, DPP-4 inhibitors, sitagliptin, saxagliptin, and linagliptin.
Compliance with Ethics Guidelines
The analysis in this article is based on previously conducted studies and does not involve any new studies of human or animal subjects performed by the author.
Anzeige
Role of Incretin Therapies in Diabetes Management
Guidelines currently include incretin therapies at all stages of pharmacologically treated T2D [3, 4]. They are recommended for initial therapy (usually in combination with metformin and also as monotherapy in some patients), as add-on therapy to oral agents, and even in combination with insulin with or without additional therapies [3, 4, 50].
Newly Diagnosed, Treatment-Naive Patients
Recommendations for the initial use of metformin in newly diagnosed patients are nearly universal, unless it is contraindicated. However, some patients with high hemoglobin A1c (A1C) at diagnosis are unlikely to achieve their individualized glycemic goals on metformin alone and may require initial combination therapy, which should include classes of medications with complementary modes of action [4] to effectively target the underlying multiorgan pathophysiology of T2D. Balancing adverse events (AEs) and treatment benefits, particularly the risk for hypoglycemia, is also important. One important option for initial combination therapy is metformin with a GLP-1RA or a DPP-4 inhibitor.
Data on initial combination therapy with GLP-1RAs and metformin in treatment-naive patients inadequately controlled on diet and exercise alone are limited, and no studies have compared initial combination therapy with metformin and GLP-1RAs or DPP-4 inhibitors. However, initial combination therapy with metformin and sitagliptin, saxagliptin, or linagliptin has been evaluated in several clinical trials [51‐53]. In these trials, mean A1C reductions with initial combination therapy with a DPP-4 inhibitor and metformin 2,000 mg/day ranged from 1.7 to 2.5%. DPP-4 inhibitors were generally well tolerated in these trials. Rates of hypoglycemia were low and AEs occurred at a similar frequency across groups in each study.
GLP-1RAs and metformin as initial therapy have not been extensively evaluated, but GLP-1RAs have been studied as add-on therapy to metformin in numerous trials. Results from these trials may provide some insight as to the potential effects of this combination as initial therapy. Such trials have demonstrated reductions in A1C of 0.8–1.5%, with weight loss of 2.3–2.8 kg [19, 54, 55]. Comparative data on the relative impact of incretin therapies among patients inadequately controlled on metformin will be considered later in the manuscript.
Clinical Experience with Incretins as Initial Therapy
In newly diagnosed patients requiring more than metformin to get to their individualized A1C goal, the choice for incretin therapy depends on several factors, including baseline A1C, body mass index, and comorbidities. GLP-1RA plus metformin for obese patients with high A1C typically works well. It is possible to achieve glycemic targets in patients at A1C 10% with GLP-1RAs and metformin [22]. In addition, the sustained weight loss associated with GLP-1RAs in clinical trials—which can be impressive in some patients—is beneficial to many organ systems [26]. Because of the limited glucose-lowering potential of DPP-4 inhibitors, metformin with a DPP-4 inhibitor in patients with baseline A1C ≥10% will not get most patients to their goal. Although there is evidence suggesting that DPP-4 inhibitors are less effective in patients with A1C <8% [56], DPP-4 inhibitors can be used in patients with lower A1C when they are of normal weight, particularly when they resist injections.
For patients with high A1C, symptoms of hyperglycemia, and significant glucotoxicity, the use of insulin is recommended in current treatment guidelines. In the author’s clinical experience, patients can be weaned off insulin, as glucotoxicity abates, and initiated on metformin and a GLP-1RA. While clinical data on this approach are limited, it has been successful in the author’s practice.
Incretin Agents as Monotherapy
There are some newly diagnosed patients in whom metformin is inappropriate or contraindicated. Incretin-based therapies may be a useful option in this population, which includes patients with moderate-to-severe renal impairment or heart failure.
However, patients with severe renal impairment or end-stage renal disease (ESRD) may also be poor candidates for some incretin therapies. Because they are cleared through the kidney, exenatide BID and EQW should not be used in this population [5, 7]. Although liraglutide is not cleared by renal mechanisms and no differences in safety and efficacy were found in patients with mild renal impairment in a meta-analysis of the Liraglutide Effect and Action in Diabetes (LEAD) clinical trial program [57], caution and careful monitoring should still be used when initiating liraglutide in such patients [7]. Sitagliptin, saxagliptin, and alogliptin, but not linagliptin, require dose reductions in patients with renal impairment or ESRD [8‐11].
Anzeige
Although data from head-to-head studies of incretin therapies in drug-naive patients with T2D are relatively rare, and no studies have directly compared different DPP-4 inhibitors, the limited comparisons between GLP1-RAs and DPP-4 inhibitors and between various GLP-1RAs can help guide the physician in their choice of incretin therapy, if metformin is not an option.
Data from RCTs comparing EQW with sitagliptin monotherapy showed significantly greater reductions in FPG, A1C, and body weight, and showed that a significantly higher proportion of patients achieved a target A1C level of <7.0% or ≤6.5%, with EQW. Moreover, there were no significant differences between EQW and metformin monotherapy on reductions in FPG or A1C or on the proportion of patients achieving a target A1C level of <7.0% [21], suggesting similar outcomes.
Among patients who managed their diabetes with diet and exercise alone, EQW provided significantly greater reduction in A1C, FPG, and weight compared with exenatide BID. A significantly higher proportion of patients achieved target A1C levels of <7.0% and ≤6.5% with EQW [27]. Few head-to-head data on the use of liraglutide compared with other incretin agents in treatment-naive patients are available. However, patients treated with liraglutide monotherapy showed significantly greater reductions in A1C from baseline, compared with glimepiride [58, 59].
Clinical Experience with Incretins in Monotherapy
Although prescribing information for liraglutide or EQW advises against using these agents as first-line therapy, they are typically my preferred alternative to metformin if metformin cannot be used. GLP-1RAs may be particularly suitable because they are effective, may facilitate weight loss, and are associated with a low risk of hypoglycemia. When considering GLP-1RAs, the author’s patients usually receive the longer-acting GLP-1RAs, liraglutide and EQW, instead of exenatide BID, because they are dosed less frequently and have a superior effect on fasting glucose [22, 27].
Anzeige
In patients with moderate-to-severe renal impairment who require A1C reductions >1% or who would benefit from weight loss, liraglutide is preferred because exenatide BID and EQW should not be used in such patients, but it should be used with caution [5‐7]. Linagliptin or reduced-dose sitagliptin or saxagliptin is each a useful option in nonobese patients and/or if a patient with renal insufficiency requires ≤1% A1C reduction [60]. DPP-4 inhibitors may be particularly appropriate as initial therapy in frail or slim elderly patients with renal impairment, moderately elevated A1C, and elevated PPG without a substantially elevated FPG [60].
Incretins, including GLP-1RAs, are also useful in patients who cannot tolerate the gastrointestinal (GI) side effects of metformin. In the author’s experience, GI symptoms with GLP-1RAs are self-limiting and disappear over time, unlike the GI symptoms often observed with metformin. In elderly patients with severe anorexia with metformin monotherapy, monotherapy with a DPP-4 inhibitor is an important option.
Sulfonylureas may also be an option for patients who refuse incretin therapy, but their potential adverse effects on β-cells [61], elevated risk of hypoglycemia, tendency toward weight gain [3, 4], and limited effectiveness over time should be considered carefully [62]. Compared with sulfonylureas, monotherapy studies with incretin-based therapies demonstrate better safety, and in the case of GLP-1RAs, better efficacy [63, 64].
Similarly, the author tends to choose incretins over thiazolidinediones (TZDs) in many patients because of the potential adverse effects of TZDs, including weight gain, peripheral edema, and increased risk of congestive heart failure [3].
Anzeige
Incretins as Add-on Therapy
Use of incretins in dual therapy may be considered after lifestyle and drug monotherapy become insufficient and before β-cell function ceases and insulin therapy becomes the only option.
Incretin Plus Metformin Therapy
In head-to-head studies comparing GLP1-RAs with DPP-4 inhibitors, incretin-based therapies have demonstrated modest to robust effects on glycemic indices in patients on metformin, with greater reductions in FPG and A1C with GLP1-RAs, compared with DPP-4 inhibitors. For example, in a head-to-head comparison of EQW with sitagliptin, in which each was used as add-on therapy to metformin, A1C reduction was significantly greater with EQW, overall, as well as among patients with A1C levels ≥9% [19]. Similarly, in a head-to-head comparison of liraglutide and sitagliptin in patients with inadequate control on metformin, liraglutide was associated with significantly greater reductions in A1C, FPG, and body weight with a similar incidence of hypoglycemia [12, 13]. In both trials, nausea and vomiting were more common with GLP-1RAs than sitagliptin [12, 13, 19].
Two studies have also compared the efficacy of liraglutide to exenatide BID [22] and EQW [24] in patients inadequately controlled on metformin, sulfonylurea, or both (in the exenatide BID trial) or metformin, sulfonylurea, and/or pioglitazone (in the EQW trial). In the first trial, liraglutide provided significantly greater improvements in A1C (1.1% vs 0.8%, P < 0.0001) than EQW [22]. While both agents were well tolerated, nausea was less persistent and hypoglycemia less frequent with liraglutide than with exenatide BID. When compared with EQW, liraglutide was associated with greater reductions in A1C (1.48% vs 1.28%) and body weight (3.6 vs 2.7 kg); however, EQW was associated with less nausea and vomiting [24]. Reductions in systolic BP (SBP) were also similar between groups.
Blood pressure management is an important component of treatment in all patients with T2D [65]. Liraglutide, exenatide BID, EQW, and sitagliptin generally show similar reductions in SBP, while diastolic BP is not affected [12‐14, 22, 24, 25]. One study of EQW showed greater reduction in SBP compared with sitagliptin [19]. While BP reductions are generally beneficial and cardiovascular risk reduction is a priority in diabetes management, the author uses incretin therapies in their practice for their glycemic and weight effects and not their impact on BP.
Clinical Experience with Incretins as Add-on Therapy to Metformin
The use of incretin therapy as add-on therapy with metformin is recommended in treatment guidelines and it is the author’s primary intervention in most patients on metformin whose A1C is above their target goal [3, 4]. The greater A1C reduction and weight loss associated with GLP-1RAs make them my preferred incretin therapy in most patients. Most of the author’s patients lose approximately 3–4.5 kg on GLP-1RAs, but some may experience more dramatic weight reductions of up to 13–18 kg.
In fact, the need for weight loss may drive the choice of GLP1-RAs over DPP-4 inhibitors in some patients, and may persuade patients to choose injections over oral therapy. Moreover, DPP-4 inhibitors are postprandial modulators that may be less useful than longer-acting GLP1-RAs in patients with FPG >200 mg/dL. When the injection barrier is insurmountable, DPP-4 inhibitors can be prescribed; however, patients should be actively involved in the decision-making process. In nonobese patients requiring <1% reduction in A1C, a DPP-4 inhibitor can be used if the patient prefers. However, the author usually switches patients already on DPP-4 inhibitors to GLP-1RAs if they require an additional 0.5% A1C reduction.
Head-to-head clinical trials demonstrate that the more protracted agents have fewer GI symptoms, with exenatide BID causing the most GI symptoms, followed by liraglutide, and then EQW [22, 24, 25]. In the author’s experience, many patients who did not tolerate exenatide BID are able to successfully use liraglutide and EQW.
Before initiating any GLP-1RA, patients should be informed of the potential for GI AEs. To mitigate symptoms with exenatide and liraglutide, treatment should be initiated at a lower dose and titrated up to achieve maximal effect. For example, if patients experience nausea with liraglutide, the dose is increased only when the nausea is resolved. In the rare event that nausea remains an issue, the titration of the liraglutide dose can be slowed. This technique has been found to be effective, even though it is not specifically recommended in the labeling [7]. EQW is not usually titrated, but the author’s patients with nausea on exenatide BID do not use the 10-mcg dose until the nausea abates.
Incretin Plus Sulfonylurea Therapy
Both sulfonylureas and incretins stimulate release of insulin from pancreatic β-cells [34, 66]. Insulin release by sulfonylureas is glucose independent (primarily affects FPG) and increases the risk for hypoglycemia. Conversely, incretins stimulate insulin in a glucose-dependent manner, minimizing risk of hypoglycemia. Therefore, combining incretin therapy with a sulfonylurea potentially allows for lowering of the sulfonylurea dose and a possible reduction in the risk of hypoglycemia, while maintaining or increasing glycemic control [5‐7, 67]. While results from clinical trials indicate that adding an incretin to a sulfonylurea reduces A1C by 0.5–1.1% [64, 67, 68], there are few data on the comparative impact of incretin agents in patients inadequately controlled on sulfonylureas alone.
In patients already using sulfonylureas who need an A1C reduction of 1–1.5%, the dose of sulfonylurea should be reduced when DPP-4 inhibitors or GLP-1RAs are added. However, the current sulfonylurea dose should be maintained if an A1C reduction of >1.5% is needed. The author also asks patients receiving sulfonylurea therapy in combination with an incretin for an extra fingerstick glucose measurement before dinner.
Use of Incretins in Triple Therapy
While guidelines often recommend insulin therapy as the preferred option for patients inadequately controlled on metformin and an additional agent, many patients receive triple therapy at this stage, particularly if they are reluctant to initiate insulin.
Incretin Plus Metformin and Sulfonylurea
Although several studies have evaluated the use of incretin therapy in combination with metformin and a sulfonylurea, there have been no such head-to-head comparisons. In one study, liraglutide added to metformin and a sulfonylurea reduced A1C by 1.3% and decreased weight by 1.8 kg [69]. A similar study of exenatide BID reported a reduction in A1C of 1.0% and a weight loss of 2.5% [70]. In these trials, hypoglycemia was reported by 27% [69] of patients on liraglutide and 27% of patients on exenatide [70]. In a study evaluating sitagliptin in combination with metformin and a sulfonylurea, the combination reduced A1C by 0.9% but increased weight by 0.8 kg [71]. The incidence of hypoglycemia with the sitagliptin combination was 16.4%.
The combination of metformin, sulfonylurea, and a GLP-1RA is the author’s preferred noninsulin-based triple therapy, because this combination is effective in reducing A1C and FPG with few hypoglycemic events. To avoid hypoglycemia when using this combination, the sulfonylurea dose typically should be reduced when adding an incretin therapy.
Incretin Plus Metformin and TZD Therapy
Adding GLP-1RA to TZD therapy for patients inadequately controlled with TZD and metformin leads to complementary effects: an increase in β-cell insulin secretory function (GLP-1RAs), inhibition of glucose production by the liver (metformin), and an increase in glucose uptake by muscle (TZD), and consequently, improved glycemic control [72]. Combining incretins with TZDs may also mitigate the adverse effect of TZDs on weight. Data on the comparative use of incretin therapies with TZDs and metformin are limited. However, a study of liraglutide with metformin and a TZD reported a reduction in A1C of 1.5% with a reduction in weight of 1–2 kg and an incidence of hypoglycemia of 7.9–9.0% [73].
Incretin Plus Insulin Therapy
In many patients, addition of insulin to oral antidiabetic drugs (OADs) or GLP-1RAs is required to meet treatment goals. New studies demonstrate the utility of combining basal insulin with incretin therapies. When used in combination with GLP-1RAs or DPP-4 inhibitors, exogenous insulin is augmented with endogenous, glucose-dependent insulin secretion, allowing the body to compensate for increased carbohydrate intake without increasing the dose of exogenous insulin and, consequently, risk of hypoglycemia [28, 31‐33]. Complementary combination therapy can be accomplished by adding a short-acting incretin agent (exenatide) that primarily targets PPG to basal insulin that primarily targets FPG [29].
Longer-acting liraglutide in combination with basal insulin has also shown to improve glycemic indices. Liraglutide targets both FPG and PPG, without the increase in hypoglycemia or weight gain associated with increased insulin dosing. Addition of GLP-1RAs allows for lowering the basal insulin dose and may even eliminate the need for prandial insulin [15, 29]. In fact, insulin doses should be reduced when initiating GLP-1RAs in patients on insulin. With DPP-4 inhibitors, the basal insulin dose stays the same since FPG changes are minimal [31‐33]. Incretin therapies are useful in patients taking insulin, even if only to prevent the intensification of basal insulin regimens to multiple daily injections.
Long-term Safety of Incretin Therapies
Pancreatitis
Pancreatitis has been reported in post-marketing surveillance for both GLP-1RAs and DPP-4 inhibitors [74]. In patients with risk factors for pancreatitis, including gallstones, high triglycerides, or excessive alcohol intake, incretins should be used with caution. Liraglutide, exenatide BID, and EQW are not recommended in patients with a history of pancreatitis [5‐7]. Before initiating incretin therapy, the possible risk for pancreatitis with patients should be discussed. Patients should be advised to contact their health care provider immediately if they experience severe abdominal pain. While careful observation for signs and symptoms of pancreatitis is recommended following incretin initiation, the totality of clinical, preclinical, and post-marketing evidence does not clearly substantiate an association between incretin therapies and acute pancreatitis, although published opinions on this topic differ [75‐77]. The author has had no experience with pancreatitis in patients using incretin therapy. Moreover, experts convened by the National Institute of Diabetes and Digestive and Kidney Diseases in June 2013 concluded that there is likely no increased risk for pancreatic cancer associated with incretin therapies, although longer-term studies are needed [78].
Thyroid Neoplasm
Based on preclinical data, liraglutide and exenatide BID are absolutely contraindicated in patients with a personal or family history of medullary thyroid carcinoma and in patients with multiple endocrine neoplasia syndrome type 2 [6, 7]. Although rare (the author has seen medullary thyroid carcinoma three times in 25 years), the author recommends palpating the patient’s thyroid gland to examine for nodules before starting therapy.
Conclusion
Incretins play an important role in normal glucose homeostasis, and incretin therapies should be considered in combination treatment regimens for patients with T2D from early onset to late disease. The selection of a particular agent should be individualized and depends on patient characteristics, preferences, and treatment goals, as well as differences in overall clinical profiles among incretin agents.
In clinical trials and in my own clinical experience, GLP-1RAs have shown greater and sustained glycemic control compared with DPP-4 inhibitors, with the additional benefits of weight loss and reduced SBP. High patient satisfaction has been reported with GLP-1RAs despite the subcutaneous route of administration [38, 79‐81]. In combination therapy with insulin, GLP-1RAs lead to sustained glycemic control, along with reduced insulin doses without increase in hypoglycemia or weight gain.
As a whole, the incretin class of antidiabetes agents is very useful, and both DPP-4 inhibitors and GLP-1RAs have improved T2D management. Many patients now consider injectable therapy in view of the observed benefits of GLP-1RAs and those who succeed with this therapy are satisfied with the results.
Acknowledgments
The author wishes to thank Nicole Cooper and Heba Costandy of MedVal Scientific Information Services, LLC, for providing medical writing and editorial assistance. This manuscript was prepared according to the International Society for Medical Publication Professionals’ “Good Publication Practice for Communicating Company-Sponsored Medical Research: the GPP2 Guidelines”. Funding to support the preparation of this manuscript and article processing charges was provided by Novo Nordisk Inc. Dr. Tibaldi is the guarantor for this article and takes responsibility for the integrity of the work as a whole, from inception to published article.
Conflict of interest
The author is a consultant and speakers bureau member for Novo Nordisk; is a speakers bureau member for Daiichi and Merck; has received payment for lectures from Eli Lilly and sanofi-aventis; has participated in nonpromotional CME activities sponsored by Eli Lily, Novo Nordisk, and sanofi-aventis; and has received payment for the development of educational programs for Eli Lilly, Novo Nordisk, and sanofi-aventis. He has participated in 2 Pri-Med programs, 1 for Eli Lilly and 1 for Novo Nordisk, and has developed and presented continuing education programs for the American Association of Diabetes Educators, sponsored by sanofi-aventis. The author has indicated that he has no other conflicts of interest regarding the content of the article.
Compliance with ethics guidelines
The analysis in this article is based on previously conducted studies, and does not involve any new studies of human or animal subjects performed by the author.
Open Access
This article is distributed under the terms of the Creative Commons Attribution Noncommercial License which permits any noncommercial use, distribution, and reproduction in any medium, provided the original author(s) and the source are credited.
Open AccessThis article is distributed under the terms of the Creative Commons Attribution 2.0 International License (https://creativecommons.org/licenses/by/2.0), which permits unrestricted use, distribution, and reproduction in any medium, provided the original work is properly cited.
Mit e.Med Innere Medizin erhalten Sie Zugang zu CME-Fortbildungen des Fachgebietes Innere Medizin, den Premium-Inhalten der internistischen Fachzeitschriften, inklusive einer gedruckten internistischen Zeitschrift Ihrer Wahl.
Mit e.Med Allgemeinmedizin erhalten Sie Zugang zu allen CME-Fortbildungen und Premium-Inhalten der allgemeinmedizinischen Zeitschriften, inklusive einer gedruckten Allgemeinmedizin-Zeitschrift Ihrer Wahl.
Das Kombinationsregime BrECADD mit Brentuximab vedotin ermöglichte in der Studie HD21 beim fortgeschrittenen klassischen Hodgkin-Lymphom eine unerwartet hohe progressionsfreie Überlebensrate von 94,3% nach vier Jahren. Gleichzeitig war das Regime besser tolerabel als der bisherige Standard eBEACOPP.
Zwei Phase-3-Studien deuten auf erhebliche Vorteile des Antikörper-Wirkstoff-Konjugats Belantamab-Mafodotin bei vorbehandelten Personen mit Multiplem Myelom: Im Vergleich mit einer Standard-Tripeltherapie wurde das progressionsfreie Überleben teilweise mehr als verdoppelt.
Der Tyrosinkinasehemmer (TKI) Asciminib ist älteren Vertretern dieser Gruppe bei CML offenbar überlegen: Personen mit frisch diagnostizierter CML entwickelten damit in einer Phase-3-Studie häufiger eine gut molekulare Response, aber seltener ernste Nebenwirkungen.
Medikamente zur Bedarfstherapie bei hereditärem Angioödem sind bisher nur als Injektionen und Infusionen verfügbar. Der Arzneistoff Sebetralstat kann oral verabreicht werden und liefert vielversprechende Daten.
Update Innere Medizin
Bestellen Sie unseren Fach-Newsletter und bleiben Sie gut informiert.