Open Access
01.06.2019 | Original Research Article
Ustekinumab Safety in Psoriasis, Psoriatic Arthritis, and Crohn’s Disease: An Integrated Analysis of Phase II/III Clinical Development Programs
verfasst von:
Subrata Ghosh, Lianne S. Gensler, Zijiang Yang, Chris Gasink, Soumya D. Chakravarty, Kamyar Farahi, Paraneedharan Ramachandran, Elyssa Ott, Bruce E. Strober
Theoretical risks of biologic agents remain under study.
Objective
The aim of this study was to integrate 1-year safety data from 12 ustekinumab registrational trials.
Methods
Patients had moderate-to-severe plaque psoriasis, active psoriatic arthritis (PsA) (± methotrexate), or moderate-to-severe Crohn’s disease (CD; failed/intolerant of immunomodulators/corticosteroids). Psoriatic patients received subcutaneous ustekinumab 45/90 mg or placebo, generally at week 0, week 4, then every 12 weeks thereafter, while those with CD received a single intravenous ustekinumab dose (130 mg or weight range-based dosing of approximately 6 mg/kg) or placebo induction dose at week 0, followed by subcutaneous ustekinumab 90 mg at week 8 and every 8/12 weeks thereafter. The incidence rates of a priori-defined safety events were integrated post hoc (adjusted for duration of follow-up, reported per 100 patient-years [PYs]).
Results
Among 6280 enrolled patients, 5884 ustekinumab-treated patients (psoriasis: 3117; PsA: 1018; CD: 1749) contributed 4521 PYs versus 674 PYs in placebo-treated patients through year 1 (829 PYs and 385 PYs during 8- to 16-week controlled periods). Combined across diseases among ustekinumab- versus placebo-treated patients, respective incidences/100 PYs (95% confidence intervals) of infections were 125.4 (122.2–128.7) versus 129.4 (120.9–138.3) through year 1, and not meaningfully increased in patients who did versus those who did not receive methotrexate (92.5 [84.2–101.5] vs. 115.3 [109.9–121.0]), or significantly increased in patients who did versus those who did not receive corticosteroids (116.3 [107.3–125.9] vs. 107.3 [102.0–112.8]) at baseline. Major adverse cardiovascular events (0.5 [0.3–0.7] vs. 0.3 [0.0–1.1]), malignancies (0.4 [0.2–0.6] vs. 0.2 [0.0–0.8]), and deaths (0.1 [0.0–0.3] vs. 0.0 [0.0–0.4]) were rare across indications.
Conclusions
Ustekinumab demonstrated a favorable and consistent safety profile across registrational trials in approved indications.
When data from 12 registrational trials conducted in patients with psoriasis, psoriatic arthritis (PsA), and Crohn’s disease (CD) were combined, discontinuations due to adverse events (AEs) and incidences of AEs, serious AEs, and infections were consistent between ustekinumab- and placebo-treated patients through up to 1 year of follow-up.
Among ustekinumab-treated patients, incidences of major adverse cardiovascular events, malignancies, and deaths through 1 year were low (≤ 0.5/100 patient-years); the occurrence of infections through 1 year did not appear to be affected by baseline methotrexate or corticosteroid use.
In this integrated cohort of 5884 ustekinumab-treated patients, ustekinumab demonstrated a favorable integrated safety profile, consistent with previous safety observations from trials within each indication.
1 Introduction
Although biological therapies such as antagonists of tumor necrosis factor (TNF)-α or interleukins (IL)-12/23 generally offer improved efficacy over conventional immunosuppressants (IMMs) in treating immune-mediated inflammatory disorders, theoretical risks associated with impaired immune surveillance remain under study. Furthermore, patients with immune-mediated inflammatory disorders can present with comorbidities, including cardiovascular diseases, obesity, malignancy, and chronic infections, that should inform the decision to utilize a biologic agent [1, 2].
Anzeige
Ustekinumab is a fully human immunoglobulin G1k monoclonal antibody that specifically blocks the shared p40 subunit of IL-12 and IL-23 [3], naturally occurring regulatory cytokines involved in inflammatory and immune responses, natural killer cell activation, and signaling for downstream effector cytokine production (e.g. TNF, IL-17, IL-22) [4].
Multiple randomized controlled trials (RCTs) (Table 1) have established the efficacy of ustekinumab for moderate-to-severe psoriasis [5‐7], active psoriatic arthritis (PsA) [8‐10], and moderate-to-severe Crohn’s disease (CD) [11]. The safety of ustekinumab in psoriasis has been assessed through up to 5 years of continuous follow-up in two large RCT extensions and up to 8 years in the Psoriasis Longitudinal and Assessment Registry (PSOLAR) of > 12,000 psoriasis patients (35.7% with self-reported PsA) [12‐18]. No increased risk of malignancies, serious major adverse cardiovascular events (MACEs), serious infections (SIs), or mortality has been observed across RCT- or registry-derived analyses. These longer-term data are consistent with safety findings from psoriasis registrational trials [5‐7] and additional registries conducted in psoriatic patients [19, 20]. Consistent ustekinumab safety was observed in two pivotal PsA RCTs, one with a long-term extension through up to 2 years (PSUMMIT-1) [8‐10]. While preliminary safety findings in CD patients also show similarities through 1 versus 2 years of ustekinumab, data are limited [11, 21, 22].
Table 1
Overview of RCTs included in integrated ustekinumab safety analyses
Study phase/identifier (dates)
Treatment groups/numbers of patients
Moderate-to-severe plaque psoriasis (no concomitant CSs/IMMs)
Placebo SC (weeks 0 and 4) → ustekinumab 45 mg SC—weeks 12 and 16 then q12w (n = 123)
Placebo SC (weeks 0 and 4) → ustekinumab 90 mg SC—weeks 12 and 16 then q12w (n = 120)
Ustekinumab 45 mg SC—weeks 0 and 4 then q12w (n = 255)
Ustekinumab 90 mg SC—weeks 0 and 4 then q12w (n = 256)
At week 28, PASI75 responders continued 45 or 90 mg, q12w; PASI50–75 partial responders switched to 45 or 90 mg q8w
At week 40, PASI75 responders initially randomized to ustekinumab were re-randomized to placebo or 45/90 mg q12w; PASI75 responders initially randomized to placebo withdrew from treatment; PASI75 partial responders initially randomized to placebo switched from q12w → q8w dosing
Placebo SC (weeks 0 and 4) → ustekinumab 45 mg SC—weeks 12 and 16 then q12w (n = 197)
Placebo SC (weeks 0 and 4) → ustekinumab 90 mg SC—weeks 12 and 16 then q12w (n = 195)
Ustekinumab 45 mg SC—weeks 0 and 4 then q12w (n = 409)
Ustekinumab 90 mg SC—weeks 0 and 4 then q12w (n = 411)
At week 28, PASI50–75 partial responders were randomized to maintain their originally assigned dose (45 or 90 mg) at q12w intervals or dose-adjusted to q8w
Non-randomized patients (n = 113): placebo—weeks 8 and 16 (responders to placebo IV induction, n = 28); Ustekinumab 270 mg SC—week 8, and 90 mg SC—week 16 (non-responders to placebo IV induction, n = 85)
Patients who did not respond initially, responded initially but then lost response, or were intolerant of prior infliximab, adalimumab, or certolizumab pegol
Single IV induction dose at week 0 (n = 741; 769 totalc): placebo (n = 247); ustekinumab 130 mg (n = 245); tiered (weight-based) ustekinumab doses approximately 6 mg/kg (n = 249)
Patients who did not respond initially, responded initially but then lost response, or were intolerant of prior infliximab, adalimumab, or certolizumab pegol
Patients had active inflammation and demonstration of inadequate response to, or failure to tolerate, CSs/IMMs; patients with CS dependence and who received but did not fail a TNF antagonist were allowed
Patients from both phase III induction studies could continue into this maintenance study, with the primary population comprising responders to IV ustekinumab induction therapy
CD Crohn’s disease, CSs corticosteroids, IMMs immunomodulators, IV intravenous, MTX methotrexate, PASI Psoriasis Area and Severity Index, PGA Physician’s Global Assessment, q8/12w every 8/12 weeks, RCT randomized controlled trial, SC subcutaneous, TNF tumor necrosis factor
aAt week 20, patients in the placebo group received a single dose of ustekinumab 90 mg SC
bTreatment after week 12 depended on PGA response at week 12 and initial treatment assignment (etanercept non-responders received ustekinumab 90 mg, ustekinumab non-responders received an additional ustekinumab dose at week 16, all responders had treatment interrupted followed by ustekinumab re-treatment if psoriasis recurred). Etanercept patients were not included in these analyses through week 12
c28 patients who received a previous IV formulation were excluded from the efficacy analyses and some safety analyses of the individual studies but were included in these integrated safety analyses
d12 patients who received a previous IV formulation were excluded from the efficacy analyses and some safety analyses of the individual studies but were included in these integrated safety analyses
eThose continuing placebo 16 weeks after IV ustekinumab induction were subsequently included in the placebo group for the 1-year analyses (unless/until they met loss of response criteria and crossed back to ustekinumab [38% of the 133 patients])
We conducted this first integrated analysis of ustekinumab safety data from 12 registrational RCTs to better understand the overall safety profile of ustekinumab, given that diverse disease states in heterogeneous populations receiving different dosing regimens and concomitant medications may carry differing risks of adverse reactions, and considering that rare safety events may only be identified as larger safety databases become available. When combined across the approved psoriasis, PsA, and CD indications, approximately 70% and 36% of the 5884 patients receiving ustekinumab were treated for ≥ 6 months and ≥ 1 year, respectively.
2 Patients and Methods
2.1 Trial Designs
Details of the 12 randomized, placebo- or active comparator-controlled trials comprising the ustekinumab phase II/III registrational development program for psoriasis [5‐7, 23], PsA [8, 9, 24], and CD [11, 21, 22] have been reported (ClinicalTrials.gov identifier: NCT00320216, NCT00267969, NCT00307437, NCT00454584, NCT00267956, NCT01009086, NCT01077362, NCT00265122, NCT00771667, NCT01369329, NCT01369342, and NCT01369355) (Table 1).
Anzeige
Trials conducted in patients with chronic moderate-to-severe psoriasis (Psoriasis Area and Severity Index [PASI] score ≥ 12; psoriasis involving ≥ 10% of body surface area) include a phase II trial (NCT00320216) in which patients received a single dose or four weekly doses of ustekinumab 45 or 90 mg by subcutaneous injection, and three phase III trials (PHOENIX-1 [NCT00267969], PHOENIX-2 [NCT00307437], and ACCEPT [NCT00454584]) in which patients received ustekinumab 45 or 90 mg by subcutaneous injection at week 0, week 4, and then generally every 12 weeks. PHOENIX-1 had a randomized withdrawal and re-treatment phase, some patients in PHOENIX-2 later received every-8-weeks dosing, and further dosing in ACCEPT depended on response at week 12. Because etanercept was the comparator in the controlled period of ACCEPT, only ustekinumab-treated, but not etanercept-treated, patients from ACCEPT were included in these analyses (Table 1). Participants could not receive concomitant oral IMMs or oral corticosteroids (CSs) during the psoriasis studies. Prior treatment with certain biologics, with appropriate washout, was permitted (Tables 1 and 2).
Table 2
Summary of baseline demographics, medical history, and concomitant medications and extent of exposure
Psoriasis
PsA
CD
All patients
Number of randomized patients, Na
3219
1073
1988
6280
Baseline demographics
Age, years [mean (SD)]
45.6 (12.37)
47.6 (11.87)
38.6 (12.73)
43.7 (12.90)
Male [n (%)]
2207 (68.6)
560 (52.2)
871 (43.8)
3638 (57.9)
White [n (%)]
2960 (92.0)
1038 (96.8)
1729 (87.0)
5727 (91.2)
Weight, kg [mean (SD)]
91.8 (22.15)
89.4 (21.07)
72.2 (19.64)
85.2 (22.99)
BMI, kg/m2 [mean (SD)]
30.9 (6.99)
31.0 (7.13)
25.0 (6.22)
29.0 (7.32)
Medical history and current diagnoses,b[% (n/N)]
Congestive heart failurec [% (n/N)]
0.2 (5/2899)
1.1 (12/1073)
0.4 (7/1935)
0.4 (24/5907)
Peripheral vascular diseasec [% (n/N)]
1.2 (35/2899)
3.4 (36/1073)
1.5 (29/1935)
1.7 (100/5907)
Transient ischemic attackc [% (n/N)]
0.8 (24/2899)
1.0 (11/1073)
0.8 (15/1935)
0.8 (50/5907)
Strokec [% (n/N)]
0.6 (17/2899)
1.4 (15/1073)
0.7 (14/1935)
0.8 (46/5907)
Ischemic heart/coronary artery disease [% (n/N)]
3.9 (125/3219)
5.7 (61/1073)
2.3 (44/1935)
3.7 (230/6227)
Hyperlipidemia [% (n/N)]
20.2 (649/3219)
17.6 (189/1073)
5.8 (113/1935)
15.3 (951/6227)
Hypertension [% (n/N)]
27.5 (886/3219)
38.1 (409/1073)
13.6 (264/1935)
25.0 (1559/6227)
Diabetes mellitus [% (n/N)]
10.6 (342/3219)
12.0 (129/1073)
3.2 (61/1935)
8.5 (532/6227)
Family history of early coronary artery diseasec [% (n/N)]
11.7 (340/2899)
8.7 (93/1073)
7.3 (142/1935)
9.7 (575/5907)
Current smokingc [% (n/N)]
33.2 (963/2899)
21.4 (230/1073)
24.7 (491/1988)
28.3 (1684/5960)
Prior biologic treatmentc [% (n/N)]
33.1 (961/2899)
20.5 (220/1073)
77.5 (1499/1935)
45.4 (2680/5907)
Baseline concomitant therapies [n(%)]d
Corticosteroids
–
146 (13.6)
728 (36.6)
874 (13.9)
Immunomodulators
–
482 (44.9)
605 (30.4)
1087 (17.3)
6-MP/AZAe
–
–
456 (22.9)
456 (7.3)
Methotrexate
–
482 (44.9)
155 (7.8)
637 (10.1)
Corticosteroids + immunomodulators [n (%)]
–
100 (9.3)
201 (10.1)
301 (4.8)
Extent of ustekinumab exposuref
Ustekinumab-treated patients (N)g
3117
1018
1749
5884
Ustekinumab exposure [n (%)]
Single IVh
0
0
1664 (95.1)
–
At least 6 monthsi
2413 (77.4)
842 (82.7)
849 (48.5)
–
At least 1 yearj
1142 (36.6)
527 (51.8)
464 (26.5)
–
Mean weeks of treatment
26.5
27.7
19.5k
24.6
Total dose, mg [mean (SD)]
270.4 (122.38)
264.5 (126.34)
432.1 (243.86)
317.4 (184.2)
6-MP 6-mercaptopurine, AZA azathioprine, BMI body mass index, CD Crohn’s disease, IV intravenous, PsA psoriatic arthritis, SD standard deviation
aPsoriasis: phase II, PHOENIX-1, PHOENIX-2, ACCEPT (immunomodulators and corticosteroids prohibited); PsA: phase II, PSUMMIT-1, PSUMMIT-2; CD: phase IIa (only placebo-controlled IV population), CERTIFI, UNITI-1, UNITI-2, IM-UNITI
bNot collected in CERTIFI (smoking information was collected)
cNot collected in the psoriasis phase II trial
dCorticosteroids and immunomodulators are prohibited medications for psoriasis
eNot collected in PsA studies
fCrossover patients were included in the ustekinumab columns after crossover to ustekinumab
gPsoriasis—phase II, PHOENIX-1, PHOENIX-2, ACCEPT (all through week 52); PsA—phase II (through week 36), PSUMMIT-1 (through week 52), PSUMMIT-2 (through week 60); CD—phase IIa (only placebo-controlled IV population in population 1; through week 28), CERTIFI (through week 36), UNITI-1 and UNITI-2 (through week 8 for patients who entered IM-UNITI; through week 20 for patients who did not enter IM-UNITI), IM-UNITI (through week 44)
hOnly for CD studies
iThe duration between the first and last ustekinumab administrations was ≥ 14 weeks
jThe duration between the first and last ustekinumab administrations was ≥ 38 weeks
kIncludes periods of placebo treatment among some ustekinumab responders who were re-randomized to placebo at maintenance and subsequently resumed ustekinumab treatment following loss of response
In patients with PsA, one phase II trial (NCT00267956) and two phase III trials (PSUMMIT-1 [NCT01009086] and PSUMMIT-2 [NCT01077362]) included patients with active disease for ≥ 6 months and an inadequate response or intolerance to previous or current IMMs and/or non-steroidal anti-inflammatory drugs. Patients could receive concomitant therapy with stable regimens of methotrexate (approximately 45% of patients) or CSs (approximately 14% of patients). PSUMMIT-1 excluded patients who had previously received anti-TNF agents, while the phase II and PSUMMIT-2 trials allowed enrollment of up to 25% and 50–60%, respectively, of patients previously treated with one or more anti-TNF agents. Phase III trials evaluated ustekinumab 45 and 90 mg administered by subcutaneous injection at week 0, week 4, and then every 12 weeks (Table 1).
Patients with CD were evaluated in a phase IIa proof-of-concept trial (NCT00265122), a phase IIb dose-ranging trial (CERTIFI [NCT00771667]), two phase III induction trials (UNITI-1 [NCT01369329], UNITI-2 [NCT01369342]), and a phase III randomized withdrawal maintenance trial (IM-UNITI [NCT01369355]). In the phase III induction trials, patients received a single intravenous induction dose of ustekinumab (130 mg or weight-range-based dosing of approximately 6 mg/kg) or placebo at week 0, followed by a 90 mg subcutaneous dose administered at week 8 and then every 8 or every 12 weeks thereafter. Patients evaluated in the CD trials included those who did not respond initially, responded initially but then lost response, and/or were intolerant to prior anti-TNF, IMM or CS treatment(s). Stable regimens of concomitant oral IMMs (approximately 30% of patients), CSs (approximately 37% of patients), or both (approximately 10% of patients) were permitted during study participation. Prior treatment with anti-TNF or other biologics, with appropriate washout, was also permitted (Tables 1 and 2).
Across indications, patients underwent radiographic, purified protein derivative, and/or interferon-γ release assay Mycobacterium tuberculosis (TB) screening. In most studies, patients with latent TB could be enrolled with initiation of established concomitant treatment protocols (e.g., isoniazid). While some of the study populations were anti-TNF-naïve and others were anti-TNF failures as noted above, concomitant anti-TNF use was prohibited, with protocol-specified prescreening washout periods (also see Table 1).
2.2 Safety Outcomes
All adverse events (AEs) were systematically captured throughout each trial, with safety monitoring through 16–20 weeks after study agent discontinuation, i.e., follow-up periods were substantially longer than treatment duration. Analyses included standard evaluations of AEs, serious AEs, AEs leading to study agent discontinuation, deaths, infections (determined by investigator), SIs, infections requiring treatment with oral/parenteral antibiotics, injection-site reactions (ISRs) documented by the investigator, AEs temporally related to infusions (in CD patients), and clinical laboratory parameters per prespecified criteria. AEs of special interest, i.e., rare events selected for evaluation based on mechanistic plausibility or potential safety or population risks, included malignancies, adjudicated serious MACEs, anaphylactic and serum sickness-like hypersensitivity reactions, active TB, opportunistic infections (OIs), and serious neurological disorders.
All preferred terms possibly consistent with serious MACEs (cardiovascular death, non-fatal myocardial infarction, and non-fatal stroke) were retrospectively adjudicated by an independent and blinded process, performed by the Cleveland Clinic Coordinating Center for Clinical Research (C5) at the Cleveland Clinic Foundation (http://c5research.clevelandclinic.org/Home.aspx). Analyses were based on adjudicated events. For hypersensitivity reactions, the terms anaphylactic reaction, anaphylactic shock, anaphylactoid reaction, anaphylactoid shock, type I hypersensitivity, and serum sickness or serum sickness-like reaction were utilized.
2.3 Data Analysis
Integrated safety data are presented for both the initial controlled period and through approximately 1 year of exposure for studies conducted within each indication and combined across indications. After the 8- to 16-week controlled periods, some participants crossed over to ustekinumab per trial design; thus, patients may have been included in more than one treatment group for the 1-year analyses. Patients receiving one or more partial or full ustekinumab doses were subsequently included in the ustekinumab groups, except responders to ustekinumab induction who were subsequently re-randomized to subcutaneous placebo in the randomized withdrawal IM-UNITI CD maintenance study. These patients were included in the placebo group starting at 16 weeks (i.e., more than five half-lives) following induction dosing in subsequent analyses.
Specific AEs were summarized by system organ class and preferred term (Medical Dictionary for Regulatory Activities [MedDRA], version 17.1), according to actual treatment received. AE incidence rates are reported per 100 patient-years (PYs) to adjust for differences in follow-up duration (referred to as ‘incidence/100 PYs’).
Anzeige
For malignancies, comparisons with an external database were conducted to determine whether event rates combined across indications were consistent with those expected for the general population. The National Institutes of Health Surveillance, Epidemiology, and End Results (SEER) database (2000–2010; https://seer.cancer.gov/resources) was selected to estimate expected event rates of malignancies, other than non-melanoma skin cancer (NMSC), in the general US population adjusting for age, sex, and race. Cervical cancers in situ and NMSC are not included in the SEER database and were thus excluded from enumeration. Standardized incidence ratios (SIRs) were calculated as the ratio of observed versus expected numbers of patients with one or more malignancies. When the SIR and the lower boundary of the surrounding 95% confidence interval (CI) exceed 1, the observed number of cases is statistically significantly higher than expected.
3 Results
3.1 Baseline Patient Demographics, Medical History, Concomitant Medications
Among 6280 patients enrolled into 12 RCTs, including 3117 patients with psoriasis, 1018 patients with PsA, and 1749 patients with CD, most were White (91.2%), 57.9% were males, and the mean age was 43.7 years (Table 2). Overall, 93.7% of enrolled patients received one or more ustekinumab doses.
Per the PsA and CD trial designs, concomitant oral IMMs (PsA: methotrexate only; CD: azathioprine, 6-mercaptopurine, methotrexate) and CSs were permitted. Given the disparate approaches to conventional treatment, anticipated differences between indications were observed in commonly used IMMs and overall CS use. Several trials enrolled biologic-experienced patients (which typically required a 3-month washout) (Table 1), comprising 45.4% of integrated patients (psoriasis: 33.1%; PsA: 20.5%; CD: 77.5%) (Table 2).
Placebo- and ustekinumab-treated patients contributed 385 PYs and 829 PYs of follow-up, respectively, during the initial 8- to 16-week controlled periods, and 674 PYs and 4521 PYs of follow-up, respectively, through to year 1. Also through year 1, respective mean durations of follow-up were 17 and 40 weeks (Table 3). Among the 5884 ustekinumab-treated patients, mean duration of therapy was 24.6 weeks (171 days). Additionally, among psoriasis, PsA, and CD patients, mean therapy duration was 26.5, 27.7, and 19.5 weeks, respectively, and 36.6%, 51.8%, and 26.5% of patients, respectively, received ≥ 1 year of ustekinumab treatment (Table 2). Most patients with psoriasis received subcutaneous ustekinumab (45/90 mg at week 0, week 4, and every 12 weeks) for ≥ 6 months and often for ≥ 1 year. Most CD patients received a single intravenous infusion of ustekinumab (130 mg or weight range-based dosing of approximately 6 mg/kg), with nearly half of the patients subsequently receiving maintenance subcutaneous ustekinumab (90 mg every 8 weeks/every 12 weeks). The overall cumulative average ustekinumab dose across indications was 317.4 mg (Table 2).
Table 3
Key safety events/100 PYs of follow-up during the initial placebo-controlled portions and through year 1 of psoriasis, PsA, and CD studies
Placebo-controlled periods
Psoriasis (0–12 weeks)a
PsA (0–16 weeks)a
CD (0–8 weeks)a
All patients
Placebo
Ustekinumab
Placebo
Ustekinumab
Placebo
Ustekinumab
Placebo
Ustekinumab
Number of patients treated
732
1582
379
692
624
1362
1735
3636
Mean weeks of follow-up
12.57
13.37
15.14
15.70
8.15
8.16
11.54
11.86
Mean number of administrationsb
2.21
2.12
2.29
2.20
1.00
1.00
1.79
1.72
D/C study drug due to AEs [n (%)]
17 (2.3)
24 (1.5)
15 (4.0)
8 (1.2)
27 (4.3)
26 (1.9)
59 (3.4)
58 (1.6)
PYs of follow-up
177
407
110
209
98
214
385
829
Event rate/100 PYs
AEs
415.5
511.3
352.4
382.4
1040.4
959.4
556.1
594.3
95% CIc
386.0–446.7
489.5–533.7
318.3–389.3
356.4–409.9
977.5–1106.4
918.3–1001.9
532.8–580.1
577.9–611.2
SAEs
6.8
7.9
12.7
6.2
50.1
42.6
19.5
16.4
95% CIc
3.5–11.9
5.4–11.1
6.9–21.3
3.3–10.6
37.1–66.3
34.3–52.3
15.3–24.4
13.8–19.4
Infectionsd
122.1
141.4
112.3
100.5
187.2
168.4
135.8
138.1
95% CIc
106.4–139.5
130.1–153.5
93.4–134.0
87.4–115.1
161.1–216.4
151.5–186.7
124.4–148.0
130.2–146.3
Serious infectionsd
1.6
1.2
0.9
0.0
7.2
10.3
2.9
3.3
95% CIc
0.4–5.0
0.4–2.9
0.0–5.1
0.0–1.4
2.9–14.8
6.5–15.6
1.4–5.1
2.2–4.7
Adjudicated serious MACE
0.0
1.2
0.9
0.0
0.0
0.0
0.3
0.6
95% CIc
0.0–1.7
0.4–2.9
0.0–5.1
0.0–1.4
0.0–3.1
0.0–1.4
0.0–1.5
0.2–1.4
Deaths
0.0
0.3
0.0
0.0
0.0
0.0
0.0
0.1
95% CIc
0.0–1.7
0.0–1.4
0.0–2.7
0.0–1.4
0.0–3.1
0.0–1.4
0.0–0.8
0.0–0.7
Malignancies
(excluding NMSC)
0.6
0.3
0.0
0.0
0.0
0.0
0.3
0.1
95% CIc
0.0–3.2
0.0–1.4
0.0–2.7
0.0–1.4
0.0–3.1
0.0–1.4
0.0–1.5
0.0–0.7
Through approximately year 1e
Psoriasis
PsA
CD
All patients
Placebof
Ustekinumabg
Placeboh
Ustekinumabi
Placeboj
Ustekinumabk
Placebo
Ustekinumab
Number of patients treated
733
3117
379
1018
943
1749
2055
5884
Mean weeks of follow-up
12.93
42.80
19.90
43.40
19.12
32.89
17.05
39.96
Mean weeks of treatment
4.90
26.49
11.96
27.66
9.87
18.80 l
8.41
24.41
D/C study drug due AEs [n (%)]
17 (2.3)
86 (2.8)
22 (5.8)
31 (3.0)
(4.8)
108 (6.2)
84 (4.1)
225 (3.8)
PYs of follow-up
182
2,566
145
850
347
1,106
674
4,521
Event rate/100 PYs
AEs
414.8
390.6
343.4
254.2
712.2
641.6
552.4
426.4
95% CIc
385.8–445.5
383.0–398.3
313.9–374.9
243.6–265.2
684.3–740.8
626.8–656.7
534.8–570.4
420.4–432.5
SAEs
8.8
8.8
13.8
9.3
43.8
35.4
27.9
15.4
95% CIc
5.0–14.3
7.7–10.0
8.4–21.3
7.4–11.6
37.2–51.4
31.9–39.0
24.1–32.2
14.3–16.6
Infectionsd
120.7
137.4
102.8
78.0
145.1
134.0
129.4
125.4
95% CIc
105.3–137.8
132.9–142.0
86.9–120.6
72.2–84.2
132.7–158.3
127.3–141.0
120.9–138.3
122.2–128.7
Serious infectionsd
1.6
1.4
0.7
0.9
6.9
6.4
4.2
2.5
95% CIc
0.3–4.8
1.0–1.9
0.0–3.8
0.4–1.9
4.4–10.3
5.0–8.1
2.8–6.0
2.1–3.1
Adjudicated serious MACE
0.6
0.6
0.7
0.7
0.0
0.1
0.3
0.5
95% CIc
0.0–3.1
0.3–0.9
0.0–3.8
0.3–1.5
0.0–0.9
0.0–0.5
0.0–1.1
0.3–0.7
Deaths
0.0
0.2
0.0
0.0
0.0
0.0
0.0
0.1
95% CIc
0.0–1.6
0.1–0.5
0.0–2.1
0.0–0.4
0.0–0.9
0.0–0.3
0.0–0.4
0.0–0.3
Malignancies (excluding NMSC)
0.6
0.4
0.0
0.1
0.0
0.4
0.2
0.4
95% CIc
0.0–3.1
0.2–0.8
0.0–2.1
0.0–0.7
0.0–0.9
0.1–0.9
0.0–0.8
0.2–0.6
AEs adverse events, CD Crohn’s disease, CI confidence interval, D/C discontinuation, IV intravenous, MACE major adverse cardiovascular event, NMSC non-melanoma skin cancer, PsA psoriatic arthritis, PYs patient-years, SAE serious adverse event, SC subcutaneous
aPsoriasis—phase II, PHOENIX-1, PHOENIX-2; PsA—phase II, PSUMMIT-1, PSUMMIT-2; CD—phase IIa (only placebo-controlled IV population), CERTIFI, UNITI-1, UNITI-2
bSC administration in psoriasis and PsA trials; IV administration in CD trials
cCIs based on an exact method assuming the observed number of events follows a Poisson distribution
dInfection as assessed by the investigator
ePsoriasis—phase II, PHOENIX-1, PHOENIX-2, ACCEPT (all through week 52); PsA—phase II (through week 36), PSUMMIT-1 (through week 52), PSUMMIT-2 (through week 60); CD—phase IIa (only placebo-controlled IV population in population 1; through week 28), CERTIFI (through week 36), UNITI-1 and UNITI-2 (through week 8 for patients who entered IM-UNITI; through week 20 for patients who did not enter IM-UNITI), IM-UNITI (through week 44)
fIncludes data up to the time of crossover, and does not include etanercept patients in ACCEPT
gIncludes data from the first ustekinumab dose onward for patients who crossed over from placebo
hIncludes data up to the time of early escape or crossover
iIncludes data from the first ustekinumab dose onward for patients who escaped early or crossed over from placebo
jIncludes data up to the first ustekinumab dose for patients who were initially treated with placebo; includes data on or after 16 weeks from the first (and last) ustekinumab dose for patients who were initially treated with ustekinumab and were then crossed over or re-randomized to placebo
kIncludes data up to 16 weeks from the first ustekinumab dose for patients who were crossed over or re-randomized to placebo
lExcludes periods of placebo treatment among some ustekinumab responders who were re-randomized to placebo at maintenance and subsequently resumed ustekinumab treatment following loss of response
Anzeige
3.2 Adverse Events (AEs)/Serious AEs, Including Infections, and AEs Leading to Study Drug Discontinuation
3.2.1 Initial Controlled Period
Combined across indications, 1.6% and 3.4% of ustekinumab- and placebo-treated patients, respectively, discontinued study drug due to AEs. Among all patients, incidences/100 PYs (95% CIs) of AEs, SAEs, infections, and SIs were comparable between the ustekinumab (594.3 [577.9–611.2], 16.4 [13.8–19.4], 138.1 [130.2–146.3], and 3.3 [2.2–4.7], respectively) and placebo (556.1 [532.8–580.1], 19.5 [15.3–24.4], 135.8 [124.4–148.0], and 2.9 [1.4–5.1], respectively) groups. Incidences/100 PYs of these events appeared higher in CD than psoriasis/PsA patients, regardless of treatment, but were comparable between the ustekinumab and placebo groups within each indication and across indications combined (Table 3).
3.2.2 Year 1 Analyses
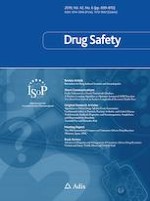
Combined across indications, proportions of patients discontinuing study drug due to AEs and incidences/100 PYs of AEs, SAEs, infections, and SIs were comparable between ustekinumab- and placebo-treated patients through year 1. In particular, the respective incidences/100 PYs (95% CIs) of infections were 125.4 (122.2–128.7) versus 129.4 (120.9–138.3). Consistent with initial controlled periods, year 1 incidences/100 PYs of these events appeared higher among CD patients, regardless of treatment, than psoriasis/PsA patients (Table 3, Fig. 1). However, incidences were comparable between the ustekinumab- and placebo-treated CD patients, with no apparent dose effect (Table 4), suggesting that the higher rates were related to underlying moderately-to-severely active CD.
Fig. 1
Incidence rates/100 PYs of AEs, SAEs, and infections among ustekinumab- and placebo-treated patients through up to year 1 in phase II/III studies of a psoriasis, b psoriatic arthritis, c Crohn’s disease, and d combined across all indications. PYs patient-years, AEs adverse events, SAEs serious adverse events
Table 4
Key safety findings by dose among randomized and treated CD patients
Through week 8 of UNITI-1 and UNITI-2
Through week 44 or time of dose adjustment in IM-UNITI
Ustekinumab
Ustekinumabb
Placebo
130 mg IV
6 mg/kg IV
Combined
Placebo SCa,b
90 mg SC q12w
90 mg SC q8w
Combined
Number of patients randomized and treated
466
471
470
941
133
132
131
263
Mean weeks of follow-up
8.18
8.22
8.16
8.19
32.0
36.6
35.2
35.9
Number (%) of patients with:
AEs
282 (60.5)
275 (58.4)
284 (60.4)
559 (59.4)
111 (83.5)
106 (80.3)
107 (81.7)
213 (81.0)
SAEs
28 (6.0)
23 (4.9)
25 (5.3)
48 (5.1)
20 (15.0)
16 (12.1)
13 (9.9)
29 (11.0)
Infectionsc
108 (23.2)
92 (19.5)
111 (23.6)
203 (21.6)
66 (49.6)
61 (46.2)
63 (48.1)
124 (47.1)
Serious infectionsc
6 (1.3)
7 (1.5)
8 (1.7)
15 (1.6)
3 (2.3)
7 (5.3)
3 (2.3)
10 (3.8)
D/C study drug due to AEs
19 (4.1)
8 (1.7)
8 (1.7)
16 (1.7)
8 (6.0)
10 (7.6)
4 (3.1)
14 (5.3)
q8w every 8 weeks, q12w every 12 weeks, AEs adverse events, CD Crohn’s disease, D/C discontinuation, IV intravenous, SAEs serious adverse events, SC subcutaneous
aPatients who were in clinical response to ustekinumab IV induction dosing and were randomized to placebo SC on entry into the maintenance study
bIncludes data up to the time of dose adjustment (i.e., time of meeting loss-of-response criteria)
cInfection as assessed by the investigator
×
3.2.3 Baseline Medications
Overall, no trends were apparent in the proportions of patients with AEs, SAEs, or infections, or patients who discontinued study drug due to AEs, when evaluated by baseline IMM use in the PsA or CD studies where they were permitted. Among ustekinumab-treated patients, the infection incidence/100 PYs (95% CI) through year 1 was not meaningfully increased among patients who did versus those who did not receive methotrexate at baseline (92.5 [84.2–101.5] vs. 115.3 [109.9–121.0], respectively), nor were they significantly increased among patients who did versus those who did not receive CSs at baseline (116.3 [107.3–125.9] vs. 107.3 [102.0–112.8], respectively). Few patients had SIs or discontinued study drug due to AEs, limiting interpretation of these less common events (Table 5).
Table 5
Key safety events/100 PYS of follow-up through year 1 in PsA and CD studies, by baseline MTX and CS use
PsA
CD
PsA and CD combined
Placeboa
Ustekinumabb
Placeboc
Ustekinumabd
Placebo
Ustekinumab
+MTX
−MTX
+MTX
−MTX
+MTX
−MTX
+MTX
−MTX
+MTX
−MTX
+MTX
−MTX
Number of patients treated
160
219
465
553
76
867
139
1610
236
1086
604
2163
Mean weeks of follow-up
20.78
19.25
44.28
42.65
17.16
19.29
33.36
32.84
19.62
19.28
41.77
35.35
Mean weeks of treatment
13.93
10.51
29.32
26.25
7.23
10.08
19.67
18.72
12.02
10.18
27.10
20.65
D/C study drug due to AEs [n (%)]
8 (5.0)
14 (6.4)
16 (3.4)
15 (2.7)
3 (3.9)
42 (4.8)
9 (6.5)
99 (6.1)
11 (4.7)
56 (5.2)
25 (4.1)
114 (5.3)
PYs of follow-up
64
81
396
454
25
322
89
1017
89
403
485
1470
Event rate/100 PYS
AEs
381.5
313.3
255.6
253.1
849.5
701.5
647.0
641.2
513.3
632.3
327.5
521.5
95% CIe
335.2–432.5
276.0–354.3
240.1–271.8
238.7–268.2
739.2–971.5
672.8–731.0
595.2–702.0
625.7–656.9
467.3–562.6
599.2–648.2
311.6–344.0
509.9–533.3
SAEs
20.3
8.6
6.8
11.5
79.8
41.0
40.4
34.9
37.1
34.5
13.0
27.7
95% CIe
10.8–34.8
3.5–17.8
4.5–9.9
8.6–15.0
48.7–123.2
34.3–48.7
28.3–55.9
31.4–38.7
25.5–52.1
29.0–40.8
10.0–16.6
25.1–30.5
Infectionsf
104.8
101.2
82.3
74.3
139.6
145.5
137.9
133.6
114.6
136.6
92.5
115.3
95% CIe
81.2–133.1
80.5–125.6
73.6–91.8
66.6–82.7
97.2–194.1
132.6–159.3
114.6–164.6
126.6–140.9
93.4–139.1
125.4–148.5
84.2–101.5
109.9–121.0
Serious infectionsf
1.6
0.0
0.0
1.8
16.0
6.2
13.5
5.8
5.6
5.0
2.5
4.6
95% CIh
0.0–8.7
0.0–3.7
0.0–0.8
0.8–3.5.5
4.4–40.9
3.8–9.6
7.0–23.5
4.4–7.5
1.8–13.1
3.0–7.7
1.3–4.3
3.5–5.8
Adjudicated serious MACE
0.0
1.2
0.3
1.1
0.0
0.0
0.0
0.1
0.0
0.3
0.2
0.4
95% CIe
0.0–4.7
0.0–6.9
0.0–1.4
0.4–2.6
0.0–12.0
0.0–0.9
0.0–3.4
0.0–0.6
0.0–3.4
0.0–1.4
0.0–1.2
0.2–0.9
Deaths
0.0
0.0
0.0
0.0
0.0
0.0
0.0
0.0
0.0
0.0
0.0
0.0
95% CIe
0.0–4.7
0.0–3.7
0.0–0.8
0.0–0.7
0.0–12.0
0.0–0.9
0.0–3.4
0.0–0.3
0.0–3.4
0.0–0.7
0.0–0.6
0.0–0.2
Malignancies (excluding NMSC)
0.0
0.0
0.0
0.2
0.0
0.0
0.0
0.4
0.0
0.0
0.0
0.3
95% CIe
0.0–4.7
0.0–3.7
0.0–0.8
0.0–1.2
0.0–12.0
0.0–0.9
0.0–3.4
0.1–1.0
0.0–3.4
0.0–0.7
0.0–0.6
0.1–0.8
PsA
CD
PsA and CD combined
Placeboa
Ustekinumabb
Placeboc
Ustekinumabd
Placebo
Ustekinumab
+CS
−CS
+CS
−CS
+CS
−CS
+CS
−CS
+CS
−CS
+CS
−CS
Number of patients treated
45
334
141
877
351
592
643
1106
396
926
784
1983
Mean weeks of follow-up
21.17
19.73
43.71
43.35
18.86
19.27
32.69
33.00
19.12
19.44
34.67
37.58
Mean weeks of treatment
13.76
11.72
29.84
27.30
9.46
10.10
18.32
19.07
10.02
10.72
20.39
22.71
D/C study drug due to AEs [n (%)]
3 (6.7)
19 (5.7)
7 (5.0)
24 (2.7)
17 (4.8)
28 (4.7)
48 (7.5)
60 (5.4)
20 (5.1)
47 (5.1)
55 (7.0)
84 (4.2)
PYs of follow-up
18
127
119
731
127
219
404
702
146
346
523
1,433
Event rate/100 PYs
AEs
185.6
366.2
210.1
261.4
706.2
715.6
646.5
638.8
640.7
587.7
547.5
446.3
95% CIe
128.5–259.4
333.7–401.1
184.8–237.9
249.8–273.4
660.8–754.0
680.6–751.9
621.9–671.7
620.3–657.8
600.3–683.2
562.4–613.8
527.7–568.0
435.4–457.4
SAEs
10.9
14.2
7.6
9.6
47.9
41.5
39.1
33.2
43.3
31.5
32.0
21.2
95% CIe
1.3–39.4
8.4–22.5
3.5–14.4
7.5–12.1
36.7–61.6
33.4–50.9
33.2–45.7
29.1–37.7
33.3–55.4
25.9–38.0
27.3–37.2
18.8–23.7
Infectionsf
49.1
110.5
52.3
82.2
157.1
138.1
135.1
133.4
143.5
128.0
116.3
107.3
95% CIe
22.5–93.3
93.0–130.4
40.1–67.1
75.8–89.1
136.1–180.5
123.0–154.6
124.0–146.9
124.9–142.2
124.7–164.4
116.4–140.5
107.3–125.9
102.0–112.8
Serious infectionsf
0.0
0.8
0.8
1.0
8.6
5.9
6.4
6.4
7.6
4.1
5.2
3.6
95% CIe
0.0–16.4
0.0–4.4
0.0–4.7
0.4–2.0
4.3–15.5
3.2–10.1
4.2–9.4
4.7–8.6
3.8–13.5
2.2–6.8
3.4–7.5
2.7–4.8
Adjudicated serious MACE
0.0
0.8
0.8
0.7
0.0
0.0
0.0
0.1
0.0
0.3
0.2
0.4
95% CIe
0.0–16.4
0.0–4.4
0.0–4.7
0.2–1.6
0.0–2.4
0.0–1.4
0.0–0.7
0.0–0.8
0.0–2.1
0.0–1.6
0.0–1.1
0.2–0.9
Deaths
0.0
0.0
0.0
0.0
0.0
0.0
0.0
0.0
0.0
0.0
0.0
0.0
95% CIe
0.0–16.4
0.0–2.4
0.0–2.5
0.0–0.4
0.0–2.4
0.0–1.4
0.0–0.7
0.0–0.4
0.0–2.1
0.0–0.9
0.0–0.6
0.0–0.2
Malignancies (excluding NMSC)
0.0
0.0
0.0
0.1
0.0
0.0
0.0
0.6
0.0
0.0
0.0
0.4
95% CIe
0.0–16.4
0.0–2.4
0.0–2.5
0.0–0.8
0.0–2.4
0.0–1.4
0.0–0.7
0.2–1.5
0.0–2.1
0.0–0.9
0.0–0.6
0.1–0.8
PsA—phase II (through week 36), PSUMMIT-1 (through week 52), PSUMMIT-2 (through week 60); CD—phase II (only controlled IV population in population 1; through week 28), CERTIFI (through week 36), UNITI-1 and UNITI-2 (through week 8 for patients who entered IM-UNITI; through week 20 for patients who did not enter IM-UNITI, IM-UNITI (through week 44)
AEs adverse events, CD Crohn’s disease, CI confidence interval, CS corticosteroid, D/C discontinuation, IV intravenous, MACE major adverse cardiovascular event, MTX methotrexate, NMSC non-melanoma skin cancer, PsA psoriatic arthritis, PYs patient-years, SAEs serious adverse events
aIncludes data up to the time of early escape or crossover
bIncludes data from the first ustekinumab dose onward for patients who escaped early or crossed over from placebo
cIncludes data up to the first ustekinumab dose for patients who were initially treated with placebo; includes data on or after 16 weeks from the first ustekinumab dose for patients who were initially treated with ustekinumab and were crossed over or re-randomized to placebo
dIncludes data up to 16 weeks from the first ustekinumab dose for patients who were crossed over or re-randomized to placebo
eCIs based on an exact method assuming that the observed number of events follows a Poisson distribution
fInfection as assessed by the investigator
CD patients generally received higher CS doses (when receiving oral systemic CSs [excluding budesonide] at baseline, the median prednisone dose, or equivalent, was 20 mg/day) than PsA patients. Nonetheless, no differences between CD and PsA ustekinumab-treated patients were identified in the occurrence of infections or SIs related to baseline CS use. In CD studies, incidences/100 PYs (95% CI) of infections and SIs ascribed to periods of placebo treatment were 157.1 (136.1–180.5) and 8.6 (4.3–15.5), respectively, with CSs, versus 138.1 (123.0–154.6) and 5.9 (3.2–10.1), respectively, without CSs. Respective incidences/100 PYs of infections and SIs among ustekinumab-treated patients were 135.1 (124.0–146.9) and 6.4 (4.2–9.4) with CSs, and 133.4 (129.0–142.2) and 6.4 (4.7–8.6) without CSs. In addition, among CD patients, incidences/100 PYs of SAEs and SIs appeared higher in placebo patients receiving methotrexate versus those not receiving methotrexate, and the same was true, although to a lesser extent, in ustekinumab-treated patients (Table 5). When considering all IMM use (including 6-mercaptopurine/azathioprine), no effect was apparent on the short- or long-term safety profile of ustekinumab versus placebo among CD patients (Table 6).
Table 6
Key safety findings in CD studies, by baseline IMM use
Induction (through week 8)
Maintenance (through week 44)
Placeboa
Ustekinumabb
Placeboa
Ustekinumabb
+IMM
−IMM
+IMM
−IMM
+IMM
−IMM
+IMM
−IMM
Number of patients treated
195
429
410
952
70
136
112
223
Mean weeks of follow-up
8.2
8.1
8.1
8.2
27.2
24.7
33.4
30.3
Percentage of patients with one or more:
AEs
56.4
66.0
57.8
62.6
77.1
81.6
72.3
79.8
SAEs
8.7
5.4
3.9
5.9
11.4
11.8
9.8
9.9
Infectionsc
26.2
22.4
18.8
23.1
40.0
41.9
41.1
42.6
Deaths
0.0
0.0
0.0
0.0
0.0
0.0
0.0
0.0
Phase II (only controlled IV patientsin population 1; through week 28), CERTIFI (through week 36), UNITI-1 and UNITI-2 (through week 8 for patients who entered IM-UNITI; through week 20 for patients who did not enter IM-UNITI, IM-UNITI (through week 44)
AEs adverse events, CD Crohn’s disease, IMM immunomodulators, IV intravenous, SAEs serious adverse events
IMMs included 6-mercaptopurine, azathioprine, or methotrexate
aIncludes data up to the time of early escape or crossover
bIncludes data from the first ustekinumab dose onward for patients who escaped early or crossed over from placebo
cInfection as assessed by the investigator
3.3 Deaths
Through year 1, five ustekinumab–treated psoriasis patients, and no CD or PsA patients, died. The overall incidence/100 PYs (95% CI) of death was 0.1 (0.0–0.3) and 0.0 (0.0–0.4), respectively, among ustekinumab- and placebo-treated patients (Table 3). One patient each died due to dilated cardiomyopathy (ustekinumab 90 mg) [6], aspiration following alcohol intoxication (in a patient who received placebo followed by ustekinumab 45 mg) [6], and multisystem organ failure (ustekinumab 90 mg) [7]; two deaths were accidental (gunshot wound, motor vehicle accident). All deaths were considered unrelated to ustekinumab treatment by the investigators.
3.4 AEs of Special Interest
3.4.1 Opportunistic Infections
Combined across indications, the overall number of OIs was low through year 1; no single OI occurred in more than one patient, except non-serious esophageal candidiasis in two placebo-treated and three ustekinumab-treated CD patients. Three serious OIs occurred among ustekinumab-treated patients, including disseminated histoplasmosis (CD patient [21] receiving concomitant CSs/azathioprine, spiking fevers prior to randomization, discontinued infliximab 10 mg/kg 3 months prior), Listeria meningitis (CD patient, field worker, treated with prednisone 30 mg/day 3 weeks after ustekinumab 6 mg/kg [11]), and herpes zoster (psoriasis patient, left T8 dermatome affected, 19 disseminated cutaneous vesicles) [5].
3.4.2 Tuberculosis Infection
Combined across indications through year 1, one case of presumed active primary TB was reported in a 31-year-old Hungarian man with CD, approximately 10 months after receiving a single intravenous ustekinumab dose (130 mg) [11]. This patient had previously received a Bacillus Calmette Guerin vaccination and had negative chest radiograph and QuantiFERON findings at screening. The patient reported flu-like symptoms (fever, chills, sore throat, cough, yellowish sputum). QuantiFERON, sputum smear, and M. tuberculosis culture were negative, and chest radiograph and computed tomography findings were consistent with TB. Following empirical triple anti-TB therapy, the symptoms resolved.
3.4.3 Serious Major Adverse Cardiovascular Events
Across studies, incidences/100 PYs (95% CIs) of adjudicated serious MACEs during the initial 8- to 16-week controlled periods were 0.6 (0.2–1.4) and 0.3 (0.0–1.5), respectively, among patients receiving ustekinumab (n = 5) and placebo (n = 1). Limited numbers of events and short duration of follow-up may constrain data interpretation. Across studies, incidences/100 PYs (95% CIs) of serious MACEs were also similar through year 1 among patients receiving ustekinumab (0.5 [0.3–0.7]; 21 events) and placebo (0.3 [0.0–1.1]; 2 events) (Table 3). The incidence/100 PYs of serious MACEs appeared lower in CD patients (one event) versus psoriatic patients, likely owing to higher rates of underlying cardiovascular risk factors (e.g. hypertension, hyperlipidemia, diabetes, obesity, smoking) and older age in the latter (Table 2).
3.4.4 Malignancies
Low and comparable incidences/100 PYs (95% CI) of NMSC were observed among ustekinumab-treated patients through year 1 (n = 30, 0.7 [0.5–1.0]) and placebo-treated patients (n = 4, 0.6 [0.2–1.5]). Most NMSCs occurred in psoriasis patients who were older, commonly received phototherapy, and might self-treat with natural sunlight, in both the ustekinumab (n = 24, 0.9/100 PYs [0.6–1.4]) and placebo (n = 2, 1.1/100 PYs [0.1–4.0]) groups (Table 7).
Table 7
Patients with one or more malignancies/100 PYs through year 1 in psoriasis, PsA, and CD studies
Psoriasis
PsA
CD
All patients
Comparatora
Ustekinumabb
Placeboc
Ustekinumabd
Placeboe
Ustekinumabf
Comparator
Ustekinumab
Number of patients treated
733
3117
379
1018
943
1749
2055
5884
NMSC
Total (median) PYs of follow-up
182 (0.2)
2558 (0.9)
145 (0.4)
849 (1.0)
346 (0.2)
1105 (0.6)
673 (0.2)
4512 (0.8)
Patients with event/incidence/100 PYs
2/1.1
24/0.9
0/0.0
2/0.2
2/0.6
4/0.4
4/0.6
30/0.7
95% CIg
(0.1–4.0)
(0.6–1.4)
(0.0–2.1)
(0.0–0.9)
(0.1–2.1)
(0.1–0.9)
(0.2–1.5)
(0.5–1.0)
Malignancies excluding NMSC and in situ cervical cancer
Total (median) PYs of follow-up
182 (0.2)
2563 (0.9)
145 (0.4)
849 (1.0)
347 (0.2)
1106 (0.6)
674 (0.2)
4519 (0.8)
Patients with event/incidence/100 PYs
1/0.6
11/0.4
0/0.0
1/0.1
0/0.0
3/0.3
1/0.2
15/0.3
95% CIg
(0.0–3.1)
(0.2–0.8)
(0.0–2.1)
(0.0–0.7)
(0.0–0.9)
(0.1–0.8)
(0.0–0.8)
(0.2–0.6)
All malignancies
Total (median) PYs of follow-up
181 (0.2)
2556 (0.9)
145 (0.4)
849 (1.0)
346 (0.2)
1105 (0.6)
673 (0.2)
4510 (0.8)
Patients with event/incidence/100 PYs
3/1.7
35/1.4
0/0.0
3/0.4
2/0.6
7/0.6
5/0.7
45/1.0
95% CIg
(0.3–4.8)
(1.0–1.9)
(0.0–2.1)
(0.1–1.0)
(0.1–2.1)
(0.3–1.3)
(0.2–1.7)
(0.7–1.3)
Patients included in SEER analysish
722
3033
373
1005
914
1689
2009
5727
Total (median) PYs of follow-up
179 (0.2)
2497 (0.9)
143 (0.5)
839 (1.0)
334 (0.2)
1068 (0.6)
656 (0.2)
4403 (0.8)
Observed/expectedi patients with event
1/1.0
10/13.2
0/0.9
1/4.9
0/1.2
2/3.6
1/3.0
13/21.7
SIRj
1.1
0.8
0.0
0.2
0.0
0.6
0.3
0.6
SIR 95% CIg
(0.0–5.8)
(0.4–1.4)
(0.0–3.5)
(0.0–1.1)
(0.0–2.6)
(0.1–2.0)
(0.0–1.9)
(0.3–1.0)
Psoriasis—phase II, PHOENIX-1, PHOENIX-2, ACCEPT (all through week 52); PsA—phase II (through week 36), PSUMMIT-1 (through week 52), PSUMMIT-2 (through week 60); CD—phase IIa (only controlled IV population in population 1; through week 28), CERTIFI (through week 36), UNITI-1 and UNITI-2 (through week 8 for patients who entered IM-UNITI; through week 20 for patients who did not enter IM-UNITI), IM-UNITI (through week 44)
CD Crohn’s disease, CI confidence interval, IV intravenous, NMSC non-melanoma skin cancer, PsA psoriatic arthritis, PYs patient-years, SEER Surveillance, Epidemiology, and End Results, SIR standardized incidence ratio
aIncludes data up to the time of crossover
bIncludes data from the first ustekinumab dose onward for patients who crossed over from placebo
cIncludes data up to the time of early escape or crossover
dIncludes data from the first ustekinumab dose onward for patients who escaped early or crossed over from placebo
eIncludes data up to the first ustekinumab dose for patients who were initially treated with placebo; includes data on or after 16 weeks from the first ustekinumab dose for patients who were initially treated with ustekinumab and were crossed over or re-randomized to placebo
fIncludes data up to 16 weeks from the first ustekinumab dose for patients who were crossed over or re-randomized to placebo
gCIs based on an exact method assuming that the observed number of events follows a Poisson distribution
hOnly patients of White, Black or African American, Asian, American Indian/Alaska Native, Native Hawaiian or other Pacific Islander race were included since SEER only contains incidence rates for these populations
iExpected number of patients with malignancies is based on the SEER database (year 2013), adjusted for age, sex, and race
jSIR determined as observed, divided by the expected numbers of patients with malignancies
Through year 1, incidences/100 PYs of malignancies other than NMSC were also low and comparable among ustekinumab-treated (n = 15, 0.4 [0.2–0.6]) and placebo-treated (n = 1, 0.2 [0.0–0.8]) patients, with overlapping 95% CIs (Table 7). As with NMSC, most non-NMSC malignancies occurred in psoriasis patients (ustekinumab: n = 11, 0.4/100 PYs [0.2–0.8]; placebo: n = 1, 0.6/100 PYs [0.0–3.1]). All non-NMSC malignancies were solid tumors except one cutaneous T-cell lymphoma (mycosis fungoides retrospectively concluded to pre-exist but that was incorrectly diagnosed as psoriasis [7]), chronic lymphocytic leukemia in a psoriasis patient treated with ustekinumab 90 mg, and multiple myeloma in a CD patient treated with intravenous ustekinumab (6 mg/kg) and who had a 6-year history of monoclonal gammopathy of unknown significance [11].
Combined across indications, the SIRs (95% CIs) for malignancies (excluding cervical cancers in situ and NMSC per SEER) in the ustekinumab and placebo groups were 0.6 (0.3–1.0) and 0.3 (0.0–1.9), respectively, with overlapping 95% CIs. Within-indication results were similar (Table 7). Data interpretation is limited by small numbers of events, relatively short duration of exposure, and differences in the length of treatment/follow-up.
3.4.5 Hypersensitivity Reactions
No serious anaphylactic reactions or serum sickness-like reactions to ustekinumab were observed. Two CD patients displayed signs/symptoms of hypersensitivity temporally associated with treatment (throat tightness/shortness of breath/flushing after the first and only subcutaneous ustekinumab administration; chest discomfort/flushing/urticaria/fever after the initial intravenous ustekinumab dose). Symptoms resolved within 1 h following oral CS/antihistamine treatment.
3.4.6 Neurological Disorders Other Than Stroke
Serious neurological disorders were rare, with no cases of reversible posterior leukoencephalopathy syndrome (RPLS), definitive progressive multifocal leukoencephalopathy, or demyelinating disorder through year 1, apart from one non-serious event of ‘other demyelinating diseases of the central nervous system’. The CD patient experienced dizziness, numbness, and mouth tingling starting approximately 2 months after entering the maintenance study, as well as visual symptoms. Although imaging studies identified microvascular disease and previous small vessel insults, demyelinating disease was reported as a diagnosis of exclusion. One previously reported RPLS case in the PHOENIX-2 trial occurred after approximately 2.5 years of ustekinumab treatment, the only such event across combined indications [25].
4 Discussion
This is the first integrated analysis of safety data derived from phase II/III trials combined across the ustekinumab-approved indications. Safety data from 5884 ustekinumab-treated patients are reported (including 1659 patients after crossover from placebo); 2055 patients received placebo comparator through the initial 8- to 16-week controlled periods.
The ustekinumab safety profile was comparable with that of placebo when integrated across indications, with no evidence of a dose effect in the occurrence of AEs, SAEs, or infections. Importantly, 70% and 36% of ustekinumab-treated patients received ≥ 6 months and ≥ 1 year, respectively, of treatment (4521 PYs of follow-up; mean ustekinumab treatment duration: 24.6 weeks). Exposure-adjusted rates of AEs of special interest through year 1 were generally consistent with those observed during the initial controlled periods. These findings are consistent with those of clinical trial extensions through up to 5 years in psoriasis, and up to 2 years in PsA, which showed no increase in the risk of SI, death, MACEs, or malignancy [10, 12, 13].
In the current analysis, ustekinumab also demonstrated a favorable benefit–risk profile in CD, with single initial dosing up to 6 mg/kg intravenously, followed by 90 mg subcutaneously every 8/12 weeks. AE incidences/100 PYs were comparable between treatment arms, with no evidence of a dose effect. Reassuringly, evaluation of ustekinumab in CD patients through year 1 did not alter the overall ustekinumab safety profile previously defined in patients with psoriatic diseases, despite inherent differences between disease states and frequent use of concomitant IMMs/CSs in CD.
Anzeige
Notably, AEs, SAEs, infections, and SIs were more common in CD trials than psoriasis/PsA trials, which likely reflects the more significant disease burden, inherently greater risk of infection, and/or more common CS/IMM use in CD populations than psoriatic populations. For example, the effect of CSs in CD patients was illustrated by an apparently higher incidence/100 PYs of infections among placebo-treated CD patients than ustekinumab-treated CD patients with baseline CS use. However, regardless of CS exposure, no increase in the time-adjusted occurrence of infections or SIs was observed among ustekinumab-treated patients. Additionally, given the overall low number of potential OIs, and accounting for the potential confounder of IMM/CS use, no association was apparent between ustekinumab treatment and increased risk of OIs, including TB. The proportion (95% CI) of ustekinumab-treated patients with active TB across all phase II/III studies for approved indications was considerably lower (0.02/100 PYs [0.0–0.06]) than in the clinical development programs for golimumab (0.24/100 PYs [0.16–0.33]) and infliximab (0.39/100 PYs [0.25–0.57]) [26].
A theoretical risk of malignancy for IL-12/23 inhibitors, such as ustekinumab, was based on animal models suggesting involvement of IL-12 in tumor surveillance (e.g. studies in IL-12p35 knockout mice) [1, 27, 28]. While no dedicated preclinical carcinogenicity studies were conducted for ustekinumab, in part due to limited cross-species reactivity, all available (including long-term) safety data in humans have indicated no safety signals for malignancy with ustekinumab [12, 15, 16, 29]. Additionally, comparing malignancy incidence between ustekinumab-treated patients and the general US population (via the SEER database) in these integrated analyses suggested no increased malignancy risk, either combined across, or within, indications. Malignancy incidence among ustekinumab-treated psoriasis patients through year 1 (0.4/100 PYs) was also consistent with ustekinumab safety data through 5 years of follow-up in psoriasis clinical trials (0.6/100 PYs) [12] and with real-world experience in PSOLAR, with a median follow-up of 4.2 years (0.6/100 PYs) [29]. Furthermore, in a nested case-control analysis of PSOLAR data, no overall increased malignancy risk was observed for any duration of ustekinumab treatment (> 0 to < 3 months, ≥ 3 to < 12 months, ≥ 12 months) versus no ustekinumab treatment [29]. While current and previously reported findings are reassuring, longer-term longitudinal data and larger (e.g. real-world observational) studies will be needed to confirm current findings of no increased malignancy risk with IL-12/23 inhibition.
Historically, the sponsor has evaluated serious MACEs in psoriatic patients who have increased risk for occlusive vascular diseases [30, 31], likely resulting from higher rates of cardiovascular risk factors (hypertension, hyperlipidemia, diabetes, obesity, smoking) and the disease itself representing an independent risk factor [32]. In a systematic review and meta-analysis of 11 observational studies (n = 32,973), cardiovascular and cerebrovascular morbidity were increased by 43% and 22%, respectively, in PsA patients versus the general population [33]. In our integrated analysis, consistent with observations through 5 years in psoriasis patients [12, 13] and 2 years in PsA patients [10] participating in ustekinumab RCT long-term extensions, overall rates of serious MACEs were low and generally comparable between treatment groups, with no consistent evidence that ustekinumab increases the risk of serious MACEs. As might be expected, CD patients appeared to exhibit fewer predisposing risk factors (Table 2) and had lower rates of serious MACEs, with only one event reported through year 1.
These integrated analyses are not without limitations. In the context of chronic lifelong conditions, 1 year could be considered a relatively short duration of treatment and/or follow-up. In addition, the duration of treatment and follow-up were considerably different between placebo and ustekinumab cohorts across studies. This led to relatively small numbers of some AEs of interest among placebo-treated patients, and in turn limited interpretation of comparisons between treatment groups despite adjustments for follow-up duration. Nonetheless, it is not clear whether these safety analyses were imbued with any systemic bias.
Despite these limitations, these integrated analyses represent a substantially larger, prospectively collected, safety experience than any individual practitioner, investigator, or institution will have at their disposal for some time. Although possibly insufficient to assess long latency events, such as malignancies, the year 1 data reasonably represent the ustekinumab safety profile for most other potential common risks of interest, as data were consistent with longer-term safety data from the psoriasis/PsA trials. Of note, limiting this analysis to data accrued over 1 year of treatment and follow-up ensured that the more extensive safety data available in psoriasis patients did not overshadow more limited data available for the PsA and CD populations. Lastly, the 1-year timeframe provides an intuitive and tangible context for practitioners regarding the ustekinumab benefit-risk profile in treating these immune-mediated inflammatory disorders.
5 Conclusions
Through year 1, across 12 phase II/III RCTs in psoriasis, PsA, and CD, ustekinumab demonstrated a favorable safety profile that was generally consistent with placebo and longer-term data from psoriasis trials. Future studies with even larger numbers of patients from real-world observational databases/registries, ideally followed over multiple years of treatment, are needed to validate findings and further evaluate rare events.
Acknowledgements
The authors thank Philippe Szapary, MD, of Janssen Research & Development, LLC, for reviewing a previous version of this manuscript, and Michelle L. Perate, MS, for professional medical writing assistance (supported by Janssen).
Compliance with Ethical Standards
Each trial complied with the Declaration of Helsinki and Good Clinical Practice guidelines. Each site’s governing ethical body approved the study protocol, and all patients provided written informed consent.
Role of the funding source
Janssen Research & Development, LLC, sponsored and funded the trials contributing data to these integrated safety analyses. The sponsor oversaw each study’s protocol development and conduct. All authors, including those employed by the sponsor, made substantive contributions to data analysis/interpretation and manuscript development, and approved the final version prior to submission. A professional medical writer paid by the sponsor assisted the authors with manuscript preparation and submission.
Contributors
All authors had full access to the study data, were involved in data interpretation, participated in manuscript preparation, and approved the final version for submission. In addition, SG planned the initial draft of the manuscript; ZY assisted with data analyses; and BS, CG, EO, and SG were involved in study conduct and data acquisition.
Conflicts of interest
Subrata Ghosh has received consulting honoraria from AbbVie, Boehringer-Ingelheim, Bristol Myers Squibb, Gilead, Janssen, Pfizer, and Takeda, and research grant support from AbbVie and GlaxoSmithKline. Lianne S. Gensler has received consulting honoraria from Janssen and Novartis, and research grant support from AbbVie, Amgen, and UCB. Zijiang Yang and Paraneedharan Ramachandran are employed by Janssen Research & Development, LLC, and Chris Gasink, Soumya D. Chakravarty, Kamyar Farahi, and Elyssa Ott are employed by Janssen Scientific Affairs, LLC, both wholly owned subsidiaries of Johnson & Johnson (J&J), and own stock/stock options in J&J. Bruce E. Strober discloses the following relationships: consultant and member of the advisory board for AbbVie, Almirall, Amgen, AstraZeneca, Boehringer Ingelheim, Celgene, Cutanea-Maruho, Dermira, Eli Lilly, Janssen, Leo, Medac, Novartis, Pfizer Inc, Sun Pharma, UCB, and Valeant (honoraria for all); investigator for AbbVie, Amgen, Boehringer Ingelheim, Celgene, Eli Lilly, Galderma, GlaxoSmithKline, Janssen, Merck, Novartis, Pfizer Inc, Sun Pharma (payments to the University of Connecticut, not to Bruce Strober, MD, PhD); scientific director for CORRONA Psoriasis Registry (consulting fee); and grant support to the University of Connecticut for Fellowship Program from AbbVie, Janssen (payments to the University of Connecticut, not to Bruce Strober, MD, PhD).
Open AccessThis article is distributed under the terms of the Creative Commons Attribution-NonCommercial 4.0 International License (http://creativecommons.org/licenses/by-nc/4.0/), which permits any noncommercial use, distribution, and reproduction in any medium, provided you give appropriate credit to the original author(s) and the source, provide a link to the Creative Commons license, and indicate if changes were made.
Mit e.Med Innere Medizin erhalten Sie Zugang zu CME-Fortbildungen des Fachgebietes Innere Medizin, den Premium-Inhalten der internistischen Fachzeitschriften, inklusive einer gedruckten internistischen Zeitschrift Ihrer Wahl.