The effect of mother’s age and other related factors on neonatal survival associated with first and second birth in rural, Tanzania: evidence from Ifakara health and demographic surveillance system in rural Tanzania
verfasst von:
Majige Selemani, Mathew A Mwanyangala, Sigilbert Mrema, Amri Shamte, Dan Kajungu, Abdallah Mkopi, Michael Johnson Mahande, Rose Nathan
With a view to improve neonatal survival, data on birth outcomes are critical for planning maternal and child health care services. We present information on neonatal survival from Ifakara Health and Demographic Surveillance System (HDSS) in Tanzania, regarding the influence of mother’s age and other related factors on neonatal survival of first and second births.
Methods
The study conducted analysis using longitudinal health and demographic data collected from Ifakara HDSS in parts of Kilombero and Ulanga districts in Morogoro region. The analysis included first and second live births that occurred within six years (2004–2009) and the unit of observation was a live birth. A logistic regression model was used to assess the influence of socio-demographic factors on neonates’ survival.
Results
A total of 18,139 first and second live births were analyzed. We found neonatal mortality rate of 32 per 1000 live births (95% CI: 29/1000-34/1000). Results from logistic regression model indicated increase in risk of neonatal mortality among neonates those born to young mothers aged 13–19 years compared with those whose mother‘s aged 20–34 years (aOR = 1.64, 95% CI = 1.34-2.02). We also found that neonates in second birth order were more likely to die than those in first birth order (aOR = 1.85: 95% CI = 1.52-2.26). The risk of neonatal mortality among offspring of women who had a partner co-resident was 18% times lower as compared with offspring of mothers without a partner co-resident in the household (aOR = 0.82: 95% CI = 0.66-0.98). Short birth interval (<33 months) was associated with increased risk of neonatal mortality (aOR = 1.50, 95% CI =1.16-1.96) compared with long birth interval (> = 33 months). Male born neonates were found to have an increased risk (aOR = 1.34, 95% CI =1.13- 1.58) of neonatal mortality as compared to their female counterparts.
Conclusions
Delaying the age at first birth may be a valuable strategy to promote and improve neonatal health and survival. Moreover, birth order, birth interval, mother’s partner co-residence and sex of the neonate appeared as important markers for neonatal survival.
The online version of this article (doi:10.1186/1471-2393-14-240) contains supplementary material, which is available to authorized users.
Competing interests
The authors declare that they have no competing interests.
Authors’ contributions
MS conceived the study idea, designed the study, carried out the statistical analyses, interpretation of the results, and drafted the manuscript. MA, SM, AS, DK, AM and RN participated in the design of the study, reviewed the manuscript. MJM provided technical support for interpreting results and reviewed it for intellectual content. MA was a coordinator of Ifakara Demographic Surveillance system during the study period. All authors read and approved the final manuscript.
Background
It is estimated that about 2.96 million infants worldwide die each year during first four weeks of life (neonatal period) [1]. About 98% of these deaths occur in low- and middle-income countries; with the highest proportion in sub-Saharan Africa and south-east Asia [1]. In 2012, neonatal mortality accounted for 43% of the under five deaths in developing countries [1, 2]. A recent Tanzania Demographic and Health Survey report showed a decline in under-five mortality rate from 112 per 1000 live births in 2004/05 to 81 per 1000 live births in 2010 [3]. Similarly, the infant mortality rate has dropped from 68 to 45 per 1000 live births during the same period. However, the share of neonatal death has slowly dropped from 32 to 25 per 1000 live births during the survey period 2004/05 to 2010. Reduction in neonatal deaths is an essential step towards effort to accelerate progress towards achievement of MDG 4 for child survival. However, this requires better understanding of major causes and risk factors for neonatal deaths.
Several risk factors have been suggested to influence neonatal mortality including maternal age, parity, race, smoking birth weight, gestational age, labour complications, number of antenatal care visits, previous unfavourable outcomes (stillbirth and neonatal death) and various socio-economic factors [4, 5].
Anzeige
Pregnancy during teenage is a significant problem globally, with the highest incidence rates occurring in developing nations [6]. Tanzania is among the countries with highest teenage pregnancy (44%) and birth rates in the world [7]. National survey reports indicate that about 25% of girls begun child-bearing at 17 years; this figure increases to almost 40 per cent by age 18 [3, 7]. While early childbearing has often been regarded as a social issue, there is evidence that young maternal age may be linked to adverse pregnancy outcomes including low birth weight (LBW), preterm birth, intrauterine growth restriction, stillbirth, neonatal mortality [5]. Other studies have shown relationship between birth orders, birth interval, maternal age and neonatal mortality [8‐10]. Previous studies in Tanzania that concentrated on effect of maternal age on neonatal outcome had small sample sizes which are difficult to make inference. Yet, there is scant information about the influence of mothers’ age, birth order, and birth interval on neonatal mortality for the first and second births in Tanzania.
In view of the importance of neonatal survival, epidemiological data regarding the influence of mother’s age on neonatal mortality provide important information to policy makers and program managers when designing interventions to reduce neonatal mortality [1, 7]. Therefore, this paper used longitudinal data generated in Health and Demographic Surveillance Systems to study the influence of mother’s age and other factors on neonatal survival of first and second births in the rural part of south-eastern Tanzania.
Methods
Study design and setting
The analysis used data from Ifakara Health and Demographic Surveillance Site (HDSS) situated in Kilombero and Ulanga districts in Morogoro region. In 2011, the total population under surveillance was over 100,000 living in 16,000 households [11]. The Ifakara HDSS has consistently been recording pregnancies, pregnancy outcomes, deaths and migrations by visiting households once every four months since 1997 after completion of the baseline census carried out in 1996. Since then every household in the surveillance area has been visited by a trained interviewer every 4 months to record pregnancies, pregnancy outcomes, deaths and migrations that have happened since the previous visit. Household registers are used to record each of those events. All registered deaths are followed up with a verbal Autopsy (VA) by well trained field staff. Date of birth of each individual is included in the household registers and each event is recorded along with specific date it happened. Place of delivery and place of death are recorded as health facility, home or elsewhere.
The population is predominantly rural and ethnically heterogeneous. Majority of the households earn their living from subsistence farming, few are engaged in fishing and small-scale trading. The population of the study area is served by a network of health facilities, at the time of the study there were two hospitals, four health centres and twenty one dispensaries in Kilombero district; two hospitals, three health centres and twenty dispensaries in Ulanga district.
Anzeige
Overall, the total fertility rate in the study area is four children per women in their lifetime. Within the study population, about 60% of all deliveries occur in health facilities mainly in dispensaries. In the study area, most (96%) of pregnant women attend at least one antenatal care (ANC) visit from the skilled birth attendants. However, only 43% of pregnant women are recorded with at least four visits. At the time of study, continuum of care was not fully introduced in the study area.
Data credibility was ensured at all stages of collection and processing to enhance quality. Up to 5% of randomly selected households were visited by field supervisors for repeated interviews. Other strategies included accompanied interviews as well as surprise field visits by field supervisor. Data management is done using the household-registration system (HRS 2) with built in consistency and range checks. Detailed description of the study area is presented elsewhere [12].
Data processing and analysis
This paper reports analysis using longitudinal data collected in the Ifakara Health and Demographic Surveillance Site (IHDSS) for children born between 2004 and 2009. First and second birth order of neonates were extracted from the database including their survival status within the first 28 days of life. All women who had first and second live births that occurred between 2004 and 2009 were included in the analysis. We used live births as the unit of observation. Explanatory variables include: age of mother, sex, birth order, birth interval, place of delivery, social economic status (SES), education of the mother, mother having partner co-resident, and season of the year. The outcome variable was neonatal death.
Birth order was classified into two groups - first birth order and second birth order. Birth interval among second birth was classified as long birth interval (greater than 33 months after the previous birth) and short birth interval (less than 33 months after the previous birth), as per WHO recommendation [13]. The age of mother at delivery was categorized into three groups teenage (less than 20 years), (20 to 34 years) and (35 to 49 years) [14]. The place of delivery was classified into two groups: health facility and outside health facility. All deliveries that occurred on the way to a health facility, home or elsewhere outside health facilities were all classified as outside health facility deliveries. Seasons of delivery were classified into two groups: dry (June-October) and wet (November-May) according to the dates of birth that correspond to the seasons of the year in the study area. Other variables were maternal educational level which was classified into two groups, “primary level or below” and “above primary education”, sex of neonate and mother’s partner co-resident.
Household wealth status was constructed using Principal Component Analysis (PCA) [15]. Items included in the PCA are household assets; animals, TV, bicycle and radio. Also type of toilet, source of drinking water, house roofing material, wall material, and floor material were included in PCA. Finally, all households were grouped into five categories: Poorest, Poorer, Poor, Less Poor or Least Poor according to their household wealth score. The outcome variable was defined by assigning the neonatal death into one of the two categories: “1” if a newborn die within the first 28 days of life and “0” if a newborn had not die within the first 28 days of the life.
Statistical methods
The analysis used both descriptive and analytical statistics. Neonatal death rates by each variable were calculated and presented. Pearson’s Chi-Square test was used to determine the association between a set of explanatory variables and neonatal death for categorical variables. Further analysis was performed in multivariable logistic regression model to assess relative effect of the variables hypothesized to influence neonatal death. The Cox proportional hazard regression model could not be used because the number of neonatal deaths were less than four percent, thus more than 96% would not observe the event in the pre-designated time interval and would be treated as censored (or missing).
Explanatory variables were selected for inclusion in the multivariate logistic regression if the p value was less than 0.1 p-values in the univariate analysis and improved the overall model [16]. The model was checked for statistical interactions and adequacy before being approved as final. An alpha level of 0.05 was used for all tests of statistical significance.
Statistical analyses were performed using STATA version 11.0 [17]. Odd ratios (OR) with 95% confidence intervals (CI) were used as measures of strength of association. Given the low prevalence of neonatal mortality, the odds ratios are close approximation of relative risks. The neonatal mortality rate was calculated as the number of neonatal deaths divided by number of live births in a given year and expressed per 1000 live births.
Anzeige
Ethical approval
Ifakara Health and Demographic Surveillance System were established with an initial aim of evaluating the effect of a large-scale social marketing of insecticide-treated nets on child survival in rural Tanzania. The Ethical clearance was granted by the Medical Research Coordinating Committee (MRCC) of the National Institute for Medical Research (NIMR) in Tanzania. For each household visit, verbal consent was sought from the respondent.
Results
Demographic characteristics of live birth
The analysis was based on 16,000 households registered in the Health and Demographic Surveillance System. A total of 11, 562 that had at least one live birth during the study period were included in the analysis, there was no refusal.
A total of 18,139 first and second live births were recorded in the Ifakara Health and Demographic Surveillance Area for the period from January 2004 to December, 2009. Of these, more than half 9,172 (51%) were males. A total of 576 neonatal deaths occurred during the study period, this translates into a neonatal mortality rate of 32 per 1000 live births (95% CI: 29/1000-34/1000).
Neonatal mortality rate
The risk of neonatal mortality rate among all live births reached its peak of 35 per 1000 live births in the year 2005, it then decreased to a lowest mortality level of 29 per 1000 live births in 2009. We observed a marked decline in neonatal mortality rates for the period from 2006 to 2009 (Table 1).
Table 1
Estimates of neonatal mortality for the year of 2004-2009 (N = 18,139)
Live birth
Neonatal Mortality
Year
No. live births
Deaths
Percent
Rate per 1000 live births
95% CI
P-value
2004-09
18,139
576
3.18
31.8
29.3-34.4
0.640
2004
2,734
87
3.08
30.8
24.5-37.2
2005
2,831
105
3.58
35.8
29.0-42.5
2006
2,869
102
3.43
34.3
27.8-40.9
2007
2,877
92
3.10
31.0
24.8-37.2
2008
3,232
99
2.97
29.7
24.0-35.5
2009
3,020
91
2.93
29.3
23.3-35.2
Anzeige
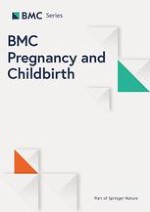
In this study, new-borns for teenage mothers (13–19 years) had higher neonatal mortality rate as compared with those born to older mothers (20 to 34 years) and (35 to 49 years), (46 per 1,000 live births, 28 and 31 per 1,000 live births respectively) (Table 2). In regards to birth order, we found higher neonatal mortality rates among second birth order as compared with first birth order (38 vs 28 per 1000 live births, respectively). Our results also showed that short birth intervals compared with long birth intervals were associated with an increased neonatal mortality rate in second births (47 and 29 per 1000 live birth respectively). Neonates born to mothers who had their partners co-resident had a lower mortality compared with those whose mothers had no partners (30 vs 38 per 1000 live births). Our data suggests that teenager mothers’ with a short birth interval after the previous birth have excess neonatal deaths (90 per 1000 live births) as compared with their counterparts with long birth interval (Table 3). Of the 576 live births that resulted in neonatal deaths, 45% happened on the same day of birth and 84% occurred during the first week of life (Figure 1).
Table 2
Distribution of neonatal deaths by explanatory variables (N = 18,139)
Factors
No. live births
Death n/N(%)
Rate per 1000 live births
95% CI
P-value
Sex
18,139
576/18,139(3.18)
31.8
29.3-34.4
<0.01
Male
9,172
331/9,172(3.61)
36.1
32.3-39.9
Female
8,967
245/8,967(2.71)
27.3
23.9-30.7
Mothers’ age group
18,139
576/18,139(3.18)
31.8
29.3-34.4
<0.01
Teenage(13–19)
3,238
150/3,238(4.63)
46.3
39.1-53.6
Non Teenage(20–34)
12,294
346/12,294(2.81)
28.1
25.2-31.1
Non teenage(35–49)
2,607
80/2,607(3.07)
30.7
24.1-37.3
Birth order
18,139
576/18,139(3.18)
31.8
29.3-34.4
<0.01
First order
11,562
325/11,562(2.81)
28.1
25.1-31.1
Second order
6,577
251/6,577(3.82)
38.2
33.5-42.8
Interval between first & second birth
6,577
251/6,577(3.82)
38.2
33.6-43.1
<0.01
Short birth interval(less than 33 months after the previous birth)
3,341
156/3341(4.67)
46.7
39.5-53.8
Long birth interval(greater than 33 months after the previous birth)
3,236
95/3236(2.94)
29.4
23.5-35.2
SES at birth
18,139
576/18,139(3.18)
31.8
29.3-34.4
0.762
Poorest
3,710
121/3710(3.26)
32.6
26.8-38.3
Poorer
3,628
110/3628(3.03)
30.3
24.7-35.9
Poor
3,861
119/3861(3.08)
30.8
25.4-36.3
Less Poor
3,780
117/3780(3.10)
31
25.4-36.5
Least Poor
3,160
109/3160(3.45)
34.5
28.1-40.9
Place of delivery
18,139
576/18,139(3.18)
31.8
29.3-34.4
0.842
Outside health facility
7,485
240/7485(3.21)
32.1
28.1-36.1
Health Facility
10,654
336/10654(3.15)
31.5
28.2-34.9
Education of mothers’
18,139
576/18,139(3.18)
31.8
29.3-34.4
0.072
Above primary education
3,220
86/3221(2.67)
26.7
21.4-32.9
Below and Primary education
14,919
490/14919(3.28)
32.8
28.0-34.1
Mother having partner
14,912
576/18,139(3.18)
31.8
29.3-34.4
0.031
Present
14,912
454/14912(3.04)
30.4
27.7-33.2
Absent
3,227
122/3227(3.78)
37.8
31.2-44.4
Season
18,139
576/18,139(3.18)
31.8
29.3-34.4
0.813
Dry season
7,817
251/7817(3.21)
32.1
28.3-36.3
Wet season
10,322
325/10,322(3.15)
3.15
28.2-35.0
P-values are based on Pearson’s Chi-Square test at 5% significance level.
Table 3
Distribution of neonatal deaths by mother’s age against birth order and birth interval
Mother's age
13-19
20-34
35-49
All age
Variable
No. live births
Death n/N(%)
No. live births
Death n/N(%)
No. live births
Death n/N(%)
No. live births
Death n/N(%)
P-value
AllBirth order
3238
150/3238(4.63)
12294
346/12294(2.81)
2607
80/2607(3.07)
18139
576/18139(3.18)
<0.01
First order
2549
102/2549(4.00)
7583
186/7583(2.45)
1430
37/1430(2.59)
11562
325/11562(2.81)
Second order
689
48/689(6.97)
4711
160/4711(2.45)
1177
43/1177(3.65)
6577
251/6577(3.82)
Interval between first & second birth
689
48/689(6.97)
4711
160/4711(2.45)
1177
43/1177(3.65)
6577
251/6577(3.82)
<0.01
Short birth interval (less than 33 months after the previous birth)
512
46/512(8.98)
2337
98/2337(4.19)
492
12/492(2.44)
3341
156/3341(4.67)
Long birth interval (greater than 33 months after the previous birth)
177
2/177(1.13)
2374
62/2374(2.61)
685
31/685(4.53)
3236
95/3236(2.94)
Figure 1
Timing of the neonatal deaths.
×
Factors associated with the risk for neonatal death
Odds and adjusted odds ratios (aORs) for neonatal death are presented in Table 4. Findings from univariate analysis revealed association between neonatal death and numerous factors (maternal age at delivery, mother’s partner, sex of newborn, birth order and birth interval). These factors remained statistically significant even after entered in the multivariate model. As shown in Table 4, neonates of the teenage mothers (13–19 years) had 64% (aOR 1.64, 95% CI: 1.34-2.02) increased risk of dying during the neonatal period than those of older mothers (20–34 years). In addition, neonates in the second birth order had nearly 2 fold (aOR 1.85, 95% CI: 1.52-2.26) increased risk of dying than those in the first birth order. Furthermore, mothers with short birth intervals were 1.5 times (aOR = 1.5, 95% CI: 1.16-1.96) more likely to lose their child during the neonatal period than mothers who had long birth interval after the previous pregnancy. The risk of neonatal death was higher among male newborn than female counterpart (aOR = 1.34, 95% CI: 1.13- 1.58). We also found that presence of mother’s partner conferred protection against neonatal death, where mothers with partner present had 18% reduced risk of losing their child during neonatal period (aOR = 0.82 95% CI: 0.62-0.98).
Table 4
Logistic regression model for predictors of neonatal death in Ifakara HDSS: 2004–2009 (N = 18,139)
Univariate
Multivariate
Factor
OR
95% CI
P-value
AOR
95% CI
P-value
Sex of newborn
Female (Ref.)
1.00
1.00
Male
1.33
1.13-1.58
<0.01
1.34
1.13-1.58
<0.01
Mothers’ age
Teenager mothers’ (20–34 years) (Ref.)
1.00
1.00
Non-Teenage mothers’ (13–19 years)
1.68
1.38-2.04
<0.01
1.64
1.34-2.02
<0.01
Non-Teenage mothers’ (35–49 years)
1.09
0.85-1.40
0.48
1.1
0.86-1.41
0.463
Birth order
First Births (Ref.)
1.00
1.00
Second births
1.37
1.16-1.62
<0.01
1.85
1.52-2.26
<0.01
Interval between first & second birth
Long birth interval (>33 months) (Ref)
1.00
Short birth interval (<33 months)
1.62
1.25-2.10
<0.01
1.50
1.16-196
<0.01
Maternal Education
Above primary education (Ref.)
1.00
1.00
None or Primary education
1.24
0.98-1.56
0.072
1.2
0.94-1.53
0.136
SES at birth
Poorest (Ref.)
1.00
Poorer
0.92
0.71-1.20
0.557
-
-
-
Poor
0.94
0.73-1.22
0.644
-
-
-
Less Poor
0.97
0.75-1.25
0.795
-
-
-
Least Poor
1.09
0.84-1.42
0.516
-
-
-
Place of delivery
Outside health facility (Ref.)
1.00
Health facility
0.91
0.83-1.16
0.842
-
-
-
Mother having partner
Absence (Ref.)
1.00
1.00
Presence of mothers’ partner
0.8
0.65-0.98
0.031
0.82
0.66-0.98
0.049
Season
Dry season (Ref.)
1.00
Wet season
0.98
0.83-1.16
0.813
-
-
-
Ref. = Reference of the category, CI = Confidence Interval, OR = odds Ratio.
Discussion
In Tanzania, the most recent Demographic and Health Survey conducted in 2010 indicated that neonatal mortality estimates declined from 32 deaths per 1000 in 2001–2005, to 26 deaths per 1000 in 2006–2010 [3, 18]. This indicates 19% improvement in neonatal survival for the period from 2001 to 2010 [3]. Our findings indicates that the neonatal mortality rate was 32 per 1000 live birth during the period of 2004 to 2009 and declined from 36 per 1,000 live births in 2005 to 29 per 1,000 live births in 2009. The possible explanation for this decline could be attributed to different interventions related to maternal and newborns such as Integrated Management of Childhood Illness (IMCI) [19], and increased malaria control efforts, which lead to the decline of malaria morbidity in Kilombero and Ulanga [20].
The higher neonatal mortality rate among infants born to teenage mothers in our study corresponds with previous studies [21‐23]. Usually adolescent mothers face financial and social problems that lead to less provision of child care [23]. Also, physiological immaturity of teenage mothers such as small uterus or narrow bony pelvis and lack of social experience on caring newborn can lead to more neonatal deaths [24]. Some scholars have argued that the neonatal deaths observed in teenage pregnancies might have been attributable to socio-demographic factors [25].
Anzeige
The association between birth order and increased neonatal death might be an artefact of overrepresentation of mothers with poor outcomes in their previous birth as reported by previous authors [26]. Previous studies also have shown that women who experience pregnancy loss or poor pregnancy outcome tends to go for next pregnancy after a short time to replace the previous pregnancy loss in order to achieve the desired family size, i.e. selective fertility or reproductive compensation [27‐29]. This is an important challenge in reproductive epidemiology, as women who experienced poor outcomes are more likely to continue for the next pregnancy compared with those who had favourable birth outcomes. This results to overrepresentation of high risk group (women) in the subsequent pregnancies. Therefore, outcome of previous pregnancy is an important determinant for neonatal survival in the subsequent pregnancy including through shortening of the birth interval, it also influences the length of interval between pregnancies. The increased neonatal mortality among infants in the second birth order and among women with short birth interval could be explained by the effect of selective fertility.
Previous studies have showed that women who experienced preterm birth, delivery of low birth weight infants and neonatal death in their first pregnancy are more likely to have similar adverse outcome in subsequent pregnancies [26, 30]. Since all these factors are associated with increased risk of neonatal death especially in young maternal age, the observed high risk of neonatal mortality in our study may in part be explained by recurrence of these factors in successive pregnancies [31].
In the present study, short birth interval was associated with increased risk of neonatal death compared with long birth interval [9, 10]. It is generally accepted that if closely spaced births were delayed, particularly in countries where mortality and fertility are still high, child mortality levels would fall [29]. Birth intervals increase mortality of children in two ways: Children born after a short interval are likely to have mothers in poor health, and such children tend to have low birth weight and increased chances of neonatal mortality [30]. On the other hand, women with short intervals between two pregnancies have insufficient time to restore their nutritional reserves, a situation which is thought to adversely affect fetal growth and thereby increases risk of neonatal deaths.
Our study also showed that a mother with no partner at the time of birth had increased risk of neonatal death as compared to her counterpart who had a partner co-resident. Our findings are consistent with previous studies that assessed the impact of father’s involvement on child development, functioning and quality of life [32, 33]. Evidence from the previous studies indicated that mothers with partner were more likely to provide their children with a healthy environment and nutritious food than mothers without partner, even when other conditions are similar [34, 35].
We also found that neonatal mortality was higher for male newborns than females. Our results are in agreement with other studies that showed males had a higher odds of dying than females during the first month of life [36‐39]. This increased hazard for newborn males may also be due to the large proportions of neonatal deaths occurring in the first week of life, which is the time when gender differences in neonatal mortality are most pronounced [36]. Biological factors that have been implicated with this increased risk of neonatal death in male infants include immunodeficiency [38] increasing the risks of infectious diseases in males, late maturity [36] resulting in a high prevalence of respiratory diseases in males, and congenital malformations of the urogenital system. Also higher mean birth weight in males as compared to females [39], which leads to more difficult births and more asphyxia and birth trauma, leading to higher neonatal mortality.
We found no evidence to suggest that delivery in health facilities is protective to the newborns. This observation concurs with a previous study in the same area [40] but is contrary to the expected neonatal survival gains conferred through institutional delivery [21]. In Tanzania, lack of safe delivery facilities, shortage of skilled providers as well basic equipment and supplies remain critical [41]. This situation is reflected in the observed high and slightly stable neonatal mortality rate despite some increase in the facility-based. Lack of adequate maternal and neonatal care at health facilities in time critical has been argued to be linked to deaths within the first day of life [42]. Findings from facility based studies in parts of north-eastern Tanzania that assessed unmet need for emergency obstetric care blamed poor quality of care for the negative maternal outcomes and high perinatal mortality [43]. Quality of delivery services and variations in newborn care practices were not included in these analyses but could affect the risk of neonatal deaths. A recent systematic review indicated that over three quartets of intrapartum-related deaths occurred in settings with weak health systems [44]. Scarcity of skilled providers, poor infrastructure and substandard quality of care are some of the critical components of such health systems that constrain progress in maternal and newborn survival [45].
Strengths and limitations
This study utilized huge datasets from Health and Demographic Surveillance System which are continuously registered vital demographic events in a geographical defined area. Large sample size provided our study with a sufficient power to provide accurate statistical analysis across sub groups in the study population. On the other hand, findings from Health and Demographic Surveillance Systems data provides information to policy makers and program manager which can be translated into policy and practice.
This study has some limitations that need to be considered in interpreting the findings. First, self-reporting of neonatal deaths may result to under estimation of true neonatal mortality due to underreporting particularly for deaths that happened within the first day of life. Secondly, misclassification of stillbirth and early neonatal death, the demarcation between intrapartum stillbirth and early neonatal death is problematic, this leads to potential overestimation of early neonatal death as some stillbirths are regarded as early neonatal. Third, there are other possible factors associated with neonatal survival that were not available in the HDSS dataset, such as environmental, genetic factors, gestational age and birth weight.
Conclusion
This study revealed that delayed maternal age at birth, presence of mother’s partner, birth order and birth interval are important factors which have an impact on neonatal mortality. These factors are amenable for strategy to promote and improve neonatal health and survival. Teenagers should access reproductive health information and services along with appropriate support to avoid early pregnancies. Women at high risk during first or second pregnancies need specialized care to reduce avoidable neonatal deaths. Sexual and reproductive health education programs should also promote use of family planning methods to enable women adhere to recommended birth interval and avoid unwanted pregnancies, increased age at marriage; and women empowerment in order to have control over their health. On the other hand, public health interventions directed at reducing neonatal death should address community, household and individual level factors such as birth interval, birth order and mother’s age that significantly influence neonatal mortality in Tanzania.
Acknowledgements
We are thankful to the members of staff at the Ifakara HDSS and to all field enumerators who collected data for the HDSS. We are grateful to the INDEPTH-Network for its continued support to the Ifakara HDSS.
This article is published under license to BioMed Central Ltd. This is an Open Access article distributed under the terms of the Creative Commons Attribution License (http://creativecommons.org/licenses/by/2.0), which permits unrestricted use, distribution, and reproduction in any medium, provided the original work is properly credited.
Competing interests
The authors declare that they have no competing interests.
Authors’ contributions
MS conceived the study idea, designed the study, carried out the statistical analyses, interpretation of the results, and drafted the manuscript. MA, SM, AS, DK, AM and RN participated in the design of the study, reviewed the manuscript. MJM provided technical support for interpreting results and reviewed it for intellectual content. MA was a coordinator of Ifakara Demographic Surveillance system during the study period. All authors read and approved the final manuscript.
The effect of mother’s age and other related factors on neonatal survival associated with first and second birth in rural, Tanzania: evidence from Ifakara health and demographic surveillance system in rural Tanzania
verfasst von
Majige Selemani Mathew A Mwanyangala Sigilbert Mrema Amri Shamte Dan Kajungu Abdallah Mkopi Michael Johnson Mahande Rose Nathan
Laser- und Lichtbehandlungen können bei Frauen mit polyzystischem Ovarialsyndrom (PCOS) den übermäßigen Haarwuchs verringern und das Wohlbefinden verbessern – bei alleiniger Anwendung oder in Kombination mit Medikamenten.
Müssen sich Schwangere einer Krebstherapie unterziehen, rufen Immuncheckpointinhibitoren offenbar nicht mehr unerwünschte Wirkungen hervor als andere Mittel gegen Krebs.
Durch die Häufung nach der COVID-19-Pandemie sind Infektionen mit dem Respiratorischen Synzytial-Virus (RSV) in den Fokus gerückt. Fachgesellschaften empfehlen eine Impfung inzwischen nicht nur für Säuglinge und Kleinkinder.
Update Gynäkologie
Bestellen Sie unseren Fach-Newsletter und bleiben Sie gut informiert – ganz bequem per eMail.