Many health providers and communicators who are concerned that patients will not understand numbers instead use verbal probabilities (e.g., terms such as “rare” or “common”) to convey the gist of a health message.
Objective
To assess patient interpretation of and preferences for verbal probability information in health contexts.
Methods
We conducted a systematic review of literature published through September 2020. Original studies conducted in English with samples representative of lay populations were included if they assessed health-related information and elicited either (a) numerical estimates of verbal probability terms or (b) preferences for verbal vs. quantitative risk information.
Results
We identified 33 original studies that referenced 145 verbal probability terms, 45 of which were included in at least two studies and 19 in three or more. Numerical interpretations of each verbal term were extremely variable. For example, average interpretations of the term “rare” ranged from 7 to 21%, and for “common,” the range was 34 to 71%. In a subset of 9 studies, lay estimates of verbal probability terms were far higher than the standard interpretations established by the European Commission for drug labels. In 10 of 12 samples where preferences were elicited, most participants preferred numerical information, alone or in combination with verbal labels.
Conclusion
Numerical interpretation of verbal probabilities is extremely variable and does not correspond well to the numerical probabilities established by expert panels. Most patients appear to prefer quantitative risk information, alone or in combination with verbal labels. Health professionals should be aware that avoiding numeric information to describe risks may not match patient preferences, and that patients interpret verbal risk terms in a highly variable way.
Springer Nature remains neutral with regard to jurisdictional claims in published maps and institutional affiliations.
INTRODUCTION
Although probabilities of risk and benefit are often important components of medical information, it is well established that many patients have low numeracy, which may impair their ability to understand or make decisions on the basis of numerical information.1‐5 As a result, healthcare providers may believe that patients will not be able to use numerical information or that they prefer words to numbers.6 In one survey, only about 35% of ob-gyns reported routinely using numbers when talking with patients about screening tests, with the remainder preferring verbal terms such as “low risk” or labels such as “normal/abnormal.”7 A different survey found that family physicians used numbers or quantitative graphics to describe cardiovascular risk in only 27% of patient visits; in the remainder of the visits, the physician used verbal risk terms only.8 Healthcare providers’ use of quantitative risk information (in the form of numbers or graphics) appears to be related to factors including their own numeracy, their perception of the patients’ numeracy, and the gender of both the provider and the patient.8,9
In non-medical domains, risk communication research has demonstrated that a major limitation of relying on verbal probability terms is that they are interpreted in highly variable ways by the recipients of the information.10‐13 An additional source of uncertainty in verbal risk communication is that the speaker may choose different verbal probability terms according to their opinion and previous experiences, and this choice is likely to in turn influence the recipient’s judgment.14 One study found that choice of verbal terms is even influenced by politeness, so that polite speakers generally communicated lower risk magnitudes than less polite ones.15
Anzeige
However, extrapolating findings from non-medical contexts to medical ones may be problematic, given the domain-specific nature of risk perceptions and behaviors.10,16 We therefore consider it important to assess the impact of verbal probability expressions in medical and health contexts only. Also, in light of healthcare professionals’ persistent use of verbal-only risk communications, we believe it is important to clarify whether patients in fact prefer verbal descriptions of risk to numerical ones.
Therefore, the objective of this study was to review the existing literature to synthesize evidence on patient interpretation of and preference for verbal probabilities in health and medical communication.
METHODS
This study analyzed a subset of articles from a large systematic review of experimental and quasi-experimental research contrasting different formats (numerical, graphical, and verbal) for presenting health-related quantitative information to the lay public. The review included both probabilities (such as health risks) and quantities (such as laboratory values and environmental data) and was limited to studies measuring quantitative outcomes including preference, comprehension, and decisions.
We performed the systematic review following the Preferred Reporting Items for Systematic Reviews and Meta-Analyses (PRISMA) statement (Fig. 1).17 In adherence to these guidelines, we registered a protocol in PROSPERO (registration #CRD42018086270). Two experienced librarians constructed a systematic approach to search Ovid MEDLINE, Ovid Embase, the Cochrane Library (Wiley), CINAHL (EBSCO), ERIC (ProQuest), PsycINFO (EBSCO), and the ACM Digital Library, from inception to January 2019, with an update on September 10, 2020. See Appendix 1 for the search strategy for Ovid MEDLINE. To supplement these results, we identified the top 4 most common journals from database searches (Medical Decision Making, Patient Education and Counseling, Risk Analysis, and Journal of Health Communication) and hand-searched their tables of contents in their entirety from 2008 up to 2019. For articles selected for inclusion in this study, we pulled and screened reference lists and citing articles from Scopus (Elsevier). Searches produced a total of 37,839 articles. After de-duplication, two independent reviewers screened 26,793 titles and abstracts using Covidence systematic review web software (Covidence.org, Melbourne, Australia). We then assessed 1500 articles for full-text review, with discrepancies resolved by consensus or third reviewer.
Figure 1
PRISMA flow diagram. *Other: duplicate dataset, no quantitative evaluation metric, insufficient detail to extract, not adults, experiments designed to understand beliefs not response to information, no full text available, test of education method, scale development/calibration, decision was not a personal health/medical decision, non-patient (health professional), comparator was different terms for cancer not different formats, verbal probabilities not in English.
×
Anzeige
Pairs of reviewers performed full-text review. A three-member verbal probabilities team (KA, EC, MP) reviewed all articles studying verbal probability terms such as “rare,” “common,” or “likely” (76 articles) and included publications meeting the following criteria:
1.
Original studies presenting participants with health-related information.
2.
Sample was adult laypeople without expertise in a health profession (the study was included if at least one subsample met these inclusion criteria and if the results for the subsample were reported separately).
3.
Quantitative assessments of outcomes included:
a.
Numerical estimates of the meaning of the verbal term, and/or
b.
Preferences for verbal vs numeric terms.
4.
Verbal probabilities expressed in English. (The larger review did not include a language restriction. However, for this analysis of verbal probabilities, we limited research to studies conducted in English to ensure that interpretations of the verbal terms would not be confounded by potential differences in translation.)
Three reviewers extracted data from the included articles using a custom-developed Qualtrics instrument. Data extracted included the main question or comparison, the outcomes measured (either numerical interpretation of the probability terms, preferences, or both), the sample size, and the population recruited. We captured details about the stimuli including the specific verbal terms studied; whether the probability was chance of disease, medication side effects, or adverse effects of a procedure; the general health condition or domain if specified; and the severity of the health event if specified, e.g., mild or severe.
In recording the outcome of numerical estimates of a verbal probability, we recorded sample sizes, mean estimates, ranges, and (where provided) either standard deviations or 95% confidence intervals. In the list of verbal terms, we did not distinguish between adjectival and adverbial forms (e.g., rare and rarely). A subset of studies examined the terms listed in the European Commission (EC) guidelines, which standardize the use of verbal probability terms to be used for medication side effects.18 (For example, these guidelines specify that the term “rare” is to be used for events with probabilities between 0.01 and 0.1%, and the term “very rare” for probabilities lower than < 0.01%.18) For these studies, we also recorded a “correct/incorrect” flag by whether respondents provided a numeric probability within the range specified by the EC for that term. In recording the outcome of preference, we recorded the proportions who reported preferring words, numbers, both, other, or no preference.
To pool the estimated probabilities from individual studies, we included only studies that reported either confidence intervals or standard deviations. We performed meta-analysis of single means, choosing a random effects model to account for heterogeneity that is due to both random error and potential systematic differences between studies.19 The inverse variance method was used for pooling study estimates,20 and the DerSimonian-Laird estimator of tau-squared (a measure of variance representing between-study heterogeneity) was used to adjust standard errors.21 For confidence intervals around tau-squared and tau, the Jackson method was used.22 Forest plots were generated of the individual study means and confidence intervals alongside the pooled random effects estimates. The meta-analysis and figures were generated using R version 4.0.5 and the “meta” package version 4.18-1.23,24
Risk of bias assessment is meant to capture the quality of each study and the likelihood of producing biased results. To assess risk of bias in this review, we adapted criteria from the AHRQ Methods Guide for Comparative Effectiveness Reviews and Cochrane Handbook for Systematic Reviews of Interventions.25,26 Pairs of team members scored each study on sample selection, randomization process, protocol deviations, measurement of covariates, missing data, and presence of other potential biases. Scoring conflicts were resolved in consensus meetings. The score was then classified as low, moderate, or high risk of bias.
RESULTS
As shown in Figure 1, the systematic literature search resulted in 406 studies in 4 subsets, focusing on verbal probabilities only, verbal and numerical probabilities, numbers and graphs only, and medication instructions. The current paper includes the first and second subsets: verbal probabilities only, and verbal versus numerical probabilities.
The final sample included 33 studies, which were published between 1967 and 2020 (Table 1). Of the studies, 14 were conducted in the UK, 12 in the USA, 5 in Australia, 1 in Canada, and 1 in Singapore. Fifteen focused on medication side effects, 14 on disease risks, and 4 with no specified context. Many studies provided little demographic information, with only 27 reporting participant gender, 25 age, 24 education, 5 ethnicity, and 4 socioeconomic status. Fourteen studies included actual patients, although primarily in hypothetical scenarios, while others recruited students, or members from the public (column 5 in Table 1). Most studies used relatively simple questionnaire study designs, and as a result most (64%, n = 21) had low or no risk of bias; 2 had high risk of bias.
Table 1
Articles on Verbal Probabilities and Characteristics Collected
To determine the perceived risk of surgical complication risk using verbal probability terms
Numerical estimates
290
Adult patients attending a pre-operative assessment in a clinic
Major adverse postoperative complication
No
No
No concern
*Several studies contained both subsamples that met our inclusion criteria (adult laypeople) and other subsamples that did not (physicians, adolescents). As described in the “METHODS” section, these studies were included if the results for the eligible subsample were reported separately. For these studies, we report the sample size and sample description of the subgroup that met our inclusion criteria
†EC = European Community
‡Graham et al. 2009 49 required respondents to choose from ordinal categories ranging from 1/100 to 1/10 000. The modal interpretation of “sometimes” was 1/100 (36% of women), “uncommon” 1/1000 (35%), “very uncommon” 1/10 000 (40%), “rare” 1/10 000 (58%) and “very rare” 1/10 000 (51%). Because of the categorical assessment and the fact that no larger numbers were provided to choose from, we did not average these results into the findings in Table 2.
Below, we present findings from the 2 subsets, which are not mutually exclusive: (1) 24 studies that elicited numerical estimates for verbal probability terms, including 9 focusing specifically on the EC terms (Table 2; Fig. 2), and (2) 11 studies (one of which contained 2 different samples) that assessed preferences for verbal versus quantitative risk information (Table 3).
Anzeige
Subset 1:
In 24 studies, numerical estimates were elicited for verbal probability terms. A total of 145 unique verbal probability terms were studied (Appendix 2). In some studies, the researchers also specified the severity of the event described by the verbal probability. We considered it likely that probability of mild outcome might be perceived differently than probability of a severe one. Therefore, we present these conditions separately, resulting in 14 unique probability-severity combinations (Table 2). Table 2 and Appendix 3 report pooled averages and ranges for 14 terms that were evaluated in at least three studies each and reported sufficient information for the meta-analysis. The term “rare” was estimated to mean a 10% risk, whereas the term “very likely” averaged 84%. Variability of interpretation of these terms was high, both across studies (minimum and maximum study averages reported in Table 2 column 5 and 6) and within study (ranges reported in column 7). For example, individuals estimated the term “rare” to mean anything from 0 to 80%, and “common” to mean anywhere between 10 and 100%. The effect of specifying the severity of the health event was modest. A “rare severe” event was judged slightly less likely than a “rare mild” event (10.1% versus 14.1% respectively), and a “common severe” event as slightly less likely than a “common mild” one (43.1% versus 50.5%). A subset of studies (9 indicated in Table 1) specifically examined interpretations of the EC probability labels. Meaningful summary data could not be generated for participant type (university student vs other adults) or information type (medication side effect vs procedure side effect vs disease risk) because samples in these subgroups were too small.
Table 2
Numeric Estimates of Verbal Probability Terms
Verbal probability term
Number of studies
Average numeric estimate, random effects model (%)
95% CI (%)
Minimum
sample average (%)*
Maximum
sample average (%)*
Range of individual estimates (%)†
Rare(ly)
7
10.00
[7.99, 12.01]
7.0
21
0–80
Rare-severe event
3
10.06
[5.45, 14.68]
6.3
34.8
–
Rare-mild event
3
14.14
[7.88, 20.40]
9.6
39.3
–
Uncommon
4
17.64
[13.19, 22.09]
13.3
22.9
0–90
Unlikely
6
17.71
[14.86, 20.55]
13.3
27
0–85
Common-severe event
3
43.08
[40.27, 45.88]
41.9
45.6
–
Possible(ly)
6
43.28
[36.66, 49.89]
36.9
62
–
Common-mild event
3
50.47
[45.59, 55.34]
48
58
–
Common
6
58.73
[50.40, 67.06]
34.2
70.5
10–100
Very common
3
60.10
[42.36, 77.85]
38.5
71.6
5–100
Probable(ly)
5
69.87
[67.07, 72.67]
66
73.9
20–100
Likely
6
71.87
[69.90, 73.84]
66
94
–
Usual(ly)
3
75.38
[71.53, 79.23]
72
78
–
Very likely
3
84.30
[79.43, 89.17]
75.2
93
20–100
Table includes terms studied in 3 or more studies in which sufficient information was reported for the meta-analysis
*All 19 studies reported an average estimate; minimum is the lowest of these averages, and maximum is the highest
†Only 4 studies reported ranges of estimates provided by individual participants within the study. This column reflects the range across all 4 studies
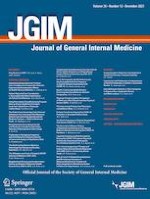
Figure 2
Average proportions misinterpreting European Commission (EC) risk labels across 2 studies. Legend: Among 2 large studies of EC verbal labels, including 1053 participants, an average of 70.1% misinterpreted the EC risk label. Rates of misinterpretation were similar whether the severity of the event was described or not, and if it was described, whether it was “mild” or “severe.” Misinterpretations were more common for more rare events, and there were only modest differences between interpretation of events described as “severe” versus “mild.”
Table 3
Numbers and Proportions Preferring Verbal or Numeric Probabilities
NA indicates that this option was not presented to respondents
*Kaplowitz et al. (2002)36 also evaluated format preference among cancer patients and survivors in a hypothetical choice between a verbal probability and a quantitative estimate of survival. However, the findings are not integrated into this table because the options were not mutually exclusive, and the authors do not clarify how many patients chose both. (Table 1 of that paper shows that 80% endorsed verbal probabilities and 53% endorsed quantitative information, suggesting that some subset must have chosen both)
×
In 2 of these studies, researchers additionally evaluated whether the participants misinterpreted the verbal probability term, defining misinterpretation as an estimate differing from the EC definition of the term (Fig. 2). As shown in Fig. 2, misinterpretation rates were higher for the terms indicating rare events, and there was relatively little difference between misinterpretation of the chances of mild events, severe events, and events of unspecified severity (Fig. 2).
Subset 2:
Anzeige
In 11 studies, participants’ preference for verbal versus numeric information was captured (one study contained 2 independently recruited samples for a total of 12 samples: Table 3). In 10 of the 12 samples, majorities (proportions ranging from 54 to 95%) preferred numeric risk information alone or in combination with verbal labels. In the 6 samples that had a choice between verbal, numeric, and combined formats, from 18 to 54% of respondents preferred the combination of numeric with verbal descriptions.
DISCUSSION
Since 1967, 33 studies have examined lay interpretation of and preferences for verbal probability terms such as “rare” and “common” in health and medical contexts. These studies show that lay peoples’ numeric interpretations of these verbal terms are extremely variable and highly overlapping. For example, across the studies, individual participants estimated the term “rare” at anywhere between 0 and 80% probability, and the term “common” at between 10 and 100% probability. In other words, these studies provide no assurance that patients will perceive a health outcome described as “common” as more likely than one described as “rare.” This suggests that providers and health communicators should provide numbers where possible, avoiding situations in which words alone are used to describe risk.
In addition, the subset of studies examining the European Commission (EC) verbal terminology for risk in drug labels shows that these terms are usually misinterpreted and lead to numeric estimates far higher than the developers intended. For example, in the EC terminology, “rare” is intended to describe a risk between 0.1 and 0.01%, but the average lay interpretation was almost 10%, more than 100-fold higher. The EC term “common,” meant to describe a risk between 1 and 10%, was interpreted as an average of about 59%. It is clear that this verbal risk terminology is miscalibrated to lay perceptions, particularly for rare events. In particular, providers and health communicators who use the EC terms to describe chance of medication side effects should recognize that these terms are likely to vastly inflate perceptions of side effect risk.
The literature also suggests that majorities of patients prefer numeric risk information, alone or in combination with verbal labels. This finding suggests that healthcare professionals who choose verbal-only risk descriptors may not be meeting the preferences of their patients.
Anzeige
Overall, findings of these studies about health and medical risk communication are congruent with risk communication research in non-medical domains, which has similarly outlined the variability in interpretations of these terms.10‐13
One limitation of our study stems from the search approach. It was challenging to create a literature search strategy for this problem because of the ubiquity of terms such as “risk” in non-communication domains such as epidemiology. We ended up calibrating the search strategy fairly broadly, requiring manual review to narrow down eligible articles. We did not restrict the search to a specific date range, and it is possible that language interpretation has changed over time. Another limitation is in the completeness of the research studies included, many of which did not provide details of demographics. We are therefore unable to draw conclusions from this review about the effects of education level, literacy, numeracy, socioeconomic status, race, or ethnicity on interpretations and information preferences. Other research has demonstrated that preference for numeric information is stronger among those with higher education or numeracy, and that individuals with lower levels of numeracy may express less comfort with numeric risk information.59 In addition, it is likely that numeracy would influence patients’ ability to assign a numeric probability to a verbal term.3,60 In focusing on the contrast between verbal and numeric risk information, we did not examine the vast literature on visualization and risk communication.
In summary, a systematic review of the literature provides strong evidence that patient interpretations of verbal probability terms are so variable that they may not distinguish between events of very different likelihoods. The evidence also suggests that most patients prefer numeric information about risks, either alone or in combination with verbal labels. These findings suggest that health professionals who avoid numbers by providing verbal probabilities alone are likely to have poor communication with their patients. Physicians and other healthcare professionals can improve the effectiveness of their communication with patients by providing accurate quantitative information about health risks.
Acknowledgements
This study was funded by the National Library of Medicine (R01 LM012964, PI Ancker). The authors gratefully acknowledge the discussion and input by the Making Numbers Meaningful Numeracy Expert Panel.
Declarations
Conflict of Interest
All authors report they had no competing interests to declare.
Open Access This article is licensed under a Creative Commons Attribution 4.0 International License, which permits use, sharing, adaptation, distribution and reproduction in any medium or format, as long as you give appropriate credit to the original author(s) and the source, provide a link to the Creative Commons licence, and indicate if changes were made. The images or other third party material in this article are included in the article's Creative Commons licence, unless indicated otherwise in a credit line to the material. If material is not included in the article's Creative Commons licence and your intended use is not permitted by statutory regulation or exceeds the permitted use, you will need to obtain permission directly from the copyright holder. To view a copy of this licence, visit http://creativecommons.org/licenses/by/4.0/.
Publisher’s Note
Springer Nature remains neutral with regard to jurisdictional claims in published maps and institutional affiliations.
Mit e.Med Innere Medizin erhalten Sie Zugang zu CME-Fortbildungen des Fachgebietes Innere Medizin, den Premium-Inhalten der internistischen Fachzeitschriften, inklusive einer gedruckten internistischen Zeitschrift Ihrer Wahl.
Mit e.Med Allgemeinmedizin erhalten Sie Zugang zu allen CME-Fortbildungen und Premium-Inhalten der allgemeinmedizinischen Zeitschriften, inklusive einer gedruckten Allgemeinmedizin-Zeitschrift Ihrer Wahl.
Imprecision and Preferences in Interpretation of Verbal Probabilities in Health: a Systematic Review
verfasst von
Katerina Andreadis, MS Ethan Chan, PharmD, MS Minha Park, MS Natalie C Benda, PhD Mohit M Sharma, MPH Michelle Demetres, MS Diana Delgado, MLS Elizabeth Sigworth, BA Qingxia Chen, PhD Andrew Liu, BS Lisa Grossman Liu, MPhil Marianne Sharko, MD, MS Brian J Zikmund-Fisher, PhD Jessica S Ancker, MPH, PhD
Immunchemischer Stuhltest positiv, Koloskopie negativ – in solchen Fällen kann die Blutungsquelle auch weiter proximal sitzen. Ein Forschungsteam hat nachgesehen, wie häufig und in welchen Lokalisationen das der Fall ist.
Möglicherweise hängt es von der Art der Diabetesmedikamente ab, wie hoch das Risiko der Betroffenen ist, dass sich sehkraftgefährdende Komplikationen verschlimmern.
In der MONARCHE-3-Studie lebten Frauen mit fortgeschrittenem Hormonrezeptor-positivem, HER2-negativem Brustkrebs länger, wenn sie zusätzlich zu einem nicht steroidalen Aromatasehemmer mit Abemaciclib behandelt wurden; allerdings verfehlte der numerische Zugewinn die statistische Signifikanz.
Welchen Nutzen es trägt, wenn die Strahlentherapie nach radikaler Prostatektomie um eine Androgendeprivation ergänzt wird, hat die RADICALS-HD-Studie untersucht. Nun liegen die Ergebnisse vor. Sie sprechen für länger dauernden Hormonentzug.
Update Innere Medizin
Bestellen Sie unseren Fach-Newsletter und bleiben Sie gut informiert.